Article

The Effects of Different Plant Configuration Modes on Soil Organic Carbon Fractions in the Lakeshore of Hongze Lake

Co-Innovation Center for Sustainable Forestry in Southern China, Nanjing Forestry University, Nanjing 210037, China
*
Author to whom correspondence should be addressed.
Forests 2025, 16(4), 611; https://doi.org/10.3390/f16040611
Submission received: 23 February 2025 / Revised: 24 March 2025 / Accepted: 28 March 2025 / Published: 30 March 2025
(This article belongs to the Special Issue Soil Carbon Storage in Forests: Dynamics and Management)

Abstract

:
The effects of plant configuration modes on soil organic carbon fractions are mainly reflected in plant species, root structure, apoplastic input, and microbial activity, and different plant configuration modes affect the accumulation and stability of soil organic carbon by changing the input and decomposition processes of organic matter. Considering the common use of local species in ecological restoration and their diverse ecological functions, we selected five different plant configuration modes in the lakeshore zone of Hongze Lake (Metasequoia glyptostroboides-Amorpha fruticosa L. (M-Af), Metasequoia glyptostroboides-Acorus calamus L. (M-Ac), Salix babylonica L.-Amorpha fruticosa L. (S-Af), Magnolia grandiflora L.-Nandina domestica Thunb. (Mg-N), and Pterocarya stenoptera C. DC.-Nandina domestica Thunb. (P-N)) in this study. The objective of the present study was to analyze the carbon content in the vegetation, the content of soil organic carbon and its components in the understorey, and the activity of the soil carbon pool and their interrelationships under different plant configuration modes in the lakeshore zone of Hongze Lake to reveal the dynamic change law in the carbon pool under different plant configuration modes. The findings demonstrated that within the Metasequoia glyptostroboides mode, M-Ac exhibited notable benefits in accumulating soil organic carbon and enhancing the stability of carbon fractions. The soil organic carbon (SOC) content was recorded at 3.93 g·kg−1, the total carbon (TC) content at 4.73 g·kg−1, and the mineral-associated organic carbon (MAOC) content of 2.20 g·kg−1 in the soil layer of 0–20 cm, which were 23.4%–71.6%, 9%–24.5%, and 18.9%–54.3% (p < 0.05), respectively, and were higher than the other configuration modes. Regarding the percentage of inactive carbon (NLC/SOC), the corresponding values for M-Ac and M-Af were 74.21% and 70.33%, respectively, which were significantly higher than the other modes. Redundancy analysis further showed that the soil whole carbon and arbor layer branch carbon content were the pivotal factors driving the accumulation of soil organic carbon fractions (with a cumulative explanation of 71.26%). This study has the potential to provide a theoretical basis and practical reference for optimizing plant allocation and enhancing the carbon sink function in the ecological restoration of the lakeshore zone.

1. Introduction

In the global carbon cycle, wetland ecosystems, as transitional ecosystems between terrestrial and aquatic systems, can promote the rapid cycling and transformation of various elements in the environment at the interface between land and water [1] and play an essential role in the cycling of soil nutrients and regulating the global carbon cycle. However, with the influence of global climate change and human activities, the change in soil organic carbon turnover in wetland ecosystems triggers a shift in carbon sources/sinks. The accelerated decomposition of soil organic carbon may lead to the transformation of wetlands from carbon sinks to carbon sources, increasing greenhouse gas emissions and exacerbating global climate change, whereas the increased stability of soil organic carbon will help wetlands continue to serve as carbon sinks and mitigate climate change. The effects of wetland vegetation types on soil organic carbon turnover and stability and their mechanisms have become a hot research topic [2,3].
As a characterization of soil organic carbon turnover processes, soil organic carbon pools are more complex in their composition but can be divided into active and inert organic carbon based on their stability [4,5]. Reactive organic carbon includes soil reactive oxidized carbon (ROC), dissolved organic carbon (DOC), and particulate organic carbon (POC) [6]. These components are fast-moving and easily decomposed in the soil, significantly affecting surface plants and soil microorganisms. Zhang et al. [7] showed that the content of soil DOC was in the order of wetland > plantation forest > farmland under different land uses. Ji et al. [8] showed that the total organic carbon content in the surface soils of willow and poplar forests in the Hongze Lake wetland was higher (10.05 g·kg−1, 10.22 g·kg−1) than that of lakeside grassland and reedbed soils (7.63 g·kg−1, 4.64 g·kg−1). Xiao et al. [9] found that the average distribution ratio of soil DOC content in different wetland types was in the following order: chaparral wetland (0.53%) > chaparral + swamp willow wetland (0.41%) > reed wetland (0.37%) > hairy moss grass wetland (0.30%). The differences between the contents of soil organic carbon and its active fractions in the surface layer were observed between the different community zones [10]. With the changes in land use and cover type, organic matter input to the soil, biodegradation, and leaching processes were significantly altered, significantly affecting the production and degradation of soil reactive organic carbon (ROC). In contrast, recalcitrant organic carbon is the main component of the soil carbon pool, accounting for 50–70% of total organic carbon, mainly mineral-associated organic carbon (MAOC) [11]. This part of organic carbon is more stable and not easily decomposed by microorganisms, and its stability determines the ability of the soil to fix and reserve organic carbon. It has been shown that changes in vegetation type lead to changes in soil organic carbon (POC and MAOC) content for each particle-size fractionation [12]. Lai et al. [13] compared the POC and MAOC contents under coniferous forests and found that the contents in the broadleaved deciduous and mixed forests were higher. The differences in the distribution and stability of active and inert components in the soil organic carbon pool, as well as the role of vegetation types in regulating the dynamics of the carbon components, together determine the soil carbon turnover efficiency and long-term carbon sequestration potential, which provides a key scientific basis for in-depth analysis of the ecosystem carbon cycle mechanism.
In the past two decades, thanks to the promotion of six major forestry projects, China’s planted forest area, forest volume, and coverage rate have been growing continuously [14], resulting in a concomitant increase in forest carbon storage, which has become one of the essential sources of incremental carbon sinks globally [15,16,17], making a significant contribution to curbing global warming. However, with the continuous promotion of afforestation work in recent years, the land resources suitable for forest growth are gradually decreasing, resulting in the carbon sinks formed by China’s new afforestation being limited by the quality of afforestation land [18]. At the same time, most planted forests are dominated by monoculture pure forests, which usually have lower biodiversity conservation, carbon sink, and ecosystem stability functions compared to mixed forests. Studies have shown that increased carbon sequestration from afforestation will gradually decrease after 2050 [19,20]. In this context, strengthening research on the formation and transformation mechanisms of soil organic carbon, carbon storage capacity, and carbon sink potential and developing management techniques to increase the sinks of different tree species and forest types will become the key direction to increase carbon sinks in the future [21,22]. Appropriately increasing tree species richness through the optimal allocation of specific functional tree species is key to enhancing forest carbon storage in forest ecosystems while considering production and operation costs. Therefore, it is of great significance for the scientific management of soil carbon pools in forest ecosystems to conduct an in-depth exploration of the effects of different vegetation configuration patterns on SOC content and their sequestration mechanisms, as well as an accurate assessment of SOC stocks and their trends at the regional scale.
Hongze Lake is the fourth-largest freshwater lake in China. It is located in the lower reaches of the Huaihe River in the western part of Jiangsu Province and has important functions for flood control, irrigation, water transfer, and water transport. In recent years, the influence of the South-to-North Water Diversion Project for flood storage and irrigation has made Hongze Lake show a unique anti-seasonal water level characteristic of ‘low water level in summer and high water level in winter’, which significantly affects the mineralization rate and the storage pattern of organic carbon in the lake sediment, which has a far-reaching impact on the regional carbon cycle process. In recent years, with the further expansion of anthropogenic production activities [23], the area of natural wetlands in the region has been drastically reduced, the natural succession of plant communities has been subjected to anthropogenic interference, the fragmentation of wetland landscapes has increased, and the loss of ecological functions has intensified [24]. Wetlands, particularly peatlands and swamps, are important carbon stores. When these wetlands are drained or degraded, CO2 and other greenhouse gases are released into the atmosphere in large quantities [25,26]. This reversal of carbon pools to sources has transformed the region from an important climate regulator to a hotspot for greenhouse gas emissions. In recent years, Jiangsu Province has implemented strict wetland protection measures in the Hongze Lake area to improve carbon sink capacity and promote carbon sequestration through ecological restoration and protection measures, and initial results have been achieved. According to Ji et al. [8], among the different vegetation types in the Hongze Lake area, poplar forests have the highest soil organic carbon content, which verifies that poplar trees play a vital role in ecological functions, such as wetland carbon sinks and the development of the forestry industry [27]. When the vegetation type changes, the physico-chemical characteristics of the soil organic carbon of each grain-size component will change [12,28]. Most of the current studies on Hongze Lake wetlands focus on the relationship between single plant communities and soil carbon cycling, and there are no studies on the soil organic carbon fraction of wetlands in the lakeshore zone under the conditions of different plant configuration modes, which need to be further addressed.
Based on this, this paper selects five different plant configuration modes (Metasequoia glyptostroboides-Amorpha fruticosa L. (M-Af), Metasequoia glyptostroboides-Acorus calamus L. (M-Ac), Salix babylonica L.-Amorpha fruticosa L. (S-Af), Magnolia grandiflora L.-Nandina domestica Thunb. (Mg-N), and Pterocarya stenoptera C. DC.-Nandina domestica Thunb. (P-N)) in the lakeshore zone of Hongze Lake, and analyses the carbon content in vegetation, soil organic carbon and its fractions, and soil carbon pool activity and their relationships under different configuration modes. The selected species encompass trees, shrubs, and herbaceous plants, each exhibiting distinct ecological functions. Through root exudates and litter decomposition, these species promote both surface carbon accumulation and deep carbon sequestration, thereby comprehensively reflecting the impact of plant configurations on soil carbon pools. Furthermore, these species are widely distributed in the lakeside zone of Hongze Lake and are commonly used in local ecological restoration and vegetation rehabilitation efforts, making them both typical and representative. The findings of this study can provide direct references for regional ecological management strategies. The purpose is to investigate the distribution characteristics and changing rules of SOC and its components among different plant configuration modes, to explore the response mechanism of SOC to plant configuration modes, and to deepen the understanding of the synergistic mechanism of ‘plant–soil–carbon’. It is expected to screen out the plant configuration mode with high carbon sequestration in the lakeshore zone, which will provide a scientific basis for improving the regional carbon sequestration capacity, optimizing ecological environment management, and promoting the ecological restoration of lakes.

2. Materials and Methods

2.1. Overview of the Study Area

As shown in Figure 1, the study area is located in the Guizui Wetland (33°34′20″ N, 118°36′56″ E) on the north shore of Hongze Lake, with a length of about 10.1 km. It is situated in the intertropical zone, between the warm temperate zone and subtropical zone, with an average annual temperature of 16.3 °C, average annual precipitation of 925.5 mm, a rainy season mainly in June–September, during which precipitation accounts for 65.5% of the year, evaporation of 1592.2 mm, and a frost-free period of 240 d. The soil type is yellow-brown loam (Ferri-Udic Argosols), and the pH is 6.28–7.07. The main vegetation types in the study area include: Metasequoia glyptostroboides, Salix babylonica L., Magnolia grandiflora L., and Pterocarya stenoptera C. DC., etc., and the main species in the lower layer are Nandina domestica Thunb., Amorpha fruticosa L., and Acorus calamus L. In recent years, under the influence of the South-to-North Water Diversion Project for flood storage and irrigation, the water level of Hongze Lake has changed significantly, maintaining a higher water level in winter, with an average storage level of 13.50 m. In comparison, the limiting water level in summer is 12.50 m, presenting a unique change in the water level being high in winter and low in summer [29].

2.2. Plot Setting and Sample Collection

Five different plant configuration modes (Metasequoia glyptostroboides-Amorpha fruticosa L. (M-Af), Metasequoia glyptostroboides-Acorus calamus L. (M-Ac), Salix babylonica L.-Amorpha fruticosa L. (S-Af), Magnolia grandiflora L.-Nandina domestica Thunb. (Mg-N), and Pterocarya stenoptera C. DC.-Nandina domestica Thunb. (P-N)) were selected to set up the research sample area in the study area, and three 20 m × 20 m standard sample plots were randomly set up in each sample area, with a total of 15 replicate sample plots. All investigated forest stands were artificially restored through planting, with a uniform stand age of 10 years, representing the intermediate stage of vegetation recovery.
Sampling was scheduled for the end of November 2023. Based on the dynamic characteristics of the water level changes in Hongze Lake, the water level gradually rises in November, and the lakeshore vegetation enters a submerged state. Under flooding stress, significant changes occur in plant root exudates and litter decomposition rates, which can effectively reflect the response mechanisms of the plant–soil carbon exchange processes to hydrological conditions. Therefore, sampling in November not only captures the critical impact of water level changes on the soil carbon pool but also provides important temporal node data for analyzing the seasonal regulation mechanisms of carbon sink functions in the lakeshore zone of Hongze Lake. In each sample plot, multiple sample points were collected repeatedly in the 0–20 cm, 20–40 cm, and 40–60 cm soil horizons using the S-shaped sampling method with a soil drill. The soil samples collected in the same plot were mixed into one sample and then placed in a self-sealing bag to be brought back to the laboratory after removing debris and plant residues. The cutting ring method determined the soil bulk weight, while the soil samples were dried naturally and sieved to determine the organic carbon fraction. The 20–40 cm and 40–60 cm soil samples were used only for the SOC determination.

2.3. Indicator Measurement

Readily oxidizable organic carbon (ROC) was determined using the KMnO4 oxidation method: air-dried soil samples were weighed, which were sieved through a 2-mm sieve and contained approximately 15 mg of carbon, to which 25 mL of KMnO4 solution at a concentration of 333 mmol/L was added, and then the samples were shaken for 30 min at room temperature, before being centrifuged for 5 min at 5000 r/min. The supernatant was diluted with distilled water at a ratio of 1250, and the absorbance values of the diluted samples were determined in the 565 nm range of the spectrophotometer.
Dissolved organic carbon(DOC): 10 g of air-dried soil samples, which had passed through a 2 mm sieve, were weighed, distilled water was added at a soil–water mass ratio of 1:2 and then shaken at a constant temperature for 1 h at 25 °C, and then filtration was performed using a membrane with a pore size of 0.45 μm, where the filtrate was passed through a TOC-1020A for determination.
Particulate organic carbon(POC), mineral associated organic carbon (MAOC): 10 g of air-dried soil samples, which had passed through a 2 mm sieve, were weighed, and 50 mL of (NaPO3)6 solution with a concentration of 5 g/L was added, followed by hand-shaking for 10 min and oscillation at a speed of 90 r/min for 18 h. The oscillated suspension was passed through a 0.053 mm sieve, and the organic carbon content in the material on and under the sieve was determined by using a soil carbon and nitrogen analyzer, respectively.
Soil organic carbon (SOC): measured by a soil carbon and nitrogen element analyzer after soil acidification (i.e., inorganic carbon in the soil was first removed by an HCl solution with a concentration of 0.5 mol/L, washed to neutrality with distilled water, air-dried, and ground for determination using the machine).
The soil organic carbon stock (SCS) was calculated as follows:
S C S i = 0.1 × S O C i × B D i × h i
In this equation, SCS is the soil organic carbon stock (t·ha−1), i denotes the different soil layers, BD is the soil bulk density (g·cm−3), and h is the thickness of the soil layer (cm).
The calculation for inert organic carbon (NLC) comes from the difference between SOC and ROC, i.e.,
N L C = S O C R O C
The soil organic carbon content sensitivity indicators were derived according to the following equation:
M i = ( I imax I imin ) / I imin
In this equation, M is the organic carbon content sensitivity indicator, I is the organic carbon content, and i is the different plant configuration mode.
The soil organic carbon fraction allocation ratio was calculated as follows:
D i = H i / SOC   ×   100 %
In this equation, M is the organic carbon content sensitivity indicator, I is the organic carbon content, and i is the different plant configuration mode.
The soil carbon pool activity (CPA) was calculated as follows:
C P A = R O C / N L C

2.4. Data Analysis

SPSS 20.0 software was used for one-way analysis of variance (ANOVA) and multiple comparisons (LSDs). The significance of differences in soil organic carbon and its fractions in different plant configuration modes was tested. Correlation analyses were performed using Pearson’s method, and redundancy analyses were performed using Canoco5 software. Origin 2021 software was used to make the graphs.

3. Results

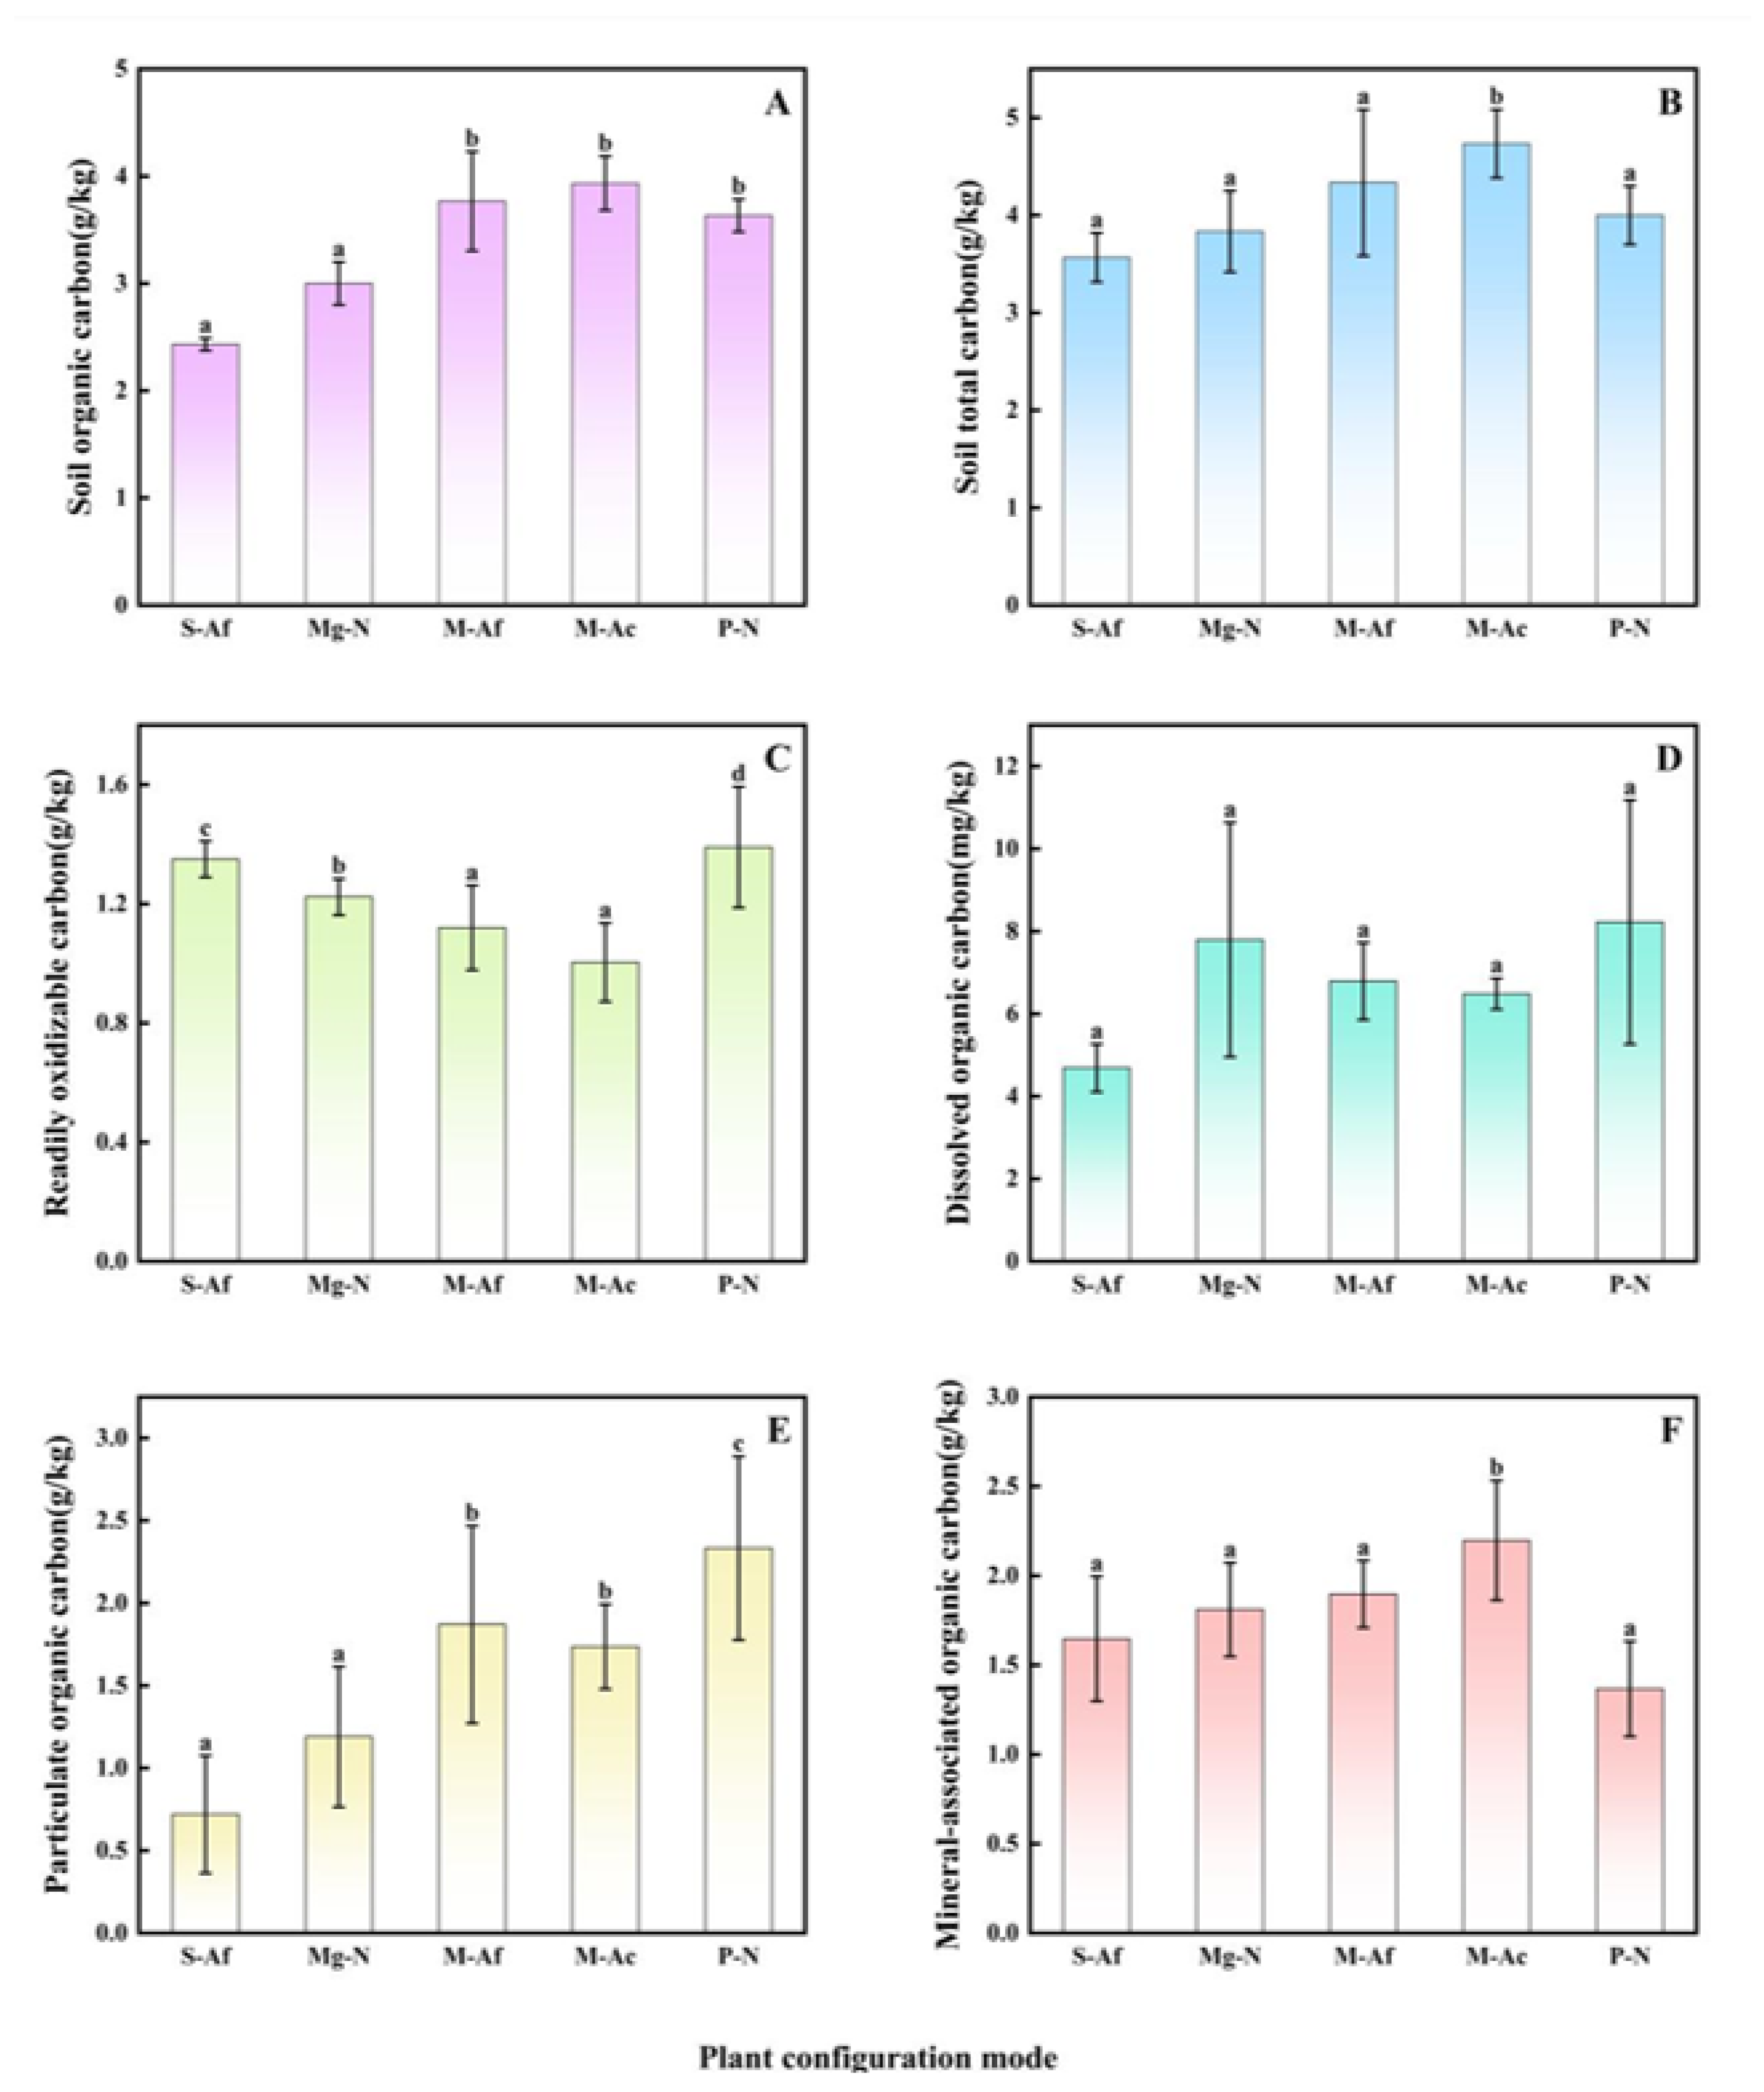
3.1. Soil Organic Carbon and Its Fraction Content in Different Plant Configuration Modes

As shown in Figure 2, the soil organic carbon content and carbon stock in all five plant configuration modes showed a gradual decrease with the deepening of the soil layer. In the three soil layers of 0–20 cm, 20–40 cm, and 40–60 cm, the SOC contents in the M-Af, M-Ac, and P-N modes were significantly higher than those in the S-Af and Mg-N modes (p < 0.05), with an average SOC content of 3.62 g·kg−1kg, 3.59 g·kg−1kg, and 3.67 g·kg−1kg in each soil layer, respectively. Among the three modes, the P-N mode was significantly lower than those in M-Af and M-Ac in the 20–40cm soil layer, which were 3.49 g·kg−1, 3.67 g·kg−1, and 3.69 g·kg−1, respectively. There was no significant difference between the other soil layers. The SOC contents in the three soil layers of S-Af and Mg-N were relatively low. There was a substantial difference between the two only in the 20–40 cm layer, with values of 2.3 g·kg−1 and 2.93 g·kg−1, respectively, and the differences in the other soil layers were insignificant.
As shown in Figure 2B, in the 0–20 cm soil layer, the soil organic carbon stocks (SCSs) in the M-Af, M-Ac, and P-N modes were significantly higher than those in the S-Af and Mg-N modes (p < 0.05), with values of 10.11 t·ha−1, 10.56 t·t·ha−1, and 9.53 t·ha−1, respectively. In contrast, for the 0–60 cm soil layer, only the M-Af and M-Ac modes exhibited significantly higher carbon stock accumulation compared to the other modes, with values of 28.52 t·ha−1 and 28.41 t·ha−1, respectively.
According to Figure 3, in the 0–20 cm soil layer, the SOC and TC contents showed similar patterns, with SOC contents of 3.77 g·kg−1 and 3.93 g·kg−1 and TC contents of 4.33 g·kg−1 and 4.73 g·kg−1 in M-Af and M-Ac, respectively, which were significantly higher than those in the other plant configuration modes (p < 0.05). On the other hand, the ROC content in S-Af and P-N was considerably higher (p < 0.05) than the other plant configuration modes, with values of 1.48 g·kg−1 and 1.49 g·kg−1, respectively. The DOC content in the five plant configuration modes did not differ significantly (p > 0.05) from each other, with a range of 469–822 mg·kg−1. The POC content in P-N was considerably higher (p < 0.05) than the other plant configuration modes at 2.33 g·kg−1, and the lowest was in S-Af at 0.79 g·kg−1, while the MAOC content was highest in M-Ac at 2.20 g·kg−1, and lowest in P-N at 1.37 g·kg−1.
Sensitivity analyses of the response of the soil organic carbon fraction content to plant configuration modes revealed that among the different SOC fractions, POC had the most pronounced response to changes in plant configuration modes (Table 1), which is suitable for use as a good indicator of the effect of changes in plant configuration modes on SOC. On the contrary, in the lakeshore zone, the response of ROC to changes in plant configuration modes was lagging, indicating that ROC plays a slower role in the dynamic changes in soil organic carbon and has a longer response time.

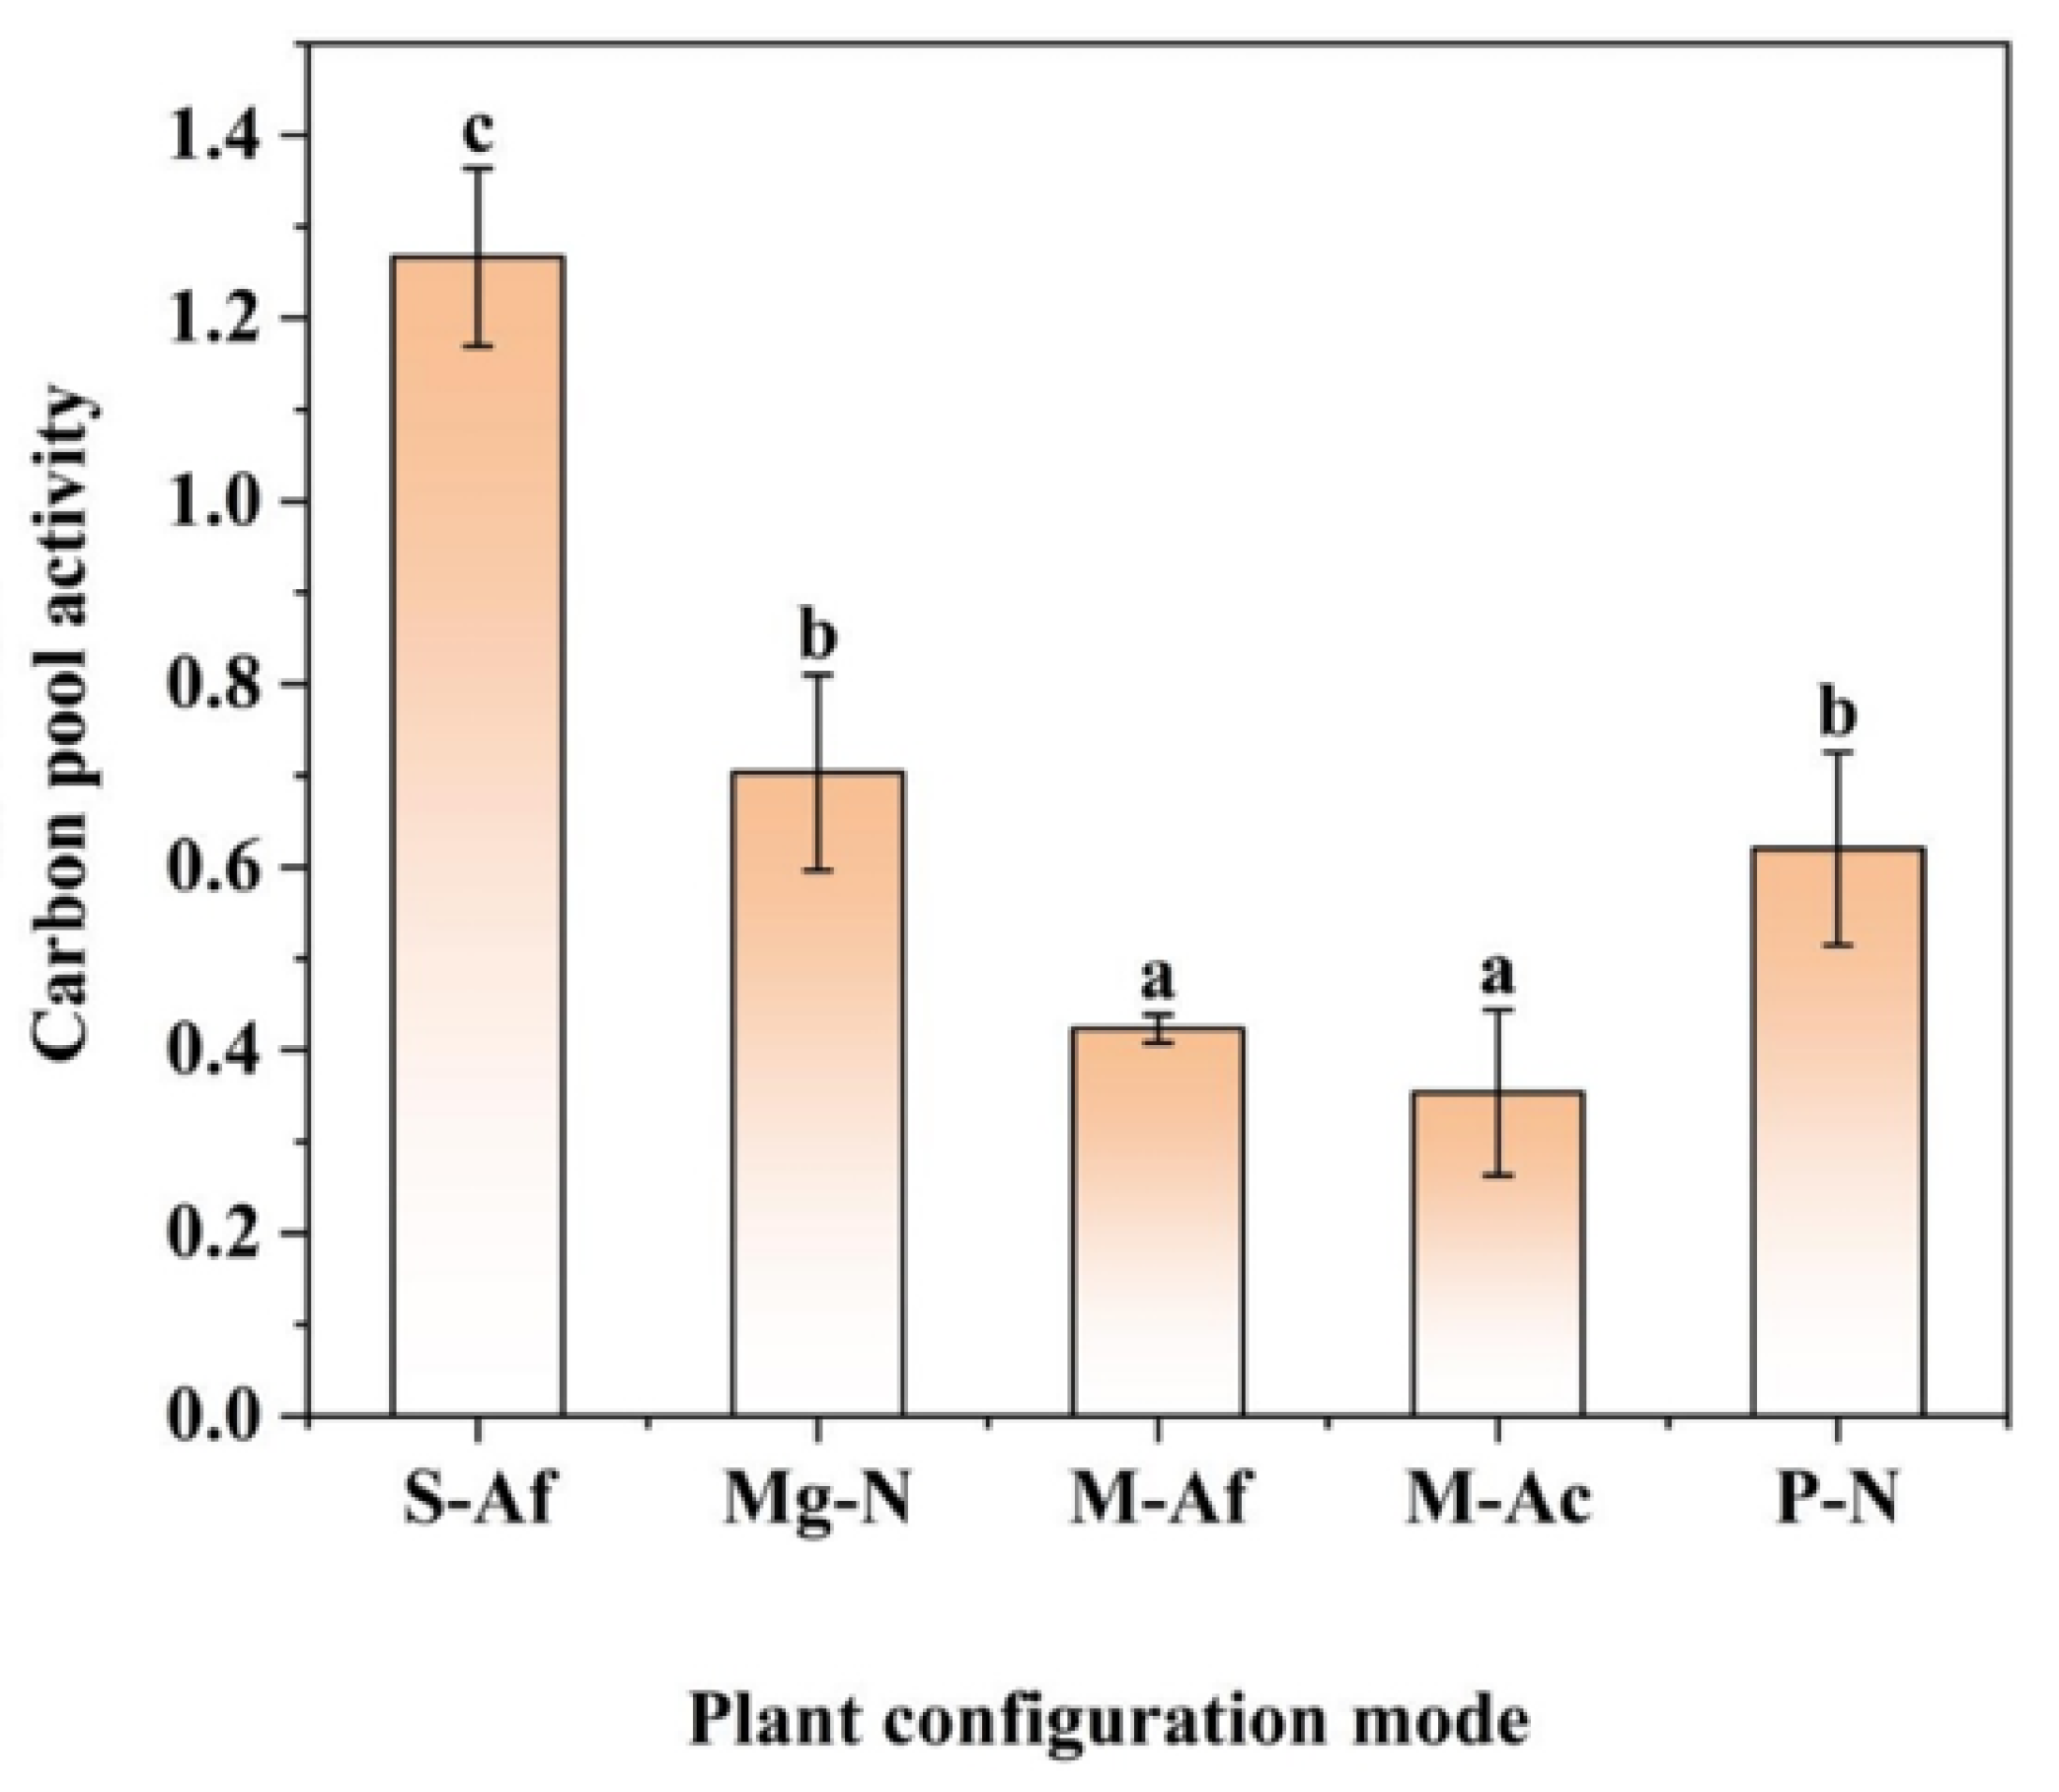
3.2. Characteristics of Soil Organic Carbon Fraction Ratios and Carbon Pool Activity for Different Plant Configuration Modes

In this study, it was found that ROC/SOC ranged from 25.79% to 55.90%, DOC/SOC ranged from 0.17% to 0.25%, POC/SOC ranged from 32.57% to 58.53%, MAOC/SOC ranged from 35.71% to 67.53%, and NLC/SOC ranged from 44.10% to 74.21% (Table 2). In this experiment, DOC had the lowest average ratio. Among the five plant configuration modes, ROC/SOC in S-Af was significantly higher than the other plant configuration modes (p < 0.05). Unlike ROC/SOC, there was no significant difference (p > 0.05) in DOC/SOC and POC/SOC among the five plant configuration modes. In addition, the MAOC/SOC in S-Af and Mg-N were significantly higher than other plant configuration modes, the weight of NLC/SOC ranged from 44.10% to 74.21%, and the NLC/SOC in M-Af and M-Ac were significantly higher than in the other configuration modes (p < 0.05), which indicated that these two modes had a more significant proportion of inactive carbon.
Different types of organic carbon components have different stability and activity in the soil, affecting the carbon pools’ activity characteristics, so the carbon pool activities under different plant configuration modes were further analyzed. As shown in Figure 4, the differences in carbon pool activity in different plant configuration modes were more apparent, and the carbon pool activities in M-Af and M-Ac were lower in all configuration modes, especially in the S-Af mode, which was significantly higher than the other modes (p < 0.05).

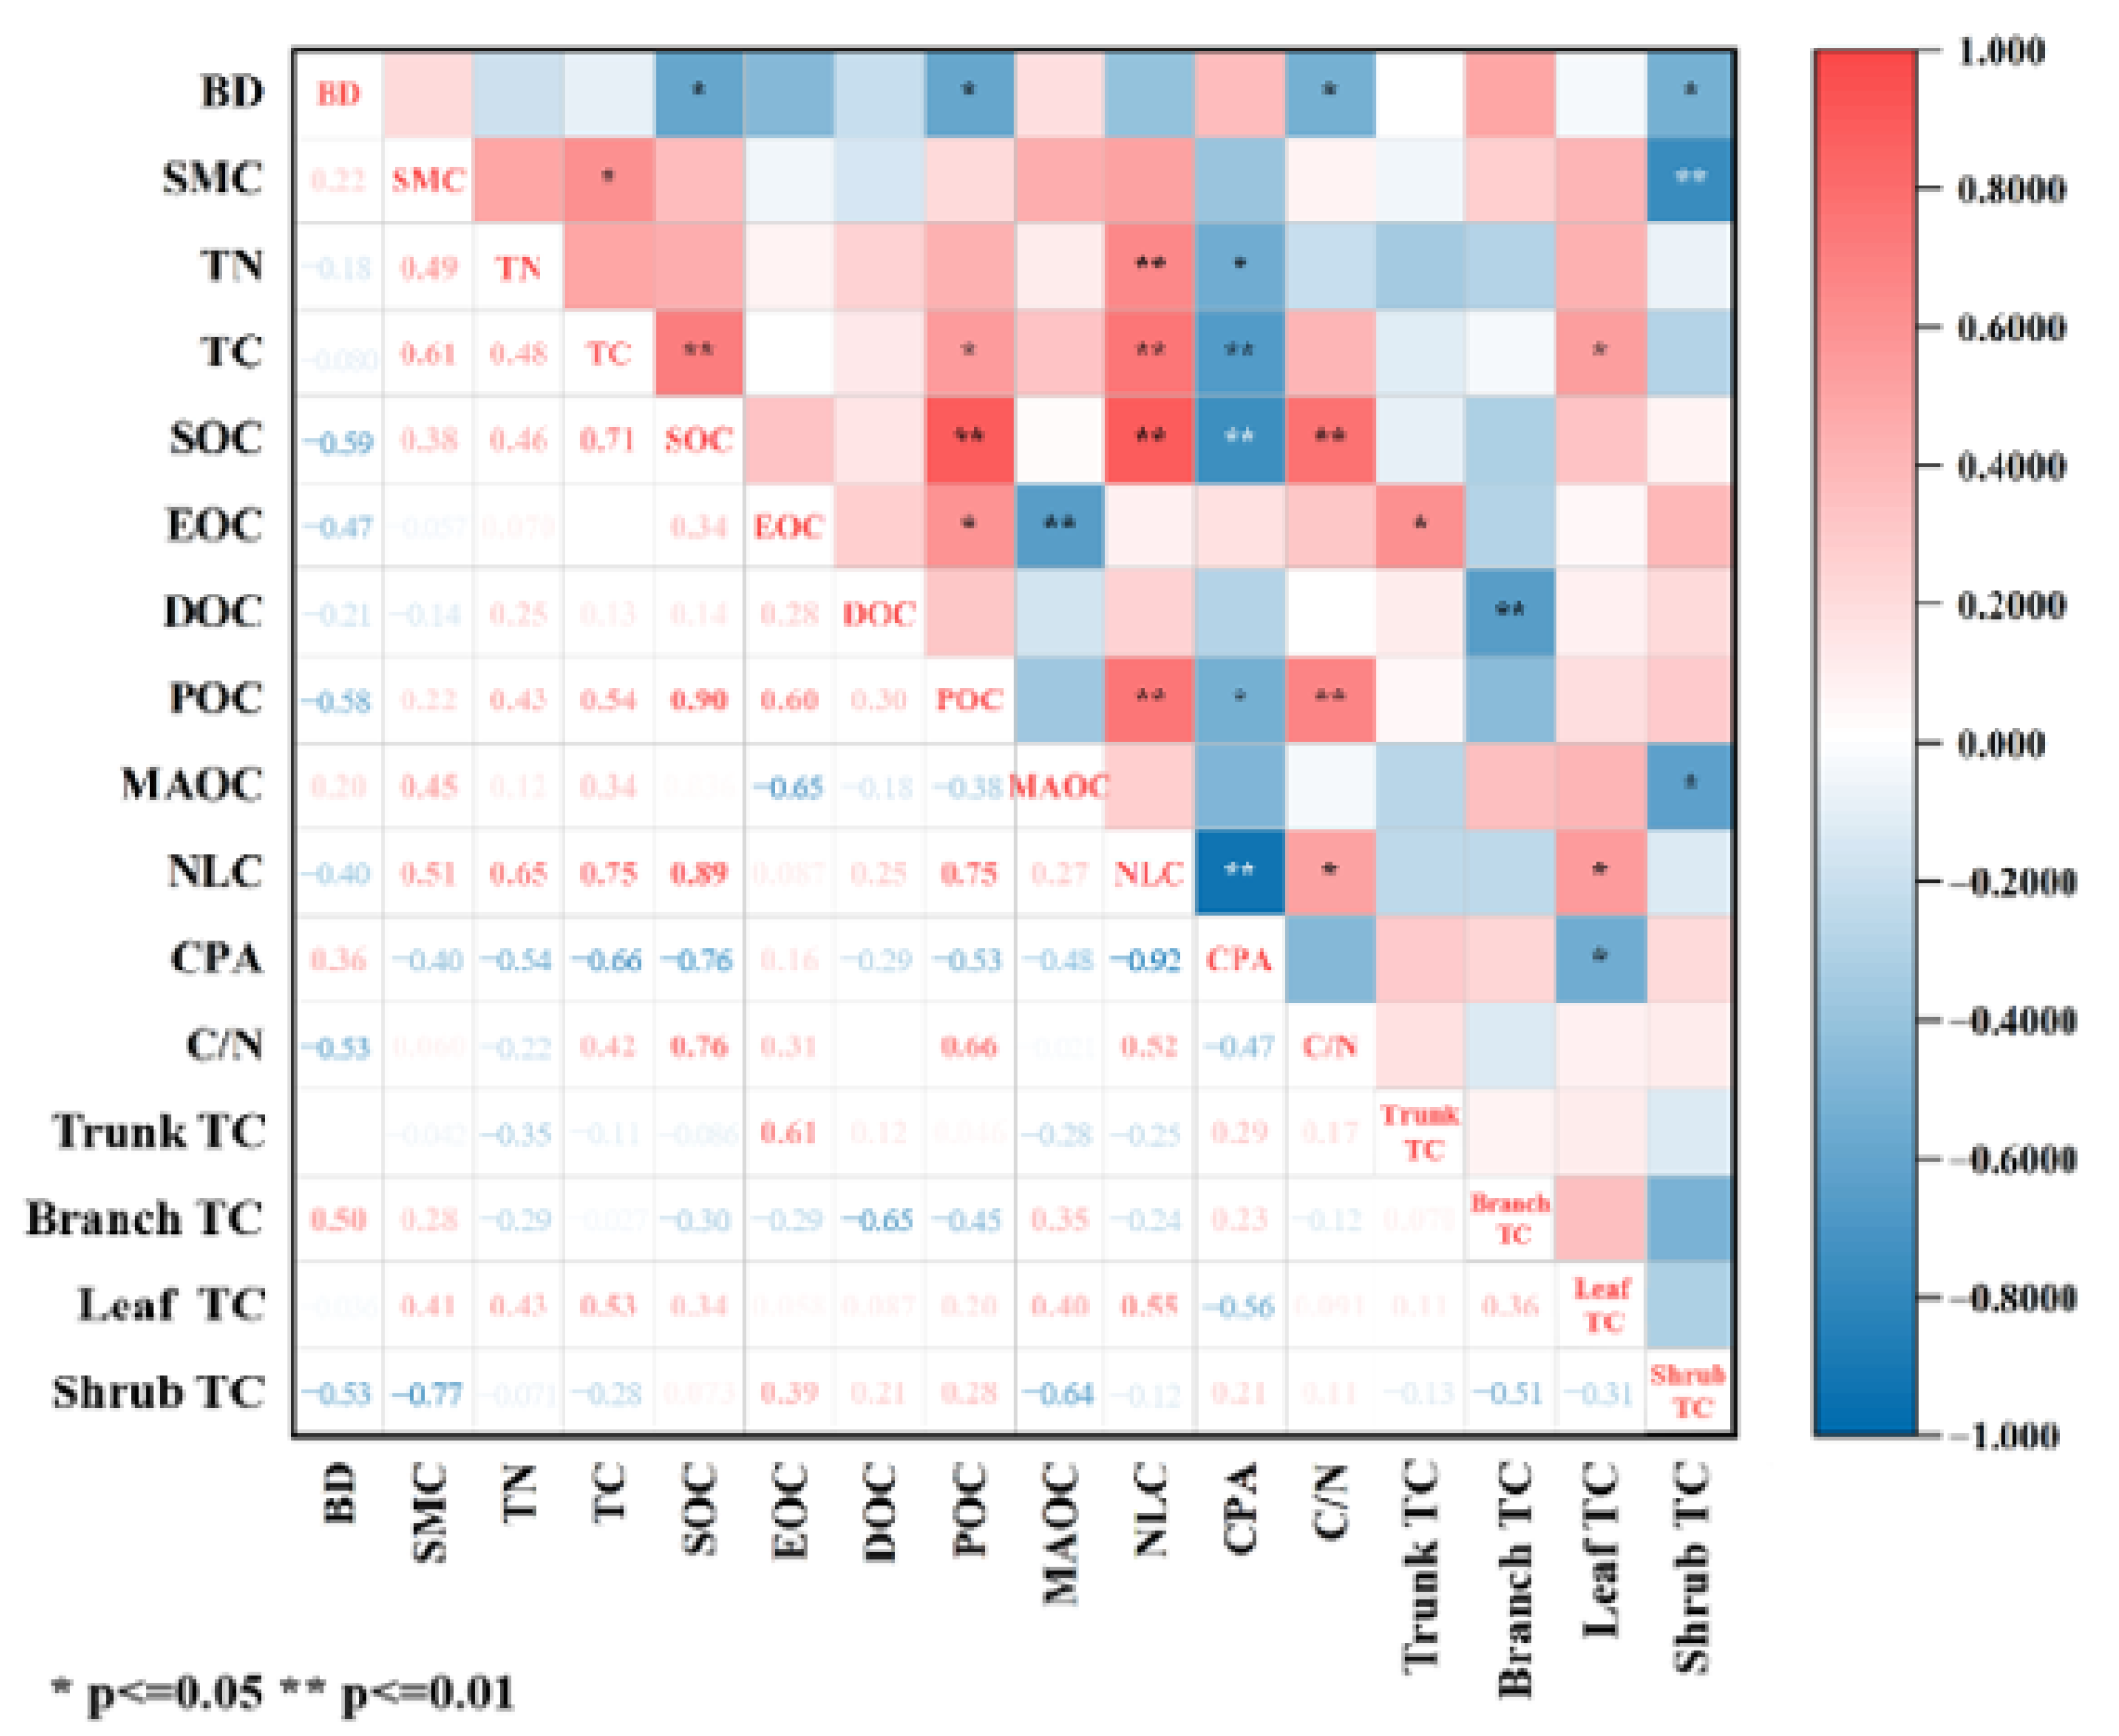
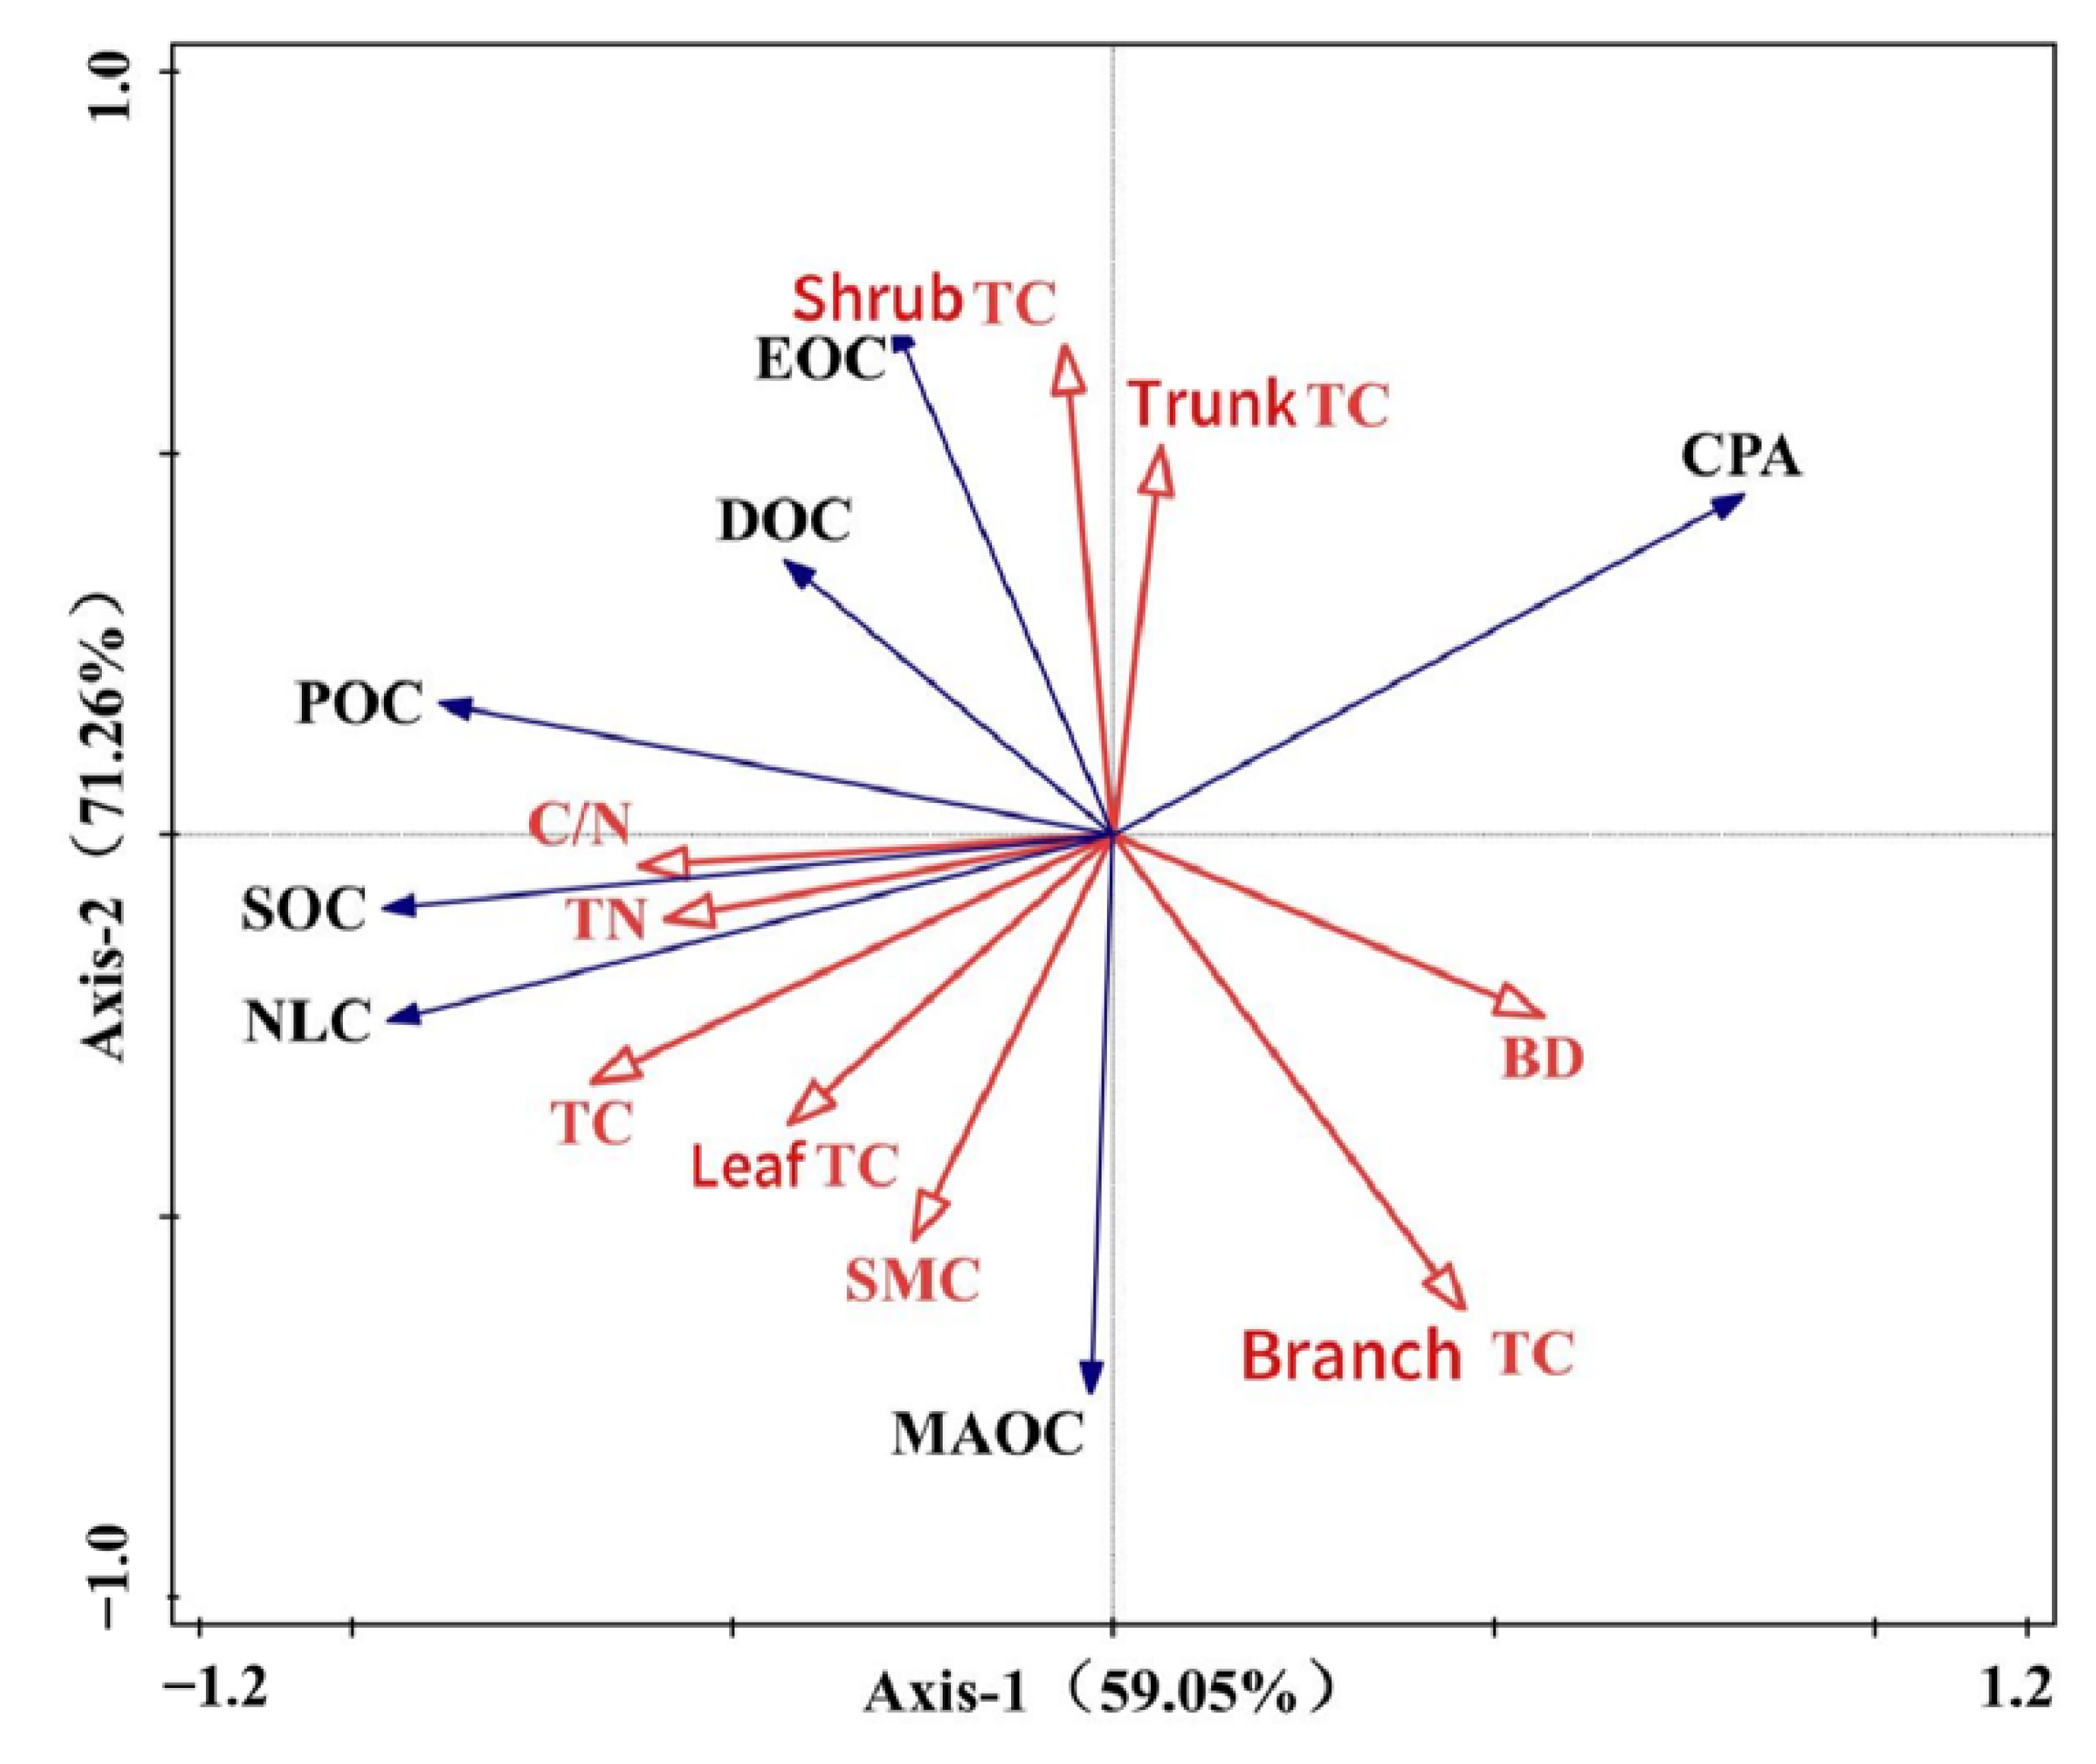
3.3. Relationships Between Soil Organic Carbon Fractions, Carbon Pool Activity, Soil Physical and Chemical Properties, and Vegetation Carbon Content

According to Figure 5, the SOC content was highly significant and positively correlated with the MAOC and NLC contents. ROC was essential and negatively correlated with MAOC (p < 0.01) and significantly positively correlated with the POC and trunk TC contents (p < 0.05). DOC was highly significant and negatively correlated with the twig TC content (p < 0.01), POC was essential and positively correlated with NLC and C/N (p < 0.01), and NLC was highly significantly negatively correlated with CPA (p < 0.01). The SOC, POC, C/N, and herbaceous TC contents were significantly negatively correlated with BD (p < 0.05). TC was significantly positively correlated with SMC (p < 0.05), while the herbaceous TC content was highly significantly negatively correlated with SMC (p < 0.01). NLC was highly significantly positively correlated with the TN content (p < 0.01), and CPA was significantly and negatively correlated with the TN content (p < 0.05). The SOC and NLC contents were highly significantly and positively correlated with the TN content (p < 0.01), POC was significantly and positively correlated with the TC content (p < 0.05), and CPA was highly and significantly and negatively correlated with the soil TC content (p < 0.01).
The redundancy analysis of soil organic carbon fractions and their contents in each layer of vegetation, based on the BD, pH, TN, TP, C/N, and vegetation carbon contents, showed that (Table 3) the nine factors in the first two sorting axes cumulatively explained 71.26% of the characteristics of soil organic carbon fractions and their contents in each layer of vegetation and the cumulative explanation of the relationship between the two factors amounted to 84.50%. It can be seen that the first two sorting axes of the redundancy analysis can well reflect the relationship between the accumulation of soil organic carbon fractions and their components, the physical and chemical properties of the soil, and the carbon content in the vegetation, with the I axis mainly determining this. The first two sorting axes were plotted to obtain the redundancy analysis sorting map (Figure 6). The results showed that the three factors, TC, branch TC, and shrub TC, significantly affected soil organic carbon fractions and the accumulation of their components.
Further Monte-Carlo testing of the nine factors showed that the order of importance of the nine factors was as follows: TC > branch TC > BD > TN > leaf TC > shrub TC > C/N > trunk TC > SMC, among which the TC and branch TC contents were significantly positively correlated with the accumulation of soil organic carbon fractions and contents in their components (p < 0.05).

4. Discussions

4.1. Soil Total Organic Carbon Distribution in Response to Plant Configuration Modes

This study found that differences in plant configuration modes significantly affected the vertical distribution and accumulation characteristics of SOC. In particular, among the different plant configuration modes, the SOC content in each soil layer in M-Af and M-Ac was significantly (p < 0.05) higher than that in the other configuration modes (Figure 2). In terms of vertical change, the SOC content in each plant configuration mode showed an overall trend of decreasing with increasing soil depth. This idea was also verified by Lehmann et al. [30]. This is because root secretions promote the excitation effect of the mineralization and decomposition of pre-existing organic carbon in the soil, reducing the deep soil carbon [31,32]. Secondly, the soil surface has better aeration conditions, which are favorable for the growth of microorganisms, etc., and vegetation litter accumulates on the soil surface, which makes the SOC content highest on the soil surface. In the surface (0–20 cm) soil, the SOC contents in M-Af, M-Ac, and P-N were significantly higher than those in S-Af and Mg-N (p < 0.05). This result may be related to the differences in plant root distribution and litterfall input: deep-rooted trees, such as Metasequoia glyptostroboides and Pterocarya stenoptera C. DC., were more likely to promote deep soil carbon accumulation [33], while Amorpha fruticosa L. and Acorus calamus L., as companion plants, may enhance the surface carbon input through litterfall decomposition, suggesting that the root carbon input can be converted into stable soil organic carbon more efficiently [34]. In particular, the effect of root activity on surface soil carbon dynamics was more pronounced in the 0–20 cm soils [35]. In addition, the M-Af and M-Ac patterns with higher soil water content (41.08% and 36.63%, respectively) may further contribute to SOC accumulation by hindering satisfactory root growth and thus reducing the rate of organic matter decomposition [36]. However, as the soil layer deepened (40–60 cm), the differences in SOC among the plant configuration modes tended to flatten out, which may be attributed to the limited role of plant configuration in regulating the carbon pool in deeper soils, with the direct effect of plant rooting activities on the carbon dynamics in surface soils being more significant. This hypothesis still lacks sufficient experimental data support, and future studies could further explore the role of plant roots in regulating the carbon dynamics in different soil layers.
In this study, although the values of soil organic carbon (SOC) content and stock were relatively low, they were consistent with findings from previous research [37]. The artificial forests of lakeside vegetation, such as lake grasses, Metasequoia glyptostroboides, and Salix babylonica L., in the lakeshore wetland, are subject to water level fluctuations and alternating wet–dry cycles caused by agricultural irrigation. These factors can disrupt soil structure and reduce the stability of soil organic carbon aggregates, indirectly affecting the SOC content. Consequently, the soil carbon pools under various land use/cover types in the Hongze Lake wetland are relatively small [38].

4.2. Variability and Sensitivity Analysis of Soil Organic Carbon Fraction in Different Plant Configuration Modes

This study found that there were differences in carbon fraction content between different plant configuration modes in the lakeshore zone (Figure 3). As shown in Figure 3A,B, in the 0–20 cm soil layer, the mean size of the SOC content in the different plant configuration modes was M-Ac > M-Af > P-N > Mg-N > S-Af, indicating that the dominant plant, Metasequoia glyptostroboides, had a strong carbon sequestration capacity, similar to the results of previous studies [39]. This is because the SOC content is mainly affected by the amount of vegetation returned and the decomposition rate. Metasequoia glyptostroboides, a deep-rooted tree species, has more litterfall and root secretion. Metasequoia glyptostroboides are often distributed along rivers, showing a preference for humid environments, and to a certain extent, they can adapt to flooding-resistant environments. Meanwhile, the flooded environment brings a low decomposition rate, so it can grow better and accumulate more TC and SOC in the lakeshore zone. In addition, Acorus calamus L. produced more plant residue than other plants, and a large amount of carbon input into the soil from these plants’ residue further led to higher TC and SOC contents under M-Ac conditions. In particular, Acorus calamus L., as a common perennial aquatic herb in rivers and swampy wetlands, has a well-developed root system that shows a certain degree of resilience to flooding stress and can maintain higher biomass [40,41], thus continuing to input organic carbon into the soil under cyclical flooding conditions.
In this study, the ROC contents of two plant configuration modes, M-Ac and M-Af, were significantly lower than those of other plant configuration modes, which were 1.006 g·kg−1 and 1.117 g·kg−1, respectively (Figure 3C). This was mainly because Metasequoia glyptostroboides is a coniferous species with a weak canopy retention effect, which is prone to generating a large amount of surface runoff, thus causing an intensification of the soil erosion process on slopes [42], resulting in a lower ROC content. On the contrary, in the case of the P-N mode, its lush forest canopy and high canopy density made its ROC content higher. In addition, this study found that the DOC content in the Mg-N and P-N modes was significantly higher than that in the other three plant configuration modes (p < 0.05). The reason for this is that the leaching of soluble C compounds from plant litter is an essential source of soil DOC in forests [43], whereas more litterfall in both models produces more soluble C compounds. For POC, the content in Pterocarya stenoptera C. DC. was significantly higher (2.334 g·kg−1) than the other configurations (Figure 3E). This is mainly because Pterocarya stenoptera C. DC. has a more developed root system, a more extensive form, and more litterfall. On the one hand, this can influence the flow rate of POC in the soil, and on the other hand, this more extensive root system can improve the stability of soil aggregates and maintain the pore structure to increase the POC content [44]. In addition, the MAOC content in the M-Ac mode (2.196 g·kg−1) in this study was significantly higher than that of the other configuration modes (Figure 3F), followed by M-Af (1.896 g·kg−1). This may be because Metasequoia glyptostroboides’ litterfall is easy to decompose and migrate into deeper soil, which provides a sufficient carbon source for microbial growth. Microorganisms form dissolved organic matter by interacting with the mineral surface through the degradation of ground litterfall and POC [45], which are adsorbed by ions in the process of downward migration, thus forming MAOC.
Regarding the sensitivity index, the sensitivity change in POC to plant configuration modes was significantly higher (p < 0.05) than that in other SOC components. The POC content in P-N was substantially higher (p < 0.05) than that in the different modes, which may be related to its high litterfall input and rapid decomposition rate [46]. The study by Depingzhai [47] also verified that litterfall was enriched in the surface layer of the forest, while microbial and enzyme activities were higher in the surface layer of the soil, where litterfall was decomposed in the surface layer of the soil, making it easier to accumulate. The main reason for the significant differences in POC content among different plant configuration modes in the lakeshore zone was the considerable differences in litterfall and plant root content and distribution among different plant configuration modes, which suggests that POC can be used as a sensitivity indicator for the effect of changes in vegetation type on carbon pools.

4.3. Characteristics of Soil Organic Carbon Partitioning Ratio and Carbon Pool Activity in Different Plant Configuration Modes

The present study showed that plant configuration modes can influence the proportion of SOC component allocation, affecting the soil quality in the lakeshore zone (Table 2). Specifically, the NLC ratio in M-Ac and M-Af was more than 70%, significantly higher (p < 0.05) than that in the other configuration modes. At the same time, ROC/SOC and DOC/SOC were lower, indicating that constructing these two plant configuration modes in the lakeshore zone could improve the stability of the soil carbon pool. The ROC/SOC in S-Af (55.90%) was significantly higher than that in M-Af, which may be attributed to Salix babylonica L., resulting in the high activity and low stability of its soil carbon pools, as well as higher MAOC/SOC. The same was true for P-N, which was in agreement with previous studies [48]. The reason for this was assessed to be the lower water content in the topsoil relative to the other three modes, which allowed for closer proximity of simple organic matter and mineral surfaces and an increase in the MAOC content in the topsoil [49]. Remarkably, the CPA in the S-Af mode was significantly higher than that in the other four plant configuration modes, consistent with its high ROC/SOC ratio (55.90%), which indicates that such modes can enhance soil fertility in the short term. Still, they may also increase the risk of carbon emissions, thus weakening the long-term carbon sink function of the soil and affecting the regional and even the global carbon cycle process. As far as inactive carbon is concerned, the ratio of M-Af and M-Ac was more than 70%, which indicates that their carbon pools are more stable and suitable for ecological restoration projects aiming at long-term carbon sequestration.

4.4. Main Factors Influencing the Accumulation of Soil Organic Carbon Fractions and the Distribution of Their Components

Under the restoration of different plant configuration modes, soil organic carbon fractions and their distribution and accumulation for each component were affected [50,51]. Although the results of previous studies indicated that changes in plant inputs had a negligible effect on soil mineral-bound organic carbon, changes in plant inputs significantly increased or decreased soluble organic carbon and microbial biomass, suggesting that long-term, sustained changes in plant inputs may have a significant effect on mineral-bound organic carbon by altering the adsorption of soil minerals to it [52]. Plants influence their distribution mainly through primary productivity, organic matter inputs, and organic matter quality [53]. Redundancy analysis showed that soil total carbon (TC), the branch carbon content in the tree layer, and the carbon content in the shrub layer were the core factors (with a cumulative explanation of 71.26%) regulating the accumulation of SOC components (Figure 6). Specifically, carbon inputs from the branch and shrub layers directly affected POC and ROC formation through litterfall decomposition, consistent with a significant positive correlation (r = 0.82, p < 0.01) with particulate organic carbon. The soil bulk density (BD) was significantly negatively correlated with SOC (r = −0.67, p < 0.05), suggesting that compact soils may inhibit organic matter mineralization. In addition, the positive correlation (r = 0.73, p < 0.01) between the C/N ratio and inert carbon (NLC) indicated that a high C/N ratio might promote the formation of stable carbon pools by inhibiting microbial activity. The Monte-Carlo test showed that the interaction of TC and dendritic TC contributed the most to the accumulation of SOC fractions (p < 0.05), highlighting the synergistic effect of the vegetation–soil system. It can be seen that C and N, as the most essential nutrient elements in soil ecosystems, interact, influence, and change synergistically with physical and chemical properties, such as bulk weight and water content, and jointly determine the distribution and accumulation of soil organic carbon fractions and their components [54,55]. Soil bulk weight affects soil porosity, hence influencing soil aeration, water holding capacity, and infiltration capacity. It is also an important indicator for assessing soil quality [51]. The existence of large pores and large aggregates in soils with low bulk density is conducive to improvement in soil microbial activity and vegetation root development; in contrast, higher bulk density inhibits the mineralization of soil organic carbon [56,57,58]. Therefore, lowering the bulk density is, to a certain extent, conducive to the accumulation of soil organic carbon fractions and their components. In addition, soil organic carbon fractions have apparent seasonal variations, often showing higher content in the summer or autumn and lower content in the spring [59]. Vegetation is significantly affected by seasonal changes, and changes in humidity, temperature, and rainfall in different seasons will all affect the changes in their contents [60]. Therefore, soil organic carbon fractions are affected by various factors, and their study should be based on a multi-factorial, multi-faceted, and long-term approach, considering the diversity of influencing factors to carry out a more comprehensive and in-depth analysis.

5. Conclusions

The M-Af mode had the best performance in terms of soil organic carbon stocks (SCSs) accumulation, indicating that it has firm soil and water conservation capacity. The P-N mode, although having the lowest soil water content (22.92%), had a significantly higher content of particulate organic carbon (POC) than the others (58.53%), which could be applied to degraded soil improvement and other scenarios that require a rapid increase in POC. Regarding the vegetation carbon stock, the carbon content in tree trunks did not differ significantly among different configurations, but the carbon content in branches, leaves, and shrub layers was affected considerably by plant configuration modes. The highest carbon content was found in shrubs in the P-N mode (487.83 g·kg−1), and the lowest carbon content was found in leaves in the S-Af mode (425.30 g·kg−1), reflecting the role of functional traits of plants in regulating carbon allocation. The POC was the most sensitive indicator of changes in plant configuration modes (sensitivity indicator), and the most sensitive indicator of changes in plant configuration modes (sensitivity indicator) was found in the leaves of trees in the P-N mode. POC was the most sensitive indicator of a plant configuration change (sensitivity index 1.95), while ROC (inert carbon) lagged behind in its response, indicating that short-term ecological management could optimize the carbon sink function by regulating POC dynamically. The ratio of inactive carbon (NLC/SOC) was the highest in the Metasequoia glyptostroboides and M-Af modes (70.33%–74.21%), and the activity of carbon pools was low, indicating that the Metasequoia glyptostroboides mode is more stable in terms of carbon stability, which could be used to improve the carbon sink capacity of the forest in the lakeshore belt. The forest carbon sink capacity in the lakeshore belt is suitable for ecological restoration projects aiming at long-term carbon sequestration.

Supplementary Materials

The following supporting information can be downloaded at: https://www.mdpi.com/article/10.3390/f16040611/s1, Table S1. Soil physicochemical properties and vegetation carbon content in components of 5 plant configuration modes; Table S2. Bulk density (BD), the contents of soil organic carbon (SOC) and carbon storage (CSC) across different soil layers in components of 5 plant configuration modes; Table S3. Important ranking and significance results of soil physicochemical properties and vegetation carbon content.

Author Contributions

Conceptualization, T.G. and X.L.; methodology, X.L.; investigation, T.G., X.L. and Y.H.; resources, J.J.; data curation, X.L.; writing—original draft preparation, T.G. and X.L.; writing—review and editing, T.G. and Y.H.; visualization, X.L.; supervision, J.J.; project administration, J.J.; funding acquisition, J.J. All authors have read and agreed to the published version of the manuscript.

Funding

This research was funded by Jiangsu Province Carbon Peak Carbon Neutral Science and Technology Innovation Project (BE2022420) and Postgraduate Innovation Program of Jiangsu Province (SJCX24_0350).

Data Availability Statement

The original contributions presented in this study are included in the article and Supplementary Materials. Further inquiries can be directed to the corresponding author.

Conflicts of Interest

The authors declare no conflict of interest.

References

  1. Ma, K.; Zhang, Y.; Tang, S.; Liu, J. Spatial distribution of soil organic carbon in the Zoige alpine wetland, northeastern Qinghai–Tibet Plateau. CATENA 2016, 144, 102–108. [Google Scholar] [CrossRef]
  2. Wang, L.L.; Song, C.C.; Ge, R.J. Soil Organic Carbon Storage under Different Land-use Types in Sanjian Plain. China Environ. Sci. 2009, 29, 656–660. [Google Scholar]
  3. Liang, C.; Balser, T.C. Warming and nitrogen deposition lessen microbial residue contribution to soil carbon pool. Nat. Commun. 2012, 3, 1222. [Google Scholar] [CrossRef] [PubMed]
  4. Shen, H.; Cao, Z.; Hu, Z. Characteristics and Ecological Effects of the Active Organic Carbon in Soil. Chin. J. Ecol. 1999, 3, 32–38. [Google Scholar]
  5. Blair, G.; Lefroy, R.D.B.; Lisle, L. Soil Carbon Fractions Based on their Degree of Oxidation, and the Development of a Carbon Management Index for Agricultural Systems. Crop Pasture Sci. 1995, 46, 1459–1466. [Google Scholar] [CrossRef]
  6. Yu, J.; Fang, L.; Bian, Z.; Wang, Q.; Yu, Y. A review of the composition of soil carbon pool. Acta Ecol. Sin. 2014, 34, 4829–4838. [Google Scholar]
  7. Zhang, J.; Song, C.; Yang, W. Effects of land use patterns on soil water-dissolved organic carbon. China Environ. Sci. 2005, 343–347. [Google Scholar]
  8. Ji, H.; Han, J.; Li, P.; Zhu, Y.; Guo, Y.; Hao, D.; Cui, H. Effects of different vegetation types on soil organic carbon particle size distribution and microbial community structure in Hongze Lake Wetland. J. Nanjing For. Univ. Nat. Sci. Ed. 2021, 45, 141–150. [Google Scholar]
  9. Xiao, Y.; Huang, Z.; Wu, H.; Lv, X. Compositions and contents of active organic carbon in different wetland soils in Sanjiang Plain, Northeast China. Acta Ecol. Sin. 2015, 35, 7625–7633. [Google Scholar]
  10. Chen, X.; Chen, Z.; Lei, J.; Wu, T.; Li, W. Contents of Organic Carbon and Its Active Components in Surface Soil of Different Community Areas of Mangrove Forest in Dongzhai Port. Wetl. Sci. 2022, 20, 499–506. [Google Scholar] [CrossRef]
  11. Rodríguez-Murillo, J.C.; Almendros, G.; Knicker, H. Wetland soil organic matter composition in a Mediterranean semiarid wetland (Las Tablas de Daimiel, Central Spain): Insight into different carbon sequestration pathways. Org. Geochem. 2011, 42, 762–773. [Google Scholar] [CrossRef]
  12. Li, Z.; Liu, C.; Dong, Y.; Chang, X.; Nie, X.; Liu, L.; Xiao, H.; Lu, Y.; Zeng, G. Response of soil organic carbon and nitrogen stocks to soil erosion and land use types in the Loess hilly–gully region of China. Soil Tillage Res. 2017, 166, 1–9. [Google Scholar] [CrossRef]
  13. Lai, L.; Zhao, J.; Dou, Y. Fungal necromass carbon contributes more to POC and MAOC under different forest types of Qinling Mountains. Plant Soil 2024. [Google Scholar] [CrossRef]
  14. Lu, F.; Hu, H.; Sun, W.; Zhu, J.; Liu, G.; Zhou, W.; Zhang, Q.; Shi, P.; Liu, X.; Wu, X.; et al. Effects of national ecological restoration projects on carbon sequestration in China from 2001 to 2010. Proc. Natl. Acad. Sci. USA 2018, 115, 4039–4044. [Google Scholar] [CrossRef] [PubMed]
  15. Griscom, B.W.; Adams, J.; Ellis, P.W.; Houghton, R.A.; Lomax, G.; Miteva, D.A.; Schlesinger, W.H.; Shoch, D.; Siikamäki, J.V.; Smith, P. Natural climate solutions. Proc. Natl. Acad. Sci. USA 2017, 114, 11645–11650. [Google Scholar] [CrossRef] [PubMed]
  16. Bastin, J.-F.; Finegold, Y.; Garcia, C.; Mollicone, D.; Rezende, M.; Routh, D.; Zohner, C.M.; Crowther, T.W. The global tree restoration potential. Science 2019, 365, 76–79. [Google Scholar] [CrossRef] [PubMed]
  17. Lu, N.; Tian, H.; Fu, B.; Yu, H.; Piao, S.; Chen, S.; Li, Y.; Li, X.; Wang, M.; Li, Z.; et al. Biophysical and economic constraints on China’s natural climate solutions. Nat. Clim. Change 2022, 12, 847–853. [Google Scholar] [CrossRef]
  18. Yu, Z.; Dong, Y.; Lu, C.; Agathokleous, E.; Zhang, L.; Liu, S.; Zhou, G. China’s forestation on marginal land was less efficient in carbon sequestration compared with non-marginal land. One Earth 2023, 6, 1692–1702. [Google Scholar] [CrossRef]
  19. Xu, H.; Yue, C.; Zhang, Y.; Liu, D.; Piao, S. Forestation at the right time with the right species can generate persistent carbon benefits in China. Proc. Natl. Acad. Sci. USA 2023, 120, e2304988120. [Google Scholar] [CrossRef] [PubMed]
  20. Shang, R.; Chen, J.M.; Xu, M.; Lin, X.; Li, P.; Yu, G.; He, N.; Xu, L.; Gong, P.; Liu, L.; et al. China’s current forest age structure will lead to weakened carbon sinks in the near future. Innovation 2023, 4, 100515. [Google Scholar] [CrossRef]
  21. Zhang, L.; Sun, P.; Huettmann, F.; Liu, S. Where should China practice forestry in a warming world? Glob. Change Biol. 2022, 28, 2461–2475. [Google Scholar] [CrossRef]
  22. Benz, J.P.; Chen, S.; Dang, S.; Dieter, M.; Labelle, E.R.; Liu, G.; Hou, L.; Mosandl, R.M.; Pretzsch, H.; Pukall, K.; et al. Multifunctionality of forests: A white paper on challenges and opportunities in China and Germany. Forests 2020, 11, 266. [Google Scholar] [CrossRef]
  23. Wang, Q.; Yang, C.-h.; Wang, M.-l.; Zhao, L.; Zhao, Y.-c.; Zhang, Q.-p.; Zhang, C.-y. Decoupling analysis to assess the impact of land use patterns on carbon emissions: A case study in the Yellow River Delta efficient eco-economic zone, China. J. Clean. Prod. 2023, 412, 137415. [Google Scholar] [CrossRef]
  24. Wu, Y.; Dai, R.; Xu, Y.; Han, J.; Li, P. Spatial and temporal changes in wetland use in the meeting place of Hung-tse Lake and Huaihe River. J. Nanjing For. Univ. Nat. Sci. Ed. 2016, 40, 22–28. [Google Scholar]
  25. Ding, W.-X.; Cai, Z.-C. Methane Emission from Natural Wetlands in China: Summary of Years 1995–2004 Studies. Pedosphere 2007, 17, 475–486. [Google Scholar] [CrossRef]
  26. Song, C.; Xu, X.; Tian, H.; Wang, Y. Ecosystem–atmosphere exchange of CH4 and N2O and ecosystem respiration in wetlands in the Sanjiang Plain, Northeastern China. Glob. Change Biol. 2009, 15, 692–705. [Google Scholar] [CrossRef]
  27. Xie, Y.; Xie, Y.; Chen, X.; Li, F. Progress in research on the water-holding function of wetland soils. Wetl. Sci. 2012, 10, 109–115. [Google Scholar] [CrossRef]
  28. Hao, L.; Lv, X. Effect of different reclamation patterns on soil organic carbon distribution of aggregates in the topsoil of the Calamagrostis angustifolia wetland in Sanjiang Plain, China. China Environ. Sci. 2011, 31, 1711–1717. [Google Scholar]
  29. He, L.; Gao, B.; Xia, H.; Long, Y.; Wang, C.; He, Z. Water quantity dispatch of Jiangsu Province’s Water Diversion from the Yangtze River to the North. S. N. Water Transf. Water Sci. Technol. 2024, 22, 896–908. [Google Scholar] [CrossRef]
  30. Lehmann, J.; Kleber, M. The contentious nature of soil organic matter. Nature 2015, 528, 60–68. [Google Scholar] [CrossRef]
  31. Luo, Z.; Feng, W.; Luo, Y.; Baldock, J.; Wang, E. Soil organic carbon dynamics jointly controlled by climate, carbon inputs, soil properties and soil carbon fractions. Glob. Change Biol. 2017, 23, 4430–4439. [Google Scholar] [CrossRef] [PubMed]
  32. Nel, J.A.; Cramer, M.D. Soil microbial anaplerotic CO2 fixation in temperate soils. Geoderma 2019, 335, 170–178. [Google Scholar] [CrossRef]
  33. Huang, L.; Wang, F.; Zhou, L.; Huang, R.; Qi, D.; Wei, G. Root distribution in the different forest types and their relationship to soil properties. Acta Ecol. Sin. 2012, 32, 6110–6119. [Google Scholar] [CrossRef]
  34. Kätterer, T.; Bolinder, M.A.; Andrén, O.; Kirchmann, H.; Menichetti, L. Roots contribute more to refractory soil organic matter than above-ground crop residues, as revealed by a long-term field experiment. Agric. Ecosyst. Environ. 2011, 141, 184–192. [Google Scholar] [CrossRef]
  35. Dijkstra, F.A.; Zhu, B.; Cheng, W. Root effects on soil organic carbon: A double-edged sword. New Phytol. 2020, 230, 60–65. [Google Scholar] [CrossRef] [PubMed]
  36. Wei, L.; Shangguan, Z. Specific root length characteristics of three plant species, Bothriochloa ischaemunm, Hippophae rhamnoidess and Quercus liaotungensis in the Loess Platean. Acta Ecol. Sin. 2006, 26, 4164–4170. [Google Scholar]
  37. Guo, Y. Effects of Land Use/Cover Types on Organic Carbon Stocks and Stability in Hongze Lake Wetlands. Ph.D. Thesis, Department of Ecology, Nanjing Forestry University, Nanjing, China, 2024. [Google Scholar]
  38. Zhang, S.; Xiong, D.; Xlao, L.; Yang, D.; Zhang, B.; Han, W. Influence of Dry-Wet Cycling on Soil Properties. Chin. J. Soil Sci. 2017, 48, 762–768. [Google Scholar] [CrossRef]
  39. Liu, J.; Zheng, B.; Xu, Z.; Gong, L.; Yu, D.; Zhan, H.; Shen, R. Decomposition rate and temperature sensitivity of soil organic carbon in a typical shoal wetland of Lake Poyang. J. Lake Sci. 2024, 36, 1425–1435. [Google Scholar]
  40. Keuskamp, D. Limited effects of grazer exclusion on the epiphytes of Posidonia sinuosa in South Australia. Aquat. Bot. 2004, 78, 3–14. [Google Scholar] [CrossRef]
  41. Combs-Giroir, R.; Gschwend, A.R. Physical and molecular responses to flooding in Brassicaceae. Environ. Exp. Bot. 2024, 219, 105664. [Google Scholar] [CrossRef]
  42. He, Y.; Yu, Q.; Wang, G.; Hao, M.; Fan, S.; Hu, D.; Li, Z.; Gao, P. Tree Ring Width Responses of Pinus densiflora and Robinia pseudoacacia to Climate Variation in the Mount Tai Area of Northern China. Forests 2023, 14, 2087. [Google Scholar] [CrossRef]
  43. Kalks, F.; Liebmann, P.; Wordell-Dietrich, P.; Guggenberger, G.; Kalbitz, K.; Mikutta, R.; Helfrich, M.; Don, A. Fate and stability of dissolved organic carbon in topsoils and subsoils under beech forests. Biogeochemistry 2020, 148, 111–128. [Google Scholar] [CrossRef]
  44. da Silva, S.F.; Spaccini, R.; de Rezende, C.E.; Canellas, L.P. Influence of land use and different plant residues on isotopic carbon distribution of total and water extractable organic matter in an incubation experiment with weathered tropical soil. Land Degrad. Dev. 2023, 34, 1363–1374. [Google Scholar] [CrossRef]
  45. Mikutta, R.; Turner, S.; Schippers, A.; Gentsch, N.; Meyer-Stüve, S.; Condron, L.M.; Peltzer, D.A.; Richardson, S.J.; Eger, A.; Hempel, G. Microbial and abiotic controls on mineral-associated organic matter in soil profiles along an ecosystem gradient. Sci. Rep. 2019, 9, 10294. [Google Scholar] [CrossRef]
  46. Hu, Y.; Ao, G.; Feng, J.; Chen, X.; Zhu, B. The patterns of forest soil particulate and mineral associated organic carbon characteristics with latitude and soil depth across eastern China. For. Ecosyst. 2025, 12, 100291. [Google Scholar] [CrossRef]
  47. Zhai, D.; Wang, Y.; Liao, C.; Men, X.; Wang, C.; Cheng, X. Soil Carbon Accumulation Under Afforestation Is Driven by Contrasting Responses of Particulate and Mineral-Associated Organic Carbon. Glob. Biogeochem. Cycles 2024, 38, e2024GB008116. [Google Scholar] [CrossRef]
  48. Xiao, R.; Ruan, H.; Liu, H.; Fang, Y.; Cha, Q.; Xie, Y.; Xu, Y.; Cao, G.; Shen, C. Effects of drought on soil particulate organic carbon and mineral-associated organic carbon in poplar plantations. J. Nanjing For. Univ. Nat. Sci. Ed. 2024, pp. 1–12. Available online: https://link.cnki.net/urlid/32.1161.s.20240408.1611.008 (accessed on 24 March 2025).
  49. Kaiser, M.; Kleber, M.; Berhe, A.A. How air-drying and rewetting modify soil organic matter characteristics: An assessment to improve data interpretation and inference. Soil Biol. Biochem. 2015, 80, 324–340. [Google Scholar] [CrossRef]
  50. De Neve, S.; Hofman, G. Quantifying soil water effects on nitrogen mineralization from soil organic matter and from fresh crop residues. Biol. Fertil. Soils 2002, 35, 379–386. [Google Scholar] [CrossRef]
  51. Anh, P.T.Q.; Gomi, T.; MacDonald, L.H.; Mizugaki, S.; Van Khoa, P.; Furuichi, T. Linkages among land use, macronutrient levels, and soil erosion in northern Vietnam: A plot-scale study. Geoderma 2014, 232, 352–362. [Google Scholar] [CrossRef]
  52. Feng, J.; He, K.; Zhang, Q.; Han, M.; Zhu, B. Changes in plant inputs alter soil carbon and microbial communities in forest ecosystems. Glob. Change Biol. 2022, 28, 3426–3440. [Google Scholar] [CrossRef]
  53. Luo, G.; Li, L.; Friman, V.-P.; Guo, J.; Guo, S.; Shen, Q.; Ling, N. Organic amendments increase crop yields by improving microbe-mediated soil functioning of agroecosystems: A meta-analysis. Soil Biol. Biochem. 2018, 124, 105–115. [Google Scholar] [CrossRef]
  54. Wang, Y.; Jiang, J.; Niu, Z.; Li, Y.; Li, C.; Feng, W. Responses of soil organic and inorganic carbon vary at different soil depths after long-term agricultural cultivation in Northwest China. Land Degrad. Dev. 2019, 30, 1229–1242. [Google Scholar] [CrossRef]
  55. Guan, Y.; Bai, J.; Wang, J.; Wang, W.; Wang, X.; Zhang, L.; Li, X.; Liu, X. Effects of groundwater tables and salinity levels on soil organic carbon and total nitrogen accumulation in coastal wetlands with different plant cover types in a Chinese estuary. Ecol. Indic. 2021, 121, 106969. [Google Scholar] [CrossRef]
  56. Mendham, D.; Sankaran, K.; O’connell, A.; Grove, T. Eucalyptus globulus harvest residue management effects on soil carbon and microbial biomass at 1 and 5 years after plantation establishment. Soil Biol. Biochem. 2002, 34, 1903–1912. [Google Scholar] [CrossRef]
  57. Wang, C.; Li, H.; Sun, X.; Cai, T. Responses of Soil Microbial Biomass and Enzyme Activities to Natural Restoration of Reclaimed Temperate Marshes After Abandonment. Front. Environ. Sci. 2021, 9, 701610. [Google Scholar] [CrossRef]
  58. Norby, R.J.; Warren, J.M.; Iversen, C.M.; Medlyn, B.E.; McMurtrie, R.E. CO2 enhancement of forest productivity constrained by limited nitrogen availability. Proc. Natl. Acad. Sci. USA 2010, 107, 19368–19373. [Google Scholar] [CrossRef]
  59. Chen, X.; Hu, H.; Wang, Q.; Wang, X.; Ma, B. Exploring the Factors Affecting Terrestrial Soil Respiration in Global Warming Manipulation Experiments Based on Meta-Analysis. Agriculture 2024, 14, 1581. [Google Scholar] [CrossRef]
  60. Dietterich, L.H.; Karpman, J.; Neupane, A.; Ciochina, M.; Cusack, D.F. Carbon content of soil fractions varies with season, rainfall, and soil fertility across a lowland tropical moist forest gradient. Biogeochemistry 2021, 155, 431–452. [Google Scholar] [CrossRef]
Figure 1. Location map of the study area.
Forests 16 00611 g001
Figure 2. SOC (A) and SCS (B) distribution of 5 plant configuration modes. Different small letters indicate significant difference (p < 0.05).
Forests 16 00611 g002
Figure 3. Soil carbon component content (SOC (A), TC (B), ROC (C), DOC (D), POC (E) and MAOC (F)) in 5 plant configuration modes. Different small letters indicate significant difference (p < 0.05).
Forests 16 00611 g003
Figure 4. Carton pool activity. Different small letters indicate significant difference (p < 0.05).
Forests 16 00611 g004
Figure 5. The correlation between soil organic carbon and its component contents with soil physico-chemical properties.
Forests 16 00611 g005
Figure 6. Redundancy analysis of soil organic carbon and its component content with soil physico-chemical properties and vegetation carbon content.
Forests 16 00611 g006
Table 1. Sensitivity indicators of soil organic carbon change.
SOCROCDOCPOCMAOCNLC
Sensitivity Index0.630.480.751.950.611.74
Table 2. Distribution ratio of soil organic carbon components. Different small letters indicate significant difference (p < 0.05).
Index (%)S-AfMg-NM-AfM-AcP-N
ROC/SOC55.90 ± 6.08 c41.00 ± 3.87 b29.67 ± 4.54 a25.79 ± 4.93 a38.01 ± 4.15 b
DOC/SOC0.19 ± 0.03 a0.25 ± 0.09 a0.18 ± 0.04 a0.17 ± 0.02 a0.22 ± 0.10 a
POC/SOC32.57 ± 13.19 a39.22 ± 12.33 a48.94 ± 9.68 a44.24 ± 6.98 a58.53 ± 11.69 a
MAOC/SOC67.53 ± 13.19 b60.78 ± 12.33 b51.06 ± 9.68 a55.73 ± 6.98 a35.71 ± 11.69 a
NLC/SOC44.10 ± 2.13 a58.99 ± 3.99 b70.33 ± 8.76 c74.21 ± 8.14 c62.00 ± 6.30 b
Table 3. Redundancy analysis of explanatory variables for soil organic carbon and its components.
ItemsAxis 1Axis 2Axis 3Axis 4
Eigenvalues0.59050.12210.11420.0112
Explained variation (cumulative) (%)59.0571.2682.6883.80
Pseudo-canonical correlation0.97260.82150.82440.8211
Explained fitted variation (cumulative) (%)70.0284.5098.0599.38
Canonical eigenvalues0.843259
The sum of all eigenvalues1.000000
Disclaimer/Publisher’s Note: The statements, opinions and data contained in all publications are solely those of the individual author(s) and contributor(s) and not of MDPI and/or the editor(s). MDPI and/or the editor(s) disclaim responsibility for any injury to people or property resulting from any ideas, methods, instructions or products referred to in the content.

