Article

Monitoring Pine Shoot Beetle Damage Using UAV Imagery and Deep Learning Semantic Segmentation Under Different Forest Backgrounds

1
College of Forestry, Southwest Forestry University, Kunming 650051, China
2
College of Big Data and Intelligent Engineering, Southwest Forestry University, Kunming 650051, China
3
Laboratory for Pest Monitoring, Yinglin Branch Yunnan Institute of Forest Inventory and Planning, Kunming 650032, China
*
Author to whom correspondence should be addressed.
These authors contributed equally to this work.
Forests 2025, 16(4), 668; https://doi.org/10.3390/f16040668
Submission received: 20 March 2025 / Revised: 9 April 2025 / Accepted: 10 April 2025 / Published: 11 April 2025
(This article belongs to the Section Forest Inventory, Modeling and Remote Sensing)

Abstract

:
The outbreak of Pine Shoot Beetle (PSB, Tomicus spp.) posed a significant threat to the health of Yunnan pine forests, necessitating the development of an efficient and accurate remote sensing monitoring method. The integration of unmanned aerial vehicle (UAV) imagery and deep learning algorithms shows great potential for monitoring forest-damaged trees. Previous studies have utilized various deep learning semantic segmentation models for identifying damaged trees in forested areas; however, these approaches were constrained by limited accuracy and misclassification issues, particularly in complex forest backgrounds. This study evaluated the performance of five semantic segmentation models in identifying PSB-damaged trees (UNet, UNet++, PAN, DeepLabV3+ and FPN). Experimental results showed that the FPN model outperformed the others in terms of segmentation precision (0.8341), F1 score (0.8352), IoU (0.7239), mIoU (0.7185) and validation accuracy (0.9687). Under the pure Yunnan pine background, the FPN model demonstrated the best segmentation performance, followed by mixed grassland-Yunnan pine backgrounds. Its performance was the poorest in mixed bare soil-Yunnan pine background. Notably, even under this challenging background, FPN still effectively identified diseased trees, with only a 1.7% reduction in precision compared to the pure Yunnan pine background (0.9892). The proposed method in this study contributed to the rapid and accurate monitoring of PSB-damaged trees, providing valuable technical support for the prevention and management of PSB.

1. Introduction

Forest ecosystems play a pivotal role in maintaining global biodiversity, regulating the climate, and providing essential ecosystem services such as water and air purification, as well as the production of wood, fiber, fuel, and food [1]. As some of the most species-rich ecosystems on Earth, forests are crucial for carbon sequestration and soil protection [2]. However, they are increasingly threatened by a range of disturbances, including wildfires, storms, insect outbreaks, and human activities [3]. Among these, insect infestations represent a natural yet significant driver of forest ecosystem dynamics. In the context of climate change, the frequency, intensity, and scale of insect disturbances have escalated dramatically, exceeding historical levels [1,4]. In southwestern China, one of the most critical threats to forest ecosystems is the Pine Shoot Beetle (PSB). This pest causes extensive damage, beginning with twig consumption and escalating to the destruction of tree trunks, ultimately leading to widespread tree mortality. Over the past four decades, PSB damage has devastated large swathes of Yunnan pine (Pinus yunnanensis) forests, affecting over 1.5 million hectares and resulting in severe economic and ecological losses [5]. Timely and accurate identification of PSB damage is crucial to prevent the escalation of outbreaks and mitigate the associated damage [6]. Consequently, it is essential to develop efficient methods for monitoring PSB attack sites to minimize the economic and ecological impact on forest health.
Conventional forest pest monitoring techniques, such as field surveys and trap-setting, face significant limitations. These methods are often time-consuming, labor-intensive, and highly susceptible to terrain constraints, particularly in remote, inaccessible, and densely forested areas [7,8]. By contrast, remote sensing technology offers significant advantages in forest pest monitoring. Its ability to rapidly acquire real-time data over vast areas within a relatively short period is a particularly notable benefit [9]. Moreover, remote sensing data remain unaffected by human interference, enabling more accurate and consistent assessments of forest health through image analysis [10], which facilitates timely decision-making for forest managers [11].
Remote sensing platforms for monitoring beetle pests include UAVs, space shuttles, and satellites [12]. Compared to space shuttles and satellites, UAVs offer distinct advantages, particularly their high maneuverability and ability to capture high-resolution imagery. The flexibility of UAV operations enables effective coverage of specific areas, allowing for precise monitoring in environments with complex terrain [13]. Unlike the fixed orbits of space shuttles and satellites, UAV can adjust their flight paths as needed, providing more accurate and tailored imagery [14]. Additionally, the ability to produce high-resolution images that capture subtle disease characteristics and deliver precise data on tree health is a notable benefit. However, current research on monitoring PSB damage using UAV imagery remains limited, with only three studies having combined traditional machine learning methods with high-resolution UAV imagery for PSB-damaged tree detection [15,16,17].
Conventional machine learning methodologies, such as random forest (RF), support vector machine (SVM), decision tree (CART), and multiple linear regression (MLR), have been widely applied in the field of pest detection. For example, Sheykhmousa et al. [18] conducted a comparative analysis of the performance of SVM and RF in remote sensing image classification. Their results showed that random forest outperformed SVM in most scenarios, achieving higher classification accuracy and greater robustness. In another study, Gao et al. [19] employed UAV data to detect the invasion of red turpentine beetle (Dendroctonus valens) in pine trees using RF and SVM algorithms. The overall accuracy exceeded 80%, and the recall rate for detecting damaged trees reached 70%. Kanaskie et al. [20] used RF algorithm to monitor the invasion of the southern pine beetle. The algorithm applied a dataset of 1000 trees with seven predictive features, achieving an accuracy of 76.9%. Despite the demonstrated effectiveness of these methods, their inherent limitations must be considered. Traditional machine learning algorithms typically rely on manual feature extraction (e.g., texture metrics, spectral indices), a process that is both time-consuming and challenging to scale for large datasets [21,22]. Furthermore, the quality of these extracted features influences model performance. When extracting features from high-resolution images, “salt-and-pepper noise” can interfere with the process, potentially compromising the stability and reliability of feature extraction [23].
In recent years, deep learning has gained widespread attention and application in pest detection due to its speed and efficiency. Combining deep semantic segmentation models with high-resolution UAV imagery has emerged as a promising approach for forest pest and disease monitoring. For example, Min-Gyu Lee et al. [24] utilized U-Net, SegNet, and DeepLab V3+ (with ResNet18 and ResNet50 backbones) to detect pine wilt disease (PWD) in time-series UAV imagery. Among these models, DeepLab V3+ with a ResNet50 backbone achieved an F1-score of 0.742 (a harmonic mean of precision and recall, where higher values indicate better model balance between false positives and false negatives) and a maximum recall rate of 0.727 (the proportion of actual positives correctly identified). Shen et al. [25] integrated the VGG classical small-convolutional-kernel network with U-Net to detect PWD, achieving MIoU (Mean Intersection over Union, a segmentation accuracy metric where higher values indicate better overlap between predicted and ground-truth regions) of 81.62%, MPA (Mean Pixel Accuracy) of 85.13%, accuracy (overall correctness of predictions) of 99.13%, and an F1 score of 88.50% on the validation set. Xia et al. [26] applied DeepLabv3+, PSPNet, and FCN models to UAV imagery for PWD detection in Laoshan, China. Among these models, DeepLabv3+ achieved the highest IoU (Intersection over Union, measuring overlap between predicted and ground-truth regions) of 0.720 and F1 score of 0.832, surpassing other architectures. Although semantic segmentation models can effectively identify damaged pine trees, in practical monitoring scenarios, damaged trees often overlap with their surrounding environments, such as ground, and grasslands, leading to complex relationships [24,27]. Few studies have focused on the performance of semantic segmentation models in detecting pest-damaged trees under different forest backgrounds. In addition, there are few reports on the use of semantic segmentation for PSB identification. It is necessary to develop and evaluate semantic segmentation models suitable for PSB detection.
To address the urgent need for rapid and effective PSB monitoring, this study leveraged UAV imagery to collect an extensive dataset of Yunnan pine forests affected by PSB. A high-quality dataset was constructed, encompassing both healthy and damaged pine trees, through rigorous data cleansing and enhancement procedures. The primary aim of this research is to evaluate the performance of several semantic segmentation models, including FPN, UNet, UNet++, DeepLabV3+, and PAN, in identifying PSB-damaged trees under different forest backgrounds, including pure Yunnan pine, grassland-Yunnan pine and bare soil-Yunnan pine backgrounds. The ultimate goal is to identify the most effective monitoring model, thereby enabling precise segmentation and detection of PSB-damaged areas. The findings of this study will provide essential theoretical and technical support for the health monitoring of Yunnan pine forests, while advancing the transformation of pine pest detection toward intelligent and automated approaches.

2. Materials and Methods
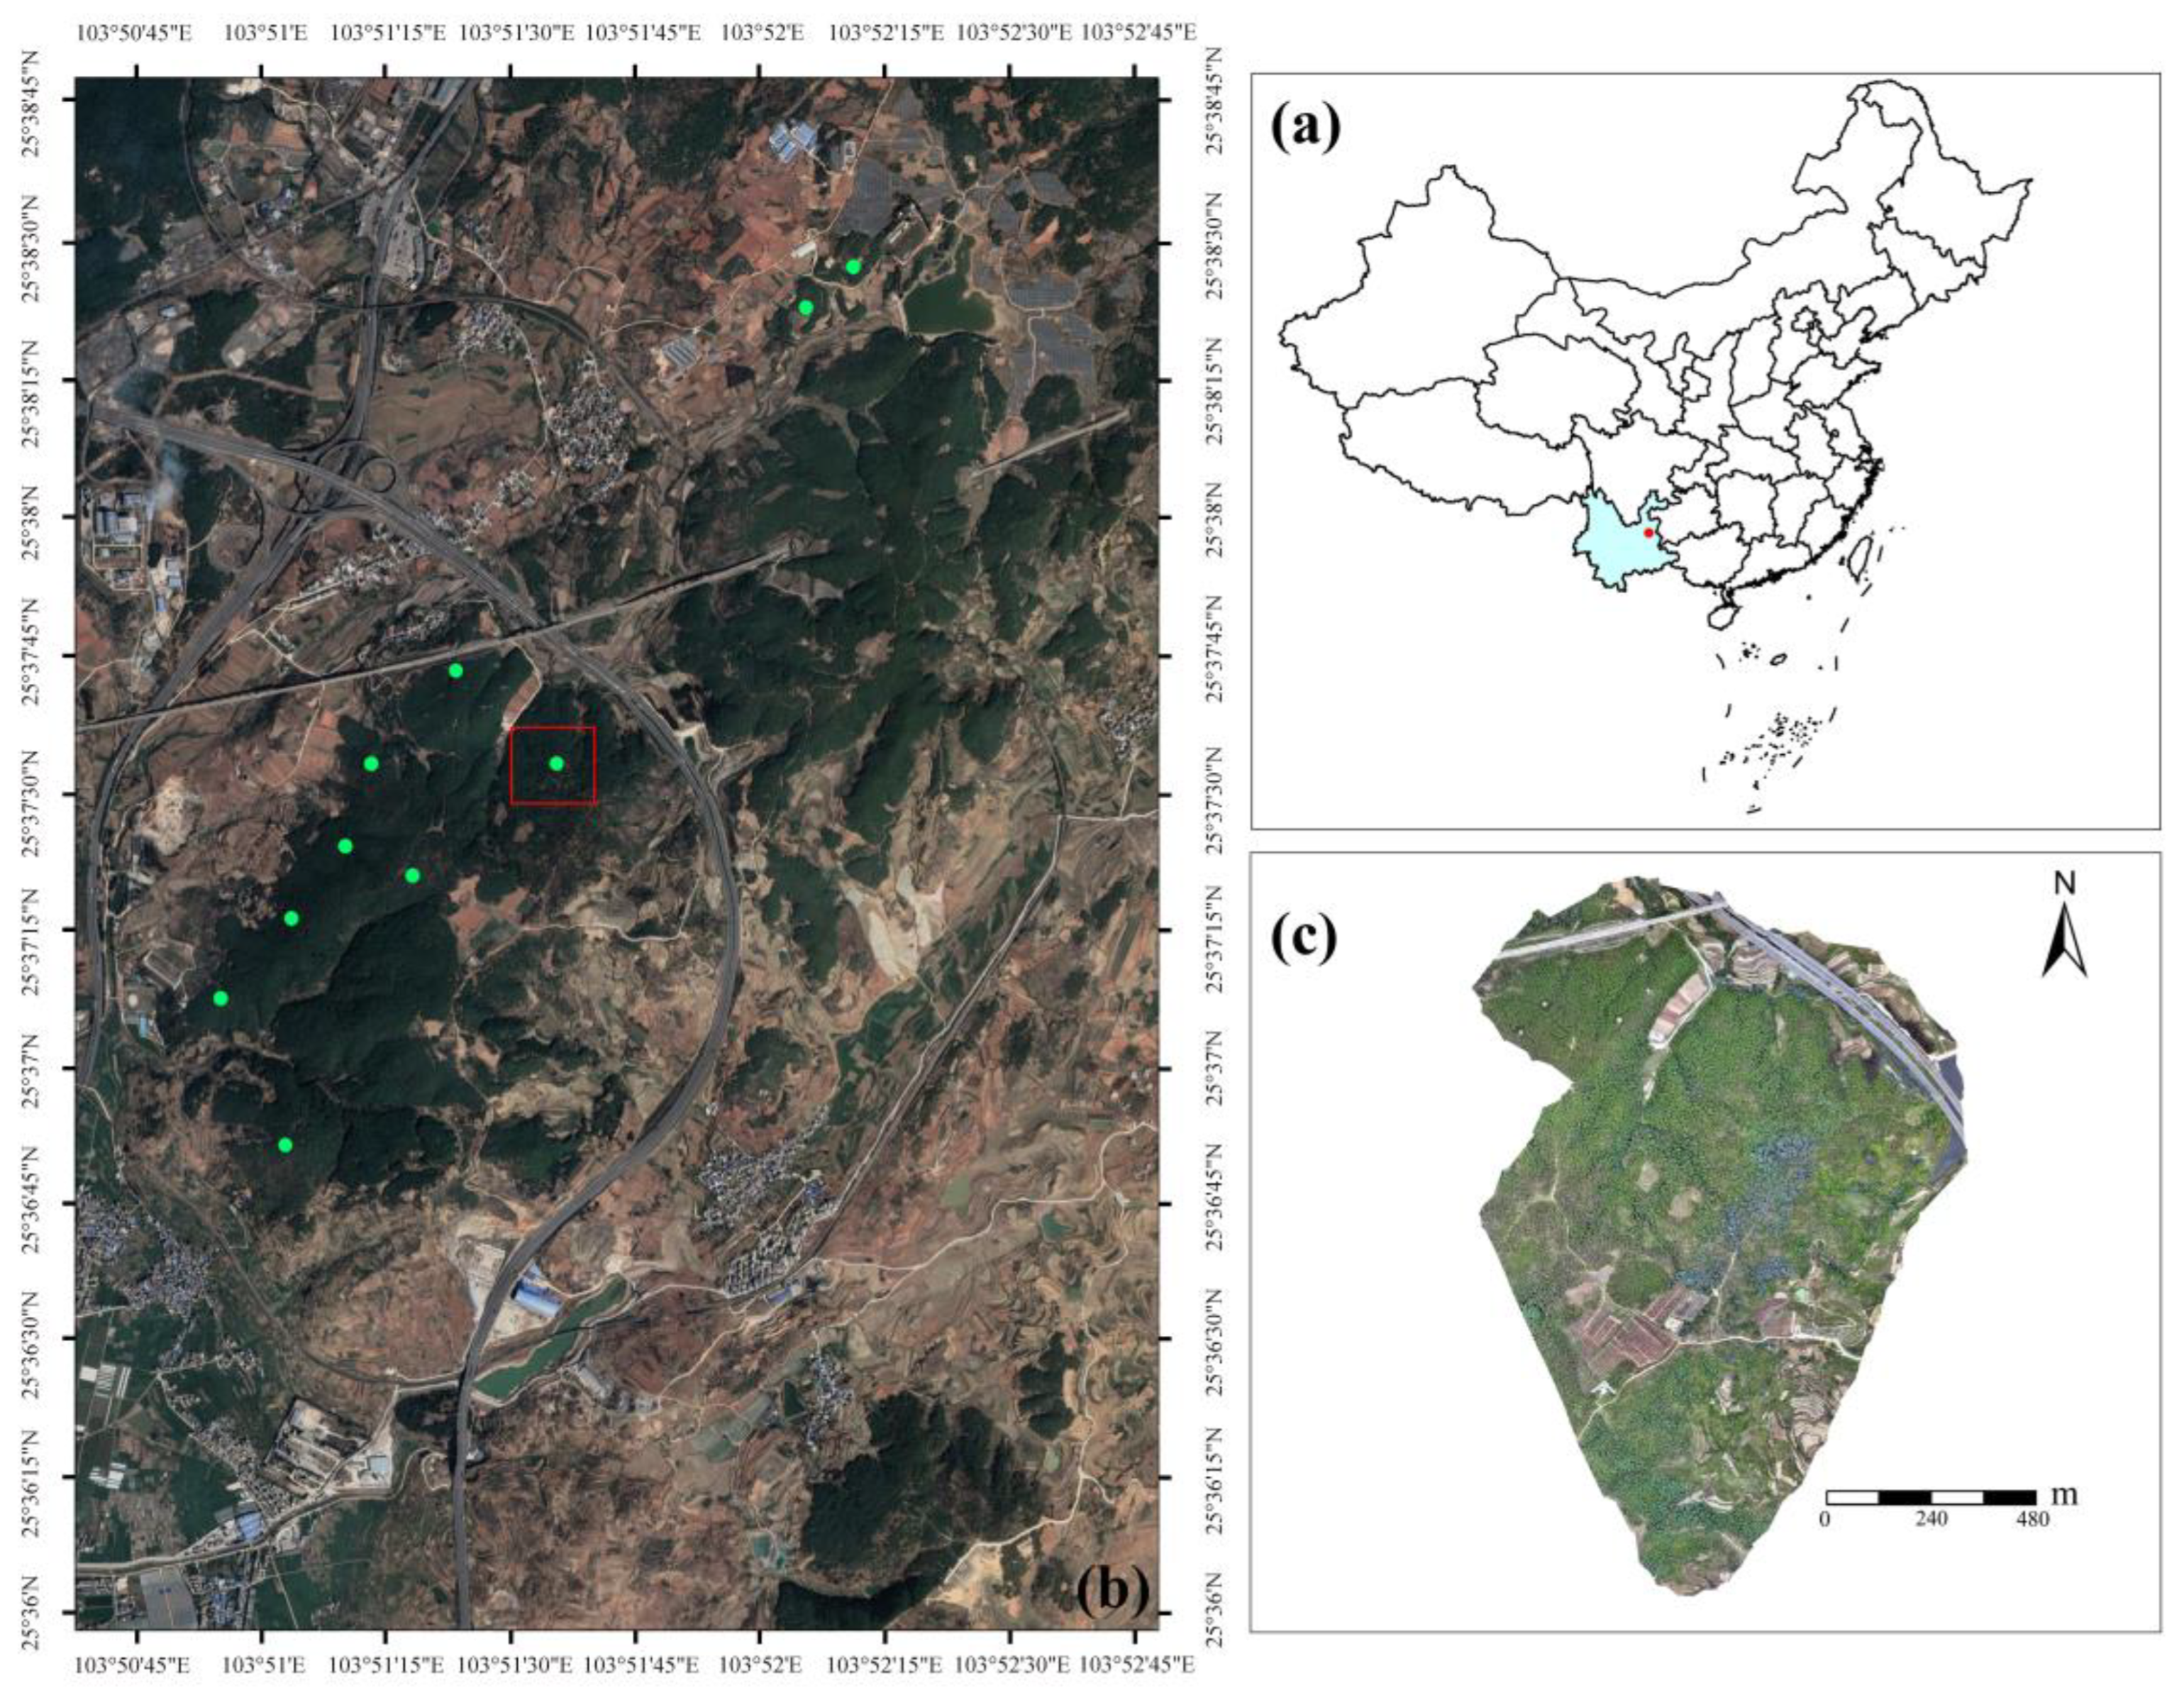
2.1. Study Area

The research site is situated in Zhanyi District, Qujing City, Yunnan Province, China (Figure 1a), encompassing approximately 400 km2. The elevation ranges from 1300 to 2200 m, with an average of about 1600 m and a peak elevation of 2200 m. The region features a mild and humid climate, which is conducive to the growth of pine trees and other forest vegetation. The mean annual temperature is approximately 15.3 °C, with an average annual precipitation of around 800 mm. Monthly average maximum and minimum temperatures are 24.5 °C and 7.2 °C, respectively. The forested areas predominantly comprise both natural and artificial stands, with Yunnan pine as the primary species. Additionally, the region includes a notable presence of broadleaf species, such as Quercus palustris and Cinnamomum camphora, in certain locations.
In the study area, PSB comprised three species: Tomicus yunnanensis Kirkendall and Faccoli, Tomicus minor Hartig, and Tomicus brevipilosus Eggers. The damage caused by PSB to Yunnan pine occurs in two distinct stages: the “shoot-boring stage” and the “stem-boring stage”. During late May, adult PSBs emerge from the trunk (Figure 2a), migrate to branches to feed on pith tissue (Figure 2b). By early December, adults return to the trunk, excavate tunnels in the phloem, mate, and lay eggs, marking the shift from shoot to trunk [28,29]. The extent of tree damage caused by PSB is classified based on the proportion of damaged branches: healthy trees (0%–10%, Figure 2c), slightly damaged trees (11%–20%, Figure 2d), moderately damaged trees (21%–50%, Figure 2e), severely damaged trees (>50%, Figure 2f), dead trees (100%, Figure 2g), and wilted trees (100%, Figure 2h) [30]. This study focused on damaged trees at severe and mortality stages. These stages were prioritized due to their high pest population density and distinct canopy color changes, which were critical for enhancing model recognition accuracy and pest control.

2.2. UAV Image Collection

UAVs have been shown to possess a high degree of maneuverability and timeliness, thus becoming a significant instrument in the acquisition of accurate forestry data. The present experiment employed a DJI Mavic 3M UAV (produced by DJI company) to collect visible images of Yunnan pine forests, with the objective of accurately locating and identifying PSB damage. The UAV is equipped with an RTK centimeter-level positioning system. The UAV-visible sensor has a resolution of 20 megapixels. From 4th to 10th October 2024, UAVs were deployed on days offering optimal weather conditions to collect images of forest stands damaged by PSB. The UAV was flown at an altitude of 50 m, with a heading and lateral overlap rate of 90% and 80%, respectively. The specific flight parameter settings of the UAV are shown in Table 1.
Based on ground-based surveys, fixed flight routes were established in severely infested areas of PSB to systematically acquire UAV images. Finally, A total of 20,749 high resolution images were captured across 10 sampled sites (Figure 1b), comprehensively documenting 854 individual damaged trees.

2.3. Data Annotation and Processing

The training samples were derived from annotated pest images, as shown in Figure 3. Initially, 250 images with a resolution of 256 × 256 pixels were extracted from UAV images. Each extracted image contained pixels representing damaged pine trees. These images were then manually annotated by an expert to identify the damaged regions, resulting in binary masks. To further enhance the dataset, the full-resolution images were rotated by 15° and 30°. For each rotated image, 10 random crops were generated, creating an augmented training dataset.
A total of 5000 sample images, each with a resolution of 256 × 256 pixels, were generated. These samples were divided into two separate sets: 70% of the samples were allocated for training, while the remaining 30% were reserved for testing.

2.4. Selection of Different Forest Backgrounds

In the UAV images, the damaged trees were located among different forest backgrounds. As shown in Figure 4, Scene A was characterized by a pure Yunnan pine background dominated by dense Yunnan pines. Scene B represented a mixed background composed of grassland and Yunnan pine, while Scene C depicted a mixed background combining bare soil and Yunnan pine. To evaluate the generalization capability of semantic segmentation models for damaged tree identification under different backgrounds, we first aggregated all sample images for model training and validation. Second, we separated the sample data to assess the models’ capability of identifying damaged trees across various backgrounds.

2.5. Models

To enhance the precision and resilience of image segmentation, this paper employed a comparative analysis of five deep learning semantic segmentation models, as illustrated in Table 2.
U-Net is a classic image segmentation model originally developed for biomedical applications [31]. Its U-shaped architecture consists of an encoder and decoder. The encoder captures multi-scale contextual information through convolution and pooling layers, while the decoder employs skip connections to integrate high-resolution shallow features with deep features, enabling precise segmentation and accurate target localization.
U-Net++ improves upon U-Net by introducing nested skip connections and dense decoding paths. These enhancements optimize feature extraction at multiple resolutions, improving the segmentation of complex boundaries and small targets, making it particularly effective for high-complexity segmentation tasks [32].
DeepLabV3+ advances segmentation by integrating Atrous Spatial Pyramid Pooling (ASPP) for multi-scale global context modeling and a decoder module to refine boundary details. This architecture significantly enhances boundary precision and small target detection, especially in complex scenes [33].
The Path Aggregation Network (PAN) utilizes multi-level skip connections and attention mechanisms to efficiently merge global and local features. Its lightweight aggregation design minimizes computational costs while improving segmentation accuracy, making it well-suited for real-time applications in complex scenarios [34].
The Feature Pyramid Network (FPN) is a multi-scale feature extraction framework designed to address the limitations of traditional single-scale networks in processing multi-scale targets. Its top-down path structure, coupled with lateral connections, facilitates the integration of shallow, high-resolution features with deep, high-semantic features. This design enhances the ability to represent multi-scale features while preserving global semantic information and spatial details. The feature pyramid architecture of FPN allows for the extraction of multi-level feature maps via a bottom-up backbone network. These maps are subsequently upsampled through a top-down pathway and fused with low-level features to produce comprehensive multi-scale feature maps. This enables the detection of targets of varying sizes [35]. The network architecture of the FPN model for detecting PSB damage is depicted in Figure 5.
The models listed in Table 2 were implemented using the PyTorch 1.8 library [36]. To ensure the models fully learn the data features and achieve convergence, the maximum number of training epochs (MaxEpochs) was set to 500. To evaluate network performance in real time and prevent overfitting, validation was conducted after each training epoch. The Adam optimizer [37] was employed with an initial learning rate (InitialLearnRate) of 0.001. The mini-batch size for each iteration was set to 4.

2.6. Evaluation Metrics

The performance of the model is evaluated based on a set of key indicators, including accuracy, loss, precision, recall, intersection over union (IoU) and F1 score [38,39,40,41,42].
The accuracy metric quantifies the proportion of correctly classified samples relative to the total number of samples. The calculation formula is as follows:
A c c u r a c y = T P + T N T P + T N + F P + F N
In the image segmentation task, TP (True Positive) refers to the pixels correctly predicted by the model as positive (such as predicted as “damaged trees” and actually “damaged trees”); TN (True negative) refers to the pixels correctly predicted by the model as negative (such as predicted as “non-damaged trees” and actually “non-damaged trees”); FP (False positive) refers to the pixels incorrectly predicted by the model as positive; FN (False negative) refers to the pixels incorrectly predicted by the model as negative. These indicators are used to measure the prediction accuracy and error type of the model.
Loss reflects the difference between the model prediction result and the true label. This study uses Dice Loss. The smaller the value, the higher the overlap between the prediction result and the true label.
L o s s = 1 2 i = 1 N   y i y ^ i i = 1 N y i + i = 1 N   y ^ i
where y i and y ^ i are the values of the i pixel in the true label and the predicted label, respectively, and N is the total number of pixels in the image.
Precision measures the proportion of positive samples correctly identified by the model among all predicted positive samples. The higher the precision, the higher the prediction accuracy of the model for positive samples, that is, the lower the false positive rate.
P r e c i s i o n = T P T P + F P
Recall evaluates the ability of the model to identify actual positive samples. The higher the recall, the more real infection areas the model can identify, and the lower the false negative rate.
R e c a l l = T P T P + F N
The F1 score is the harmonic mean of precision and recall, which is used to comprehensively evaluate the performance of the model in terms of classification balance. The higher the F1 score, the better the model performs in maintaining the balance between precision and recall.
F 1   s c o r e = 2 × P × R P + R
The Jaccard Index (IoU) is selected to evaluate the overlap between the predicted segmentation area (A) and the true segmentation area (B). The larger the IoU value, the higher the matching degree between the model prediction area and the true area.
I o U = A B A B = A B A + B A B
where A B is the number of intersection pixels between the predicted area and the true area, and A + B A B is the number of union pixels between the two.

3. Results

3.1. Comparison of Evaluation Parameters for Different Models

During the training process for each semantic segmentation model, the configuration that achieved the highest performance, as determined by the maximum F1 score on the validation set, was selected for evaluation. Each model was trained five times to identify the optimal settings. These configurations were subsequently applied to the test set to compute metrics including Train Loss, Train Accuracy, Validation Loss, Validation Accuracy, Precision, Recall, F1 Score, IoU, and mIoU (Table 3).
The FPN method achieved a precision of 0.8341, representing improvements of approximately 11.3% and 7.5% over UNet++ (0.7212) and DeepLabV3+ (0.7566), respectively. Although FPN’s recall value (0.8413) was marginally lower than UNet++ (0.8929), all models demonstrated high efficacy in identifying PSB-damaged trees, with recall values ranging from 0.7178 to 0.8929, indicating minimal performance variation. For the harmonic mean of precision and recall (F1 score), FPN delivered the best performance, achieving an F1 score of 0.8352. In comparison, the F1 scores of UNet, DeepLabV3+, and UNet++ were 0.6738, 0.7564, and 0.7911, respectively, all slightly lower than FPN’s. Moreover, in terms of intersection over Union (IoU) and mean IoU (mIoU), FPN outperformed the other models, with values of 0.7239 and 0.7185, respectively. Regarding training metrics, FPN achieved a training loss of 0.0579 and accuracy of 0.9887, while also demonstrating the lowest validation loss (0.1648) and highest validation accuracy (0.9687) among all evaluated models. In summary, FPN demonstrated superior overall performance across multiple evaluation metrics, making it the most suitable model for PSB detection tasks.
Figure 6 illustrates the accuracy and loss value variation curves during the training and validation processes of five models across increasing epochs. FPN and DeepLabV3+ exhibit the fastest convergence, achieving the lowest training loss values and the highest validation accuracy. Their loss curves remained stable throughout training, reflecting strong generalization capabilities. While U-Net++ performed well during the validation stage, its loss and accuracy curves displayed noticeable fluctuations, indicating potential instability. In contrast, both PAN and U-Net showed greater variability in their validation loss and accuracy, suggesting weaker overall performance. U-Net, in particular, struggled during the initial training stages, with low training accuracy and high loss values. FPN achieved the best performance, excelling in training stability, validation loss reduction, and consistent validation accuracy.

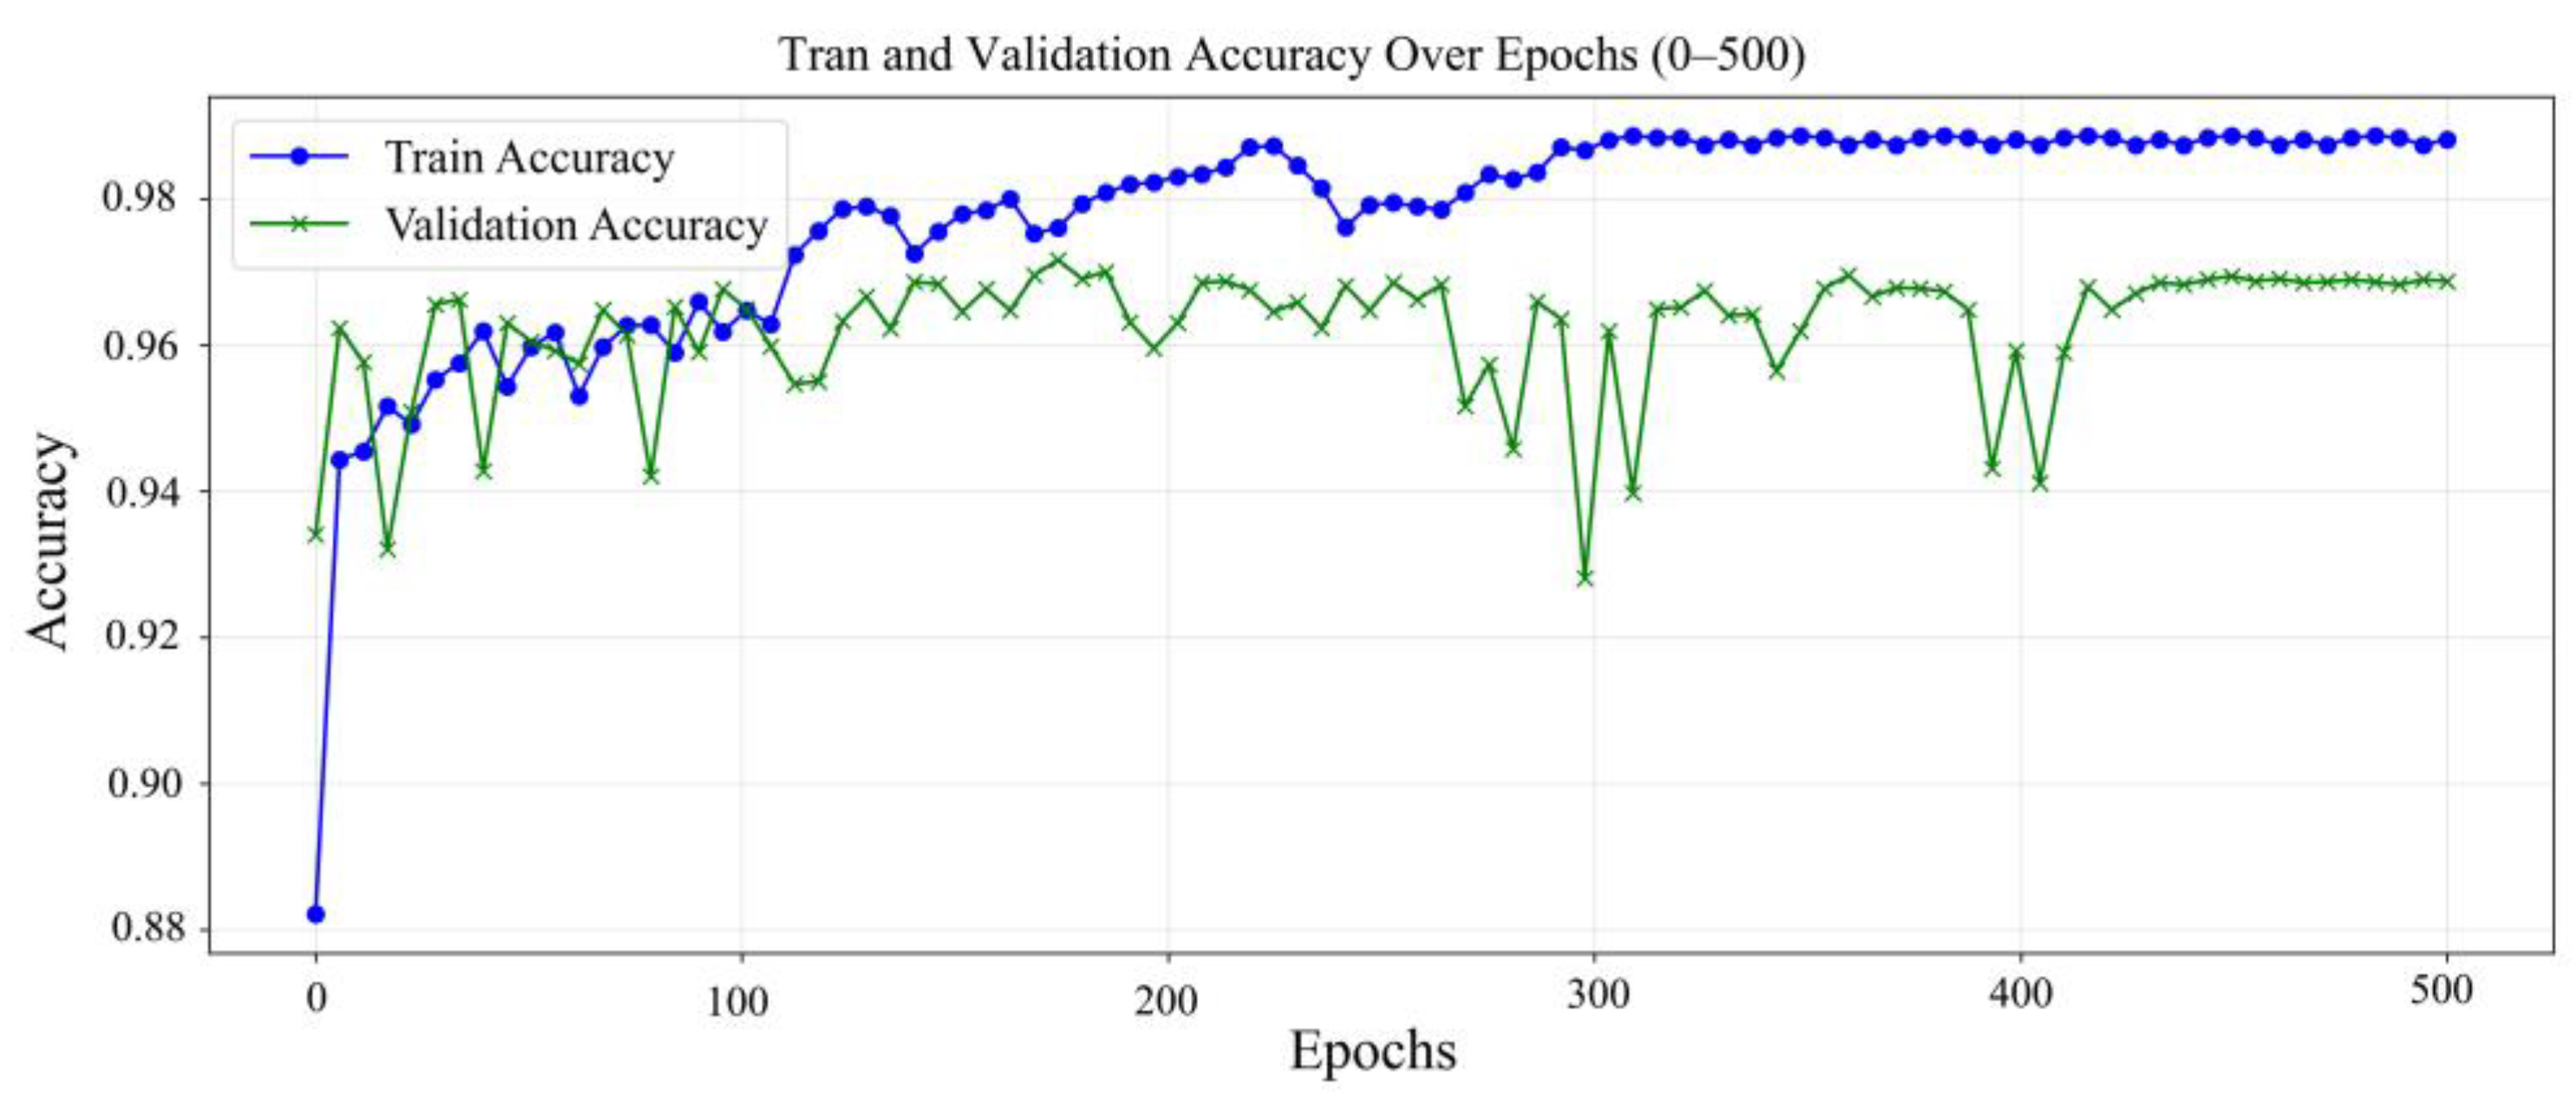
3.2. Detailed Analysis of the FPN Model Performance

After approximately 100 training epochs, the training accuracy increased to 96.28%, with a validation accuracy of 96.98%, and the validation loss significantly decreased to 0.4006. As the training process progressed to approximately 250 epochs, the training accuracy further enhanced to 98.33%. In the meantime, the validation accuracy attained 95.16%, and the validation loss declined to 0.2187. Upon the completion of 500 training epochs in total, the FPN model achieved a training loss of 0.0579 and a validation loss of 0.1648. These results suggest that the model’s performance had stabilized after 500 epochs, with no substantial evidence of overfitting. The FPN model achieved a final training accuracy of 98.87% and a validation accuracy of 96.87% (Figure 7).

3.3. The FPN Model’s Capacity for Identifying Damaged Trees Across Different Forest Backgrounds

In this study, we evaluated the efficacy of the FPN model in identifying PSB-damaged trees under different forest backgrounds. The results are displayed in Figure 8, where the first line shows the original UAV detection images, the second line represents the predicted mask of PSB damage, and the third line illustrates the combined mask image, with the predicted mask outlined in blue and the ground truth mask in red. Background A was composed of pure Yunnan pines (Figure 8a). The FPN model performed effectively in this background, with only minor misclassifications along the periphery, where some shadow areas are mistakenly identified as damaged. Background B was composed of grassland and Yunnan pines (Figure 8b). In this case, the model exhibited slight errors in distinguishing the boundary between grassland and Yunnan pines. Background C was composed of bare soil and Yunnan pines (Figure 8c). In this case, the model faced challenges in distinguishing between bare soil and damaged trees. Some bare soil areas were mistakenly identified as damaged trees.
Table 4 presents the performance evaluation results of the FPN model across different forest backgrounds. The results clearly indicated that segmentation performance was most effective under the pure Yunnan pine background. The precision in background A reached 0.8544, representing an improvement of approximately 2.8% and 8.7% compared to background B and background C, respectively. Background A also achieved the highest recall (0.8663), surpassing background B (0.7374) and background C (0.7526) backgrounds by 12.9% and 11.4%, respectively. Moreover, consistent superiority was observed in F1 Score, IoU, and mIoU metrics for background A compared to other backgrounds. Compared to Scene A, the model exhibited smaller performance degradation under Scene B and more significant degradation under Scene C, indicating that bare soil was prone to misclassification with damaged trees. Although the performance of the FPN model declined in background C, it remained effective in identifying damaged trees. The segmentation accuracy in background C reached 0.9721, only 1.7% lower than that in the background A (0.9892).

4. Discussion

The results of this study revealed that the FPN model outperformed other models in segmenting pest-damaged trees. Across varying backgrounds, FPN consistently delivered superior segmentation results with strong alignment to the ground truth. For instance, Figure 9 illustrates the segmentation results of U-Net, U-Net++, PAN, DeepLabV3+, and FPN models on damaged trees under different forest backgrounds. The first column presents the input UAV images, the second column shows the ground truth annotations, and columns 3–7 showcase the segmentation outputs of U-Net, U-Net++, PAN, DeepLabV3+, and FPN, respectively. In rows 1 and 2, which feature relatively simple scenes with healthy and damaged pine trees, all models achieved high agreement with true labels. DeepLabV3+ and PAN exhibit well-defined boundaries with minimal errors, while U-Net and U-Net++ occasionally show boundary recognition errors. Rows 3-6 include more complex scenes, including bare soil and grassland. Under these backgrounds, FPN demonstrated robust performance, accurately delineating damaged areas with clear boundaries. U-Net and U-Net++ occasionally show boundary recognition errors. The PAN and DeepLabv3+ models performed moderately, capable of identifying damaged trees but struggling with boundary recognition. The U-Net and U-Net++ models perform the worst, misclassifying bare soil and grassland as damaged trees.
Previous studies have employed semantic segmentation models to identify damaged pine trees. For instance, Xia et al. [26] systematically evaluated ten semantic segmentation architectures for PWD detection, demonstrating that the DeepLabV3+ model achieved the highest segmentation accuracy. Similarly, Min-Gyu Lee et al. [24] compared U-Net, SegNet, and DeepLabV3+ (with ResNet18/50 backbones) for PWD-damaged tree detection, with the DeepLabV3+ (ResNet50) variant showing superior detection performance. Building on these foundations, this study innovatively introduced the FPN architecture-a model previously unexplored in forest pest detection. Our results indicated that the FPN model outperformed both U-Net and DeepLabV3+ in terms of segmentation accuracy. Although this study focused on the PSB rather than PWD, the external symptoms of trees affected by these two pests are notably similar, with canopy needles turning yellow or red. In addition, the FPN model may also offer significant potential for monitoring other bark beetle species with similar canopy damage patterns, such as Dendroctonus valens, Dendroctonus ponderosae [43,44], and Ips typographus [45,46].
Although the FPN model showed a strong performance, its segmentation results for PSB detection still exhibited some false positives and false negatives. False positives primarily occurred in bare soil areas where the spectral characteristics resemble those of damaged trees. False negatives were mainly found at the borders of damaged regions. Specifically, pixels with fuzzy edges were difficult to segment precisely, leading to missed detections. Although FPN maintained high accuracy under complicated background scenarios, there remained significant opportunities for enhancing boundary processing and fine-grained segmentation. Future enhancements could focus on optimizing the model’s boundary perception capabilities, incorporating multi-scale feature fusion techniques, or augmenting the training dataset with enriched boundary information to reduce misclassification rates [47,48,49]. Multispectral UAV data (e.g., red-edge bands) have been successfully applied in forest pest monitoring [50,51,52]. Building on this technological advantage, incorporating multispectral UAV data could improve detection accuracy by enhancing spectral discrimination between damaged trees and bare soil while providing additional edge information at segmentation boundaries. This approach may help reduce both false positives and false negatives observed in conventional RGB-based analysis. To facilitate practical applications, the implementation codes and trained models are publicly accessible at https://github.com/lokiray4/Monitoring-pine-shoot-beetle-infestations-using-UAV-imagery-and-Deep-Learning-Semantic-Segmentation (accessed on 11 February 2025).

5. Conclusions

The objective of this study was to utilize semantic segmentation models based on deep learning to achieve efficient monitoring of trees damaged by PSB. We collected 20,749 high-resolution UAV images in Zhanyi District, Qujing City, Yunnan Province. Through data cleaning and augmentation, a high-quality image dataset covering various backgrounds was constructed. Five semantic segmentation models (UNet, UNet++, PAN, DeepLabV3+, and FPN) were systematically trained and evaluated for damaged tree detection. Additionally, this study also evaluated the segmentation performance of the optimal model under different forest backgrounds, including the pure Yunnan pine, grassland-Yunnan pine and bare soil-Yunnan pine backgrounds.
The experimental results demonstrated that the FPN model outperformed than other semantic segmentation models across multiple performance metrics. It achieved a precision of 0.8341, recall of 0.8413, F1 score of 0.8352, IoU of 0.7239, and mIoU of 0.7185. Under the pure Yunnan pine background, the FPN model demonstrated the best segmentation performance, followed by mixed grassland-Yunnan pine backgrounds. Its performance was poorest in mixed bare soil-Yunnan pine background. Notably, even under this challenging background, FPN still effectively identified diseased trees, with only a 1.7% reduction in precision compared to the pure Yunnan pine background (0.9892). This study established a robust theoretical framework for implementing deep learning techniques in PSB-damaged tree detection, offering an efficient and scalable technical approach. In the future, optimizing semantic segmentation models to improve boundary awareness in detecting damaged trees will be a promising research direction.

Author Contributions

Conceptualization, Z.Z. and Y.G.; methodology, L.W., Y.G. and Y.L.; software, L.W.; validation, S.W., Y.M. and L.W.; formal analysis, L.W. and Y.M.; investigation, Y.G. and L.Z.; writing—original draft, L.W. and Z.Z.; writing—review and editing, Y.G. and Y.L.; visualization, L.W., Y.G. and L.Z.; supervision, Z.Z. and Y.G.; project administration, Z.Z.; funding acquisition, Z.Z. All authors have read and agreed to the published version of the manuscript.

Funding

This work was found by the National Natural Science Foundation of China (991424018), Yunnan Province Basic Research Program (202501AU070048), Key Laboratory of Forest Disaster Warning and Control in Yunnan Province (LXXK-2024M13), Key Laboratory of Forest Conservation, National Forestry and Grassland Administration (BFUKF202406) and Yunnan Province College Students’ Innovation and Entrepreneurship Training Program (s202310677070).

Data Availability Statement

Data is contained within the article.

Conflicts of Interest

The authors declare no conflicts of interest.

References

  1. Illarionova, S.; Tregubova, P.; Shukhratov, I.; Shadrin, D.; Kedrov, A.; Burnaev, E. Remote sensing data fusion approach for estimating forest degradation: A case study of boreal forests damaged by Polygraphus proximus. Front. Environ. Sci. 2024, 12, 1412870. [Google Scholar] [CrossRef]
  2. Watson, J.E.M.; Evans, T.; Venter, O.; Williams, B.; Tulloch, A.I.T.; Stewart, C.; Thompson, I.; Ray, J.C.; Murray, K.; Salazar, A.; et al. The Exceptional Value of Intact Forest Ecosystems. Nat. Ecol. Evol. 2018, 2, 599–610. [Google Scholar] [CrossRef] [PubMed]
  3. Raffa, K.F.; Aukema, B.; Bentz, B.J.; Carroll, A.; Erbilgin, N.; Herms, D.A.; Hicke, J.A.; Hofstetter, R.W.; Katovich, S.; Lindgren, B.S.; et al. A Literal Use of “Forest Health” Safeguards Against Misuse and Misapplication. J. For. 2009, 107, 276–277. [Google Scholar] [CrossRef]
  4. Wang, W.; Zhao, J.; Sun, H.; Lu, X.; Huang, J.; Wang, S.; Fang, G. Satellite remote sensing identification of discolored standing trees for pine wilt disease based on semi-supervised deep learning. Remote Sens. 2022, 14, 3125. [Google Scholar] [CrossRef]
  5. Yu, L.; Huang, J.; Zong, S.; Huang, H.; Luo, Y. Detecting Shoot Beetle Damage on Yunnan Pine Using Landsat Time-Series Data. Forests 2018, 9, 39. [Google Scholar] [CrossRef]
  6. Luo, Y.; Huang, H.; Roques, A. Early monitoring of forest wood-boring pests with remote sensing. Annu. Rev. Entomol. 2023, 68, 277–298. [Google Scholar] [CrossRef]
  7. Li, N.; Huo, L.; Zhang, X. Using Only the Red-Edge Bands Is Sufficient to Detect Tree Stress: A Case Study on the Early Detection of PWD Using Hyperspectral Drone Images. Comput. Electron. Agric. 2024, 217, 108665. [Google Scholar] [CrossRef]
  8. Zhang, J.; Cong, S.; Zhang, G.; Ma, Y.; Zhang, Y.; Huang, J. Detecting Pest-Infested Forest Damage through Multispectral Satellite Imagery and Improved UNet++. Sensors 2022, 22, 7440. [Google Scholar] [CrossRef]
  9. Thapa, N.; Khanal, R.; Bhattarai, B.; Lee, J.W. Pine Wilt Disease Segmentation with Deep Metric Learning Species Classification for Early-Stage Disease and Potential False Positive Identification. Electronics 2024, 13, 1951. [Google Scholar] [CrossRef]
  10. Trujillo-Toro, J.; Navarro-Cerrillo, R.M. Analysis of site-dependent Pinus halepensis Mill. defoliation caused by ‘Candidatus Phytoplasma pini’ through shape selection in Landsat time series. Remote Sens. 2019, 11, 1868. [Google Scholar] [CrossRef]
  11. Jamali, S.; Olsson, P.O.; Müller, M.; Ghorbanian, A. Kernel-Based Early Detection of Forest Bark Beetle Attack Using Vegetation Indices Time Series of Sentinel-2. IEEE J. Sel. Top. Appl. Earth Obs. Remote Sens. 2024, 17, 12868–12877. [Google Scholar] [CrossRef]
  12. Abd El-Ghany, N.M.; Abd El-Aziz, S.E.; Marei, S.S. A review: Application of remote sensing as a promising strategy for insect pests and diseases management. Environ. Sci. Pollut. Res. 2020, 27, 33503–33515. [Google Scholar] [CrossRef] [PubMed]
  13. Kelcey, J.; Lucieer, A. Sensor correction of a 6-band multispectral imaging sensor for UAV remote sensing. Remote Sens. 2012, 4, 1462–1493. [Google Scholar] [CrossRef]
  14. Fassnacht, F.E.; Latifi, H.; Ghosh, A.; Joshi, P.K.; Koch, B. Assessing the potential of hyperspectral imagery to map bark beetle-induced tree mortality. Remote Sens. Environ. 2014, 140, 533–548. [Google Scholar] [CrossRef]
  15. Lin, Q.; Huang, H.; Wang, J.; Huang, K.; Liu, Y. Early Detection of Pine Shoot Beetle Attack Using Vertical Profile of Plant Traits through UAV-Based Hyperspectral, Thermal, and Lidar Data Fusion. Int. J. Appl. Earth Obs. Geoinf. 2023, 125, 103549. [Google Scholar] [CrossRef]
  16. Lin, Q.; Huang, H.; Wang, J.; Huang, K.; Liu, Y. Detection of pine shoot beetle (PSB) stress on pine forests at individual tree level using UAV-based hyperspectral imagery and lidar. Remote Sens. 2019, 11, 2540. [Google Scholar] [CrossRef]
  17. Liu, M.; Zhang, Z.; Liu, X.; Yao, J.; Du, T.; Ma, Y.; Shi, L. Discriminant Analysis of the Damage Degree Caused by Pine Shoot Beetle to Yunnan Pine Using UAV-Based Hyperspectral Images. Forests 2020, 11, 1258. [Google Scholar] [CrossRef]
  18. Sheykhmousa, M.; Mahdianpari, M.; Ghanbari, H.; Mohammadimanesh, F.; Ghamisi, P.; Homayouni, S. Support vector machine versus random forest for remote sensing image classification: A meta-analysis and systematic review. IEEE J. Sel. Top. Appl. Earth Obs. Remote Sens. 2020, 13, 6308–6325. [Google Scholar] [CrossRef]
  19. Gao, B.; Yu, L.; Ren, L.; Zhan, Z.; Luo, Y. Early Detection of Dendroctonus valens Infestation at Tree Level with a Hyperspectral UAV Image. Remote Sens. 2023, 15, 407. [Google Scholar] [CrossRef]
  20. Kanaskie, C.R.; Routhier, M.R.; Fraser, B.T.; Congalton, R.G.; Ayres, M.P.; Garnas, J.R. Early Detection of Southern Pine Beetle Attack by UAV-Collected Multispectral Imagery. Remote Sens. 2024, 16, 2608. [Google Scholar] [CrossRef]
  21. Liang, H.; Sun, X.; Sun, Y.; Gao, Y. Text Feature Extraction Based on Deep Learning: A Review. J. Wirel. Commun. Netw. 2017, 2017, 211. [Google Scholar] [CrossRef] [PubMed]
  22. Qiu, J.; Wu, Q.; Ding, G.; Xu, H.; Feng, S. A survey of machine learning for big data processing. EURASIP J. Adv. Signal Process. 2016, 2016, 67. [Google Scholar] [CrossRef]
  23. Bernard, K.; Tarabalka, Y.; Angulo, J.; Chanussot, J.; Benediktsson, J.A. Spectral-Spatial Classification of Hyperspectral Data Based on a Stochastic Minimum Spanning Forest Approach. IEEE Trans. Image Process. 2012, 21, 2008–2021. [Google Scholar] [CrossRef] [PubMed]
  24. Lee, M.G.; Cho, H.B.; Youm, S.K.; Kim, S.-W. Detection of pine wilt disease using time series UAV imagery and deep learning semantic segmentation. Forests 2023, 14, 1576. [Google Scholar] [CrossRef]
  25. Shen, J.; Xu, Q.; Gao, M.; Ning, J.; Jiang, X.; Gao, M. Aerial Image Segmentation of Nematode-Affected Pine Trees with U-Net Convolutional Neural Network. Appl. Sci. 2024, 14, 5087. [Google Scholar] [CrossRef]
  26. Xia, L.; Zhang, R.; Chen, L.; Li, L.; Yi, T.; Wen, Y.; Ding, C.; Xie, C. Evaluation of Deep Learning Segmentation Models for Detection of Pine Wilt Disease in Unmanned Aerial Vehicle Images. Remote Sens. 2021, 13, 3594. [Google Scholar] [CrossRef]
  27. He, K.; Zhang, X.; Ren, S.; Sun, J. Deep residual learning for image recognition. In Proceedings of the IEEE Conference on Computer Vision and Pattern Recognition (CVPR), Las Vegas, NV, USA, 27–30 June 2016; pp. 770–778. [Google Scholar] [CrossRef]
  28. Ye, H. Study on the damage of pine shoot beetles (Tomicus spp.) to Yunnan pine (Pinus yunnanensis). Acta Entomol. Sin. 1999, 42, 59–65. [Google Scholar]
  29. Liu, Q. Biological characteristics and integrated control of the pine shoot beetle in the Qujing area. West. J. For. Sci. 2003, 1, 12–16. [Google Scholar] [CrossRef]
  30. Liu, Y.; Zong, S.; Ren, L.; Yu, L.; Gao, B.; Ze, S.; Luo, Y. Relationship Between Canopy Damage Characterization of Yunnan Pine and the Compound Hazards of Harmful Organisms. J. Appl. Entomol. 2017, 54, 113. [Google Scholar] [CrossRef]
  31. Ronneberger, O.; Fischer, P.; Brox, T. U-Net: Convolutional networks for biomedical image segmentation. In Proceedings of the Medical Image Computing and Computer-Assisted Intervention–MICCAI, Munich, Germany, 5–9 October 2015; pp. 234–241. [Google Scholar] [CrossRef]
  32. Zhou, Z.; Siddiquee, M.M.R.; Tajbakhsh, N.; Liang, J. UNet++: A Nested U-Net Architecture for Medical Image Segmentation. In Proceedings of the International Conference on Medical Image Computing and Computer-Assisted Intervention (MICCAI), Granada, Spain, 16–20 September 2018; pp. 3–11. Available online: https://arxiv.org/abs/1807.10165 (accessed on 11 February 2025).
  33. Chen, L.C.; Zhu, Y.; Papandreou, G.; Schroff, F.; Adam, H. Encoder Decoder with Atrous Separable Convolution for Semantic Image Segmentation. In Proceedings of the European Conference on Computer Vision (ECCV), Munich, Germany, 8–14 September 2018; pp. 801–818. Available online: https://arxiv.org/abs/1802.02611 (accessed on 11 February 2025).
  34. Liu, S.; Qi, L.; Qin, H.; Shi, J.; Jia, J. Path Aggregation Network for Instance Segmentation. In Proceedings of the IEEE/CVF Conference on Computer Vision and Pattern Recognition (CVPR), Salt Lake City, UT, USA, 18–23 June 2018; pp. 8759–8768. Available online: https://arxiv.org/abs/1803.01534 (accessed on 11 February 2025).
  35. Lin, T.Y.; Dollár, P.; Girshick, R.; He, K.; Hariharan, B.; Belongie, S. Feature pyramid networks for object detection. In Proceedings of the IEEE Conference on Computer Vision and Pattern Recognition (CVPR), Honolulu, HI, USA, 21–26 July 2017; pp. 2117–2125. [Google Scholar] [CrossRef]
  36. Paszke, A.; Lerer, A.; Chintala, S.; Chanan, G.; Desmaison, L.; Kopf, A.; Yang, E.; DeVito, Z.; Raison, M.; Tejani, A. PyTorch: An Imperative Style, High-Performance Deep Learning Library. In Proceedings of the 33rd Conference on Neural Information Processing Systems (NeurIPS 2019), Vancouver, BC, Canada, 8–14 December 2019. [Google Scholar]
  37. Kingma, D.P.; Ba, J. A Method for Stochastic Optimization. arXiv 2014, arXiv:1412.6980. [Google Scholar] [CrossRef]
  38. Kirillov, A.; Girshick, R.; He, K.; Dollár, P. Panoptic Feature Pyramid Networks. In Proceedings of the IEEE/CVF Conference on Computer Vision and Pattern Recognition (CVPR 2019), Long Beach, CA, USA, 15–20 June 2019; pp. 6399–6408. Available online: https://arxiv.org/abs/1901.02446 (accessed on 11 February 2025).
  39. Chen, C.; Yang, X.; Chen, R.; Yu, J.; Du, L.; Wang, J.; Hu, X.; Cao, Y.; Liu, Y.; Ni, D. FFPN: Fourier Feature Pyramid Network for Ultrasound Image Segmentation. In Proceedings of the International Conference on Medical Image Computing and Computer-Assisted Intervention (MICCAI), Vancouver, BC, Canada, 8–12 October 2023; pp. 234–245. Available online: https://arxiv.org/abs/2308.13790 (accessed on 11 February 2025).
  40. Wang, J.; Zhang, H.; Li, Y. E-FPN: An Enhanced Feature Pyramid Network for UAV Scenarios Detection. Vis. Comput. 2024, 41, 675–693. [Google Scholar] [CrossRef]
  41. Müller, D.P.; Sauter, T.; Maier, A.K. Towards a guideline for evaluation metrics in medical image segmentation. Med. Image Anal. 2022, 80, 102420. [Google Scholar] [CrossRef] [PubMed]
  42. Huang, Q.; Sun, J.; Ding, H.; Wang, X.; Wang, G. Robust liver vessel extraction using 3D U-Net with variant dice loss function. Comput. Biol. Med. 2018, 101, 153–162. [Google Scholar] [CrossRef] [PubMed]
  43. White, J.C.; Wulder, M.A.; Brooks, D.; Reich, R.; Wheate, R.D. Detection of Red Attack Stage Mountain Pine Beetle Infestation with High Spatial Resolution Satellite Imagery. Remote Sens. Environ. 2005, 96, 340–351. [Google Scholar] [CrossRef]
  44. Wulder, M.A.; White, J.C.; Bentz, B.; Alvarez, M.F.; Coops, N.C. Estimating the probability of mountain pine beetle red-attack damage. Remote Sens. Environ. 2006, 101, 150–166. [Google Scholar] [CrossRef]
  45. Trubin, A.; Kozhoridze, G.; Zabihi, K.; Modlinger, R.; Singh, V.V.; Surový, P.; Jakuš, R. Detection of Susceptible Norway Spruce to Bark Beetle Attack Using PlanetScope Multispectral Imagery. Front. For. Glob. Change 2023, 6, 1130721. [Google Scholar] [CrossRef]
  46. Dalponte, M.; Solano-Correa, Y.T.; Frizzera, L.; Gianelle, D. Mapping a European spruce bark beetle outbreak using Sentinel-2 remote sensing data. Remote Sens. 2022, 14, 3135. [Google Scholar] [CrossRef]
  47. Toshev, A.; Taskar, B.; Daniilidis, K. Object detection via boundary structure segmentation. In Proceedings of the IEEE Conference on Computer Vision and Pattern Recognition (CVPR), San Francisco, CA, USA, 13–18 June 2010; pp. 1–8. [Google Scholar] [CrossRef]
  48. An, F.; Liu, J. Medical image segmentation algorithm based on multilayer boundary perception-self attention deep learning model. Multimed. Tools Appl. 2021, 80, 15017–15039. [Google Scholar] [CrossRef]
  49. Maninis, K.K.; Pont-Tuset, J.; Arbelaez, P.; Van Gool, L. Convolutional oriented boundaries: From image segmentation to high-level tasks. IEEE Trans. Pattern Anal. Mach. Intell. 2018, 40, 819–833. [Google Scholar] [CrossRef]
  50. Zhang, R.; You, J.; Lee, J. Detecting Pine Trees Damaged by Wsilt Disease Using Deep Learning Techniques Applied to Multi-Spectral Images. Remote Sens. 2023, 15, 3001. [Google Scholar] [CrossRef]
  51. Qin, B.; Sun, F.; Shen, W.; Dong, B.; Ma, S.; Huo, X.; Lan, P. Deep Learning-Based Pine Nematode Trees’ Identification Using Multispectral and Visible UAV Imagery. Drones 2022, 6, 200. [Google Scholar] [CrossRef]
  52. Minarik, R.; Langhammer, J.; Lendzioch, T. Detection of Bark Beetle Disturbance at Tree Level Using UAS Multispectral Imagery and Deep Learning. Forests 2021, 12, 901. [Google Scholar] [CrossRef]
Figure 1. Study area. (a) The location of the research area in Yunnan Province, China. The red dot indicates Qujing City in Yunnan Province. (b) Sample location for UAV image acquisition (green dots). (c) Mosaicked UAV imagery, with the red box in (b) indicating the corresponding location.
Forests 16 00668 g001
Figure 2. Stages of PSB damage and tree classification based on the degree of damage. (a) Emergence holes on the trunk caused by PSB (blue circle). (b) pine shoot beetle feeding on the pith tissue of branches (red circle). (c) Healthy tree (0%–10% of branches damaged). (d) Slightly damaged tree (11%–20% of branches damaged). (e) Moderately damaged tree (21%–50% of branches damaged); (f) Severely damaged tree (>50% of branches damaged). (g) Mortality tree (100% of branches damaged). (h) Wilted tree (100%, with completely fallen needles).
Forests 16 00668 g002
Figure 3. Cropped UAV image and annotated binary image.
Forests 16 00668 g003
Figure 4. UAV images in different forest backgrounds. (a) the pure Yunnan pine background. (b) mixed grassland-Yunnan pine background. (c) mixed bare soil-Yunnan pine background.
Forests 16 00668 g004
Figure 5. FPN structure diagram.
Forests 16 00668 g005
Figure 6. Accuracy and loss curves for the validation and training process of five semantic segmentation models.
Forests 16 00668 g006
Figure 7. FPN model training and verification accuracy curve.
Forests 16 00668 g007
Figure 8. Segmentation performance of FPN model under different forest backgrounds. The predicted mask outlined in blue and the ground truth mask in red. (a) the pure Yunnan pine background. (b) mixed grassland-Yunnan pine background. (c) mixed bare soil-Yunnan pine background.
Forests 16 00668 g008
Figure 9. Segmentation results of 5 different models.
Forests 16 00668 g009
Table 1. Parameter settings of UAV during data collection.
ParameterValue
Flight Height50 m
Height Modereal-time terrain following
Longitudinal Overlap90%
Lateral Overlap80%
Orthophoto GSD1.38 cm/pixel
Flight Speed1.3 m/s
Table 2. Semantic segmentation models evaluated in this study.
ModelNo. ParametersBackboneFeatures
UNet31,030,113VGG16Symmetric encoder–decoder
UNet++34,567,890ResNetNested skip connections
DeepLabV3+74,982,817XceptionAtrous pooling with decoder
PAN28,456,712ResNetPath aggregation and attention
FPN23,123,567ResNetTop-down feature pyramid
Table 3. Performance results of different models.
ModelTrain LossTrain AccVal LossVal AccPrecisionRecallF1 ScoreIoUmIoU
FPN0.05790.98870.16480.96870.83410.84130.83520.72390.7185
UNet0.33050.94040.36970.93180.66600.71780.67380.51750.5622
UNet++0.14730.96990.20900.95650.72120.89290.79110.66240.6744
DeepLabV3+0.09130.98200.24570.95300.75660.78010.75640.61630.6339
PAN0.09970.98020.23060.95650.78700.78860.76950.63610.6499
Table 4. Performance evaluation of FPN model under different forest backgrounds.
BackgroundsAccuracyPrecisionRecallF1 ScoreIoUmIoU
Backgrounds A
(pure Yunnan pine)
0.98920.85440.86630.85520.74790.7235
Backgrounds B
(grassland-Yunnan pine)
0.98160.82640.73740.80130.74230.7122
Backgrounds C
(bare soil-Yunnan pine)
0.97210.76700.75260.76950.63120.6499
Disclaimer/Publisher’s Note: The statements, opinions and data contained in all publications are solely those of the individual author(s) and contributor(s) and not of MDPI and/or the editor(s). MDPI and/or the editor(s) disclaim responsibility for any injury to people or property resulting from any ideas, methods, instructions or products referred to in the content.

