Article

Comparison of Growth Strategies and Biomass Allocation in Chinese Fir Provenances from the Subtropical Region of China

1
College of Life and Environmental Sciences, Huangshan University, Huangshan 245041, China
2
State Key Laboratory of Tree Genetics and Breeding, Research Institute of Forestry, Chinese Academy of Forestry, Beijing 100091, China
3
UGent-Woodlab (Laboratory of Wood Technology), Department of Environment, Ghent University, 9000 Ghent, Belgium
4
Zhejiang Forestry Academy, Hangzhou 310023, China
*
Authors to whom correspondence should be addressed.
These authors contributed equally to this paper.
Forests 2025, 16(4), 687; https://doi.org/10.3390/f16040687
Submission received: 7 March 2025 / Revised: 9 April 2025 / Accepted: 14 April 2025 / Published: 16 April 2025

Abstract

:
This study aims to evaluate the growth characteristics of six Chinese fir (Cunninghamia lanceolata (Lamb.) Hook.) provenances (S1–S6) from different climatic regions in subtropical China in order to select superior provenances with strong adaptability, fast growth, and reasonable biomass allocation. These results will provide references for genetic improvement and resource utilization of Chinese fir plantations. A total of 385 trees, aged 26 to 48 years, were selected from the Chinese fir gene bank in Anhui. Wood core sampling was used to obtain tree ring width and early/latewood width data. Growth rate, fast-growth period, and biomass allocation of each provenance were analyzed using methods such as the logistic growth equation, BAI (basal area increment), latewood percentage, and biomass estimation. The fast-growth period of Chinese fir starts from the 2nd to the 4th year, with significant growth occurring around the 14th year and growth stabilizing between 30 and 50 years. Provenance S2 showed clear advantages in growth rate and biomass, while S6 was relatively weak. BAI analysis revealed that the provenances reached their growth peak around 10 years of age, with a gradual decline afterward, but S2 maintained higher growth levels for a longer period. Root-shoot ratio analysis showed that S2 had the most balanced ratio, promoting stable growth and efficient water and nutrient absorption, while S6 had a higher root-shoot ratio, indicating growth limitations. Furthermore, S2 demonstrated continuous biomass increase after 30 years, indicating excellent growth potential. This study provides quantitative analysis of the growth characteristics and adaptability of different Chinese fir provenances, offering scientific support for the construction and breeding of Chinese fir plantations, and contributing to enhancing the productivity and ecological adaptability of Chinese fir plantations for sustainable resource utilization.

1. Introduction

Over the past few decades, the shift from natural forests to plantations has become increasingly frequent to achieve higher economic value and meet the growing human demand for products like timber, paper, and biomass energy [1]. Global plantation area is expanding at an annual rate of 2% [2], and from 1990 to 2020, the annual expansion of China’s plantation area reached 14,613 km2, accounting for 36% of the global afforestation during the same period [3,4], with approximately half initially consisting of primary and secondary forests [5]. Chinese fir (Cunninghamia lanceolata (Lamb.) Hook.), native to southern central and southeast China, is an important timber and ornamental species in subtropical regions [6,7], and as one of the most essential plantation species in southern China’s subtropical regions, it has a cultivation history spanning over a thousand years [8,9]. Chinese fir is listed as Least Concern by IUCN (https://www.iucnredlist.org/species/42215/2962265, accessed on 8 April 2025). Due to its fast growth and high wood quality, Chinese fir is widely used in construction, furniture, and the paper industry [10]. According to the ninth national forest inventory, the plantation area of Chinese fir in China has reached 6.6 million hectares, accounting for 6.33% of the country’s total plantation area [11]. It is mainly distributed across 19 provinces in China and contributes 20%–30% of the total commercial timber output, holding significant commercial value for the timber and pulp industries [8,12,13].
Selecting suitable plantation species (or cultivars) is a key technical issue in forestry production and sustainable forest management [4]. Traditionally, species selection for plantations has been based primarily on limited past success, often favoring local or economically beneficial species [14]. However, with the climate changing rapidly, this approach may no longer be effective and even carries potential risks [15]. As modern forestry progresses, clonal forestry has become a major development focus. Compared to sexual forestry, clonal forestry offers higher genetic gain, shorter breeding cycles, lower costs, and the preservation of the genetic traits of the parent trees, making it suitable for industrial-scale afforestation [16,17]. Over the past decade, with continuous advancements in the seedling propagation technology of Chinese fir, clonal propagation has achieved significant breakthroughs, and the area of clonal plantations is expanding [18]. However, genetic improvement of Chinese fir in China began in the 1950s [19], and clonal forestry still faces numerous challenges: growth and wood quality often have a negative correlation with stress resistance; rooting and sprouting abilities decline; genotype–environment interactions are significant; and continuous planting results in growth decline and “degeneration” (deterioration in sprouting and rooting abilities, and reduced resistance after multiple generations of clonal propagation). These factors narrow the genetic base, increasing environmental risks for clonal forestry [20].
Among the numerous biotic and abiotic factors influencing plant growth, the selection and trials of provenances are important considerations in afforestation and breeding research [21,22]. Different provenances of trees exhibit significant genetic differences due to their long-term adaptation to specific climates, soils, and ecological conditions [23]. For widely distributed species, understanding provenance traits is essential for enhancing genetic diversity, breeding efficiency, and localized improvement of plantations [24]. Provenance effects may result in superior growth rates and adaptability, but can also lead to slower growth, reduced resistance to pests and diseases, and even growth decline [25,26]. However, with global warming, many climate zones will be impacted by climate change [27,28]. For Chinese fir, long-term selection has led to diverse provenances with a geographically “multi-center origin” distribution pattern [29]. Therefore, selecting well-adapted Chinese fir provenances according to the environmental needs of the plantation site is crucial for improving productivity and ecological adaptability, providing a theoretical foundation for early-stage breeding, and enhancing the efficiency of hybridization [30]. Currently, the Chinese fir breeding program is in its fourth breeding cycle, which focuses on the selection and establishment of fourth-cycle breeding populations [18]. Likewise, the phenotypic variation of multiple biological traits in Chinese fir is largely influenced by climatic differences across its geographical range [10,31].
Chinese fir plantations have been facing challenges such as reduced biodiversity, decreased soil strength, and poor ecological performance [32]. Researchers have studied the growth [31,33], soil conditions of plantation sites [2,34], wood properties [35], and functional traits [32,36] of various Chinese fir provenances. However, there is still insufficient research on selecting and reserving superior Chinese fir provenances that are highly adaptive, fast-growing, and exhibit balanced biomass allocation. The main aim of this study is to identify and evaluate highly adaptive, fast-growing Chinese fir provenances with optimal biomass allocation to support sustainable breeding and forest resource utilization. Specifically, we hypothesize that (1) different provenances exhibit significant variation in growth performance, biomass allocation, and wood properties under subtropical climate conditions, and (2) certain provenances will demonstrate superior adaptation, characterized by higher basal area increment (BAI), optimal latewood percentage, and balanced biomass distribution.
To test these hypotheses, this study sampled tree cores from six Chinese fir provenances across different subtropical climate zones in China’s gene bank, collecting multi-year growth data and earlywood and latewood traits non-destructively. Through growth equation fitting, BAI estimation, latewood percentage calculation, and biomass estimation, we comprehensively analyzed each provenance’s growth characteristics, productivity, and biomass allocation strategies, identifying high-adaptation, fast-growing provenances with optimal biomass distribution. This research highlights the role of provenance selection in the sustainability and genetic improvement of Chinese fir plantations. It aims to provide scientific evidence for genetic enhancement, resource efficiency, and quality improvement, filling the gap in fast growth and biomass balance. The selected provenances are expected to offer high-quality breeding stock, supporting sustainable breeding and resource use.

2. Materials and Methods
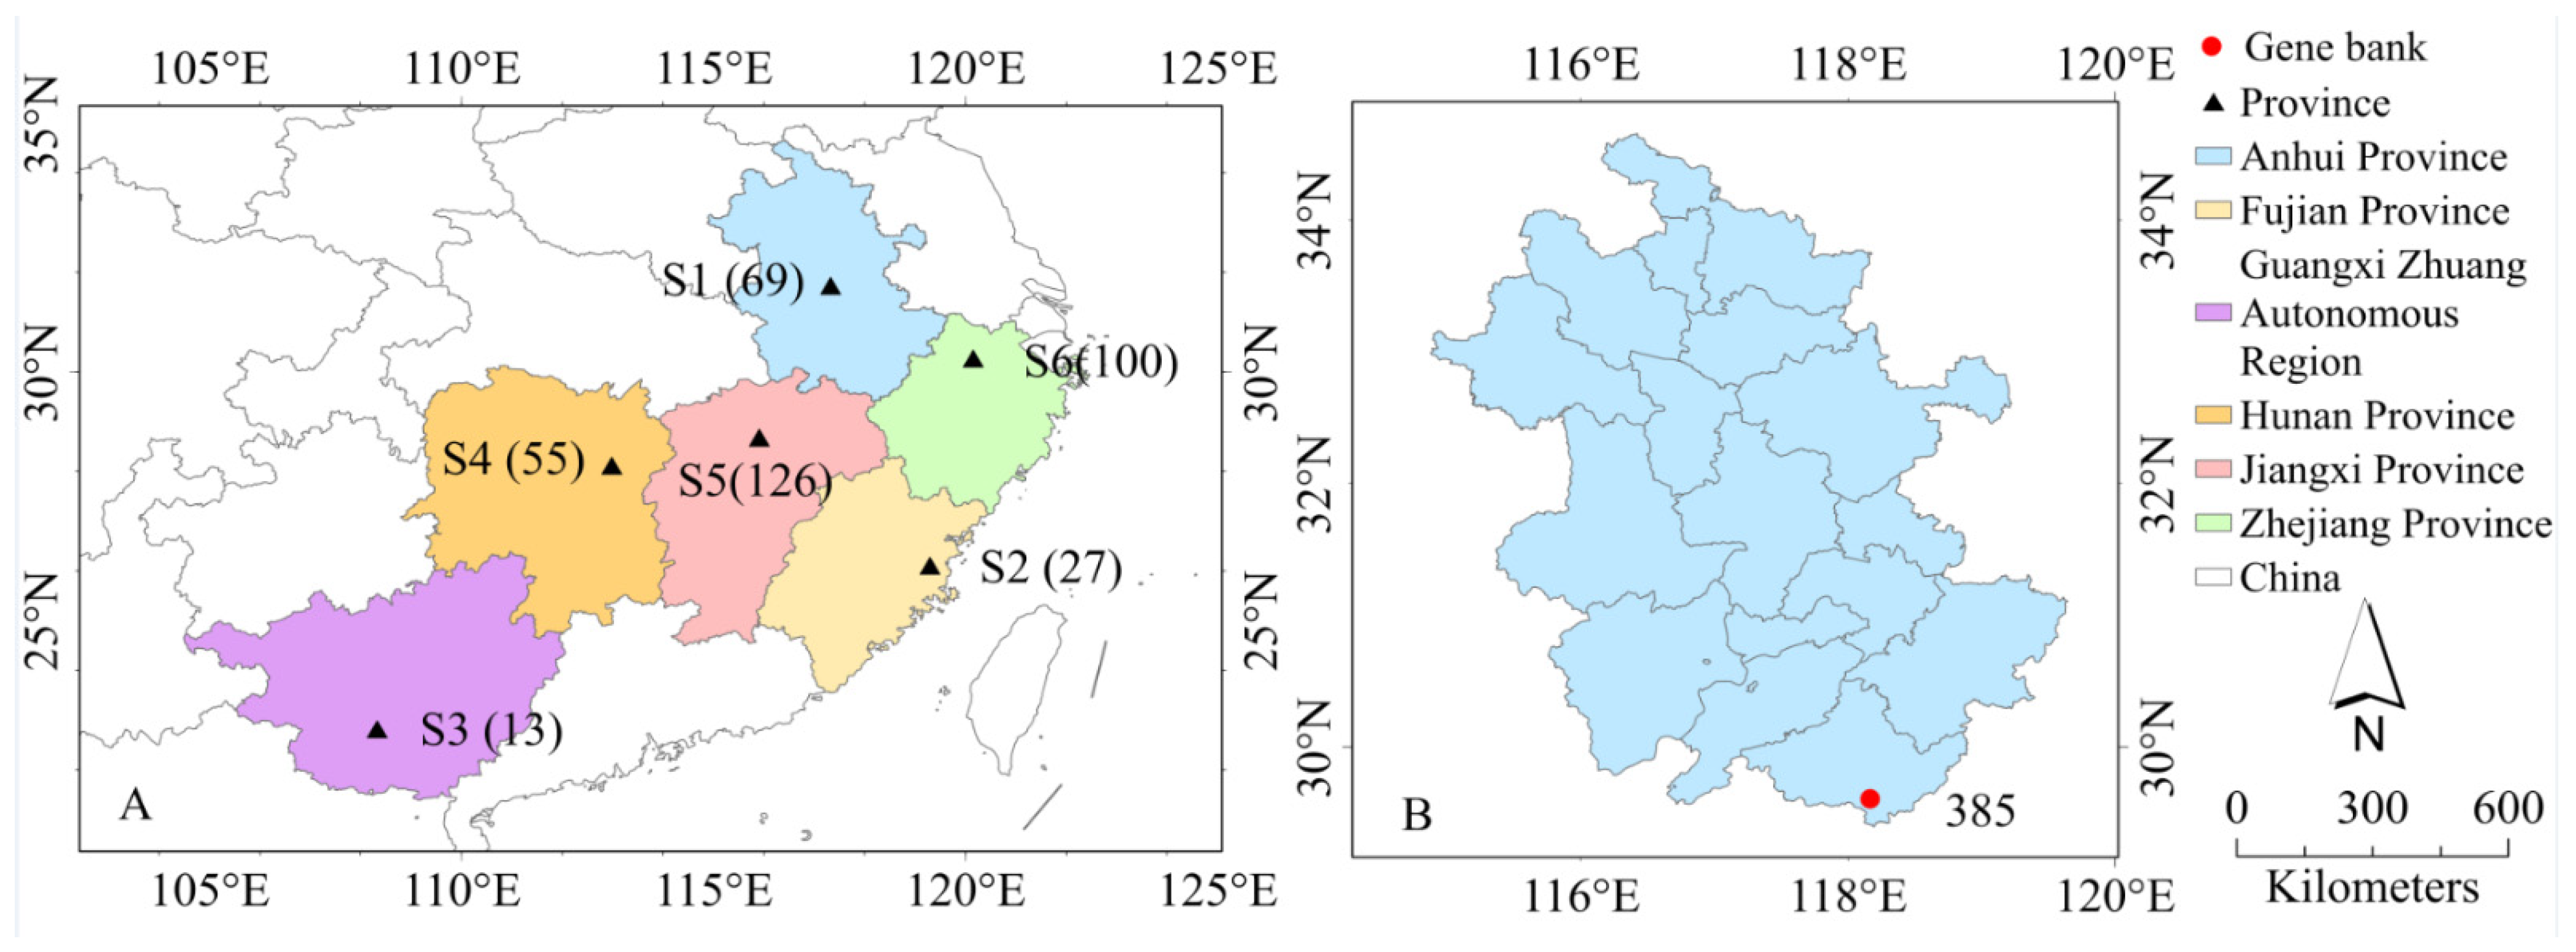
2.1. Test Materials

The test material was obtained from the first-generation C. lanceolata experimental forest (gene bank) at Xitian Forest Farm, Xiuning County, Anhui Province (29°36′21.19″ N, 118°9′59.98″ E). This gene bank has collected six Chinese fir provenances, and the current age of the trees is at least 26 years old. To select superior provenances for the next generation of hybridization, we need to evaluate the past performance of this gene bank. Therefore, we selected all existing Chinese firs in the gene bank. A total of 385 trees, representing six different provenances, were sampled (Figure 1A). The age of the trees ranged from 26 to 40 years. The six provenances are from Anhui Province (S1), Fujian Province (S2), Guangxi Province (S3), Hunan Province (S4), Jiangxi Province (S5), and Zhejiang Province (S6) in China. The number of trees counted from each provenance were as follows: S1, 69 trees; S2, 27 trees; S3, 13 trees; S4, 55 trees; S5, 126 trees; S6, 100 trees. Except for S1, which is located in a temperate monsoon climate zone, all other provenances are in a subtropical monsoon climate zone. Basic information of the Chinese fir gene bank at Xitian Forest Farm is shown in Figure 1B and Table 1.
Figure 1. Distribution map of Chinese fir provenances and test sites. (A) shows the geographical locations of the six provenances of Chinese fir in China, with the number of samples collected for each provenance in brackets. (B) shows the geographical location of the test site in Xitian Forest Farm, Xiuning County, Anhui Province, China. The number of test materials are 385 plants. The legend, compass, and scale are on the right. Provenances: S1: Anhui Province; S2: Fujian Province; S3: Guangxi Province; S4: Hunan Province; S5: Jiangxi Province; S6: Zhejiang Province. The characteristics regarding temp., elevation, precip., soil type, and other relevant factors are presented in Table 2, from https://climatecharts.net/ (accessed on 6 April 2025).
Forests 16 00687 g001
Table 1. Information of Chinese Fir Gene Bank.
SiteCharacteristics of StandCharacteristics of ClimateSoil Environment
(0–40 cm)
Xitian Forest Farm, Xiuning County, Anhui Province, ChinaFCArtificial pure forestTCNorth subtropical humid monsoon climateTSRed-yellow soil
MMP1613 mmpH6.2
ATSince 1965AAT16.3 °CSC12%
FP230 dTN5.29 mg·g−1
SD4 m × 4 mLD1937.42 hTP0.83 mg·g−1
RAH72%–81%OM36.38 mg·g−1
Main Vegetation
under the Forest
Loropetalum chinense, Rhododendron simsii, Eurya japonica, Actinodaphne nantoensis, Lespedeza bicolor; Rhus chinensis, Buxus sinica, Cyathea spinulosa, Zoysia japonica, Miscanthus floridulus, Setaria viridis, and Houttuynia cordata et al.
FC: Forest classification; AT: Afforestation time; SD: Stand density; TC: Type of climate; MMP: Mean annual precipitation; AAT: Annual average temperature; FP: Frost-free period; LD: Light duration; RAH: Relative air humidity; TS: Type of soil; SC: Stone content; TN: Soil total nitrogen content; TP: Soil total phosphate content; OM: Soil organic matter cintent.
Table 2. Information on climate and environmental factors in different provenances. The data in the table are the annual mean.
ProvenancesClimate Type ElevationTemp.Precip.Frost-Free
Period
Sunshine DurationSoil Type
S1Transitional areas between warm temperate and subtropical120 m16.3 °C1784.2 mm235 d1900 hYellow-brown soil, paddy soil, and red soil
S2Subtropical marine monsoon climate500 m19.0 °C1833.7 mm295 d1850 hRed soil and latosolic red soil
S3Subtropical monsoon climate225 m18.8 °C1540.2 mm300 d1600 hRed soil, yellow soil, and latosol
S4Continental subtropical monsoon humid climate543 m15.7 °C1463.3 mm290 d1550 hRed soil, paddy soil, yellow soil, and fluvo-aquic soil
S5Warm and humid monsoon climate in central subtropical355 m19.8 °C1674.1 mm275 d1800 hRed soil, yellow soil, and paddy soil
S6Subtropical monsoon humid climate410 m16.6 °C1478.2 mm255 d1950 hRed soil, yellow soil, and paddy soil

2.2. Data Collection

From September to October 2014, the DBH of 385 trees was measured individually using a tape measure (YM-CL001, Yuma Tools Co., Ltd., Zhengzhou, China). At the same time, tree cores were extracted from the 385 sample trees using a growth increment borer with an internal diameter of 5.15 mm (Haglof, Sweden). The sampling location was 1.3 m (chest height), with one core taken in the east–west direction and another in the north–south direction for each tree. The tree cores were then placed in labeled straws and transported to the laboratory for processing. The collected samples were fixed in specially designed wooden trays, naturally air-dried, and then sanded step by step using sandpaper with 120, 240, and 600 grit. The sanded tree cores were cross-dated, and the annual ring widths of each core were measured using the LINTAB tree-ring width measurement system (RINNTECH, Heidelberg, Germany), with a measurement accuracy of 0.001 mm. The accuracy of the visual dating for all samples was then checked using the COFECHA program (version 6.06 P) [37]. Based on the COFECHA test results, the final dataset included the tree-ring width data for all 385 trees, which consisted of age, ring width, and early- and latewood width.
The calculation of tree height is estimated using the formula provided by the local forest farm:
H = 0.01867 + 1.085 × D B H 0.01831 × D B H 2

2.3. Growth Equations and the Fast-Growth Periods

After organizing the data for each provenance, the logistic growth equation was fitted with DBH as the dependent variable and age as the independent variable [38,39]. The logistic growth equation is as follows:
D B H = a 1 + b e c A G E
In the equation, DBH represents the diameter at breast height, AGE represents the age, and a, b, and c are the coefficients in the logistic growth equation.
RMSE (root mean square error) measures the degree of difference between the observed values and the model’s predicted values, AIC (Akaike information criterion) represents the goodness of fit of the model, TRE (mean relative error) measures the magnitude of the model’s prediction error, and MAE (mean absolute error) measures the average absolute difference between the observed values and the model’s predicted values. In these indicators, smaller values indicate a better model fit. The formulas for these four indicators are as follows [40]:
R M S E = i = 1 n ( y i y i ^ ) 2 n
A I C = 2 log L + 2 k
M A E = i = 1 n y i y i ^ n
T R E = i = 1 n ( y i y i ^ )
In the formulas, y i represents the observed values, y i ^ is the model’s predicted value, n is the sample size, L is the likelihood function value of the model, and k is the number of parameters in the model.
The starting point (ta) refers to the time when the growth rate reaches its maximum value, indicating the period of fastest growth. The DBH at the starting point is denoted as (ga). The key point (ti) refers to a significant time point on the growth curve, typically where the growth rate changes significantly. Key points can be used to identify changes in the growth stage or growth characteristics of an organism. The DBH at the key point is denoted as (gi). The ending point (td) refers to the time when the growth rate reaches its minimum value, usually indicating the period when the growth rate begins to decline. The DBH at the ending point is denoted as (gd). The fast-growth duration ΔT is the time span between the starting point and the ending point, representing the period of higher growth rate. This can be used to assess the rapid growth phase of an organism during the growth process. The formula for calculating the fast-growing period is as follows [41]:
( t a , g a ) = l n b ( 2 3 ) c , a ( 3 3 ) 6
( t i , g i ) = l n b c , a 2
( t d , g d ) = l n b ( 2 + 3 ) c , a ( 3 + 3 ) 6

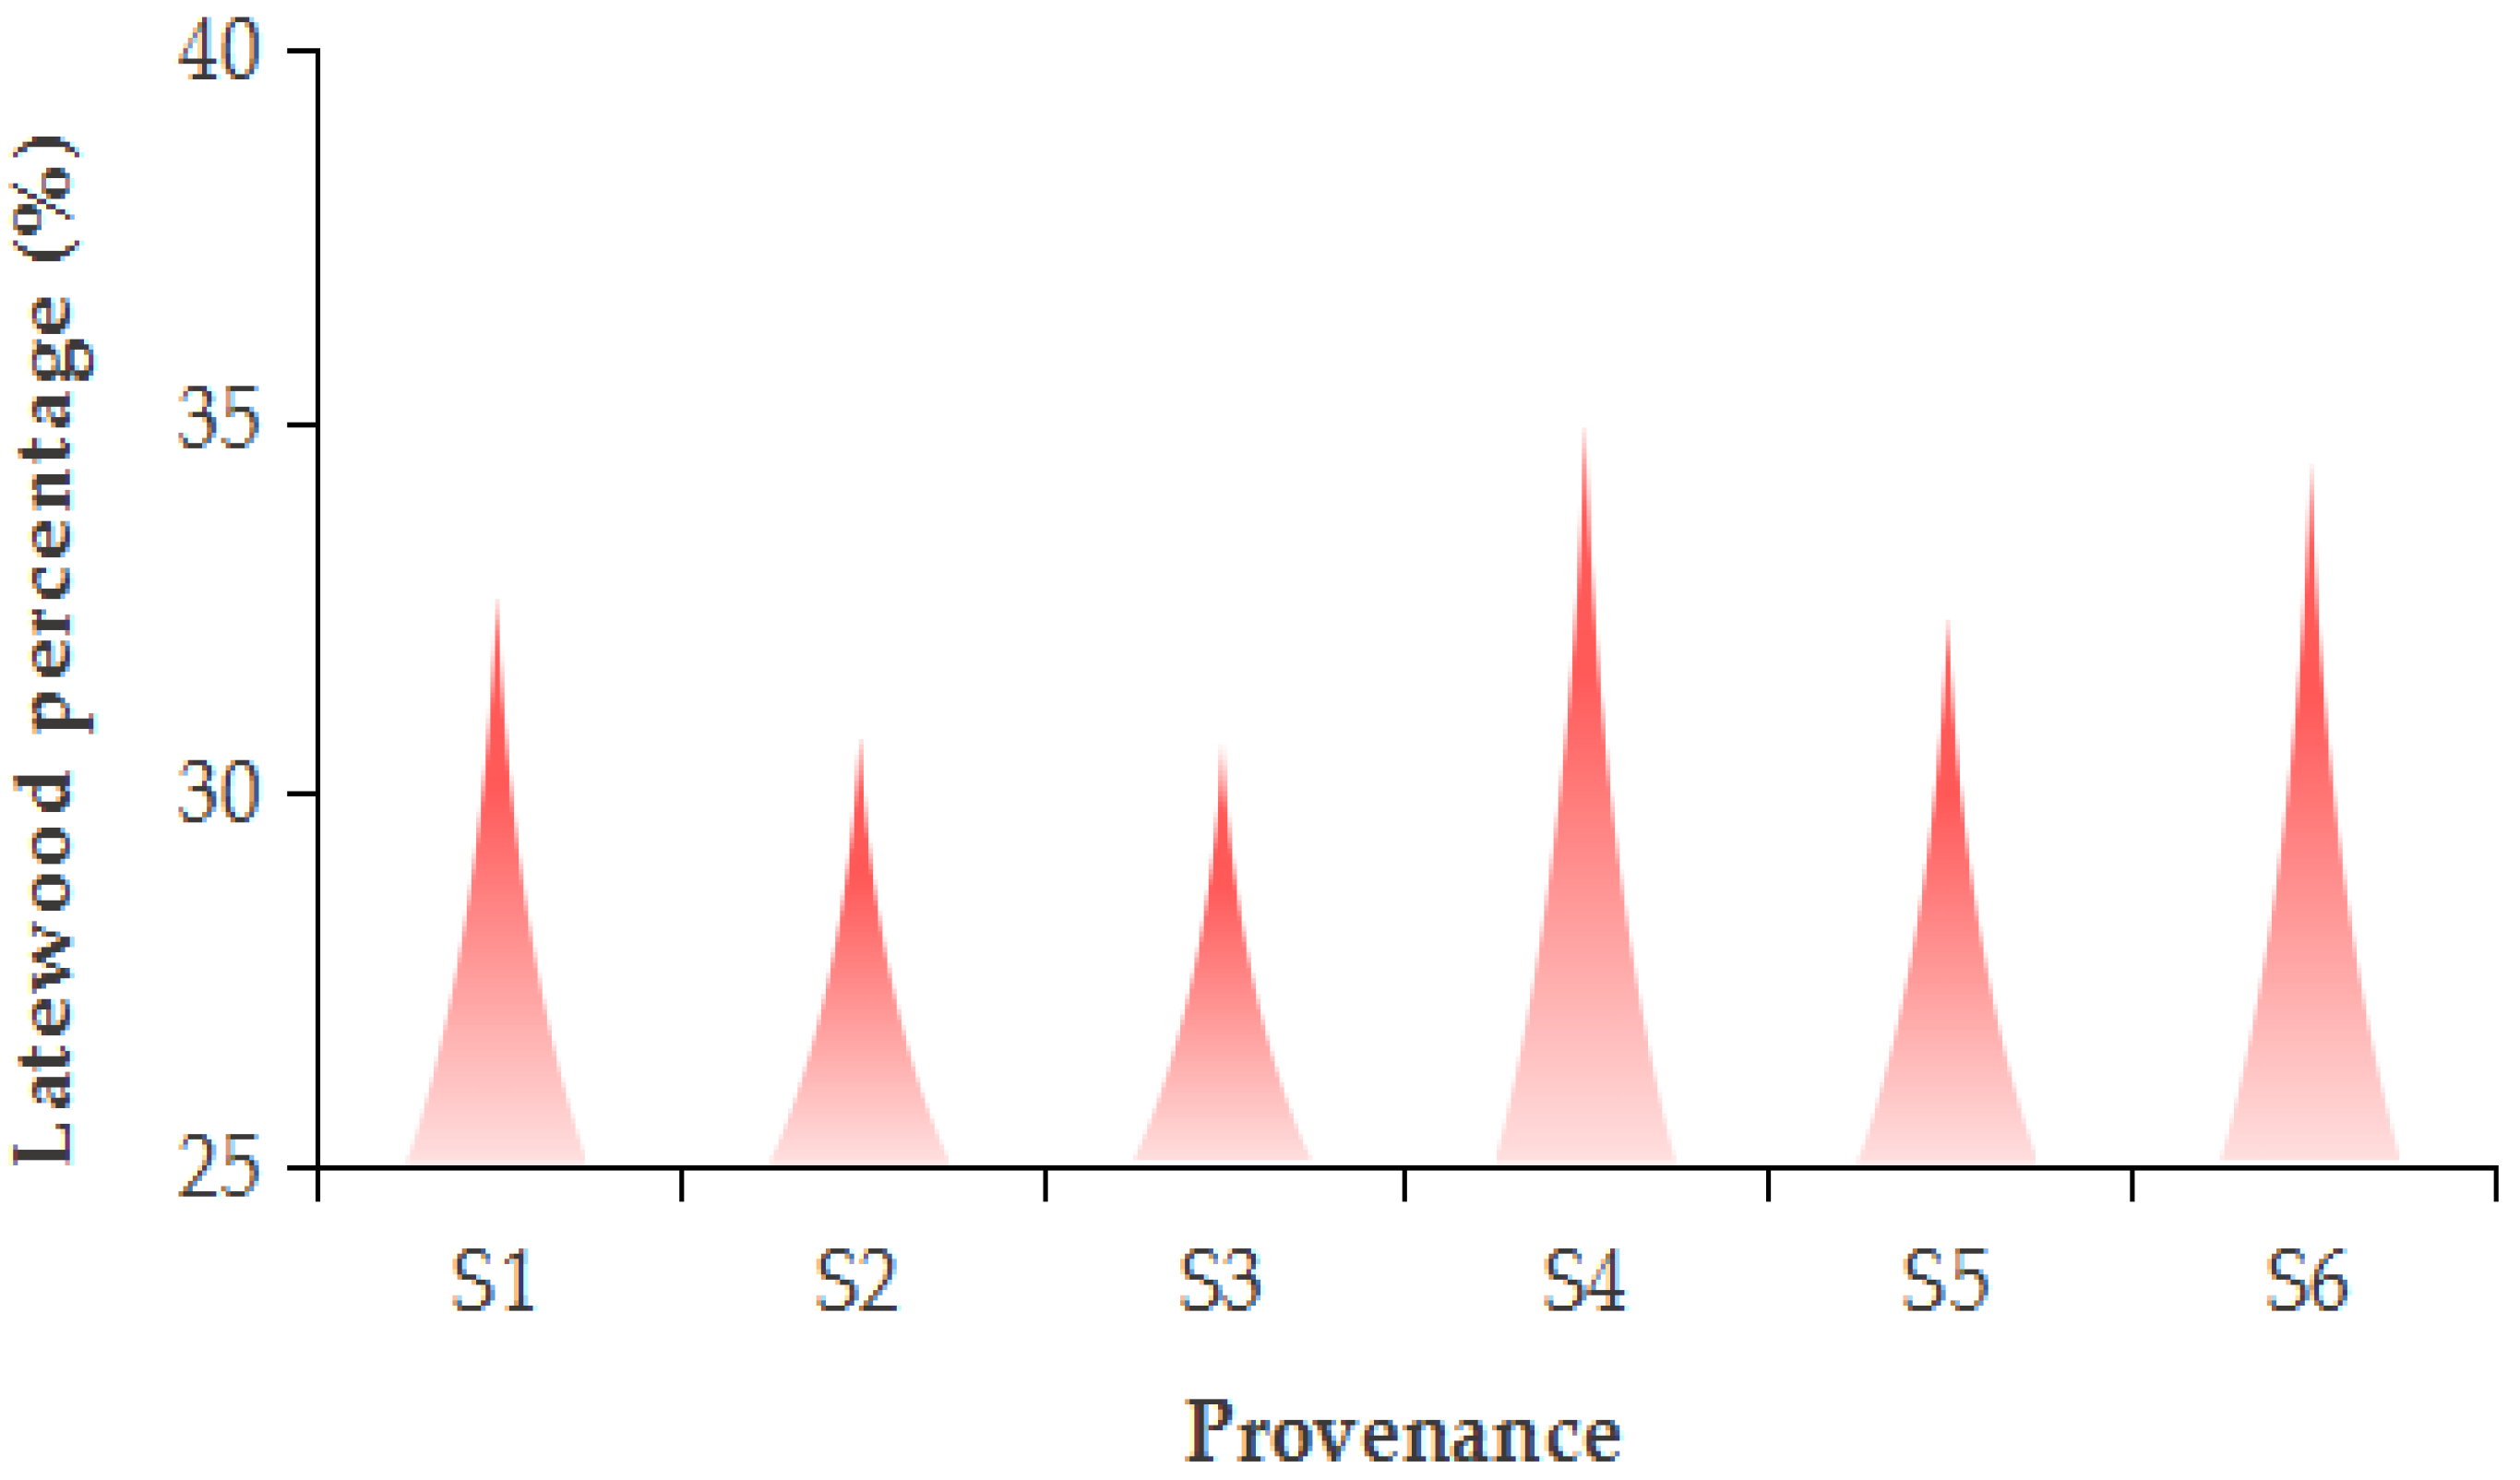
2.4. BAI and Latewood Percentage

BAI (basal area increment) refers to the increase in basal area, which is commonly used to assess tree growth rate and represents the productivity of an individual tree [42]. The formula is as follows:
B A I A G E = π ( D B H A G E 2 ) 2 π ( D B H A G E 1 2 ) 2
Latewood Percentage refers to the percentage of latewood in a tree’s annual rings, and it is commonly used to study the effects of tree growth conditions and wood properties [43]. The formula for calculating latewood percentage is as follows:
R L = W L W E + L
where R L is the latewood percentage, W L is the total width of the latewood, and W E + L is the total width of the annual ring. The latewood percentage is typically expressed as a percentage and reflects the proportion of latewood in the annual ring.

2.5. Biomass and Root-Shoot Ratio

The biomass was estimated using the 2024 general biomass model for Chinese fir [44], which is the latest biomass model of Chinese fir in subtropical China, summarized based on four provinces: Guangxi, Sichuan, Jiangxi, and Fujian [45]:
W T r u n k = 0.0221 ( H × D B H ) 1.4157
W B r a n c h = 0.0012 D B H 2.9049
W L e a f = 0.003 D B H 2.5212
W R o o t = 0.031 D B H 2.1986
W t o t a l = W T r u n k + W B r a n c h + W L e a f + W R o o t
R s = W R o o t W T r u n k + W B r a n c h + W L e a f
where W T r u n k is the biomass of the barked stem, W B r a n c h is the biomass of the branches, W L e a f is the biomass of the leaves, W R o o t is the biomass of the roots, W t o t a l is the total biomass, and R s is the root-shoot ratio.

3. Results

3.1. Growth Equations of DBH Across Different Provenances

Logistic growth equations were established for the six provenances (Table 3). The growth equations for different provenances had R2 values of ≥0.67, indicating good model fit. The RMSE ranged from 2.83 (S3) to 4.68 (S1), AIC from 1787.44 (S3) to 22,795.11 (S5), TRE from 12.99 (S3) to 21.61 (S1), and MAE from 2.18 (S3) to 3.62 (S1). The parameter ranges for the six provenances were as follows: a: 23.12–32.55, b: 3.83–4.72, c: 0.11–0.17. The maximum growth value was highest for S2 (33 cm) and lowest for S6 (23 cm), with the others around 26 cm. Growth rates were lowest for S2 (0.11), relatively low for S1 and S4 (0.14), higher for S5 and S6 (0.16–0.17), and highest for S3 (0.17).

3.2. Comparison of Fast-Growth Period

Based on the fitted equations, the fast-growth period for each growth equation was calculated (Figure 2, Table 4). The starting point (ta), key point (ti), and ending point (td) of the fast-growth period are crucial for assessing the growth rate and stages. We found that there are some differences in the fast-growth periods across different provenances, but the overall trends are similar. The fast-growth period starts between the 2nd and 4th years, with the key point occurring between the 9th and 14th years. The fast-growth period ends between the 33rd year (S3) and the 51st year (S2). The ΔT is more than 30 years for all provenances, with the shortest ΔT being 30 years (S3) and the longest being 47 years (S2). Trees from different provenances show significant differences in growth rate and final DBH. For S1 and S3, DBH increases rapidly between the ages of 10–20 years and stabilizes after the age of 30. For S2, the initial growth is slower, but DBH increases rapidly between 14–50 years, showing a prolonged growth stage. For S4 and S5, the growth pattern is similar, with fast growth starting around the age of 10, stabilizing between 30–40 years. For S6, the initial growth is earlier, but DBH growth rate is slower, and the final stabilized DBH is also relatively lower.

3.3. The BAI and Latewood Percentage of Different Provenances

Figure 3 shows the variation in basal area increment (BAI) over 40 years for different provenances. Around year 10, the BAI of all provenances reached its maximum value, after which it declined with age, except for S2. The BAI variation patterns across the provenances were significantly different. S1 grew rapidly before 10 years, peaked between 10 and 20 years, and then stabilized. S2 was relatively stable with larger fluctuations before 20 years, but after 20 years, the BAI increased significantly and remained high until 40 years. S3 was similar to S1 but showed more fluctuation in BAI, with no clear stabilization phase. S4 continuously increased until it peaked at 15 years, then gradually decreased, showing a typical “increase then decrease” growth pattern. S5 grew rapidly in the early years, peaked around 10 years, then gradually declined, but showed a slight increase around 30 years before decreasing again. S6 was similar to S4, peaking in early years and then gradually declining, with BAI remaining relatively stable throughout this 40 years.
Figure 4 shows the latewood percentage for different provenances. The results indicate that there are differences in latewood percentage among the provenances, but it generally ranges between 30% and 35%. Compared to others, S4 (34.92%) and S6 (34.38%) have higher latewood percentages, which are 7.02% and 7.94% higher than S1 and S5, respectively, and 5.36% and 6.28% higher. The latewood percentages for S2 and S3 are relatively lower, at 30.61% and 30.74%, respectively.

3.4. Biomass of Different Provenances

Figure 5 shows the growth curves of total biomass over time for different provenances. The trends among the provenances are mostly similar, with some differences in a few. Within 40 years, S2 shows the fastest biomass growth, particularly after 30 years, where a steeper growth trend is observed. In contrast, S6 exhibits the slowest growth, with the growth rate slowing down significantly after 30 years. The remaining provenances (e.g., S1, S3, S4, and S5) show similar patterns in biomass growth.
Table 5 shows the changes in root, branch, leaf, and stem biomass every ten years. From 0 to 10 years, biomass is generally low across all provenances, with S1 and S5 having slightly higher biomass, and S6 the lowest. From 11 to 20 years, biomass increases significantly, especially in the stem section, which takes the largest proportion in all provenances. S5 has the highest stem biomass (60.83 kg), while S6 has the lowest (46.09 kg). From 21 to 30 years, biomass in roots, branches, leaves, and stems continues to increase, and the differences between provenances become more pronounced. S2 has the highest stem biomass (98.55 kg), showing strong growth advantages, while S6′s biomass remains lower (75.32 kg). From 31 to 40 years, biomass growth accelerates further, with S2′s stem biomass significantly higher than other provenances (146.13 kg), showing remarkable growth potential. S6 still has the lowest biomass, with a small increase (91.86 kg).

3.5. The Root/Shoot Ratio of Different Provenances Changes with Age

Figure 6 shows the changes in the root/shoot ratio of different provenances over 40 years. Overall, the root/shoot ratio of the Chinese fir first increases, reaches a peak, then slows down and remains stable within a certain range before starting to decline significantly. There are notable differences in the changes in root/shoot ratio between the provenances. S1 increases from 0 to 15 years, then slightly decreases from 15 to 20 years, remains stable from 20 to 30 years, and starts to decline after 30 years. S2 continues to increase from 0 to 18 years, then shows a continuous downward trend. S3 increases from 0 to 10 years, remains stable from 10 to 20 years, and continues to decline after 20 years. S4 increases from 0 to 15 years, remains stable from 15 to 20 years, and declines after 20 years. S5 increases from 0 to 15 years and then continuously declines after 15 years. S6 grows rapidly from 0 to 20 years, remains stable from 20 to 30 years, and declines after 30 years.

4. Discussion

Large-scale tree planting is considered an important strategy for mitigating climate change and its impacts, making it urgent to plant tree species that can adapt to future climates [4,46]. Differences between provenances in plant growth are often attributed to factors such as geographic conditions [47], environmental adaptability [48], and genetic background [30]. This study shows significant differences between different provenances of Chinese fir in terms of DBH growth characteristics, fast-growth period, BAI, biomass, and latewood percentage. This result further verifies the provenance variation in growth patterns, resource allocation strategies, and wood quality among different provenances of Chinese fir [31]. Additionally, in terms of DBH growth characteristics, we found that the fast-growth period of Chinese fir from different provenances exhibits a clear phase: the fast-growth period typically starts between the 2nd and 4th year, peaks between the 9th and 14th year, and gradually stabilizes between the 35th and 51st year. The identification of the fast-growth period provides a basis for the management of plantation thinning and harvesting [49]. The S2 provenance has the longest fast-growth period, showing a sustained growth advantage. In contrast, the S3 and S5 provenances have shorter fast-growth periods, making them more suitable for use for early thinning or harvesting [50]. S1 and S4 have moderate growth rates, with their fast-growth periods ending between the 35th and 40th years. The S6 provenance has a short fast-growth period and the slowest growth, with overall lower potential. This finding will provide scientific guidance for future provenance selection and high-quality breeding efforts.
BAI can accurately reflect the vitality and growth of trees over time, revealing important indicators such as growth stages, productivity differences, and growth stability of forest stands [51,52]. In this study, the BAI analysis of different provenances showed significant differences in productivity, especially for the S2 provenance, which maintained a high BAI over a longer period, demonstrating a sustained growth advantage. This could be related to environment–growth relationships that are influenced by other factors, such as the specific forest site quality of the provenance [53]. The BAI of S6 was at the lowest level, consistent with its poorer growth condition. For all other provenances, BAI peaked around the 10th year and then declined with increasing age. We observed that the BAI of the S2 and S3 provenances often exhibited larger fluctuations, which could be caused by growth release due to environmental stimuli [54]. And no such sensitivity was observed in the remaining provenances.
Latewood percentage refers to the proportion of latewood in the tree rings relative to the entire ring [55]. Latewood typically has a higher density, which can influence the mechanical properties and uses of wood, and is therefore often associated with wood quality [56,57]. Thus, latewood percentage can guide species selection strategies in artificial forest establishment to optimize yields. In this study, the latewood percentage in the Chinese fir was 30%–35%, which is relatively low compared to other species. This result is similar to the findings for Masson pine (Pinus massoniana) in southern China [42]. The S4 and S6 provenances had higher latewood percentages, suggesting that their wood density and strength may be higher, making them suitable for applications requiring high durability [58]. In contrast, S2 and S3 had lower latewood percentages, possibly making them more suitable for applications that require lighter wood. These results highlight significant differences among the provenances of Chinese fir, providing valuable reference information for selecting and using Chinese fir provenances. Therefore, the variation in latewood percentage among different provenances indicates differences in wood quality and suitability for various applications. Based on the requirements for specific uses, appropriate provenances with the desired latewood percentage can be selected to optimize wood utilization.
The total biomass of a tree refers to the accumulated living organic matter in its various organs (roots, stem, branches, and leaves) over any given time period (such as 1 year, 10 years, 100 years, or even longer) [59]. Biomass is an important indicator for measuring tree growth and ecological productivity, reflecting the tree’s growth status under different environmental conditions [60]. Studying the growth trends of total biomass and provenance differences helps understand the adaptability of different provenances in specific environments [61]. The greater the biomass accumulation rate, the greater the tree’s growth potential and environmental adaptability [62,63]. We found that the total biomass of the S2 provenance showed significant growth differences compared to other provenances, indicating that the S2 provenance exhibited the strongest growth potential. As the trees aged, the total biomass of S2 continued to increase at the relatively highest rate, with a significant rise after 20 years, reaching the highest level among all provenances, demonstrating its good adaptability to the growth environment. This is similar to the findings of Wang et al. [11]. In contrast, the biomass accumulation of the S6 provenance was relatively low, stabilizing after 30 years. This may be due to the provenance’s inherent genetic adaptability or environmental factors limiting its growth potential [64,65], indirectly suggesting a growth decrease.
In mature trees, the stem mainly supports the structure and transports water and nutrients, playing a significant role in timber production and carbon storage [66]; the root system is responsible for absorbing water and minerals while also supporting and anchoring the tree, reflecting the ability to adapt to soil conditions [67]; the branches provide support for the leaves and transport photosynthetic products, which can influence crown expansion, light capture, and growth efficiency [68]; the leaves are the primary organs for energy production and are closely related to photosynthetic productivity [69]. Studying the biomass allocation characteristics of various organs, especially under different age conditions [70], helps understand the growth patterns and ecological adaptation strategies of different provenances [71,72]. Furthermore, in the plant life cycle, the presence of resource trade-offs (the “functional balance hypothesis”) is believed to be caused by interspecific variation in functional traits and resource allocation strategies, where plants tend to allocate carbon to the most limiting organs to enhance the acquisition of the most limiting resources [73,74]. In this study, during the 0–20 years stage, biomass in various sources is mainly concentrated in the stem and root systems, reflecting that early growth in Chinese fir primarily invests resources in structural support and nutrient absorption, which is consistent with the findings of [75]. As age increases, biomass accumulates in all organs, but the stem still maintains the largest proportion, followed by the root, indicating that these two organs always dominate biomass allocation.
The root/shoot ratio, as a key indicator of tree resource allocation, can reflect how trees distribute resources to maintain the growth balance between the aboveground and belowground parts during specific growth stages or environmental conditions [76]. In this study, the root/shoot ratio of six provenances gradually increased during the first 20 years of growth, reached a peak, and then decreased, further verifying that trees prioritize resource allocation to the roots in the early growth stages to support water and nutrient absorption [77]. As the trees age, more resources are gradually allocated to aboveground structures and photosynthetic organs [78]. However, there are significant differences in the timing and extent of peak values and declines between the provenances, indicating that resource allocation strategies vary by provenance [79]. The S3 provenance reached the highest peak and the earliest peak, suggesting that S3 has the ability to establish roots more quickly in the early stages. The S2 provenance had a relatively low root/shoot ratio throughout its growth, with an early peak followed by a gradual decline, which may reflect its greater focus on aboveground growth, possibly due to its root system’s higher resource use efficiency [80]. The trends for other provenances were relatively similar, with peak values occurring between 10–20 years, indicating that their root and aboveground growth were more balanced. Provenances like S3, with a high root/shoot ratio, may have the ability to adapt to poorer soils, while provenances like S2, with a low root/shoot ratio, may have greater potential for fast growth.
In conclusion, the growth differences reflect the varying adaptation abilities of different Chinese fir provenances to growth pace and the length of growth stages. Potential environmental factors at the provenance site (such as soil [81], temperature [82], photoperiod [83], and precipitation [84]) may influence their performance in foreign environments. These factors likely cause genetic variations, leading to differences in growth periods and resource trade-offs among provenances. Soil warming modifies the morphological traits and biomass allocation strategies of fine roots in Cunninghamia lanceolata plantations [85]. Additionally, climate change significantly increases the asynchrony between the aboveground and belowground phenology of Chinese fir, notably shortening the duration of growth for both aboveground and belowground parts. This alteration may result in a temporal decoupling of nutrient demand and supply within Chinese fir plantations [86]. Future breeding programs can further utilize these growth characteristic differences, such as selecting early-maturing provenances to accelerate hybridization and the selection of fast-growing Chinese fir provenances for early thinning targets, while slow-growing provenances could be suited for later clear-cut targets. Such differentiated configurations not only help enhance the genetic diversity of plantations and reduce the risk of pests and diseases but also increase the complexity of canopy structures and improve the microclimate, thereby optimizing light resource utilization. Specifically, it might be worth considering the combination of S3 and S2 to obtain offspring with good complementarity (i.e., hybrid vigor) for plantation configuration, thus optimizing the future productivity and ecological benefits of Chinese fir plantations. Certainly, based on these efforts, we must thoroughly consider and enhance the adaptability of these seed sources to various environmental factors during their growth process, including fluctuations in climate, soil physicochemical properties, and precipitation levels. This approach aims to achieve the conservation and sustainable development of Chinese fir resources.

5. Conclusions

Notable differences were observed among the different Chinese fir provenances in terms of DBH growth characteristics, fast-growth periods, latewood percentage, biomass, and root-shoot ratio. The DBH growth rate of S1 and S4 provenances was slower, with a longer rapid growth period. Their BAI peaked around the 13th year and gradually declined thereafter. The stem biomass was relatively low, and the latewood percentage was high, indicating potential for cultivating high-density wood for long rotation periods. S2 had the longest fast-growth duration and the highest growth potential (reaching 32 cm), with a sustained high BAI, the largest biomass in all organs, and more efficient root support for the continued growth of the aboveground parts. It had the lowest latewood percentage and showed potential for cultivating fast-growing wood for long rotation periods. S3 and S5 also showed fast-growth rates, but their fast-growth durations were shorter. Their BAI patterns were similar to those of S1 and S4, but with greater fluctuations. They had higher biomass, and after the 20th year, the aboveground parts gradually became dominant, showing potential for cultivating fast-growing Chinese fir with shorter rotation periods. S6 had a moderate rapid growth period but the lowest DBH growth rate, with low BAI levels and the lowest biomass in all organs. The root/shoot ratio remained high after 30 years, and the latewood percentage was higher. The S6 provenance exhibited lower growth potential, and its performance in other soil conditions or its resistance to pests and diseases will be further investigated to explore its application potential.

Author Contributions

Z.W. and N.L. contributed equally to this work. Conceptualization, Z.W. and N.L.; methodology, N.L. and C.L.; software, N.L., C.G. and M.Z.; validation, Z.W., N.L. and C.L.; formal analysis, C.L., M.Z. and L.Y. (Lingyu Yang).; investigation, L.Y. (Lingyu Yang)., L.Y. (Liangjin Yao), C.G. and X.Z.; resources, Z.W. and C.L.; data curation, N.L. and C.L.; writing—original draft preparation, Z.W. and N.L.; writing—review and editing, Z.W., N.L. and C.L.; visualization, C.L.; supervision, C.L.; project administration, Z.W. and M.Z.; funding acquisition, Z.W. All authors have read and agreed to the published version of the manuscript.

Funding

This study was supported by the Anhui Forestry Scientific Research Innovation Project (Grant No. 2022016).

Data Availability Statement

The data presented in this study are available upon request from the corresponding author.

Conflicts of Interest

The authors declare no conflicts of interest.

References

  1. Hu, S.; Li, Y.; Chang, S.X.; Li, Y.; Yang, W.; Fu, W.; Liu, J.; Jiang, P.; Lin, Z. Soil autotrophic and heterotrophic respiration respond differently to land-use change and variations in environmental factors. Agric. For. Meteorol. 2018, 250, 290–298. [Google Scholar] [CrossRef]
  2. Guo, J.; Feng, H.; Roberge, G.; Feng, L.; Pan, C.; McNie, P.; Yu, Y. The negative effect of Chinese fir (Cunninghamia lanceolata) monoculture plantations on soil physicochemical properties, microbial biomass, fungal communities, and enzymatic activities. For. Ecol. Manag. 2022, 519, 120297. [Google Scholar] [CrossRef]
  3. Cheng, K.; Yang, H.; Tao, S.; Su, Y.; Guan, H.; Ren, Y.; Hu, T.; Li, W.; Xu, G.; Chen, M.; et al. Carbon storage through China’s planted forest expansion. Nat. Commun. 2024, 15, 4106. [Google Scholar] [CrossRef] [PubMed]
  4. Xu, W.; Shrestha, A.; Wang, G.; Wang, T. Site-based climate-smart tree species selection for forestation under climate change. Clim. Smart Agric. 2024, 1, 100019. [Google Scholar] [CrossRef]
  5. Van Dijk, A.I.J.M.; Keenan, R.J. Planted forests and water in perspective. For. Ecol. Manag. 2007, 251, 1–9. [Google Scholar] [CrossRef]
  6. Farooq, T.H.; Yan, W.; Rashid, M.H.U.; Tigabu, M.; Gilani, M.M.; Zou, X.H.; Wu, P.F. Chinese fir (Cunninghamia lanceolata) a green gold of china with continues decline in its productivity over the successive rotations: A review. Appl. Ecol. Environ. Res. 2019, 17, 11055–11067. [Google Scholar] [CrossRef]
  7. Forest, F.; Moat, J.; Baloch, E.; Brummitt, N.A.; Bachman, S.P.; Ickert-Bond, S.; Ickert-Bond, P.M.; Liston, A.; Little, D.P.; Mathews, S.; et al. Gymnosperms on the EDGE. Sci. Rep. 2018, 8, 6053. [Google Scholar] [CrossRef]
  8. Xiang, W.; Li Xu, L.; Lei, P.; Ouyang, S.; Deng, X.; Chen, L.; Zeng, Y.; Hu, Y.; Zhao, Z.; Wu, H.; et al. Rotation age extension synergistically increases ecosystem carbon storage and timber production of Chinese fir plantations in southern China. J. Environ. Manag. 2022, 317, 115426. [Google Scholar] [CrossRef] [PubMed]
  9. Li, X.; Aguila, L.C.R.; Wu, D.; Lie, Z.; Xu, W.; Tang, X.; Liu, J. Carbon sequestration and storage capacity of Chinese fir at different stand ages. Sci. Total Environ. 2023, 904, 166962. [Google Scholar] [CrossRef]
  10. Ma, X.Q.; Liu, C.J.; Ilvesniemi, H.; Carl, J.W.; Liu, A.Q. Biomass, litterfall and the nutrient fluxes in Chinese fir stands of different age in subtropical China. J. For. Res. 2002, 13, 165–170. [Google Scholar]
  11. Wang, Z.; Zhang, X.; Chhin, S.; Zhang, J.; Duan, A. Disentangling the effects of stand and climatic variables on forest productivity of Chinese fir plantations in subtropical China using a random forest algorithm. Agric. For. Meteorol. 2021, 304–350, 108412. [Google Scholar] [CrossRef]
  12. Wei, X.H.; Blanco, J.A.; Jiang, H.; Kimmins, J.P.H. Effects of nitrogen deposition on carbon sequestration in Chinese fir forest ecosystems. Sci. Total Environ. 2012, 416, 351–361. [Google Scholar] [CrossRef] [PubMed]
  13. Zhang, X.; Cao, Q.V.; Duan, A.; Zhang, J. Self-thinning trajectories of Chinese fir plantations in southern China. For. Sci. 2012, 62, 594–599. [Google Scholar] [CrossRef]
  14. Huang, L.; Liu, J.; Shao, Q.; Xu, X. Carbon sequestration by forestation across China: Past, present, and future. Renew. Sustain. Energy Rev. 2012, 16, 1291–1299. [Google Scholar] [CrossRef]
  15. Chen, X.; Ju, Q.; Lin, K. Development status, issues and countermeasures of China’s plantation. World For. Res. 2014, 27, 54–59. [Google Scholar]
  16. Libby, W.J.; Rauter, R.M. Advantages of clonal forestry. For. Chron. 1984, 60, 145–149. [Google Scholar] [CrossRef]
  17. Kang, X. Cognition and suggestions on some issues related to clonal forestry: Taking poplar as an example. J. Beijing For. Univ. 2017, 9, 1–7. (In Chinese) [Google Scholar]
  18. Zhang, J.; Li, M.; Li, Y.; Liu, L.; Fei, Y.; Cao, G. Effects of mechanical damage treatment on the tillering ability and endogenous hormone content of Chinese fir clones. J. Nanjing For. Univ. 2021, 2, 153–158. (In Chinese) [Google Scholar]
  19. Jing, Y.; Bian, L.; Zhang, X.; Zhao, B.; Zheng, R.; Su, S.; Ye, D.; Zheng, X.; El-Kassaby, Y.A.; Shi, J. Genetic diversity and structure of the 4th cycle breeding population of Chinese fir (Cunninghamia lanceolata (lamb.) hook). Front. Plant Sci. 2023, 14, 1106615. [Google Scholar] [CrossRef]
  20. Qi, M. Achievements, problems and countermeasures of clonal selection and breeding of Chinese Fir in China. World For. Res. 2007, 20, 50–55. (In Chinese) [Google Scholar]
  21. Chen, X.; Li, B. Testing the allometric scaling relationships with seedlings of two tree species. Acta Oecol. 2003, 24, 125–129. [Google Scholar] [CrossRef]
  22. Espinoza, S.E.; Magni, C.R.; Santelices, R.E.; Ivković, M.; Cabrera, A.M. Changes in drought tolerance of Pinus radiata in Chile associated with provenance and breeding generation. Ann. For. Sci. 2016, 73, 267–275. [Google Scholar] [CrossRef]
  23. Kaya, Z.; Lindgren, D. The genetic variation of inter-provenance hybrids of Picea abies and possible breeding consequences. Scand. J. For. Res. 1992, 7, 15–26. [Google Scholar] [CrossRef]
  24. Gao, C.; Liu, C.; Chen, C.; Liu, N.; Liu, F.; Su, X.; Huang, Q. Genetic evaluation of water use efficiency and nutrient use efficiency in Populus deltoides Bartr. ex Marsh. Seedlings in China. Plants 2024, 13, 2228. [Google Scholar] [CrossRef]
  25. Buras, A.; Sass-Klaassen, U.; Verbeek, I.; Copini, P. Provenance selection and site conditions determine growth performance of pedunculate oak. Dendrochronologia 2020, 61, 125705. [Google Scholar] [CrossRef]
  26. Leštianska, A.; Fleischer, P., Jr.; Merganičová, K.; Fleischer, S.P.; Nalevanková, P.; Střelcová, K. Effect of provenance and environmental factors on tree growth and tree water status of Norway spruce. Forests 2023, 14, 156. [Google Scholar] [CrossRef]
  27. Park, A.; Rodgers, J.L. Provenance trials in the service of forestry assisted migration: A review of North American field trials and experiments. For. Ecol. Manag. 2023, 537, 120854. [Google Scholar] [CrossRef]
  28. Hao, Z.; Hao, F.; Singh, V.P.; Zhang, X. Changes in the severity of compound drought and hot extremes over global land areas. Environ. Res. Lett. 2018, 13, 124022. [Google Scholar] [CrossRef]
  29. Xu, R.; Liu, J.; Wang, L.; Yan, Y.; Ma, X.; Li, M. Analysis of root and leaf functional traits and C, N, P stoichiometry of Cunninghamia lanceolate from different provenances. Acta Ecol. Sin. 2022, 42, 6298–6310. [Google Scholar]
  30. O’brien, E.K.; Mazanec, R.A.; Krauss, S.L. Provenance variation of ecologically important traits of forest trees: Implications for restoration. J. Appl. Ecol. 2007, 44, 583–593. [Google Scholar] [CrossRef]
  31. Wang, Y.; Niu, X.; Wang, B. Study on Leaf morphological and stoichiometric traits of Cunninghamia lanceolata based on different provenances. Sustainability 2024, 16, 4236. [Google Scholar] [CrossRef]
  32. Luo, H.; Luo, J.; Feng, H.; Xiao, M.; Yang, S.; Li, Y.; Liu, J.; Li, X. Restoration dynamics of medicinal plant species diversity in Cunninghamia. Agric. Technol. 2024, 30, 35–45. [Google Scholar]
  33. Qu, Y.; Wang, H.; Dean, T.J.; Zhang, J.; Zhang, X. Growth dominance and growth efficiency in response to thinning treatments in Chinese fir plantations with long-term spacing trials. For. Ecol. Manag. 2022, 521, 120438. [Google Scholar] [CrossRef]
  34. Guo, J.; Feng, H.; McNie, P.; Liu, Q.; Xu, X.; Pan, C.; Yan, K.; Feng, L.; Goitom, E.A.; Yu, Y. Species mixing improves soil properties and enzymatic activities in Chinese fir plantations: A meta-analysis. Catena 2023, 220, 106723. [Google Scholar] [CrossRef]
  35. Yan, Y.; Li, B.; He, Z.; Liu, Y.; Li, M.; Yu, X.; Ma, X. Comparative sStudy on wood characteristics of Cunninghamia lanceolata from different provenances. For. Res. 2021, 34, 49–57. [Google Scholar]
  36. Li, B.; Yan, Y.; Zhang, H.; He, Z.; Liu, Y.; Ma, X. Comparison of fine root morphology and carbon and nitrogen content in Chinese fir from different provenances. J. For. Environ. 2019, 39, 561–567. [Google Scholar]
  37. Holmes, R.L. Computer-assisted quality control in treering dating and measurement. Tree-Ring Bull. 1983, 43, 69–78. [Google Scholar]
  38. Dale, V.H.; Doyle, T.W.; Shugart, H.H. A comparison of tree growth models. Ecol. Model. 1985, 29, 145–169. [Google Scholar] [CrossRef]
  39. Shoda, T.; Imanishi, J.; Shibata, S. Growth characteristics and growth equations of the diameter at breast height using tree ring measurements of street trees in Kyoto City, Japan. Urban For. Urban Gree. 2020, 49, 126627. [Google Scholar] [CrossRef]
  40. Zhang, H.; Feng, Z.; Chen, P.; Chen, X. Development of a tree growth difference equation and its application in forecasting the biomass carbon stocks of Chinese forests in 2050. Forests 2019, 10, 582. [Google Scholar] [CrossRef]
  41. Gregorczyk, A. The logistic function-its application to the description and prognosis of plant growth. Acta Soc. Bot. Pol. 1991, 60, 67–76. [Google Scholar] [CrossRef]
  42. Sun, F.; Kuang, Y.; Wen, D.; Xu, Z.; Li, J.; Zuo, W.; Hou, E. Long-term tree growth rate, water use efficiency, and tree ring nitrogen isotope composition of Pinus massoniana L. in response to global climate change and local nitrogen deposition in Southern China. J. Soils. Sediment. 2010, 10, 1453–1465. [Google Scholar] [CrossRef]
  43. Francisco-Fernández, M.; Tarrío-Saavedra, J.; Naya, S.; López-Beceiro, J.; Artiaga, R. Statistical classification of early and late wood through the growth rings using thermogravimetric analysis. J. Therm. Anal. Calorim. 2017, 127, 499–506. [Google Scholar] [CrossRef]
  44. Ågren, G.I.; Ingestad, T. Root: Shoot ratio as a balance between nitrogen productivity and photosynthesis. Plant Cell Environ. 1987, 10, 579–586. [Google Scholar] [CrossRef]
  45. Lü, Z.; Duan, A. Biomass and carbon sturage modcl of Cunninghamia lancculata in diffcrent production areas. Sci. Silv. Sin. 2024, 60, 1–11. (In Chinese) [Google Scholar]
  46. Anderegg, L.D.L.; HilleRisLambers, J. Drought stress limits the geographic ranges of two tree species via different physiological mechanisms. Glob. Change Biol. 2016, 22, 1029–1045. [Google Scholar] [CrossRef]
  47. Hodge, G.R.; Dvorak, W.S. Provenance variation and within-provenance genetic parameters in Eucalyptus urophylla across 125 test sites in Brazil, Colombia, Mexico, South Africa and Venezuela. Tree Genet. Genomes 2015, 11, 1–18. [Google Scholar] [CrossRef]
  48. Matyas, C. Climatic adaptation of trees: Rediscovering provenance tests. Euphytica 1996, 92, 45–54. [Google Scholar] [CrossRef]
  49. Yu, Z.; Ning, Z.; Yang, H. Carbon sequestration benefit and optimal rotation period determination of Cunninghamia lanceolata plantation under stochastic price. J. Nat. Resour. 2022, 37, 753–768. (In Chinese) [Google Scholar] [CrossRef]
  50. Huang, Y.; Xiong, T.; Zhao, M.; Deng, Y.; Yang, G.; Ban, Y.; Lei, T.; Yu, X.; Huang, Y. Influence of soil properties and near-surface roots on soil infiltration process in short-rotation eucalyptus plantations in southern subtropical China. Catena 2024, 234, 107606. [Google Scholar] [CrossRef]
  51. Zhang, X.; Yu, P.; Wang, D.; Xu, Z. Density-and age-dependent influences of droughts and intrinsic water use efficiency on growth in temperate plantations. Agric. For. Meteorol. 2022, 325, 109134. [Google Scholar] [CrossRef]
  52. Liang, R.; Sun, Y.; Qiu, S.; Wang, B.; Xie, Y. Relative effects of climate, stand environment and tree characteristics onannual tree growth in subtropical Cunninghamia lanceolata forests. Agric. For. Meteorol. 2023, 342, 109711. [Google Scholar] [CrossRef]
  53. Mensah, A.A.; Holmström, E.; Petersson, H.; Nyström, K.; Mason, E.G.; Nilsson, U. The millennium shift: Investigating the relationship between environment and growth trends of Norway spruce and Scots pine in northern Europe. For. Ecol. Manag. 2021, 481, 118727. [Google Scholar] [CrossRef]
  54. Muigg, B.; Skiadaresis, G.; Tegel, W.; Herzig, F.; Krusic, P.J.; Schmidt, U.E.; Büntgen, U. Tree rings reveal signs of Europe’s sustainable forest management long before the first historical evidence. Sci. Rep. 2020, 10, 21832. [Google Scholar] [CrossRef]
  55. Smith, J.H.G.; Heger, L.; Hejjas, J. Patterns in growth of earlywood, latewood, and percentage latewood determined by complete analysis of 18 Douglas-fir trees. Can. J. Bot. 1966, 44, 453–466. [Google Scholar] [CrossRef]
  56. Bertaud, F.; Holmbom, B. Chemical composition of earlywood and latewood in Norway spruce heartwood, sapwood and transition zone wood. Wood Sci. Technol. 2004, 38, 245–256. [Google Scholar] [CrossRef]
  57. Sun, F.; Li, R.; Zhu, J.; Peng, H.; Li, Z.; Jiang, J.; Zhan, T.; Cai, L.; Lyu, J. Comparison analysis of moisture-dependent orthotropic elasticity between earlywood and latewood in Chinese fir using digital image correlation. Ind. Crop. Prod. 2024, 220, 119185. [Google Scholar] [CrossRef]
  58. Lasserre, J.P.; Mason, E.G.; Watt, M.S.; Moore, J.R. Influence of initial planting spacing and genotype on microfibril angle, wood density, fibre properties and modulus of elasticity in Pinus radiata D. Don corewood. For. Ecol. Manag. 2009, 258, 1924–1931. [Google Scholar] [CrossRef]
  59. Jiang, F.; Kutia, M.; Ma, K.; Chen, S.; Long, J.; Sun, H. Estimating the aboveground biomass of coniferous forest in Northeast China using spectral variables, land surface temperature and soil moisture. Sci. Total Environ. 2021, 785, 147335. [Google Scholar] [CrossRef] [PubMed]
  60. LaRue, E.A.; Knott, J.A.; Domke, G.M.; Chen, H.Y.H.; Guo, Q.; Hisano, M.; Oswalt, C.; Oswalt, S.; Kong, N.; Potter, K.M.; et al. Structural diversity as a reliable and novel predictor for ecosystem productivity. Front. Ecol. Environ. 2023, 21, 33–39. [Google Scholar] [CrossRef]
  61. Verónica, G.; Luis, P.P.; Gerardo, R. Allometric relations for biomass partitioning of Nothofagus antarctica trees of different crown classes over a site quality gradient. For. Ecol. Manag. 2010, 259, 1118–1126. [Google Scholar]
  62. Stephenson, N.L.; Das, A.J.; Condit, R.; Russo, S.E.; Baker, P.J.; Beckman, N.G.; Coomes, D.A.; Lines, E.R.; Morris, W.K.; Ruger, N.; et al. Rate of tree carbon accumulation increases continuously with tree size. Nature 2014, 507, 90–93. [Google Scholar] [CrossRef]
  63. Anderson, K.J.; Allen, A.P.; Gillooly, J.F.; Brown, J.H. Temperature-dependence of biomass accumulation rates during secondary succession. Ecol. Lett. 2006, 9, 673–682. [Google Scholar] [CrossRef]
  64. Wang, S.; Zhou, D.W. Morphological canalization, integration, and plasticity in response to population density in Abutilon theophrasti: Influences of soil conditions and growth stages. Ecol. Evol. 2021, 11, 11945–11959. [Google Scholar] [CrossRef]
  65. Sato, H.; Mizoi, J.; Shinozaki, K.; Yamaguchi-Shinozaki, K. Complex plant responses to drought and heat stress under climate change. Plant J. 2024, 117, 1873–1892. [Google Scholar] [CrossRef]
  66. Morgan, J.; Cannell, M.G.R. Shape of tree stems—A re-examination of the uniform stress hypothesis. Tree Physiol. 1994, 14, 49–62. [Google Scholar] [CrossRef]
  67. Burgess, S.S.O.; Adams, M.A.; Turne, N.C.; Ong, C.K. The redistribution of soil water by tree root systems. Oecologia 1998, 115, 306–311. [Google Scholar] [CrossRef]
  68. He, D.; Deane, D.C. The relationship between trunk-and twigwood density shifts with tree size and species stature. For. Ecol. Manag. 2016, 372, 137–142. [Google Scholar] [CrossRef]
  69. Wang, Y.; Teng, Z.; Li, H.; Wang, W.; Xu, F.; Sun, K.; Chu, J.; Qian, Y.; Loake, G.J.; Chu, C.; et al. An activated form of NB-ARC protein RLS1 functions with cysteine-rich receptor-like protein RMC to trigger cell death in rice. Plant Commun. 2022, 4, 100459. [Google Scholar] [CrossRef] [PubMed]
  70. He, X.; Lei, X.; Xu, Q.; Lan, J.; Wu, B.; Guo, H.; Gao, W.; Liu, D. Combining multiple feature selection methods and structural equation modelling for exploring factors affecting stand biomass of natural coniferous-broad leaved mixed forests. Sci. Total Environ. 2024, 954, 176669. [Google Scholar] [CrossRef] [PubMed]
  71. Teklehaimanot, Z.; Lanek, J.; Tomlinson, H.F. Provenance variation in morphology and leaflet anatomy of Parkia biglobosa and its relation to drought tolerance. Trees 1998, 13, 96–102. [Google Scholar] [CrossRef]
  72. Liu, Y.; Zhao, X.; Liu, W.; Feng, B.; Lv, W.; Zhang, Z.; Yang, X.; Dong, Q. Plant biomass partitioning in alpine meadows under different herbivores as influenced by soil bulk density and available nutrients. Catena 2024, 240, 108017. [Google Scholar] [CrossRef]
  73. Zhang, C.; Gu, R.; Lin, L.; Russo, S.E. Functional traits and ecological niches as correlates of the interspecific growth-mortality trade-off among seedlings of 14 tropical tree species. Funct. Ecol. 2024, 38, 1888–1901. [Google Scholar] [CrossRef]
  74. Cong, Y.; Saurer, M.; Bai, E.; Siegwolf, R.; Gessler, A.; Liu, K.; Han, H.; Dang, Y.; Xu, W.; He, H.S.; et al. In situ 13CO2 labeling reveals that alpine treeline trees allocate less photoassimilates to roots compared with low-elevation trees. Tree Physiol. 2022, 42, 1943–1956. [Google Scholar] [CrossRef]
  75. Geng, Q.; Ma, X.; Liao, J.; Wu, W.; Niu, S.; Luo, Y.; Xu, X. Contrasting nutrient-mediated responses between surface and deep fineroot biomass to N addition in poplar plantations on the east coast of China. For. Ecol. Manag. 2021, 490, 119152. [Google Scholar] [CrossRef]
  76. Fang, C.; Verbrigghe, N.; Sigurdsson, B.D.; Ostonen, I.; Leblans, N.I.W.; Mara~non-Jimenez, S.; Fuchslueger, L.; Sigurðsson, P.; Meeran, K.; Portillo-Estrada, M.; et al. Decadal soil warming decreased vascular plant above andbelowground production in a subarctic grassland by inducingnitrogen limitation. New Phytol. 2023, 240, 565–576. [Google Scholar] [CrossRef]
  77. Bacher, H.; Sharaby, Y.; Walia, H.; Peleg, Z. Modifying root-to-shoot ratio improves root water influxes in wheat under drought stress. J. Exp. Bot. 2022, 73, 1643–1654. [Google Scholar] [CrossRef]
  78. Kelly, J.W.G.; Landhäusser, S.M.; Chow, P.S. The impact of light quality and quantity on root-to-shoot ratio and root carbon reserves in aspen seedling stock. New Forest. 2015, 46, 527–545. [Google Scholar] [CrossRef]
  79. Zadworny, M.; Mucha, J.; Bagniewska-Zadworn, A.; Żytkowiak, R.; Mąderek, E.; Danusevičius, D.; Oleksyn, J.; Wyka, T.P.; McCormack, M.L. Higher biomass partitioning to absorptive roots improves needle nutrition but does not alleviate stomatal limitation of northern Scots pine. Global Change Biol. 2021, 27, 3859–3869. [Google Scholar] [CrossRef] [PubMed]
  80. Zhang, Y.; Sun, Z.; Su, Z.; Du, G.; Bai, W.; Wang, Q.; Wang, R.; Nie, J.; Sun, T.; Feng, Z.; et al. Root plasticity and interspecific complementarity improve yields and water use efficiency of maize/soybean intercropping in a water-limited condition. Field Crop. Res. 2022, 282, 108523. [Google Scholar] [CrossRef]
  81. Zhao, H.; Guo, B.; Wei, Y.; Zhang, B. Multi-element composition of wheat grain and provenance soil and their potentialities as fingerprints of geographical origin. J. Cereal Sci. 2013, 57, 391–397. [Google Scholar] [CrossRef]
  82. Persson, B.; Beuker, E. Distinguishing between the effects of changes in temperature and light climate using provenance trials with Pinus sylvestris in Sweden. Can. J. For. Res. 1997, 27, 572–579. [Google Scholar] [CrossRef]
  83. Pandey, H.N.; Dubey, S.K. Achene germination of Parthenium hysterophorus L.: Effects of light, temperature, provenance and achene size. Weed Res. 1988, 28, 185–190. [Google Scholar] [CrossRef]
  84. Sun, S.; Xiang, W.; Zhao, Z.; Zhao, Z.; Deng, X.; Ouyang, S.; Chen, L.; Hu, Y.; Zeng, Y.; Peng, C. Long-term field observations of the impacts of drought and stand development on runoff in a forested watershed. Agric. For. Meteorol. 2025, 367, 110519. [Google Scholar] [CrossRef]
  85. Jia, L.; Jiang, Q.; Sun, J.; Robinson, D.; Yang, Z.; Yao, X.; Wang, X.; Dai, X.; Chen, T.; Wu, D.; et al. Contrasting depth-related fine root plastic responses to soil warming in a subtropical Chinese fir plantation. J. Ecol. 2024, 112, 1058–1073. [Google Scholar] [CrossRef]
  86. Qu, Z.; Lin, C.; Zhao, H.; Chen, T.; Yao, X.; Wang, X.; Yang, Y.; Chen, G. Above-and belowground phenology responses of subtropical Chinese fir (Cunninghamia lanceolata) to soil warming, precipitation exclusion and their interaction. Sci. Total Environ. 2024, 933, 173147. [Google Scholar] [CrossRef]
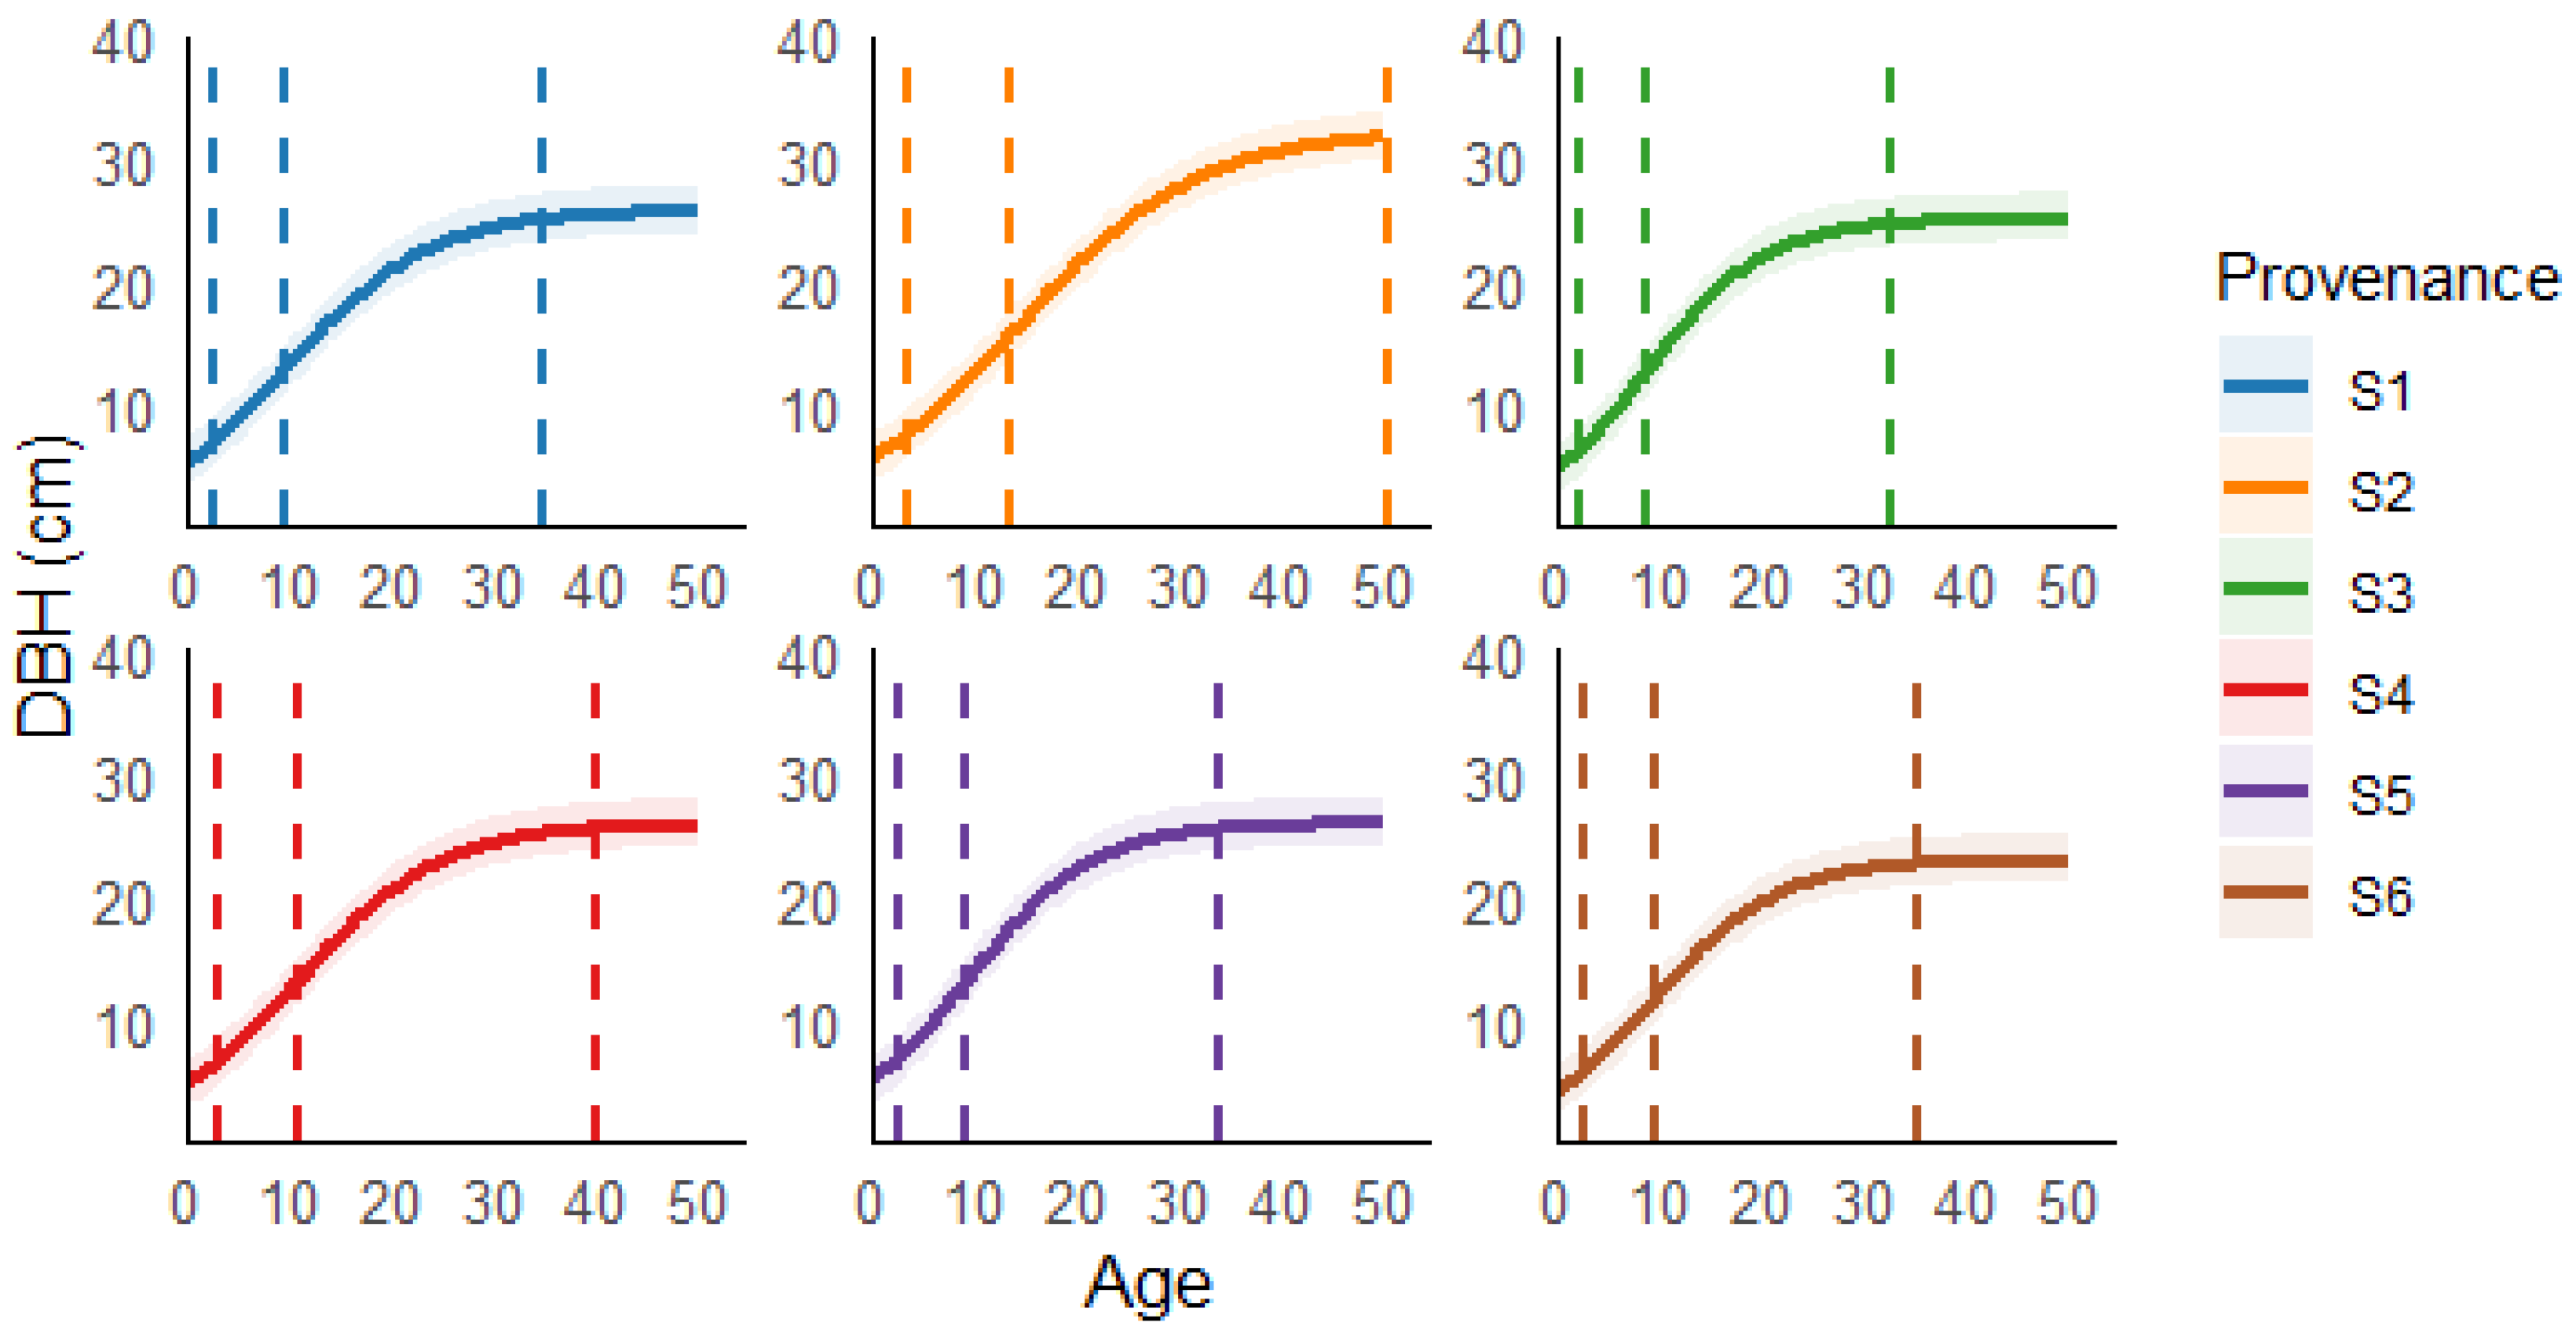
Figure 2. DBH growth curve. The intersection points of the dashed lines with the curve represent the three points in Table 2: (ta, ga), (ti, gi), and (td, gd).
Forests 16 00687 g002
Figure 3. The trend of BAI variation with age for different provenances.
Forests 16 00687 g003
Figure 4. The percentage of latewood for different provenances.
Forests 16 00687 g004
Figure 5. Estimation of total biomass of different provenances.
Forests 16 00687 g005
Figure 6. The trend of root-shoot ratio changes.
Forests 16 00687 g006
Table 3. Fitted parameters for the logistic equation of DBH (diameter at breast height).
ProvenanceabcR2RMSEAICTREMAE
S126.00 3.83 0.14 0.67 4.68 12,450.86 21.61 3.62
S232.55 4.72 0.11 0.85 3.32 4273.59 15.52 2.74
S325.30 4.37 0.17 0.85 2.83 1787.44 12.99 2.18
S426.07 4.51 0.14 0.77 3.77 9606.61 18.41 3.01
S526.08 4.33 0.16 0.74 4.16 22,795.11 19.11 3.33
S623.12 4.55 0.16 0.72 3.87 16,701.82 19.86 2.98
S1–S6 represent the provenance locations, where S1 (Anhui), S2 (Fujian), S3 (Guangxi), S4 (Hunan), S5 (Anhui), and S6 (Zhejiang). a, b, and c represent the upper growth limit, growth curve shape, and growth rate, respectively. R2: correlation coefficient; RMSE: root mean square error; AIC: Akaike information criterion; TRE: mean relative error; MAE: mean absolute error.
Table 4. Fast-growth periods of six provenances.
Provenance(ta, ga)(ti, gi)(td, gd)ΔT
S1(3, 5)(9, 13)(35, 21)33
S2(4, 7)(14, 16)(51, 26)47
S3(2, 5)(9, 13)(33, 20)30
S4(3, 6)(11, 13)(40, 21)37
S5(2, 6)(9, 13)(34, 21)32
S6(3, 5)(9, 12)(35, 18)33
(ta, ga) is the point of maximum acceleration, (ti, gi) is the key point, (td, gd) is the point of minimum acceleration, and ΔT is the duration of fast-growth period.
Table 5. The biomass of various organs at different age stages. The biomass data in the table represent the mean ± standard deviation. Lowercase letters represent significant differences at the 0.05 level.
Age GroupProvenanceBiomass Levels of the Different Organs (kg)
RootBranchLeafTrunk
0–10S16.03 ± 5.93 bc1.49 ± 1.95 bc1.35 ± 1.53 bc17.05 ± 17.96 c
S25.43 ± 4.85 a1.27 ± 1.47 a1.19 ± 1.20 a15.27 ± 15.03 a
S35.76 ± 4.95 bc1.36 ± 1.53 bc1.27 ± 1.24 bc16.30 ± 15.26 bc
S44.58 ± 4.49 c1.04 ± 1.34 c0.99 ± 1.11 c12.66 ± 13.84 bc
S55.94 ± 5.61 b1.46 ± 1.77 b1.33 ± 1.42 b16.85 ± 17.24 b
S64.35 ± 4.54 d0.98 ± 1.40 d0.94 ± 1.13 d11.96 ± 13.85 d
11–20S120.24 ± 12.44 bc6.76 ± 5.53 bc5.22 ± 3.69 bc57.89 ± 32.05 c
S219.84 ± 9.18 a6.39 ± 3.83 a5.04 ± 2.65 a57.80 ± 25.02 a
S319.70 ± 7.55 bc6.25 ± 3.13 bc4.97 ± 2.17 bc57.91 ± 20.72 bc
S417.87 ± 9.26 c5.63 ± 3.81 c4.49 ± 2.65 c52.19 ± 25.57 bc
S521.10 ± 10.75 b7.00 ± 4.67 b5.43 ± 3.16 b60.83 ± 28.42 b
S615.79 ± 9.54 d4.85 ± 3.96 d3.92 ± 2.74 d46.09 ± 26.16 d
21–30S131.46 ± 17.13 bc11.92 ± 8.68 bc8.60 ± 5.40 bc85.64 ± 38.45 c
S236.26 ± 12.58 a13.92 ± 6.34 a9.99 ± 3.96 a98.55 ± 28.19 a
S332.32 ± 9.26 bc11.87 ± 4.36 bc8.73 ± 2.83 bc90.13 ± 22.42 bc
S428.93 ± 12.14 c10.45 ± 5.77 c7.75 ± 3.72 c81.05 ± 29.20 bc
S533.66 ± 14.62 b12.80 ± 7.20 b9.23 ± 4.55 b91.73 ± 33.82 b
S626.79 ± 12.94 d9.53 ± 6.13 d7.12 ± 3.96 d75.32 ± 31.35 d
31–40S141.84 ± 19.06 bc17.10 ± 10.25 bc11.86 ± 6.18 bc109.12 ± 39.58 c
S259.48 ± 14.09 a26.42 ± 8.14 a17.53 ± 4.73 a146.13 ± 26.31 a
S342.60 ± 10.40 bc17.00 ± 5.58 bc11.96 ± 3.37 bc113.29 ± 21.33 bc
S441.77 ± 15.66 c16.85 ± 8.28 c11.77 ± 5.04 c110.06 ± 32.98 bc
S544.86 ± 18.18 b18.61 ± 9.75 b12.80 ± 5.89 b115.85 ± 37.75 b
S633.49 ± 13.12 d12.62 ± 6.47 d9.15 ± 4.08 d91.86 ± 30.45 d
Disclaimer/Publisher’s Note: The statements, opinions and data contained in all publications are solely those of the individual author(s) and contributor(s) and not of MDPI and/or the editor(s). MDPI and/or the editor(s) disclaim responsibility for any injury to people or property resulting from any ideas, methods, instructions or products referred to in the content.

