Article

Quantifying Missed Opportunities for Cumulative Forest Road Carbon Storage over the Past 50 Years in the Boreal Forest of Eastern Canada

by
Alejandro Vega Escobar
1,2,3,*,
François Girard
3,4 and
Osvaldo Valeria
1,2,3
1
Institut de Recherche sur les Forêts, Université du Québec en Abitibi Témiscamingue, 445 Boulevard de l’Université, Rouyn-Noranda, QC J9X 5E4, Canada
2
Chaire en Aménagement Forestier Durable UQAT-UQAM, 445 Boulevard de l’Université, Rouyn-Noranda, QC J9X 5E4, Canada
3
Centre d’Étude de la Forêt, Case Postale 8888, Succursale Centre-Ville, Montréal, QC H3C 3P8, Canada
4
Département de Géographie, Université de Montréal, 1375 Avenue Thérèse-Lavoie-Roux, Montréal, QC H3C 0B3, Canada
*
Author to whom correspondence should be addressed.
Forests 2025, 16(4), 688; https://doi.org/10.3390/f16040688
Submission received: 17 March 2025 / Revised: 12 April 2025 / Accepted: 14 April 2025 / Published: 16 April 2025
(This article belongs to the Section Forest Ecology and Management)

Abstract

:
Forest road networks are essential for forest operations but significantly contribute to carbon loss and landscape fragmentation in boreal ecosystems. This study evaluates the potential of reforesting unused forest roads to enhance carbon storage (CS) in Quebec’s boreal forests. Four reforestation scenarios were simulated using spatial data from AQréseau+ and the Ecoforestry Map of Quebec, combined with the CBM-CFS3 carbon model. These scenarios varied in site preparation conditions and species selection, including the use of fast-growing local species. Random forest (RF) models were applied to analyze the influence of key variables on CS dynamics, focusing on the road area and years to harvest. The study area covered approximately 294,000 km2, and the temporal dimension was incorporated by estimating the construction dates of forest roads. Results show that scenarios integrating soil preparation and fast-growing species (S1I1) achieved the highest CS potential, with up to 6.8 million tons (Mt) of additional carbon stored over a 40–100 year period for medium-category roads, compared to 1.15 million tons in scenarios without intervention (S0I0). These findings underscore the role of reforestation in enhancing CS within managed forests. Future work should prioritize road segments for reforestation, considering ecological benefits, operational feasibility, and climate resilience.

1. Introduction

Forest road networks play a crucial role globally. They provide access to forest resources for various economic activities, including timber harvesting, material transport, and reforestation, while contributing to infrastructure development for local communities, particularly in remote regions [1]. These roads typically involve vegetation clearing, grading, soil stripping, the excavation of roadside ditches, and localized filling to level uneven terrain [2]. These activities alter the soil structure, disturb the surface horizon, and often increase compaction and erosion risk, impacting the site’s future reforestation potential [3].
Besides their economic and operational roles, forest roads are essential for wildfire responses. Well-maintained road systems allow for the quick deployment of crews and equipment, acting as access corridors and firebreaks that contain or redirect wildfire spread, especially in remote boreal regions with restricted ground access [4]. Despite their strategic roles, the construction and maintenance of forest roads have environmental consequences, notably affecting CS. While much research has focused on their role in deforestation and habitat fragmentation [5], fewer studies have examined their contribution to CS loss and the potential for recovery through reforestation. This study explores how reforesting deactivated forest roads can mitigate these impacts and enhance CS in boreal landscapes.
Since the 1970s, logging roads have expanded quickly in the boreal forest of Eastern Canada, now spanning roughly 476,700 km [6]. While essential for forest management, their expansion has led to deforestation, fragmentation, and soil alteration, disrupting CS [7,8]. This study focuses on permanent forest roads designed for long- and mid-term use, not on temporary skid trails or draglines created during harvesting operations, which differ in structure, duration, and ecological impact [9]. Soil compaction from road construction and use reduces vegetation regeneration and tree growth, decreasing productivity by 30% to 80% due to increased soil bulk density [10,11,12].
CS reflects a forest ecosystem’s ability to capture and retain carbon, balancing CO2 absorption and release from natural and human activities [1]. Forest roads disrupt this balance by degrading soil and removing vegetation, increasing carbon emissions [13]. To mitigate these impacts, temporary deactivation of unused roads and reforestation with adapted fast-growing local species can help restore CS while generating economic potential through commercial timber production [14]. Despite the general agreement on the benefits of reforestation, debates persist regarding the most effective strategies for different soil conditions and road deactivation methods. Some studies emphasize the importance of natural regeneration [15], while others argue that active reforestation is necessary to efficiently restore CS [14]. Although road deactivation and reforestation are proposed solutions, their effectiveness depends on soil conditions, species selection, and management strategies. Research remains limited on the best approaches to maximize CS in these areas.
Reforesting deactivated roads can restore CS while reducing habitat fragmentation and soil erosion. It can also enhance biodiversity, improve soil quality, and support ecosystem services [1,7,16]. However, natural regeneration alone is often slow and insufficient, particularly in compacted or nutrient-poor soils [17]. Without human intervention, these areas remain underutilized for CS [14]. Forest roads serve different functions within the network, influencing their reforestation potential. Main penetration roads ensure connectivity and long-term access to harvesting areas, whereas auxiliary roads can be temporarily deactivated, allowing for controlled reforestation and short-term CS gains. Understanding these distinctions is essential for evaluating the feasibility of road deactivation strategies.
Introducing fast-growing local species to specific areas can increase CS in living biomass and wood products, such as commercial timber, which retains carbon over long periods [18]. While vegetation naturally recolonizes abandoned roads [15], this spontaneous growth does not always enhance CS in commercially valuable wood [19,20]. Evaluating its impact on CS is necessary to determine whether targeted reforestation is needed. Species selection and management are key in long-term CS potential [21,22].
Tools such as the Carbon Budget Model (CBM-CFS3), developed by the Canadian Forest Service [23,24], can be used to identify the most effective practices for increasing CS on deactivated forest roads. This study evaluates four reforestation scenarios, considering soil preparation and species selection to determine their contribution to CS and feasibility within forestry operations. Comparing different reforestation approaches provides insights into their effectiveness under varying environmental conditions.
This study aims to quantify the CS potential of reforesting deactivated forest roads in the Eastern Canadian boreal forest while assessing its feasibility within forestry operations. It evaluates different reforestation strategies and their impact on CS to inform management practices that balance carbon recovery with timber production. The findings contribute to ongoing discussions on restoring carbon stocks in forest areas impacted by past infrastructure development.

2. Materials and Methods
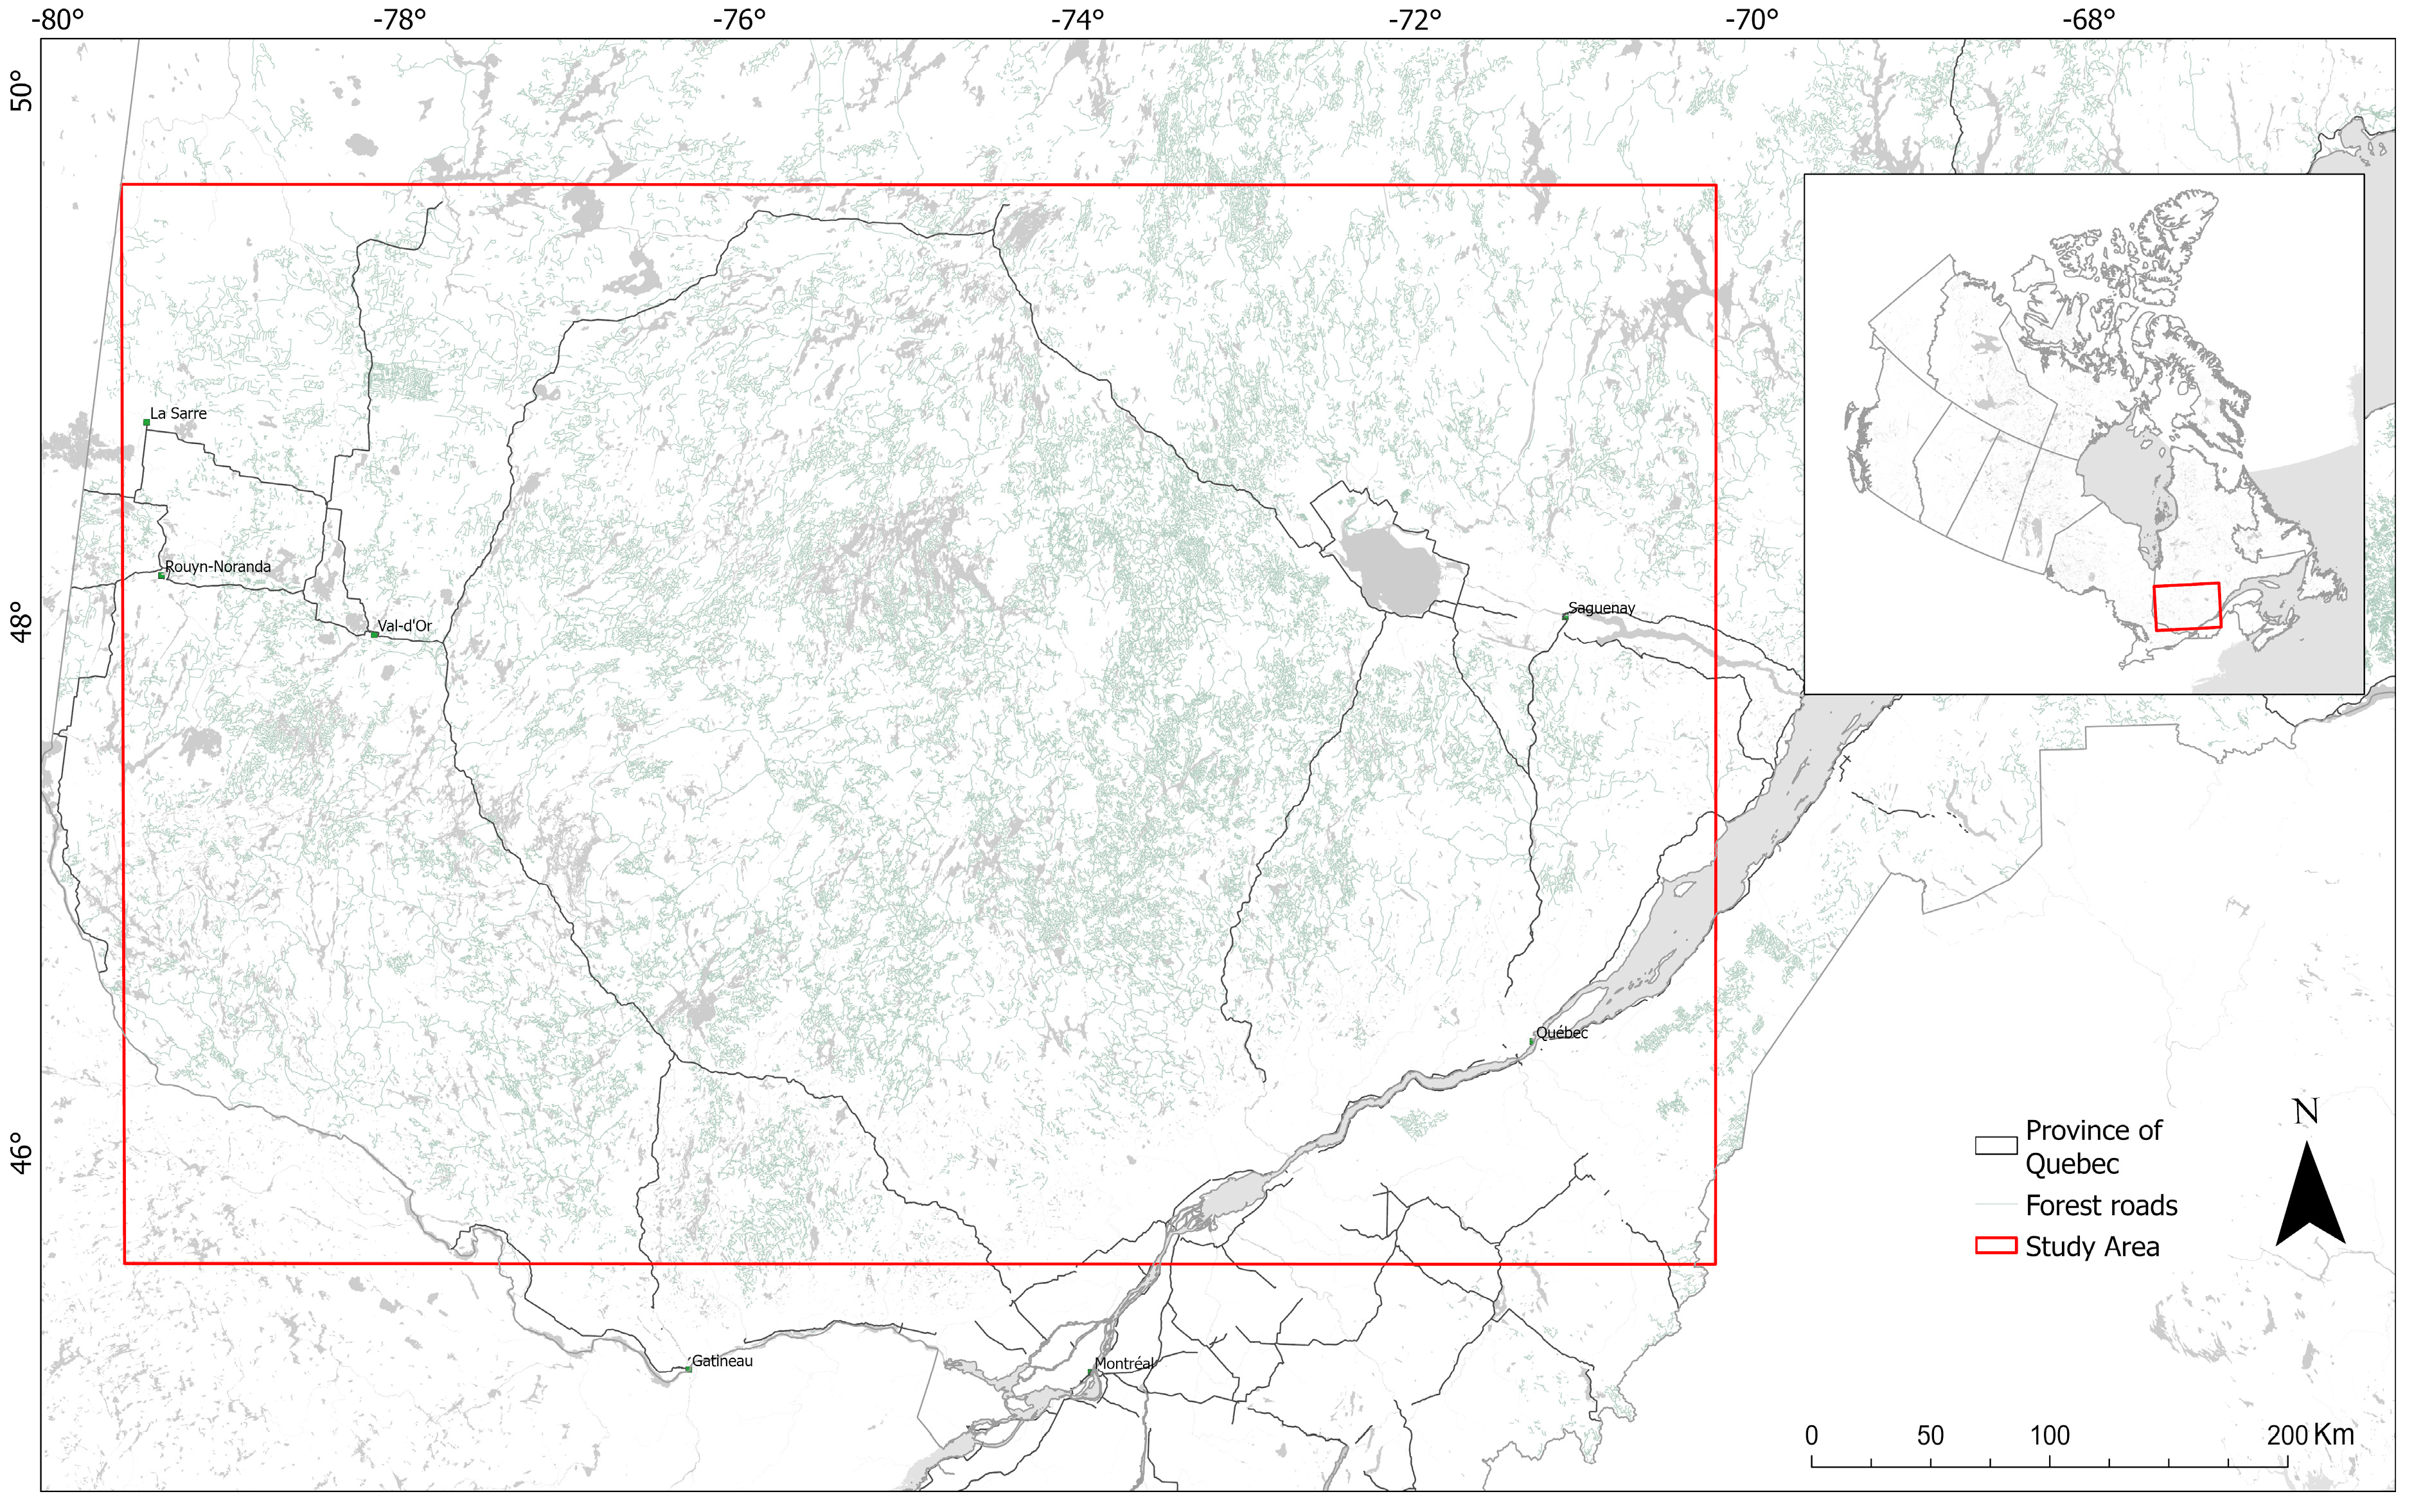
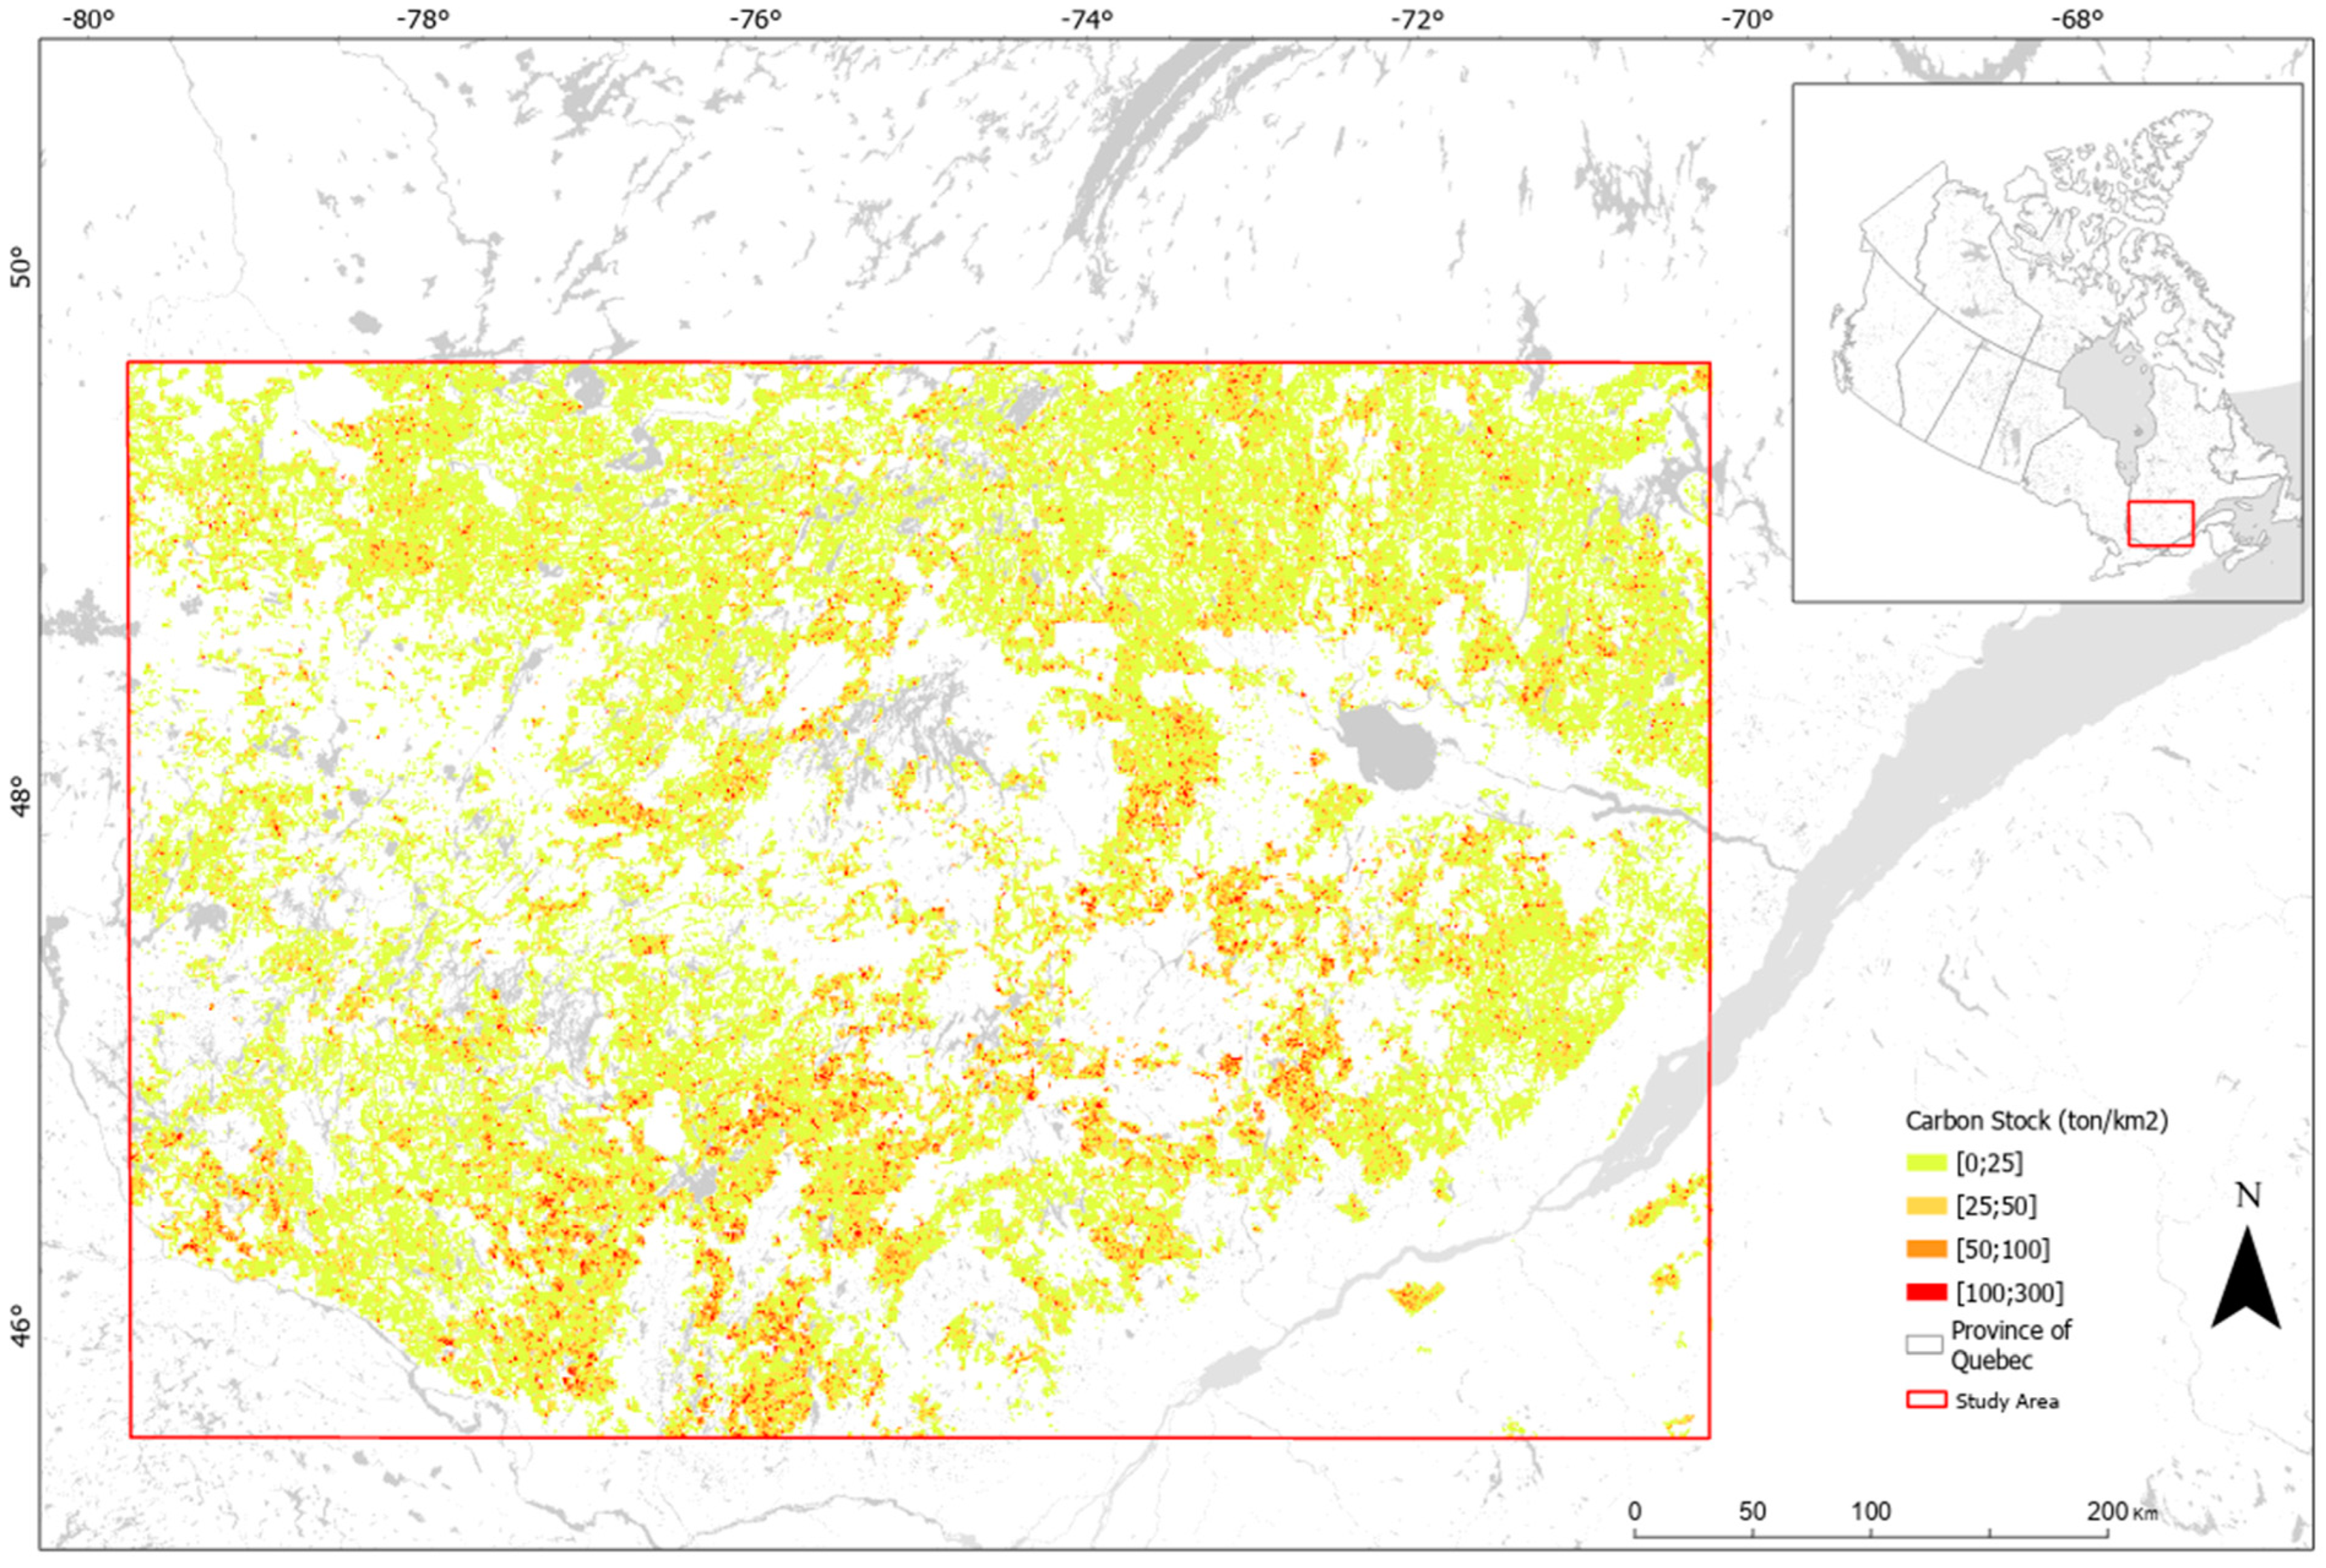
2.1. Study Area

The study area (Figure 1) is located in eastern Canada, within the province of Quebec. It extends from 47° to 49° north latitude and from 72° to 78° west longitude, covering an area of 294,143 km2. This represents approximately 58% of the province’s forest road network.
The location of the study area is in Quebec’s boreal region. The red outline shows the study area, with light green lines representing the main forest roads used for timber transportation (classes 03 and 04). The grey outline indicates the provincial boundaries.
The climate of the study area is characterized by very cold winters and short, cool summers. Temperatures vary according to the latitude and longitude, with warmer conditions in the south and colder conditions in the north. Sites further west exhibit different thermal regimes than eastern zones, reflecting longitudinal climatic variations. The mean annual temperature ranges from 0.2 °C to 6.9 °C. Total precipitation also varies along the latitudinal gradient, with drier conditions towards the north, ranging between 849 mm and 1537 mm [25]. The study area has an undulating topography, with the highest elevations concentrated in the southeastern part [26].
Vegetation is dense and dominated by species typical of the boreal forest, such as black spruce (Picea mariana (Mill.) Britton, Sterns, and Poggenb) and jack pine (Pinus banksiana Lamb.), which colonize disturbed areas. Trembling aspen (Populus tremuloides Michx.) and white birch (Betula papyrifera Marsh.) are common in transition zones between boreal and temperate forests. Further south, in mixed and temperate zones, we find stands of yellow birch (Betula alleghaniensis Britton) and sugar maple (Acer saccharum Marsh) [27,28].

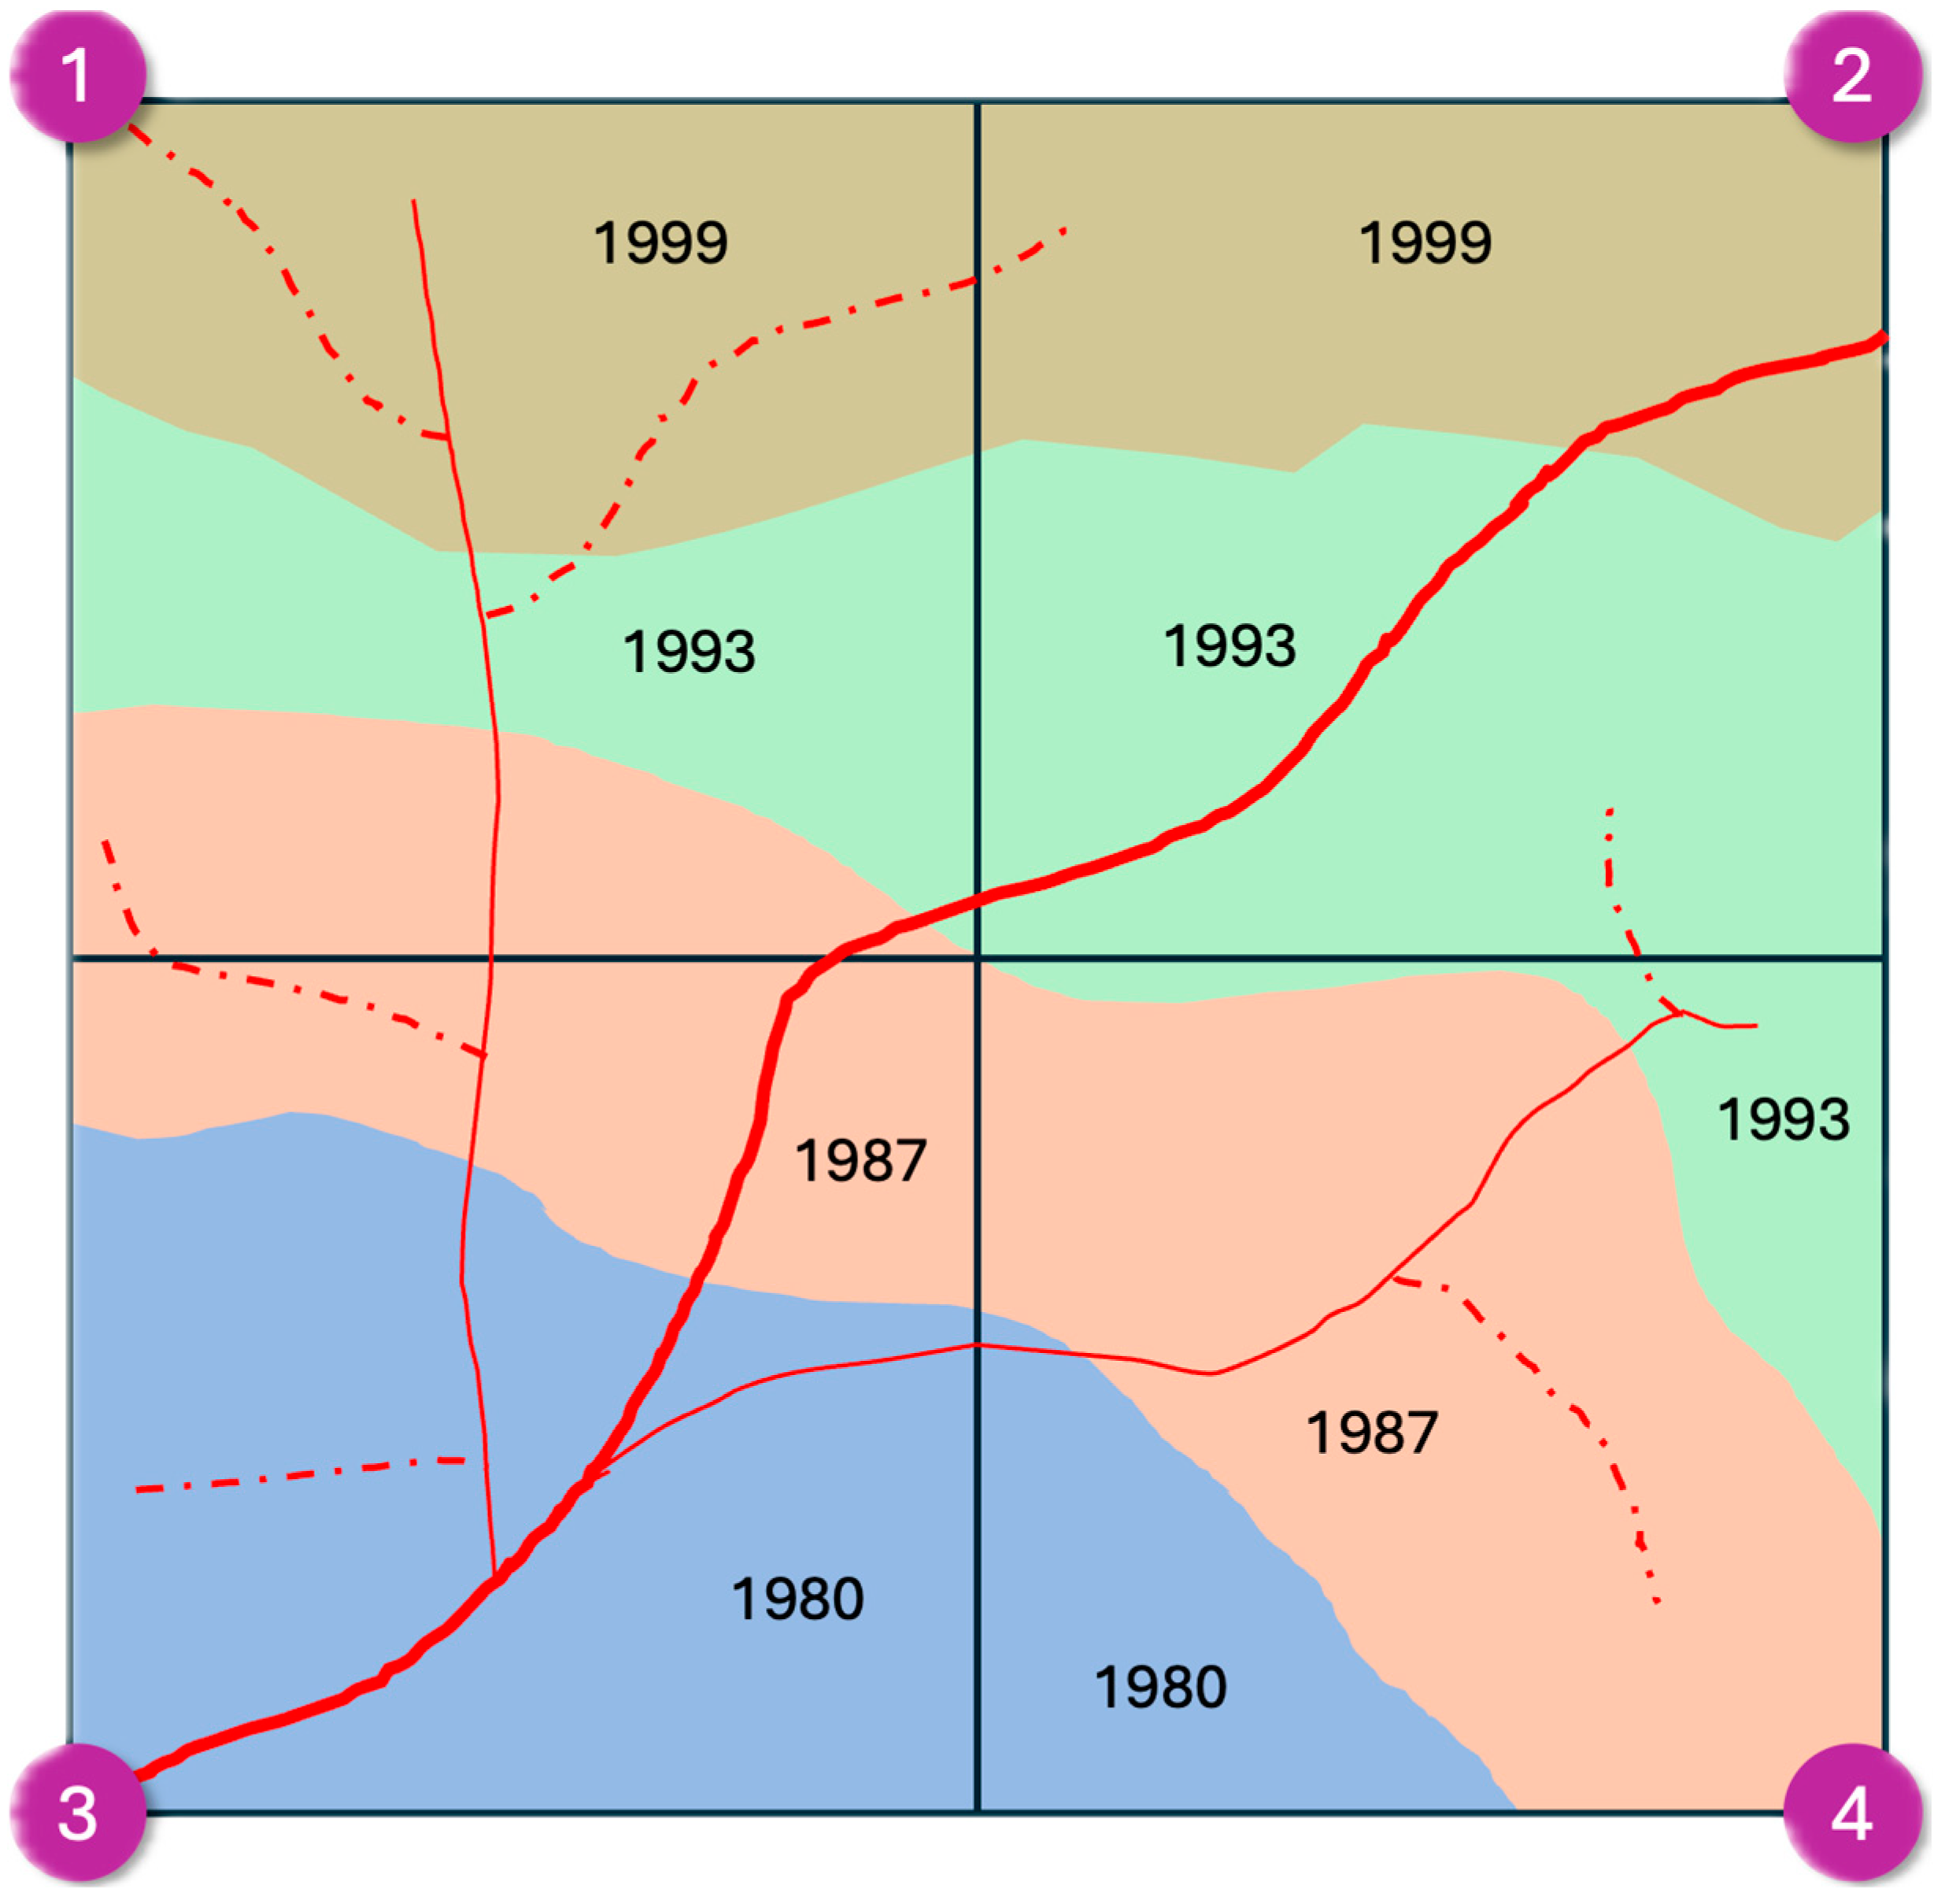
2.2. Territory Characterization

To capture variations in terrain features, vegetation, disturbances, and road attributes, the study area was divided into 294,965 moving 1 km2 windows, with the first window randomly positioned (Figure 2). This resolution ensures compatibility with previous ecological and forestry studies conducted in the region and allows for the detection of fine-scale variations while maintaining computational efficiency [29]. Lakes and islands were excluded from the analysis because they do not provide suitable ground for forest road construction or productive forestry activities. Including them would have introduced bias into the CS and forest disturbance estimates.
Using data from the Ecoforestry Map of the 5th Forest Inventory du Québec [26], the following characteristics were determined for each window:
  • Forest cover composition: this indicates whether coniferous, deciduous, mixed stands, or other vegetation types cover the area.
  • Ecological type: ecosystem classification including associations between vegetation, soil, and climate [30].
  • Slope and drainage: measures of local topography and soil capacity to evacuate or retain water, influencing tree growth and soil stability.
  • Forest productivity zone: the division of territories according to their climatic and edaphic conditions, which determine forest productivity.
These data offer insights into the interactions between dominant ecological characteristics (e.g., soil type and climate) and anthropogenic disturbances (e.g., forest road construction). In this context, timber harvesting within a window requires access provided by forest road infrastructure. Consequently, the impact of road construction is attributed to the entire window area, reflecting its local disturbance footprint, particularly during the construction period (Figure 2).
Forest disturbances were classified into three main categories:
  • Logging, including fire salvage logging, which necessitates road construction.
  • Commercial thinning.
  • Other silvicultural activities, including soil preparation and planting.
Roads were dated according to the timing of forest disturbances, with records extending back to 1970. Each window was linked to the earliest disturbance event requiring road access, which determined the reference year for its associated infrastructure. This information was also used to estimate the time remaining before the subsequent harvesting intervention, considering vegetation characteristics and regeneration cycles.

2.3. Road Network Analysis

The map data for this analysis come from AQréseau+ [31], which was consulted in January 2024 (Figure 1). The forest road network is divided into several classes according to capacity and use. Classes 01 and 02 and over-standard roads (OS) correspond to high-capacity roads primarily for transporting industrial goods, mining activities, and long-distance travel. These roads are not designated for forestry operations and are usually not involved in timber harvesting logistics [32]. Consequently, they were excluded from the reforestation analysis. However, they represent 2.1% of the total road network in the study area and were included in the initial width classification to comprehensively describe the network’s physical structure.
The study focused on forest roads managed by the Ministère des Ressources Naturelles et des Forêts du Québec (MRNF), primarily classes 03 and 04, which are gravel roads directly linked to forestry operations [32]. In addition, classes 05, winter (WI), unclassified (UC), and unknown (UN) roads were included in both the spatial analysis and reforestation scenario assessments.
In this classification, gravel roads (class 03) refer to segments with compacted aggregates designed to support sustained forestry transport operations. In contrast, natural soil roads (class 04 and some class 05 segments) lack engineered surfacing and are generally formed directly on mineral soils without added material. Winter roads (WI), which are included under class 05, are temporary routes constructed over frozen ground and rely on compacted snow or ice as the bearing surface (Figure 3). These roads are primarily used for timber transport during the coldest months [32]. While they can cause surface-level soil compaction, they generally do not involve excavation or permanent alteration of the soil profile. These structural differences influence road durability, seasonal usage, and the extent of site preparation needed for reforestation, especially in degraded or poorly drained areas.
The MRNF proposes standardized widths for each category of road. However, significant discrepancies between these official values and field measurements have been reported in studies by Braham, Valeria, and Imbeau [15] and Girardin et al. [33]. To verify the consistency between official data and actual field conditions, we analyzed 241 plots from these previous studies. This allowed for a more accurate estimation of the surface area occupied by roads, including the roadway and the right-of-way.
Additional data were collected specifically for unclassified (UC) and unknown (UN) road segments, for which no standardized width information exists. In total, 50 additional plots were analyzed along the UC and UN segments using high-resolution aerial photographs (0.6 to 1.2 m) taken in 2023 and publicly available through ESRI (ArcGIS). These images enabled the identification of the visible right-of-way and the estimation of the road footprint. A virtual sampling approach was implemented by dividing each segment into 50 m intervals using the ArcGIS ArcPy library (version 3.2) [34], with three width measurements taken at each segment’s initial, median, and final points.
This methodology accurately reflects current road conditions by considering the absence of construction standards, the lack of standardized width definitions, and the effects of vegetation closure over time. It is important to note that while the UC and UN segments are part of the AQréseau+ dataset [31], this database is still under development. Not all road segments have been fully categorized within the standard classification system (classes 01 to 05, OS, and WI). Including these segments is based solely on their spatial footprint and potential impact on carbon dynamics, not on formal classification or confirmed functional designation.
To structure the dataset according to road width, while classes 01, 02, and OS were included in this classification for descriptive purposes, they were not considered in the reforestation analysis, consistent with their 2.1% proportion and non-forestry functions.
This classification grouped roads into three categories, consistent with the classes defined by AQréseau+ and MRNF [32], and aligned with the reforestation analysis presented in Table 1.
  • Medium, corresponding to classes 03 and 04 (gravel roads for forestry operations).
  • Narrow, corresponding to classes 05 and WI (lower-capacity roads still used in forestry).
  • Unclassified, corresponding to classes UC and UN (roads without formal classification but present in forestry landscapes).
In this study, two key concepts were considered for reforestation planning:
1
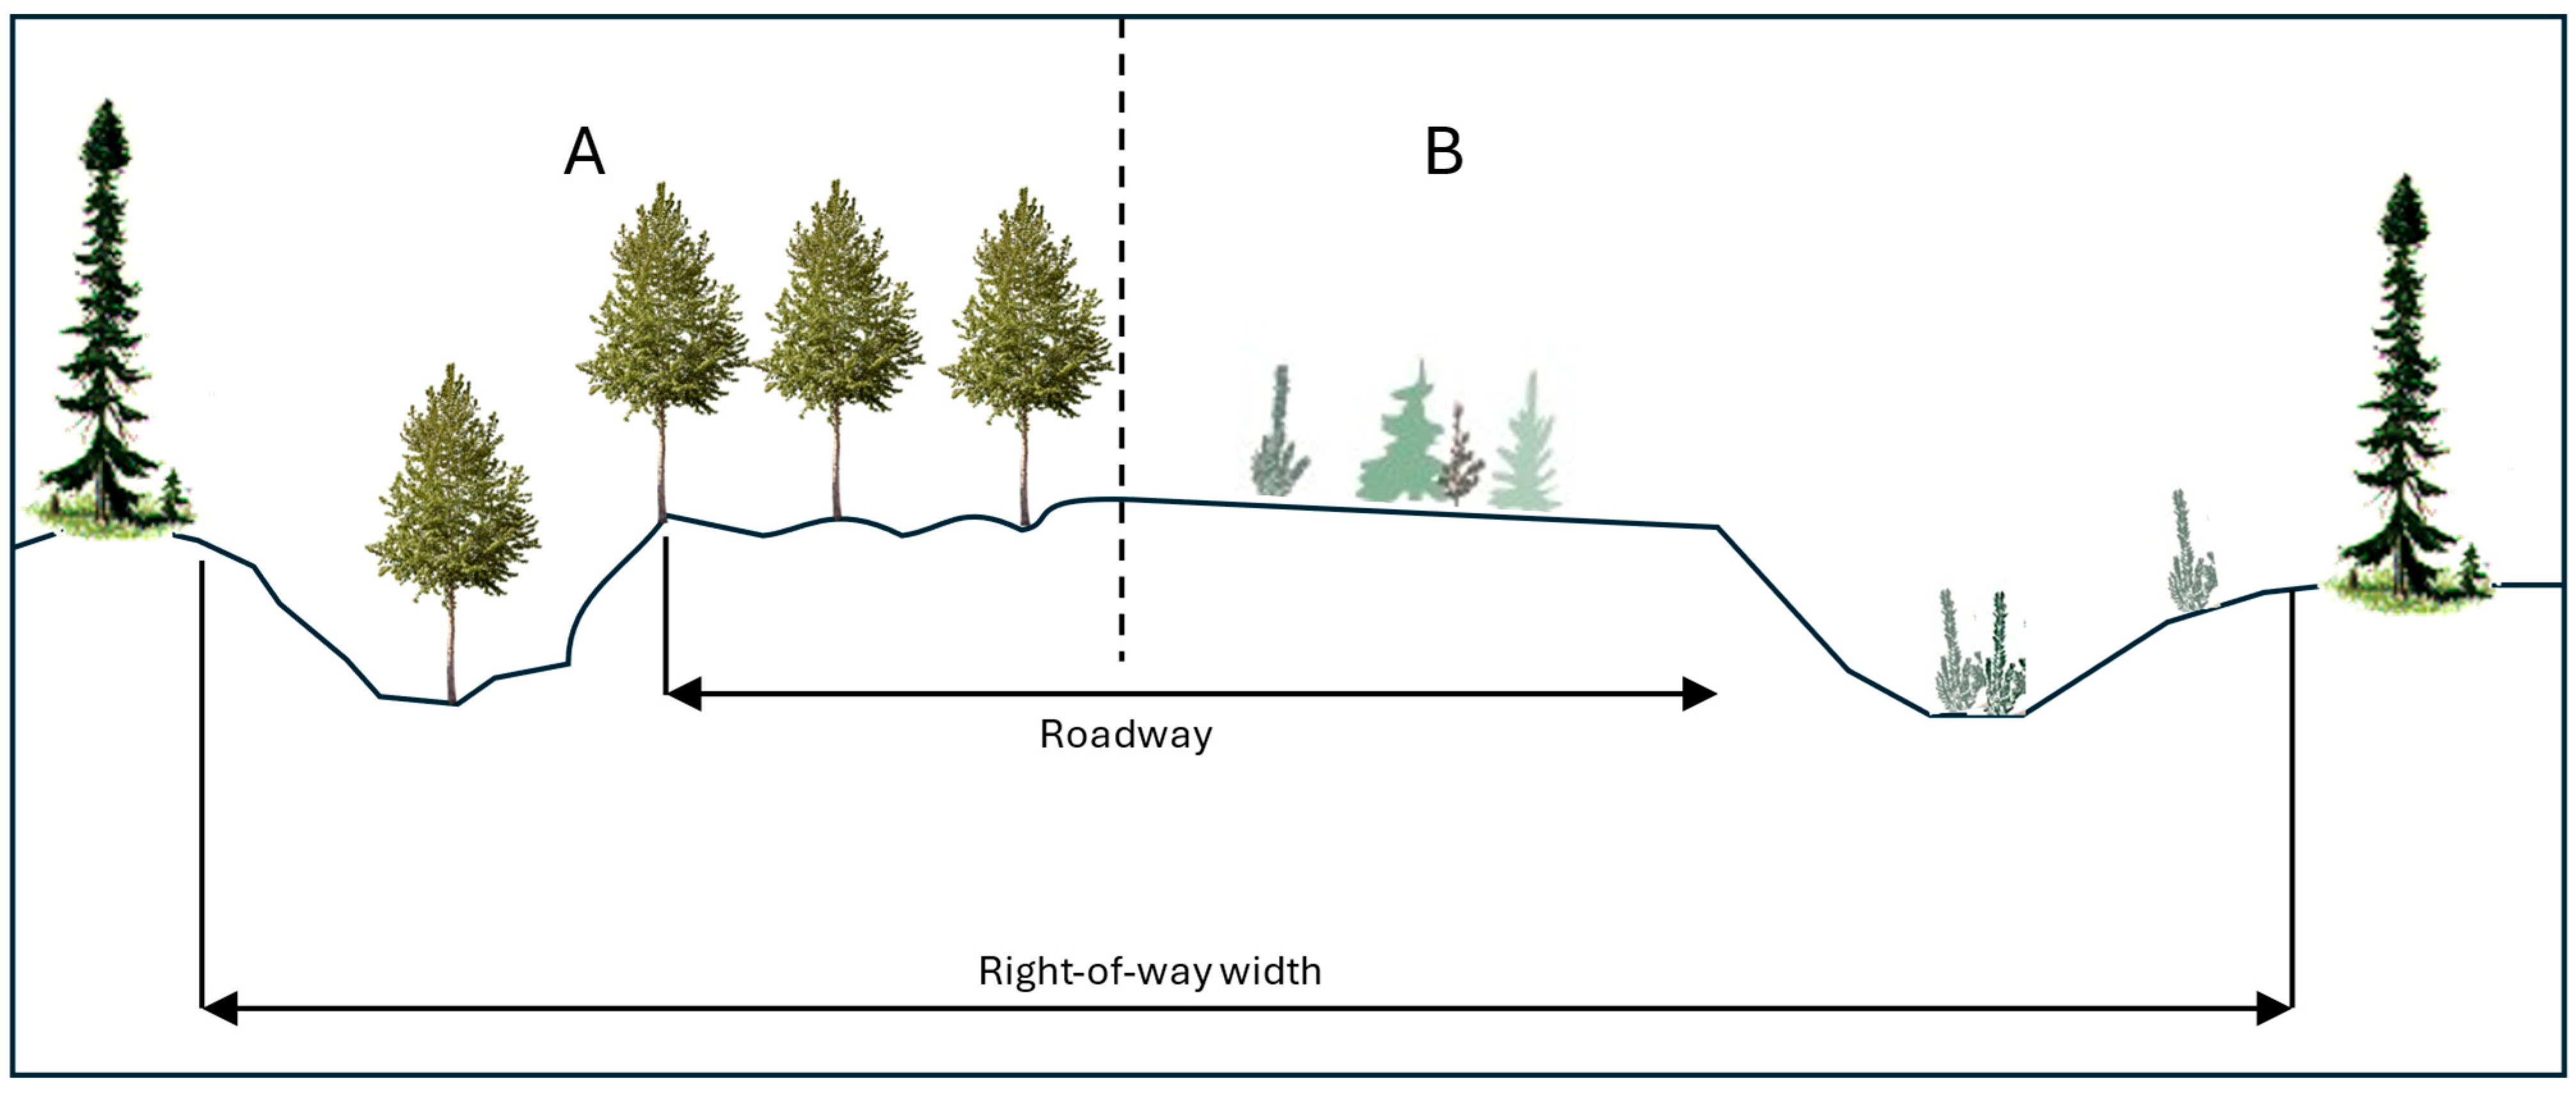
The area occupied by roads at the time of planting, measured in hectares, representing the surface area directly affected by the complete road infrastructure structure, including the roadway and its right-of-way;
2
The progressive reduction in road width due to the natural recovery of vegetation is expressed as a percentage [15].
This natural recovery reduces the exposed road area, influencing long-term reforestation potential. It was estimated as follows:
  • Short-term (0 to 10 years after cutting): around 1.6% of the surface is recovered.
  • Medium-term (10 to 20 years): between 17% and 51%.
  • Long-term (>20 years): between 40% and 82%.
Table 1 summarizes the variables derived from this analysis and the other input data used in the models.

2.3.1. Calculation of the Road Area

To estimate the deforested area, the mean width of each road category, as shown in Table 1, was multiplied by its respective length. This approach enables an accurate assessment of the surface area directly affected by road infrastructure for each moving window, considering the spatial distribution of roads in the study area. The configurations of forest roads, both reforested and non-reforested, underlying these estimates are illustrated in Figure 4. This figure highlights the impact of reforestation practices on the right-of-way and roadway, two key elements used to analyze their effects on forest surfaces.

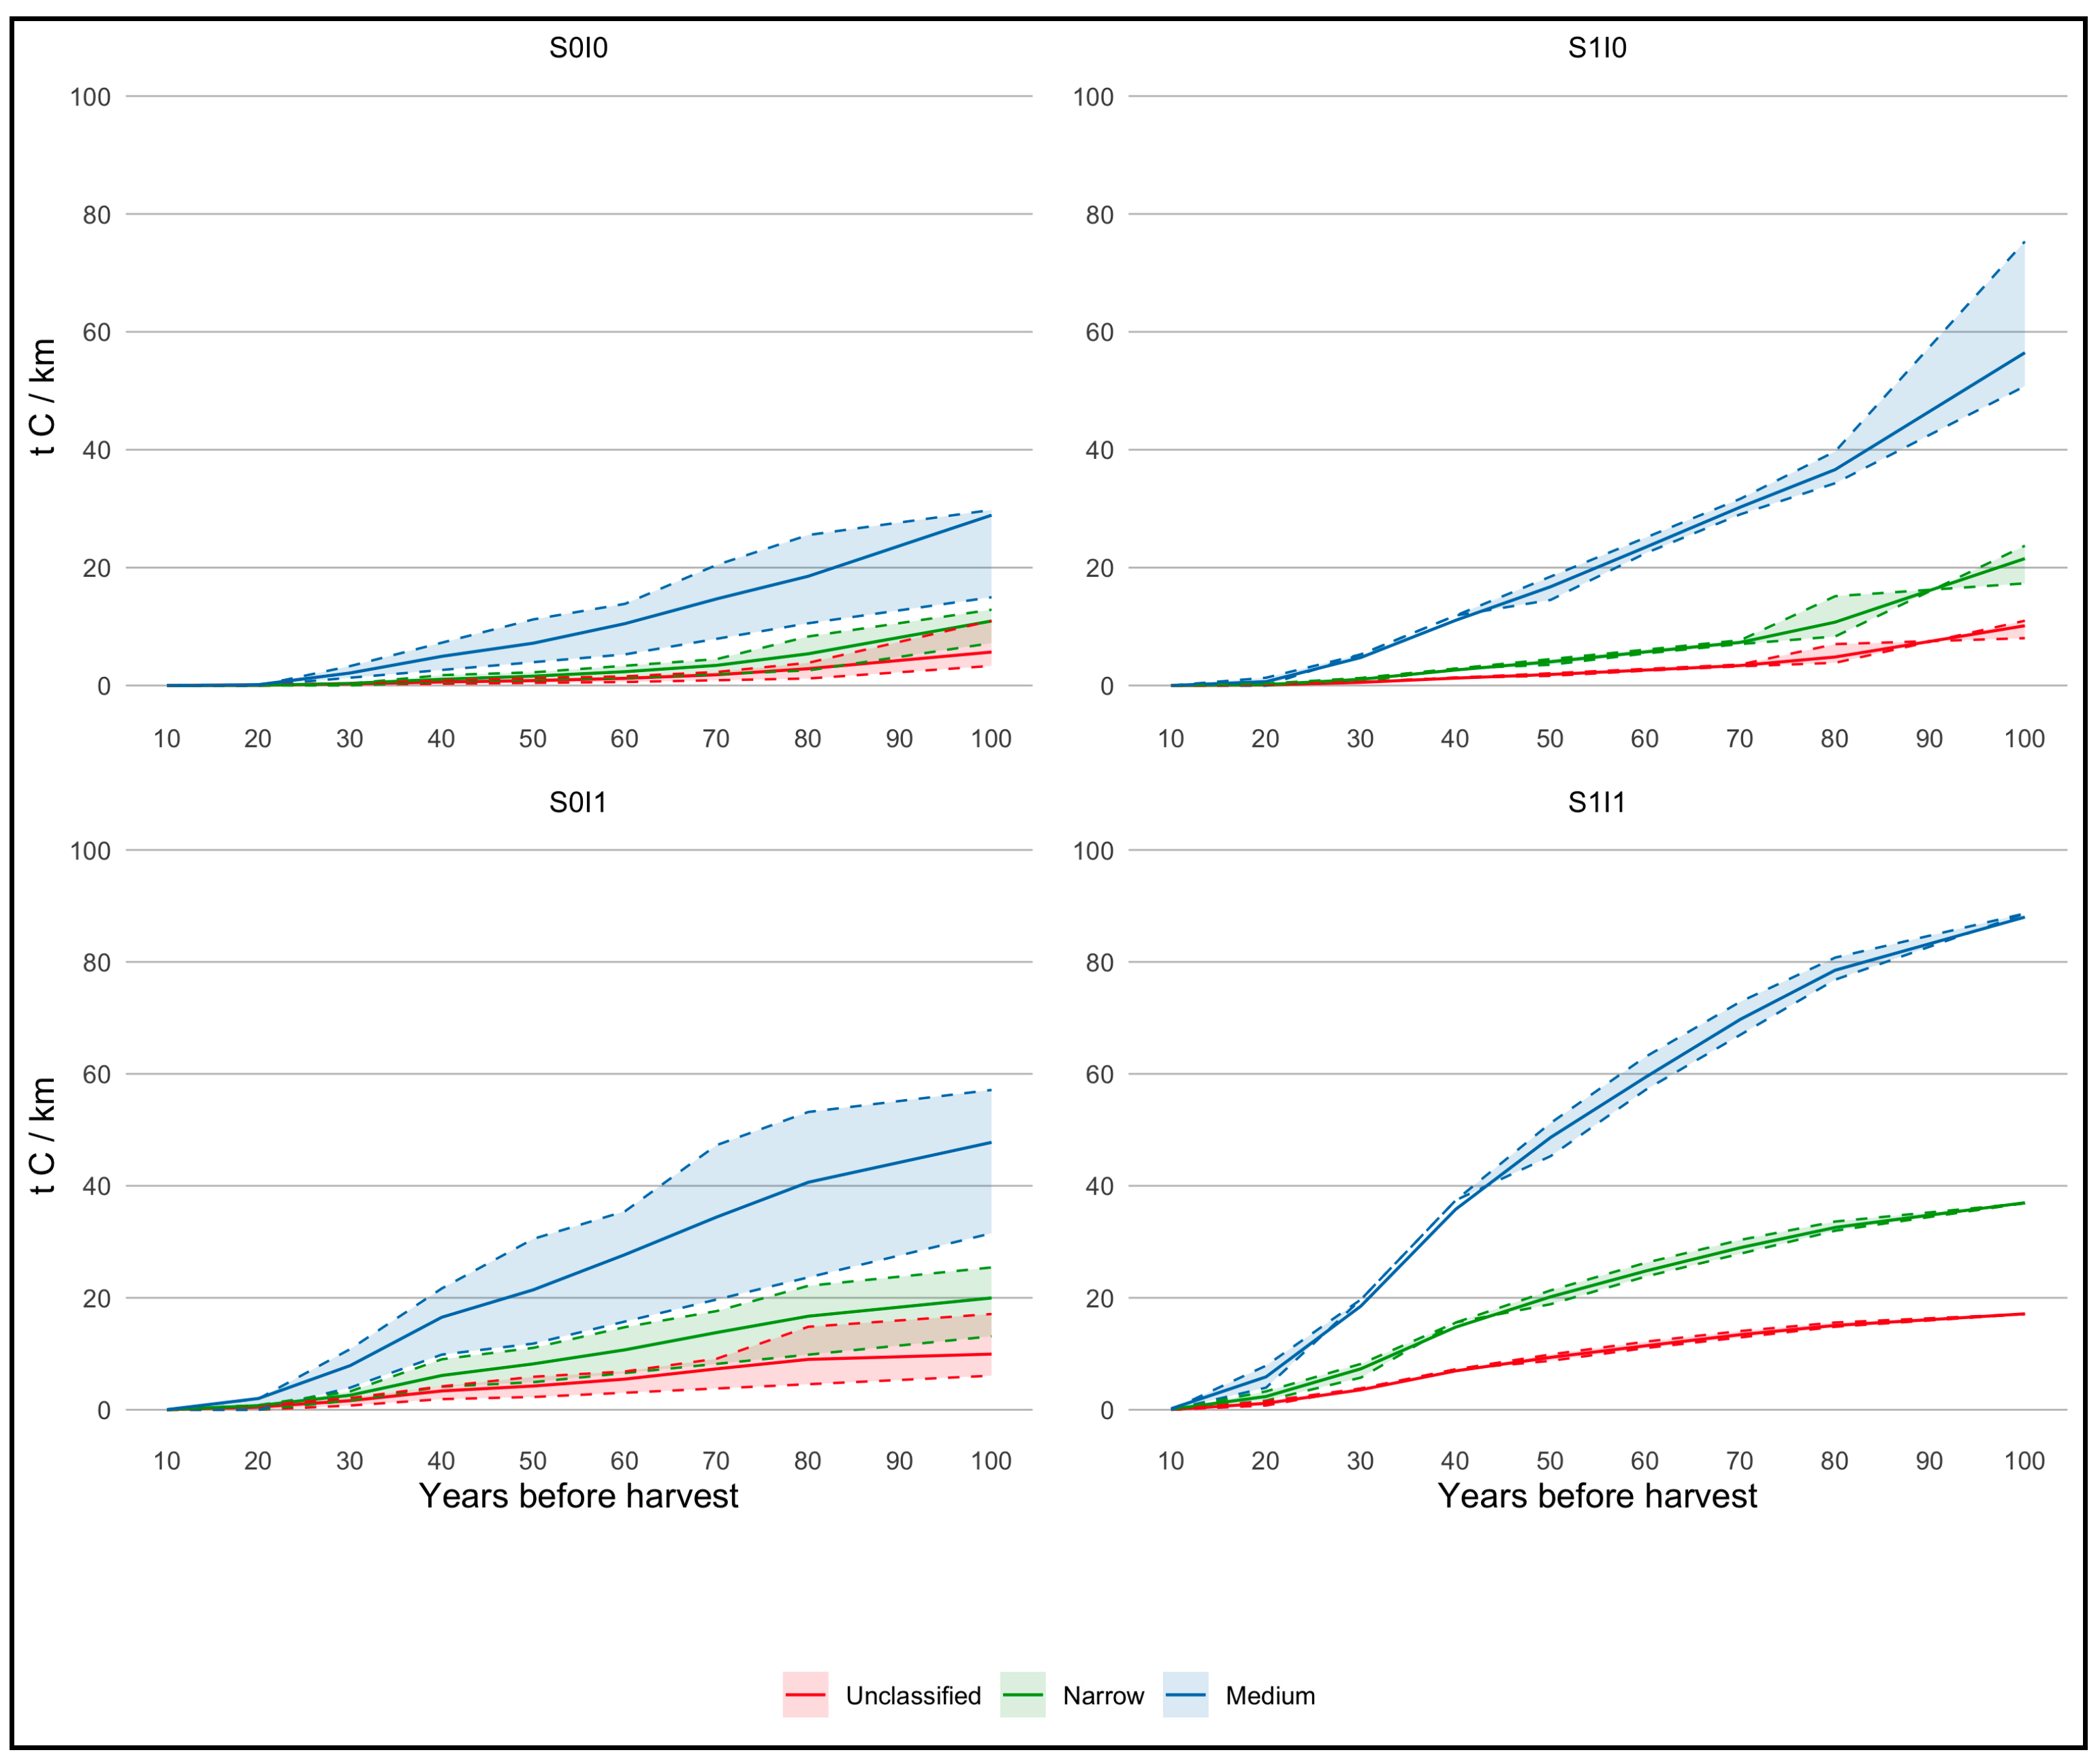
2.3.2. Evaluation Scenarios

To analyze the impact of reforestation practices, four scenarios were defined based on two main variables: (1) establishment conditions, including subsoil stripping and mechanical soil preparation, and (2) forest species selection.
The scenarios combined these variables as follows:
  • Scenario S0I0: no preparation of establishment conditions and no use of fast-growing species.
  • Scenario S1I0: the preparation of establishment conditions was applied, but no fast-growing species were used.
  • Scenario S0I1: No preparation of establishment conditions was applied, but fast-growing species were used.
  • Scenario S1I1: Both the preparation of establishment conditions and fast-growing species were implemented.
Species selection considered their commercial potential and contribution to CS [18,35], with a distinction between conventional-growth species, such as black spruce (Picea mariana B.S.P. Mill.), which is well adapted to local conditions with moderate growth rates, and fast-growing species, such as trembling aspen (Populus tremuloides Michx.), which was chosen for its capacity to produce significant biomass over a 100-year horizon [36].
For coniferous stands, black spruce was modelled at the density of 650 trees per hectare over a 100-year rotation based on typical conditions of Quebec’s boreal forests [37]. For deciduous stands, trembling aspen was used with the same density parameters. The site quality indices (SQIs) used to model the growth of these species were set at 9 and 12 for black spruce and 15 and 18 for trembling aspen, aligning with commonly observed values in boreal forests [38].
Each scenario simulated specific reforestation conditions applied to approximately 1,100,000 records, corresponding to the 294,965 moving 1 km2 windows replicated across the four reforestation scenarios. These records integrate combinations of road categories (medium, narrow, and unclassified), site conditions, and years to harvest, enabling the estimation of potential CS per hectare for each road category under each scenario.

2.3.3. Estimating Carbon in Reforested Areas

CS was calculated using the CBM-CFS3 model [23], which estimates tonnes of carbon per hectare stored in timber, incorporating growth and mortality dynamics [39,40]. Estimates were adjusted according to the forest cover types of each moving window, which were identified from Quebec’s Ecoforestry Map [26], including coniferous, deciduous, and mixed stands. These adjustments consider local differences in stand composition and climatic conditions that influence growth and carbon accumulation.
Climate data, including mean annual temperature and precipitation, were obtained from the Ouranos [25] database, covering the period from 1970 to 2020. These climate data were integrated into the model to capture regional variations and included a latitudinal gradient in the simulations. This gradient reflects climatic differences’ impact on growth rates and forest productivity [41].

2.4. Statistical Analysis

Studying CS dynamics in forest roads requires a methodological approach that combines linear, non-linear, and machine learning models adapted to spatiotemporal data’s specificities and complex interactions with environmental variables.
Multiple linear regression (MLR) was initially used as a reference model to establish a basis for comparing more advanced approaches [42]. However, more flexible methods are needed due to the non-linear relationships between CS and its determinants. Multivariate Adaptive Regression Splines (MARSs) and Generalized Additive Models (GAMs) have been applied to capture complex interactions without imposing a predefined structure on the relationships between variables [43].
These approaches help identify local trends and improve the accuracy of CS estimates.
The machine learning models random forests (RFs) and Extreme Gradient Boosting Machines (XGBMs) were selected to handle large datasets and account for spatial autocorrelation. These models are recognized for their robustness in analyzing complex forest data structures and their ability to incorporate highly correlated environmental variables [44,45].
In parallel, mixed models (MMs) were employed to model intra-category road variability. These allow for the simultaneous integration of fixed and random effects, reflecting structural differences between road categories while considering hierarchies in the data [46,47].
Model performance was assessed using five-fold cross-validation and bootstrapping, with RMSE, R2, and MAE as evaluation metrics [43]. Five-fold cross-validation was selected to ensure a good balance between accuracy and computational cost while robustly estimating model performance [48]. Given the volume of data (1,100,000 records), each fold contained over 200,000 observations, which was sufficient to capture data variability and reduce the risk of overfitting. Previous studies have shown that increasing the number of folds beyond five does not necessarily improve model performance and significantly increases the computational load [43].
Hyperparameter optimization was performed using a grid search with the caret library [49], ensuring the optimal fit of each model’s configuration. RFs were selected as the primary model due to their ability to capture non-linear and spatial effects [45,50]. Partial dependency plots (Figure 5) were used to interpret the results further to illustrate the relationships between explanatory variables and CS [51], highlighting key interactions that influence CS. The analysis also included visual diagnostics to assess model consistency, supporting the results’ robustness. By combining cross-validation, bootstrapping, and model repetitions, this methodology provides a rigorous approach to quantifying CS dynamics under different reforestation scenarios while minimizing the risk of statistical error, particularly prediction error (assessed through RMSE, MAE, and R2) and overfitting, which are controlled via cross-validation and bootstrapping [52].
All data processing and statistical analyses were performed using R (v4.2.2). The data cleaning, modelling, and visualization code will be available upon request. Due to data confidentiality agreements, access to the entire dataset may be subject to restrictions. However, upon publication, a subset of the anonymized data and processing scripts will be shared through a public repository.

3. Results

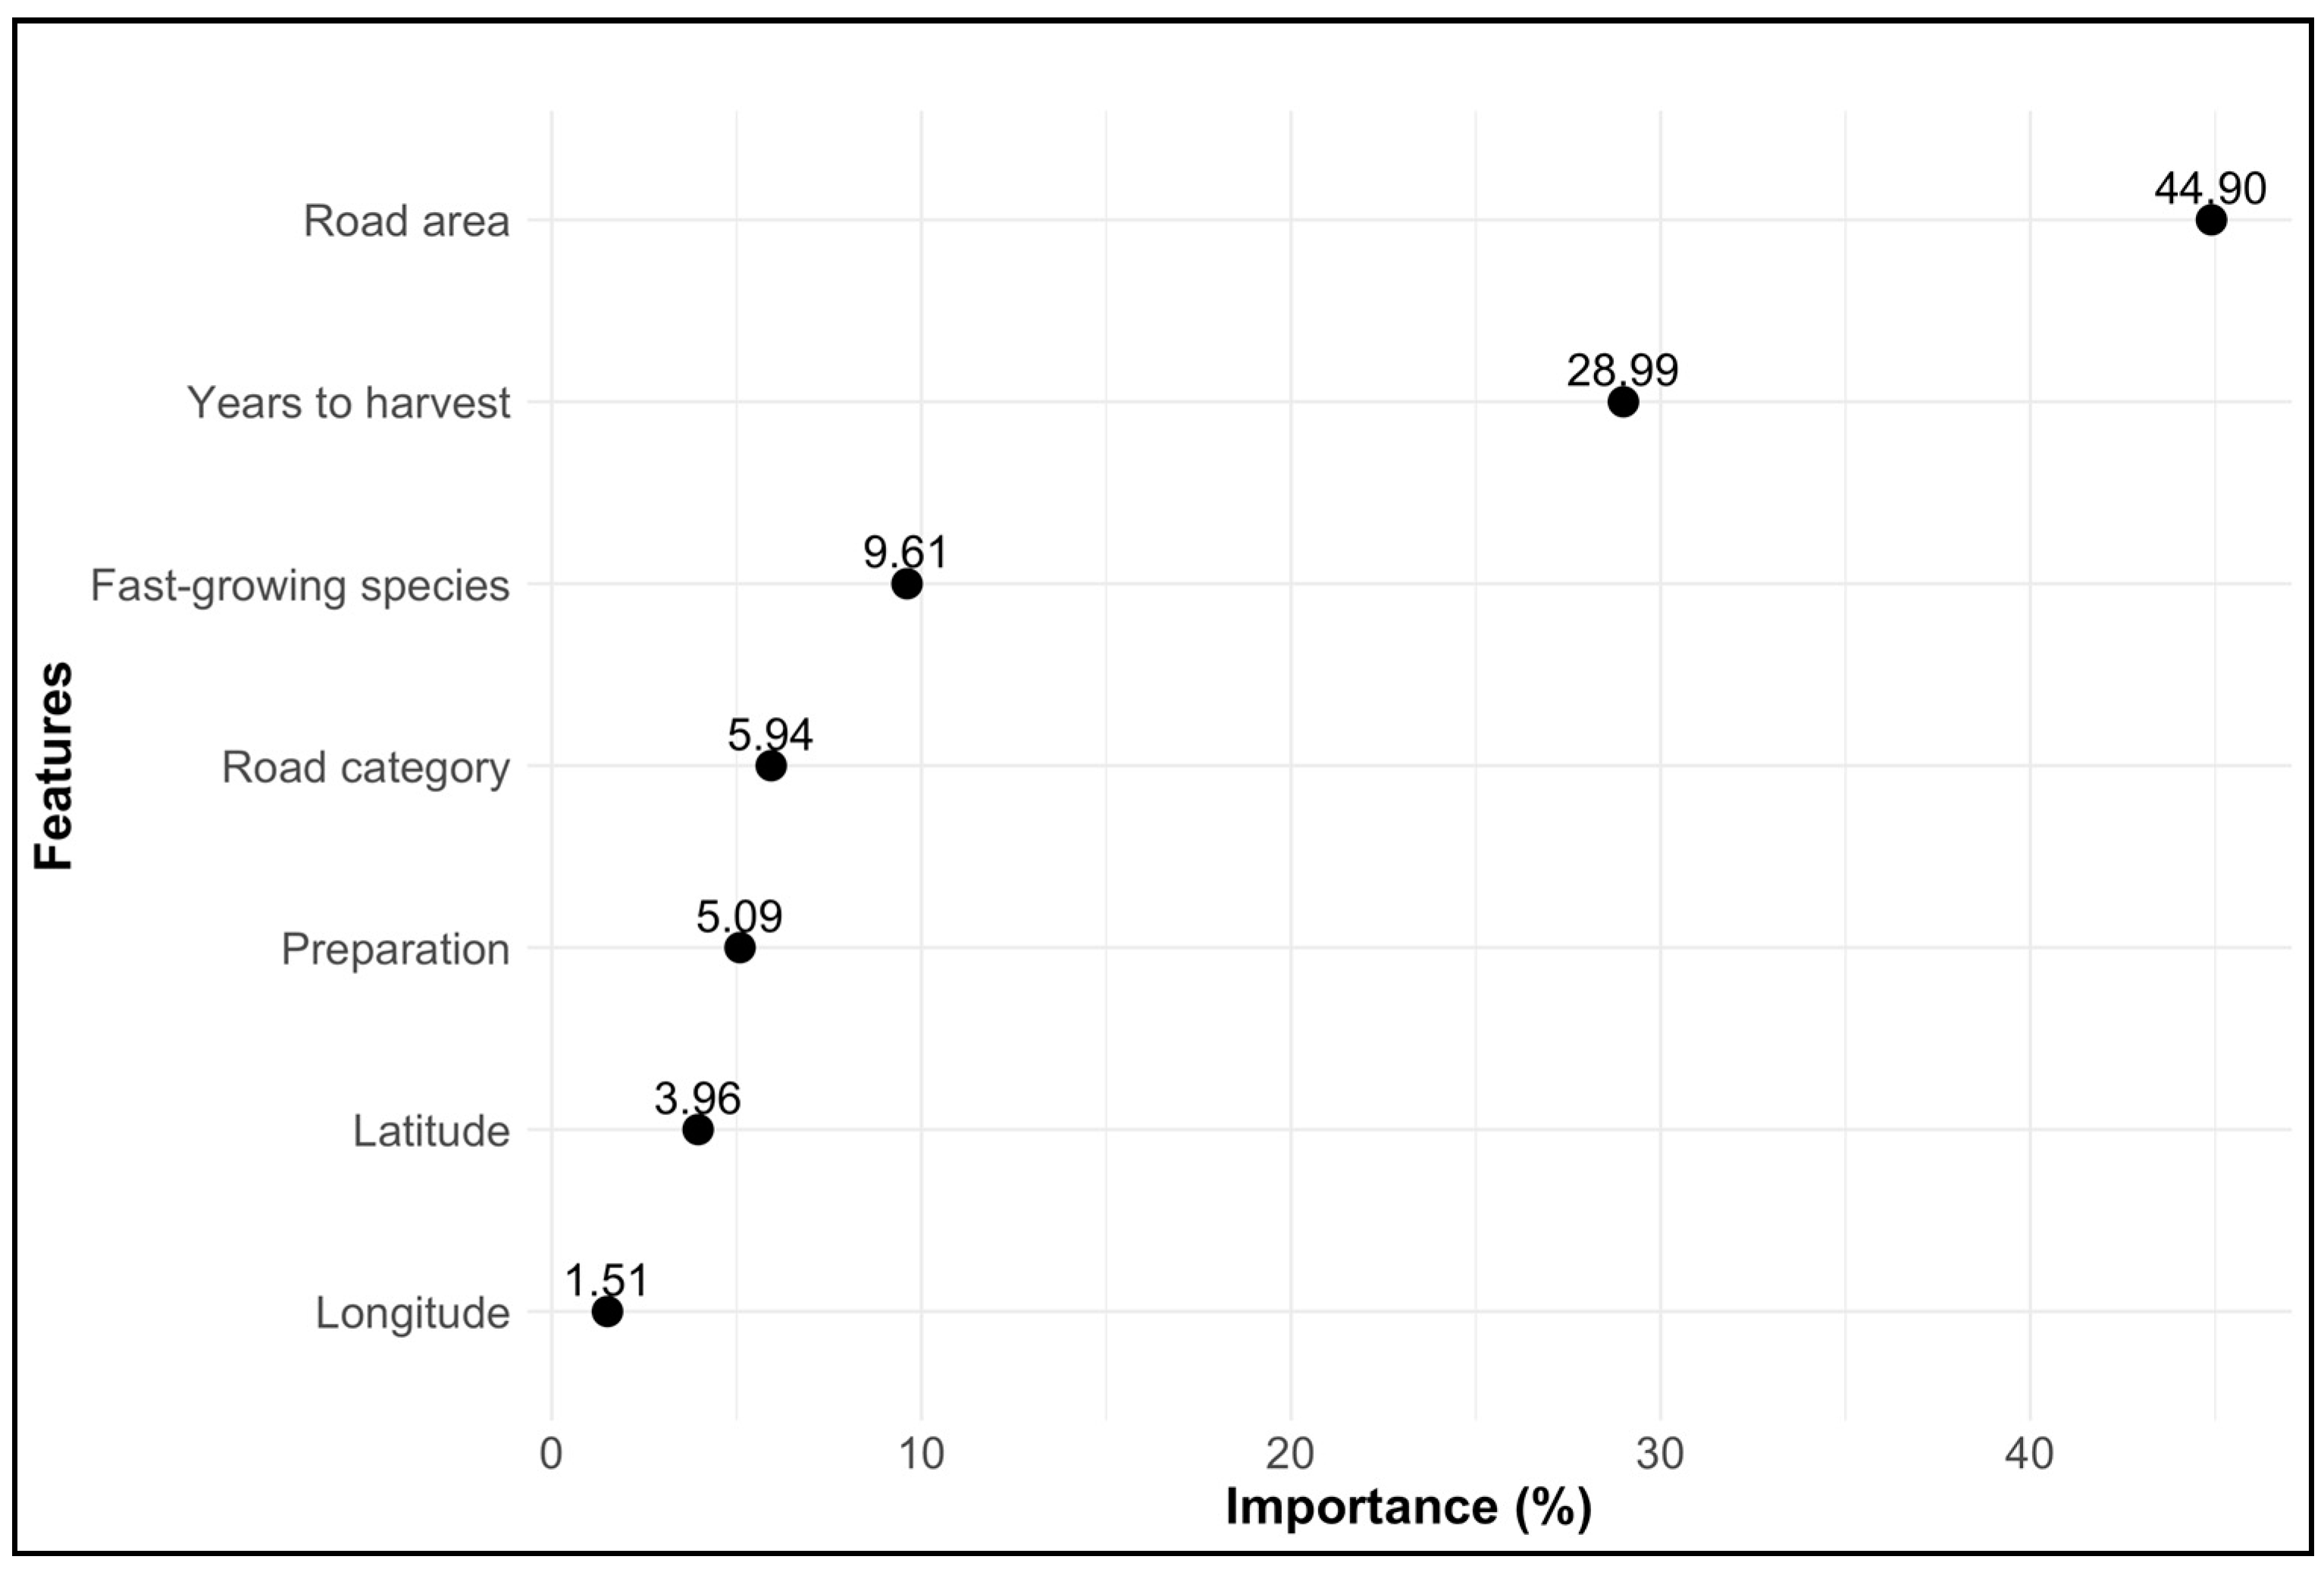
3.1. Performance of Modelling Approaches

The RF’s ability to model non-linear relationships and incorporate spatial variables has enhanced the understanding of CS dynamics. Its integration with cross-validation and bootstrapping techniques has strengthened result robustness, improving the interpretation of interactions between environmental variables and forest infrastructure. Model performance evaluations confirmed that tree-based approaches, mainly RFs, achieved the best results for forest road CS prediction (Table 2). The RF outperformed parametric models, which exhibited higher error deviations, and stood out due to its low prediction error and strong explanatory power. Additionally, its built-in OOB (Out-of-Bag) error estimation helped mitigate overfitting without requiring a separate validation set [53].
The OOB_RMSE, estimated at 4.36, represents approximately 10% of the amplitude of the target variable, confirming the model’s ability to effectively generalize new data while avoiding overfitting to training observations. In comparison, parametric models such as MLR and GAMs performed significantly worse. Although the XGBM demonstrated a competitive performance with an RMSE of 4.51, it still underperformed slightly compared to the RF. These results justify the selection of the RF as the primary model for further analysis.
The most influential variables in the estimation of CS with the RF model are illustrated in Figure 5. The area occupied by roads at the time of planting (Road area) emerges as the main factor, with a relative importance of 44.90%. This variable, which represents the proportion of the 1 km2 analysis window dedicated to forest roads, correlates directly with CS. The second factor is the number of years to harvest (Years to harvest), which accounts for 28.99% of total importance. This result highlights the impact of reforestation scenarios on CS. Among the other variables, the choice of fast-growing species (Fast-growing species) contributed 9.61%, followed by road categories (Road category) with 5.94%, the preparation of establishment conditions before planting (Preparation) with 5.09%, the latitude with 3.96%, and the longitude with 1.51%. These variables provide complementary insights into the spatial and ecological dynamics of CS.
Partial dependency plots from the RF model (Figure 6) confirm a general increase in CS associated with the area occupied by roads and the number of years remaining until harvest, emphasizing the dominant contribution of these variables to the model’s predictions. By contrast, trends linked to the latitude and longitude, though more subtle, reveal complex spatial interactions. These less pronounced effects open avenues for future research to improve our understanding of regional variability and its influence on CS.

3.2. Characterization of CS Dynamics on Forest Roads

3.2.1. CS by Road Category

The results show that medium-category roads record the highest CS per kilometer reforested values, with a noticeable increase as the time to harvest progresses. In contrast, the ungraded and narrow categories show relatively lower CS values, although an upward trend is also observed over time (Figure 7).

3.2.2. Impact of Reforestation Scenarios on CS

The results show that the scenarios incorporating site preparation for establishing and using fast-growing species (S1I1) record the highest levels of CS in all forest road categories and over all the periods analyzed (Appendix A). In particular, the total estimated for the S1I1 scenario reaches 6.8 Mt, a significant increase on the 1.15 Mt observed for the scenario with no preparation and no fast-growing species (S0I0).
This trend holds regardless of the type of roads analyzed, confirming the positive effect of site preparation on CS, even when the same species is used. The impact of choosing fast-growing species is particularly marked at the end of the simulation, reinforcing the value of a proactive approach to maximizing long-term carbon sequestration.
Furthermore, the spatial distribution of CS potential (Figure 7) highlights regional disparities. Southern areas show the highest levels thanks to favourable climatic conditions accelerating forest growth.

4. Discussion

4.1. Analysis of Reforestation Scenarios

Establishing the right conditions and selecting suitable, fast-growing species are crucial for improving CS on unused forest roads. However, introducing broadleaf species into coniferous areas contradicts the current guidelines set by the MRNF [54] and does not align with existing forest management regulations. In this study, the selection of fast-growing species was adopted as a methodological approach to quantify the potential effects of accelerated growth rates on CS rather than as an operational recommendation. This assumption allowed for the evaluation of the potential gains achievable through varying reforestation strategies without implying a shift in current forest management practices. It should be noted that fast-growing species, even local fast-growing species, often produce lower-density wood with reduced structural integrity, which may limit their capacity to retain carbon over long periods when used in wood products [55].
The RF modelling approach emphasized the influence of key variables on CS dynamics, particularly the road area and the time to harvest [51,52]. These findings underscore the critical role of forest infrastructure management in carbon strategies and demonstrate the utility of robust and flexible modelling techniques, such as RF, for capturing the complex interplay between ecological and operational factors [45,56].
The reforestation of forest roads constitutes a significant strategy for increasing CS. Nevertheless, its effectiveness depends on local environmental conditions and long-term planning [57]. This study accounted for the progressive evolution of forest roads through natural vegetation recolonization, an adjustment that prevented the overestimation of the reforestation potential. Without this correction, CS estimates would have been higher but less representative of actual field conditions. However, this approach is based on historical observations and does not capture potential future variations. Future studies should integrate progressive closure scenarios adapted to site-specific contexts to improve projections and enhance the robustness of these results.
The “Year to Harvest” variable emerged as a key temporal factor influencing CS accumulation. Extending the rotation period promotes higher carbon gains, although this effect is influenced by forest productivity and silvicultural interventions. For instance, the productivity plateau of particular species may limit the benefits of a longer harvest cycle, while early interventions could accelerate CS. Further research is necessary to clarify how these factors interact and to optimize reforestation strategies accordingly.
In addition, future research should incorporate longitudinal data on road surface evolution and variations in harvesting horizons under diverse local conditions. Enhancing spatial and temporal resolutions while refining assumptions regarding forest dynamics would provide more accurate assessments of long-term CS potential and the implications of different forest management strategies.
These findings are consistent with the existing literature, emphasizing the importance of targeted, integrated silvicultural approaches to addressing climate and ecological challenges [20,36].

4.2. Operational Management and Connectivity

Forest road closures must be planned based on a thorough analysis of both operational and environmental impacts. While this study focused on CS potential, it did not explicitly assess the effects of road deactivation on network accessibility or forestry operations. Future research should integrate spatial connectivity models to quantify these effects and comprehensively understand the trade-offs between reforestation and road access [58].
Maintaining network connectivity is critical in forest management to ensure access for forestry operations and local communities [59]. Poorly planned deactivations risk fragmenting essential infrastructure, potentially jeopardizing forest operations and limiting access [58,60]. Therefore, forest road reforestation strategies must align with operational constraints to avoid unintended disruptions.
In addition to forestry logistics and community access, forest roads serve as critical infrastructure for emergency responses, particularly in wildfire suppression. A well-maintained and accessible road network facilitates the rapid deployment of firefighting crews and equipment, acting as corridors and strategic barriers to contain fire spread. In the context of increasing climatic threats to forest ecosystems, such as the growing frequency and intensity of wildfires, deactivation strategies must be carefully assessed to ensure that they do not compromise the effectiveness and safety of fire management operations [4].
A differentiated planning approach is necessary to balance the benefits of reforestation with the need to maintain accessibility:
  • Narrow and unclassified roads: These segments typically contribute minimally to the overall connectivity of the forest road network. Their deactivation can be prioritized as it does not significantly fragment the transportation network. Furthermore, these closures can contribute to ecological connectivity by reducing habitat fragmentation, although their contribution to species connectivity remains moderate.
  • Medium roads: Owing to their width and available surface area, they offer a higher potential for enhancing habitat connectivity. However, their central role in forestry logistics requires careful planning to ensure that they remain functional for future harvesting rotations [12].
The operational feasibility of forest road reforestation depends on ecological potential and logistical constraints. This study did not include a detailed cost analysis of reforestation activities, an essential avenue for future research. Remote or hard-to-reach areas present significant challenges for transporting seedlings and conducting planting operations, leading to increased operational costs. These constraints are particularly substantial in regions where terrain conditions, distance from infrastructure, or seasonal limitations affect operational feasibility.
The spatial distribution of CS potential (Figure 7) suggests that southern areas of the study region, where growth conditions are more favourable, could be prioritized for reforestation interventions. However, prioritization strategies must also consider accessibility and cost-effectiveness, as more remote areas may involve greater logistical challenges.
An integrated approach that can balance ecological benefits with economic viability while maintaining long-term operational functionality is recommended to support a phased reforestation strategy:
  • Prioritize accessible areas with high CS potential.
  • Gradually extend interventions to remote regions by adapting strategies as new data becomes available.

4.3. Temporality and Rotation Management

The time to harvest (Years to harvest) plays a central role in CS dynamics [61]. Our results show that the reforestation of unused forest roads requires integration into long-term management strategies, ensuring that reforested areas benefit from extended growth periods before potential reactivation for forestry operations.
The road deactivation and reforestation timing should consider the operational cycles of forestry activities, particularly the years remaining until the next harvest. Extended periods before reactivation provide more significant opportunities for biomass accumulation and CS. Prioritizing reforestation in areas with longer timeframes before harvest maximizes carbon benefits without compromising future accessibility.
Incorporating reforestation into forest road management has the potential to balance ecological objectives with operational requirements. Focusing reforestation on road segments with the highest carbon recovery potential enhances CS while maintaining operational efficiency. Strategic planning should aim to
  • Reduce soil disturbance;
  • Minimize habitat fragmentation;
  • Limit the expansion of road networks in managed forests.

4.4. Analysis of the CS Potential Mosaic

Spatial variations in CS potential across the study area were observed (Figure 8), influenced by regional climate differences and local factors affecting plantation growth. Southern regions, which are generally more accessible and have favourable growth conditions, may offer better opportunities for CS gains. Conversely, northern regions require adapted strategies due to more severe climatic constraints.
Although the trends align with other studies [62], further local analyses are needed to validate these findings. This includes evaluating specific climatic parameters, such as seasonal temperature variations and precise rainfall data, to refine regional reforestation strategies.

4.5. Methodological Limitations and Practical Implications

The simplifications required for this study, driven by its regional scale, constitute a fundamental methodological limitation. One of the primary constraints involves the static estimation of the “Road area” variable. Although this variable was retroactively adjusted to reflect vegetation recolonization from the time of road construction to the present, future dynamics, such as ongoing vegetation recovery or new disturbances, were not incorporated [63]. Consequently, the results must be interpreted within the temporal bounds of the dataset and not as forward-looking projections of road evolution.
Reforestation scenarios assumed a homogeneous application of soil preparation and planting with fast-growing, locally adapted species without integrating site-specific ecological or operational variability. Factors such as soil texture, moisture availability, and biodiversity can substantially influence reforestation outcomes [64]. The effectiveness of the proposed strategies will thus depend on localized adaptations that respond to these conditions. Furthermore, the analysis did not account for terrain variability within individual road segments. A single segment may traverse contrasting landforms, such as ravines, wetlands, or stream crossings, each imposing distinct constraints on reforestation, including differences in soil stability, moisture retention, and accessibility. These spatial heterogeneities exceeded the resolution of available data and were not represented in the scenario design. Future research should incorporate high-resolution topographic and hydrological datasets to assess how terrain complexity affects reforestation feasibility and carbon recovery.
While RF models provided robust predictions in most cases, their performance diminishes when applied to atypical road segments or highly degraded soils, where the relationships between predictor variables and carbon storage (CS) may deviate from prevailing patterns. Consequently, predictions may be less reliable in areas experiencing severe compaction, poor drainage, or advanced erosion [63]. Additionally, the dataset’s limited geographic diversity and temporal range restrict the model’s generalizability beyond the Eastern Canadian boreal forest. Therefore, applying these strategies to other forest ecosystems should be approached cautiously and validated through site-specific studies. Future efforts should prioritize field validation and integrate remote sensing data to enhance model performance across diverse ecosystem conditions.
Roads classified as UN or UC may also incur higher restoration costs despite lacking engineered surfaces like gravel or pavement. These costs often arise from site preparation activities, including soil decompaction, drainage correction, and vegetation management before planting. Restoration costs have been uniformly assumed across road classes in the current modelling framework, which may underestimate the investment required for these less-defined segments. Incorporating differentiated cost parameters in future models would improve the accuracy of feasibility assessments and enable more efficient prioritization of reforestation efforts [65].
Operational challenges further constrain the large-scale implementation of reforestation strategies. High costs and logistical barriers, such as limited workforce availability, transportation difficulties, and restricted access to remote areas, may impede planting operations, particularly in low-productivity or isolated zones [65]. These practical constraints and the above methodological limitations underscore the need for continued research to refine reforestation planning. Future studies should evaluate long-term economic viability, operational efficiency, and post-restoration monitoring to enhance practical implementation. Moreover, incorporating the perspectives of local populations, such as land use priorities, cultural values, and perceived impacts, would strengthen the social relevance and acceptability of reforestation strategies.

4.6. Strategic Planning and Prioritization of Reforestation Areas

Integrated planning tools like Woodstock and Planex provide opportunities to organize and prioritize forest road reforestation by incorporating multi-criterion analyses [66,67]. Combining CS potential with operational costs and ecological constraints enables effective intervention targeting.
Integrating these tools with spatial analyses (Figure 8) facilitates identifying priority areas for reforestation. This strategy can mitigate ecological impacts associated with road networks, such as habitat fragmentation and reduced connectivity for sensitive species, while addressing economic considerations. Sensitive species particularly affected by forest road networks include woodland caribou, certain amphibians, and forest birds, as documented in regional conservation plans and biodiversity strategies [68,69].
By maintaining this approach, integrating multi-criterion frameworks can facilitate precise planning, enhance ecosystem resilience to climate challenges, and balance ecological priorities with operational feasibility. This study emphasizes the importance of adopting global strategies to optimize CS while maintaining the functionality and sustainability of forest operations.

5. Conclusions

This study highlights the potential of reforesting unused forest roads to enhance carbon storage in Quebec’s boreal forests. By integrating spatial modelling with forest road chronology, the research delivers a precise spatial and temporal assessment of reforestation opportunities across a heterogeneous landscape. The analysis demonstrates that targeted interventions, particularly those combining soil preparation with fast-growing species, can produce substantial long-term gains, with medium-category roads across the study area capable of storing up to 6.8 million tons of additional carbon over a 40–100-year horizon. Among the variables evaluated, road area, time to harvest, and species selection were identified as the most influential predictors of carbon storage potential. The development of a spatially explicit map that integrates each road segment’s location and estimated construction year provides a valuable decision support tool for prioritizing reforestation efforts based on their carbon sequestration potential. Although the results must be interpreted within the methodological limitations of the study, such as regional generalizations and uniform scenario assumptions, the findings offer a strong foundation for incorporating forest road reforestation into adaptive climate mitigation strategies. Future research should include field validation, high-resolution environmental data, and advanced spatial planning approaches to identify segments with the greatest potential impact. When implemented through geographically explicit forest planning, the reforestation of unused roads represents a scalable and strategic pathway to restoring carbon stocks and advancing sustainable forest management.

Author Contributions

Conceptualization, A.V.E. and O.V.; methodology, A.V.E., O.V. and F.G.; software, A.V.E.; validation, A.V.E., O.V. and F.G.; formal analysis, A.V.E. and O.V.; investigation, A.V.E., O.V. and F.G.; resources, O.V.; data curation, A.V.E. and O.V.; writing—original draft preparation, A.V.E. and O.V.; writing—review and editing, A.V.E., O.V. and F.G.; visualization, A.V.E., O.V. and F.G.; supervision, O.V. and F.G.; project administration, O.V.; funding acquisition, O.V. All authors have read and agreed to the published version of the manuscript.

Funding

This research was funded by the Fonds de recherche du Québec—Nature et technologies (FRQNT), grant number 308324, under the project “Contribution du secteur forestier à l’atténuation des effets des changements climatiques”. The principal investigator (PI) for this grant is Mathieu Bouchard, with co-investigators Osvaldo Valeria and François Girard.

Data Availability Statement

The data presented in this study will be made available upon request from the corresponding author.

Acknowledgments

We thank all the individuals involved in the project for their expertise and assistance in all aspects of our study and for their help in developing and reviewing the manuscript.

Conflicts of Interest

The authors declare no conflicts of interest.

Appendix A

Table A1. Carbon storage (Mt) in the study area by road category and forest management scenario over time intervals of 0–20 years, 21–40 years, 41–60 years, and 61–100 years before harvesting.
Years to Harvest
ScenarioRoad Category0–2021–4041–6061–100Total (ton × 103)
S0I0UNCLASSIFIED0106070140
S0I0NARROW01060100170
S0I0MEDIUM030270540840
Total S0I0 1150
S0I1UNCLASSIFIED05031024060
S0I1NARROW040270320630
S0I1MEDIUM1011075011702040
Total S0I1 3270
S1I0UNCLASSIFIED020150130300
S1I0NARROW020140210370
S1I0MEDIUM107061010601750
Total S1I0 2420
S1I1UNCLASSIFIED01106904301230
S1I1NARROW10906606501410
S1I1MEDIUM20230165022604160
Total S1I1 6800

References

  1. FAO. The State of the World’s Forests 2022. In Forest Pathways for Green Recovery and Building Inclusive, Resilient and Sustainable Economies; FAO: Rome, Italy, 2022. [Google Scholar]
  2. Ryan, T.; Phillips, H.; Ramsay, J.; Dempsey, J. Forest Road Manual: Guidelines for the Design, Construction and Management of Forest Roads; COFORD: Dublin, Ireland, 2004. [Google Scholar]
  3. Thiffault, E.; Hannam, K.D.; Paré, D.; Titus, B.D.; Hazlett, P.W.; Maynard, D.G.; Brais, S. Effects of forest biomass harvesting on soil productivity in boreal and temperate forests—A review. Environ. Rev. 2011, 19, 278–309. [Google Scholar] [CrossRef]
  4. Thompson, M.P.; Gannon, B.M.; Caggiano, M.D. Forest Roads and Operational Wildfire Response Planning. Forests 2021, 12, 110. [Google Scholar] [CrossRef]
  5. Coffin, A.W. From roadkill to road ecology: A review of the ecological effects of roads. J. Transp. Geogr. 2007, 15, 396–406. [Google Scholar] [CrossRef]
  6. MRNF. Forest Harvesting Not a Cause of Deforestation in Quebec; MRNF: Québec, QC, Canada, 2022. [Google Scholar]
  7. Boston, K. The potential effects of forest roads on the environment and mitigating their impacts. Curr. For. Rep. 2016, 2, 215–222. [Google Scholar] [CrossRef]
  8. Caliskan, E. Environmental impacts of forest road construction on mountainous terrain. Iran. J. Environ. Health Sci. Eng. 2013, 10, 23. [Google Scholar] [CrossRef]
  9. Labelle, E.R.; Jaeger, D. Soil Compaction Caused by Cut-to-Length Forest Operations and Possible Short-Term Natural Rehabilitation of Soil Density. Soil Sci. Soc. Am. J. 2011, 75, 2314–2329. [Google Scholar] [CrossRef]
  10. St-Pierre, F.; Drapeau, P.; St-Laurent, M.-H. Drivers of vegetation regrowth on logging roads in the boreal forest: Implications for restoration of woodland caribou habitat. For. Ecol. Manag. 2021, 482, 118846. [Google Scholar] [CrossRef]
  11. Kolka, R.K.; Smidt, M.F. Effects of forest road amelioration techniques on soil bulk density, surface runoff, sediment transport, soil moisture and seedling growth. For. Ecol. Manag. 2004, 202, 313–323. [Google Scholar] [CrossRef]
  12. Nazari, M.; Arthur, E.; Lamandé, M.; Keller, T.; Bilyera, N.; Bickel, S. A Meta-analysis of Soil Susceptibility to Machinery-Induced Compaction in Forest Ecosystems Across Global Climatic Zones. Curr. For. Rep. 2023, 9, 370–381. [Google Scholar] [CrossRef]
  13. Mayer, M.; Prescott, C.E.; Abaker, W.E.; Augusto, L.; Cécillon, L.; Ferreira, G.W.; James, J.; Jandl, R.; Katzensteiner, K.; Laclau, J.P.; et al. Tamm Review: Influence of forest management activities on soil organic carbon stocks: A knowledge synthesis. For. Ecol. Manag. 2020, 466, 118127. [Google Scholar] [CrossRef]
  14. Lyons, C.K.; Borz, S.A.; Harvey, C.; Ramantswana, M.; Sakai, H.; Visser, R. Forest roads: Regional perspectives from around the world. Int. J. For. Eng. 2023, 34, 190–203. [Google Scholar] [CrossRef]
  15. Braham, N.; Valeria, O.; Imbeau, L. Characterization of Vegetation Dynamics on Linear Features Using Airborne Laser Scanning and Ensemble Learning. Forests 2023, 14, 511. [Google Scholar] [CrossRef]
  16. Kastridis, A. Impact of Forest Roads on Hydrological Processes. Forests 2020, 11, 1201. [Google Scholar] [CrossRef]
  17. Nave, L.E.; Walters, B.F.; Hofmeister, K.L.; Perry, C.H.; Mishra, U.; Domke, G.M.; Swanston, C.W. The role of reforestation in carbon sequestration. New For. 2019, 50, 115–137. [Google Scholar] [CrossRef]
  18. Xue, M.; Dai, M.; Li, H.; Deng, H.; Wang, S.; Sun, M.; Wang, Y. Understanding the benefits and challenges of harvested wood products in response to climate change. Resour. Conserv. Recycl. 2024, 209, 107739. [Google Scholar] [CrossRef]
  19. Wernick, I.K.; Kauppi, P.E. Storing carbon or growing forests? Land Use Policy 2022, 121, 106319. [Google Scholar] [CrossRef]
  20. Lefebvre, D.; Williams, A.G.; Kirk, G.J.; Paul; Burgess, J.; Meersmans, J.; Silman, M.R.; Román-Dañobeytia, F.; Farfan, J.; Smith, P. Assessing the carbon capture potential of a reforestation project. Sci. Rep. 2021, 11, 19907. [Google Scholar] [CrossRef]
  21. Ameray, A.; Bergeron, Y.; Cavard, X. Modelling the potential of forest management to mitigate climate change in Eastern Canadian forests. Sci. Rep. 2023, 13, 14506. [Google Scholar] [CrossRef]
  22. Ménard, I.; Thiffault, E.; Boulanger, Y.; Boucher, J.-F. Multi-model approach to integrate climate change impact on carbon sequestration potential of afforestation scenarios in Quebec, Canada. Ecol. Model. 2022, 473, 110144. [Google Scholar] [CrossRef]
  23. Kurz, W.A.; Dymond, C.C.; White, T.M.; Stinson, G.; Shaw, C.H.; Rampley, G.J.; Smyth, C.; Simpson, B.N.; Neilson, E.T.; Trofymow, J.A.; et al. CBM-CFS3: A model of carbon-dynamics in forestry and land-use change implementing IPCC standards. Ecol. Model. 2009, 220, 480–504. [Google Scholar] [CrossRef]
  24. Apps, M.J.; Kurz, W.A.; Beukema, S.J.; Bhatti, J.S. Carbon budget of the Canadian forest product sector. Environ. Sci. Policy 1999, 2, 25–41. [Google Scholar] [CrossRef]
  25. Ouranos. Ouranos: Regional Climatology and Adaptation to Climate Change. Available online: https://www.ouranos.ca/ (accessed on 25 May 2024).
  26. MRNF. Carte écoforestière à jour Provinciale, dans Données Québec, 2017, mis à jour le 28 Septembre 2023. Available online: https://www.donneesquebec.ca/recherche/dataset/carte-ecoforestiere-avec-perturbations (accessed on 15 January 2024).
  27. Robitaille, A.; Saucier, J. Paysages régionaux du Québec méridional. In Direction de la Gestion des Stocks Forestiers et Direction des Relations Publiques, Ministère des Ressources Naturelles du Québec; Publication du Québec: Québec, QC, Canada, 1998. [Google Scholar]
  28. Saucier, J.P.; Bergeron, J.F.; Grondin, P.; Robitaille, A. Les Régions Écologiques du Québec Méridional: Un des Éléments du Système Hiérarchique de Classification Écologique du Territoire mis au Point par le Ministère des Ressources Naturelles. 1998; pp. 1–12. Available online: https://www.researchgate.net/publication/330638545_Les_regions_ecologiques_du_Quebec_meridional_un_des_elements_du_systeme_hierarchique_de_classification_ecologique_du_territoire_mis_au_point_par_le_Ministere_des_Ressources_Naturelles (accessed on 2 February 2025).
  29. Turner, M. Landscape Ecology in Theory and Practice; Springer: New York, NY, USA, 2001. [Google Scholar]
  30. Bergeron, J.F.; Saucier, J.P.; Robert, D.; Robitaille, A. Québec forest ecological classification program. For. Chron. 1992, 68, 53–63. [Google Scholar] [CrossRef]
  31. Gouvernement du Québec. Adresses Québec: Guide de l’utilisateur; Gouvernement du Québec: Québec, QC, Canada, 2024. [Google Scholar]
  32. MRNF. Guide D’application du Règlement sur L’aménagement Durable des Forêts du Domaine de L’état; MRNF: Québec, QC, Canada, 2022. [Google Scholar]
  33. Girardin, P.; Valeria, O.; Girard, F. Measuring Spatial and Temporal Gravelled Forest Road Degradation in the Boreal Forest. Remote Sens. 2022, 14, 457. [Google Scholar] [CrossRef]
  34. Toms, S. ArcPy and ArcGIS–Geospatial Analysis with Python; Packt Publishing Ltd.: Birmingham, UK, 2015. [Google Scholar]
  35. Giasson, L.A.; Thiffault, E.; Lebel, L.; Carle, J.F. Carbon balance of forest management and wood production in the boreal forest of Quebec (Canada). Front. For. Glob. Change 2023, 6, 1242218. [Google Scholar] [CrossRef]
  36. Ameray, A.; Bergeron, Y.; Valeria, O.; Girona, M.M.; Cavard, X. Forest carbon management: A review of silvicultural practices and management strategies across boreal, temperate and tropical forests. Curr. For. Rep. 2021, 7, 245–266. [Google Scholar] [CrossRef]
  37. Pothier, D. Actualisation des Tables de Production Pour les Principales Espèces Forestières du Québec; Ministère des Ressources Naturelles, Forêt Québec: Québec, QC, Canada, 1998. [Google Scholar]
  38. Laflèche, V.; Bernier, S.; Saucier, J.; Gagné, C. Indices de Qualité de Station des Principales Essences Commerciales en Fonction des Types Écologiques du Québec Mé-Ridional; Ministère des Ressources naturelles (Provincial Department of Natural Resources): Quebec, QC, Canada, 2013. [Google Scholar]
  39. Jasinevičius, G.; Lindner, M.; Cienciala, E.; Tykkyläinen, M. Carbon Accounting in Harvested Wood Products: Assessment Using Material Flow Analysis Resulting in Larger Pools Compared to the IPCC Default Method. J. Ind. Ecol. 2018, 22, 121–131. [Google Scholar] [CrossRef]
  40. Johnston, C.M.; Radeloff, V.C. Global mitigation potential of carbon stored in harvested wood products. Proc. Natl. Acad. Sci. USA 2019, 116, 14526–14531. [Google Scholar] [CrossRef]
  41. Huang, J.; Tardif, J.C.; Bergeron, Y.; Denneler, B.; Berninger, F.; Girardin, M.P. Radial growth response of four dominant boreal tree species to climate along a latitudinal gradient in the eastern Canadian boreal forest. Glob. Change Biol. 2010, 16, 711–731. [Google Scholar] [CrossRef]
  42. Pinheiro, J.C.; Bates, D.M. Linear mixed-effects models: Basic concepts and examples. In Mixed-Effects Models in S and S-Plus; Springer: New York, NY, USA, 2000; pp. 3–56. [Google Scholar] [CrossRef]
  43. Bruce, P.; Bruce, A.; Gedeck, P. Practical Statistics for Data Scientists: 50+ Essential Concepts Using R and Python; O’Reilly Media: Sebastopol, CA, USA, 2020. [Google Scholar]
  44. Chen, T.; Guestrin, C. Xgboost: A scalable tree boosting system. In Proceedings of the 22nd ACM Sigkdd International Conference on Knowledge Discovery and Data Mining, San Francisco, CA, USA, 13–17 August 2016; pp. 785–794. [Google Scholar]
  45. Breiman, L. Random forests. Mach. Learn. 2001, 45, 5–32. [Google Scholar] [CrossRef]
  46. Stroup, W.W. Generalized Linear Mixed Models: Modern Concepts, Methods and Applications; CRC Press: New York, NY, USA, 2012. [Google Scholar]
  47. Zuur, A.F.; Ieno, E.N.; Walker, N.J.; Saveliev, A.A.; Smith, G.M. Mixed Effects Models and Extensions in Ecology with R; Springer: New York, NY, USA, 2009; Volume 574. [Google Scholar]
  48. Kohavi, R. A Study of Cross-Validation and Bootstrap for Accuracy Estimation and Model Selection; Morgan Kaufman Publishing: Burlington, MA, USA, 1995. [Google Scholar]
  49. Kuhn, M. Building Predictive Models in R Using the caret Package. J. Stat. Softw. 2008, 28, 1–26. [Google Scholar] [CrossRef]
  50. Wright, M.N.; Ziegler, A. Ranger: A fast implementation of random forests for high dimensional data in C++ and R. arXiv 2015, arXiv:1508.04409. [Google Scholar] [CrossRef]
  51. Kosicki, J.Z. Generalised Additive Models and Random Forest Approach as effective methods for predictive species density and functional species richness. Environ. Ecol. Stat. 2020, 27, 273–292. [Google Scholar] [CrossRef]
  52. Greener, J.G.; Kandathil, S.M.; Moffat, L.; Jones, D.T. A guide to machine learning for biologists. Nat. Rev. Mol. Cell Biol. 2022, 23, 40–55. [Google Scholar] [CrossRef] [PubMed]
  53. Segal, M.R. Machine Learning Benchmarks and Random Forest Regression; UCSF, Center for Bioinformatics and Molecular Biostatistics: San Francisco, CA, USA, 2004. [Google Scholar]
  54. Gouvernement du Québec. Loi sur L’aménagement Durable du Territoire Forestier; Les Publications du Quebec: Quebec, QC, Canada, 2024; Chapter A-18.1. [Google Scholar]
  55. Zhang, X.; Chen, J.; Dias, A.C.; Yang, H. Improving Carbon Stock Estimates for In-Use Harvested Wood Products by Linking Production and Consumption—A Global Case Study. Environ. Sci. Technol. 2020, 54, 2565–2574. [Google Scholar] [CrossRef]
  56. Nabiollahi, K.; Eskandari, S.; Taghizadeh-Mehrjardi, R.; Kerry, R.; Triantafilis, J. Assessing soil organic carbon stocks under land-use change scenarios using random forest models. Carbon Manag. 2019, 10, 63–77. [Google Scholar] [CrossRef]
  57. Chazdon, R.L. Beyond deforestation: Restoring forests and ecosystem services on degraded lands. Science 2008, 320, 1458–1460. [Google Scholar] [CrossRef]
  58. Lacerte, R.; Leblond, M.; St-Laurent, M.H. Determinants of vegetation regeneration on forest roads following restoration treatments: Implications for boreal caribou conservation. Restor. Ecol. 2021, 29, e13414. [Google Scholar] [CrossRef]
  59. Hunt, L.M.; Harvey, L.R.; Saunders, K.C. Managing Forest Road Access on Public Lands: A Conceptual Model of Conflict. Soc. Nat. Resour. 2009, 22, 128–142. [Google Scholar] [CrossRef]
  60. Öhman, K.; Lämås, T. Reducing forest fragmentation in long-term forest planning by using the shape index. For. Ecol. Manag. 2005, 212, 346–357. [Google Scholar] [CrossRef]
  61. Friedlingstein, P.; O’Sullivan, M.; Jones, M.W.; Andrew, R.M.; Bakker, D.C.E.; Hauck, J.; Landschützer, P.; Le Quéré, C.; Luijkx, I.T.; Peters, G.P.; et al. Global Carbon Budget 2023. Earth Syst. Sci. Data 2023, 15, 5301–5369. [Google Scholar] [CrossRef]
  62. Düthorn, E.; Schneider, L.; Günther, B.; Gläser, S.; Esper, J. Ecological and climatological signals in tree-ring width and density chronologies along a latitudinal boreal transect. Scand. J. For. Res. 2016, 31, 750–757. [Google Scholar] [CrossRef]
  63. Conway, D. Effects of Forest Equipment on Boreal Forest Soils: A Review. Bachelor’s Thesis, Faculty of Natural Resources Management, Lakehead University, Thunder Bay, ON, Canada, 2024. Available online: https://knowledgecommons.lakeheadu.ca/handle/2453/5327 (accessed on 10 February 2025).
  64. Kemppinen, J.; Niittynen, P.; Rissanen, T.; Tyystjärvi, V.; Aalto, J.; Luoto, M. Soil moisture variations from boreal forests to the tundra. Water Resour. Res. 2023, 59, e2022WR032719. [Google Scholar] [CrossRef]
  65. Pacheco, P.; Beatty, C.; Patel, J. An economic view on the costs and benefits of forest restoration. In Restoring Forests and Trees for Sustainable Development: Policies, Practices, Impacts, and Ways Forward; Oxford University Press: Oxford, UK, 2024; p. 238. [Google Scholar]
  66. Epstein, R.; Weintraub, A.; Sessions, J.; Sessions, B.; Sapunar, P.; Nieto, E.; Bustamante, F.; Musante, H. PLANEX: A system to identify landing locations and access. In Proceedings of the International Mountain Logging and 11th Pacific Northwest Skyline Symposium, Seattle, WA, USA, 10–12 December 2001; pp. 10–12. [Google Scholar]
  67. Walters, K.R. Design and development of a generalized forest management modeling system: Woodstock. In Proceedings of the International Symposium on Systems Analysis and Management Decisions in Forestry, Valdivia, Chile, 9–12 March 1993; pp. 190–196. [Google Scholar]
  68. St-Laurent, M.-H.; Boulanger, Y.; Cyr, D.; Manka, F.; Drapeau, P.; Gauthier, S. Lowering the rate of timber harvesting to mitigate impacts of climate change on boreal caribou habitat quality in eastern Canada. Sci. Total Environ. 2022, 838, 156244. [Google Scholar] [CrossRef] [PubMed]
  69. Environment and Climate Change Canada. Action Plan for the Woodland Caribou (Rangifer tarandus caribou), Boreal Population, in Canada—Federal Actions; Environment and Climate Change Canada: Ottawa, ON, Canada, 2018; pp. 7–28. [Google Scholar]
Figure 1. The location of the study area is in Quebec’s boreal region. The red outline shows the study area, with forest roads represented in light green (medium). The grey outline indicates the provincial boundaries.
Forests 16 00688 g001
Figure 2. Graphic representation of moving windows (1 km2) by road category: thick lines represent medium roads; thin lines denote narrow roads, and segmented lines illustrate unclassified roads from the AQréseau+ database. Each window is linked to the earliest recorded disturbance requiring road access within its boundaries. For instance, windows 1 and 2 are associated with the years 1987 and 1993, while both windows 3 and 4 correspond to 1980.
Forests 16 00688 g002
Figure 3. Examples of representative road classes included in the analysis: (A) Class 03—a gravel road with a compacted granular surface; (B) Class 04—a road built directly on mineral soil; (C) Class 05—a narrow, low-capacity road on mineral soil; and (D) WI—a temporary winter road on compacted snow.
Forests 16 00688 g003
Figure 4. Cross-sectional representation of two forest road configurations. Side A depicts a reforested road with fast-growing species planted across both the roadway and right-of-way five to ten years post-planting. Side B illustrates a deactivated road with natural regeneration, primarily herbaceous species.
Forests 16 00688 g004
Figure 5. Feature importance based on the RF using permutation accuracy. Higher values on the X-axis indicate a greater contribution of each variable to explaining CS dynamics around logging roads. The ranking reflects the relative importance of all factors included in the model.
Forests 16 00688 g005
Figure 6. Partial dependence plots for the predominant variables in the RF model predicting CS. The plots illustrate the marginal effect of continuous variables, such as latitude, longitude, years to harvest, and road area, on predicted CS values. The green shaded areas represent 5% confidence bands around the model’s predicted response, highlighting variability and uncertainty in the marginal effects. Categorical variables (fast-growing species, road category, and preparation) were excluded from this analysis to focus on continuous predictors.
Forests 16 00688 g006
Figure 7. CS per kilometre of deforested road by road category and reforestation scenario. Panels show scenarios S0I0 (top left), S1I0 (top right), S0I1 (bottom left), and S1I1 (bottom right). Lines represent the mean CS per kilometre for the unclassified, narrow, and medium road categories. Shaded areas indicate the first (Q1) and third (Q3) quartiles.
Forests 16 00688 g007
Figure 8. Estimated CS potential per km2. Spatial distribution of CS potential for forest roads with 61 to 100 years to harvest under scenario S1I1. Higher potential areas, particularly in the south, reflect favourable climatic conditions that promote accelerated growth. The results represent the final estimate of CS at the end of the simulation period.
Forests 16 00688 g008
Table 1. Dimensions and classification of roads in the study area. The analysis covers roads in the medium, narrow, and unclassified categories, representing 304,438 km and an occupied surface area of 3019 km2. The table details their main characteristics, such as the type of road surface material, total length (km), mean width (m), total surface area (km2), and their relative proportion of all roads studied.
ClassRoad SurfaceCategoryMean Width (m)Surface Area (km2)Total Length (km)% of Total Road Length
03Natural gravelMedium19.753226,9659%
04Mineral soilMedium19.7136269,13323%
05Mineral soilNarrow8.221226,2939%
WICompacted snowNarrow8.241250,33817%
UNUnknownUnclassified3.88020,9397%
UCUnclassifiedUnclassified3.8421110,77036%
Total 3019304,438100%
Note: “Compacted snow” refers to temporary winter roads constructed over frozen ground, where the bearing surface is made of compacted snow or ice.
Table 2. Model performance in cross-validation (k-fold). Evaluation of model performance according to RMSE, R2, and MAE. All differences between models were statistically significant at p < 0.05.
ModelRMSER2MAE
RF4.390.9641.26
XGBM4.480.9631.60
MARS7.630.8924.68
GAM14.480.6108.99
MLR14.540.6079.01
MM14.560.6079.08
Disclaimer/Publisher’s Note: The statements, opinions and data contained in all publications are solely those of the individual author(s) and contributor(s) and not of MDPI and/or the editor(s). MDPI and/or the editor(s) disclaim responsibility for any injury to people or property resulting from any ideas, methods, instructions or products referred to in the content.

