Article

Daily Variation of Soil Greenhouse Gas Fluxes in Rubber Plantations Under Different Levels of Organic Fertilizer Substitution

1
Center for Eco-Environment Restoration of Hainan Province, School of Ecology, Hainan University, No. 58, Renmin Road, Haikou 570228, China
2
Institute of Environmental and Plant Protection, Chinese Academy of Tropical Agricultural Science, No. 4 Academy Road, Longhua District, Haikou 571101, China
3
Institute of Rubber Research, Chinese Academy of Tropical Agricultural Science, Baodao Xincun, Danzhou 571737, China
4
Sanya Tropical Ecosystem Carbon Source and Sink Field Scientific Observation and Research Station, Sanya 572022, China
5
Institute of Tropical Bamboo, Rattan & Flower, Sanya Research Base, International Center for Bamboo and Rattan, Sanya 572000, China
*
Authors to whom correspondence should be addressed.
Forests 2025, 16(4), 706; https://doi.org/10.3390/f16040706
Submission received: 24 February 2025 / Revised: 16 March 2025 / Accepted: 18 April 2025 / Published: 21 April 2025
(This article belongs to the Section Forest Soil)

Abstract

:
It has been widely recognized that replacing chemical fertilizers with organic fertilizers (organic substitution) could significantly increase the long-term productivity of the land and potentially enhance resilience to climate change. Nevertheless, there is limited information on the accurate monitoring of soil greenhouse gas (GHG) fluxes at different levels of organic substitution in rubber plantations. Before accurate estimation of soil GHG fluxes can be made, it is important to investigate diurnal variations and suitable sampling times. In this study, six treatment groups of rubber plantations in the Longjiang Farm of Baisha Li autonomous county, Hainan Island, including the control (CK), conventional fertilizer (NPK), and organic substitution treatments in which organic fertilizer replaced 25% (25%M), 50% (50%M), 75% (75%M), and 100% (100%M) of chemical nitrogen fertilizer were selected as study objectives. The soil GHG fluxes were observed by static chamber-gas chromatography for a whole day (24 h) during both wet and dry seasons. The results showed the following: (1) There was a significant single-peak daily variation of GHGs in rubber plantation soils. (2) The soil GHG fluxes observed from 9:00–12:00 are closer to the daily average fluxes. (3) Organic fertilizer substitution influenced soil CO2 and N2O fluxes and had no significant effect on soil CH4 fluxes. Fluxes of soil CO2 and N2O increased firstly and then decreased gradually when the substitution ratios exceeded 50% or 75%. (4) Soil CO2 and N2O fluxes were positively correlated with soil temperature and soil moisture, and CH4 fluxes were negatively correlated with soil temperature and soil moisture in both wet and dry seasons. The study indicated that understanding the daily pattern of GHG changes in rubber forest soils under different levels of organic fertilizer substitution and the optimal observation time could improve the accurate assessment of long-timescale observation studies.

1. Introduction

Carbon dioxide (CO2), methane (CH4), and nitrous oxide (N2O) are recognized as the primary greenhouse gases (GHGs) contributing to global warming [1]. Since 1850, concentrations of CO2, CH4, and N2O have increased by 47%, 156%, and 23%, respectively, significantly accelerating global warming [2]. Agriculture, forestry, and other land use are significant contributors to anthropogenic GHG emissions, with agricultural activities alone estimated to account for 30–50% of global GHG emissions [3]. Soils are important sources and sinks of GHGs and play a crucial role in regulating their emissions through various biological processes [4]. These processes are influenced by multiple factors, including land use and management practices. As a result, climate-smart land use management is increasingly emphasized as a strategy for reducing emissions, and the precise monitoring of soil GHG fluxes, particularly from agricultural soils, is essential for effective climate action.
In addition to conventional agricultural activities, it is possible to engage in climate-smart land-use practices by intentionally combining trees with crops or livestock, which has been extensively researched over the past few decades. Rubber plantations have undergone rapid expansion across montane mainland Southeast Asia in recent years, with projections indicating an additional 8.5 million hectares within the next decade [5]. China ranks sixth globally in natural rubber production, with a total output of 0.65 million metric tons, and Hainan Island is the primary production site within China [6]. In response to increasing rubber demand, large quantities of chemical fertilizers (primarily nitrogen-based) are applied to rubber plantations to boost yields. However, these practices significantly degrade soil health, contribute to environmental pollution, and exacerbate GHG emissions [7]. In recent years, the Ministry of Agriculture and Rural Affairs of China introduced the ‘two reductions’ policy, aimed at reducing chemical fertilizer use to promote sustainable agricultural development. Consequently, organic fertilizers have become an important alternative for nutrient management in rubber plantations. Organic fertilizers could offer various nutrients essential for crop growth [8], and they contain abundant organic substances [9]. Although they enhance soil fertility and benefit crop growth, organic fertilizers can also increase GHG emissions, particularly CO2, due to organic decomposition [10]. Studies have shown that while chemical fertilizers may inhibit CH4 emissions [11], organic fertilizers tend to promote them [12]. Similarly, N2O emissions are often higher with organic fertilizer, mirroring the trends observed with CO2 and CH4 emissions [13]. Although some efforts have been made to quantify the impact of replacing chemical fertilizers with organic alternatives on soil GHG emissions, the results have varied considerably among different agricultural soils [14,15]. Assessing the impact of organic fertilizer substitution on soil GHG emissions is an important aspect of assessing the ecological benefits of organic fertilizer substitution. Therefore, it is important to understand how soil GHG fluxes vary in rubber plantations under different levels of organic substitution, as it is conducive for evaluating the ecological benefits of using organic fertilizer to replace chemical nitrogen fertilizer (organic substitution).
Static chamber-gas chromatography has been widely used for the observation of GHG fluxes due to its simplicity and cost-effectiveness. However, this method also has limitations, including its inability to capture fine-scale spatial variation and potential biases in measurement under certain environmental conditions [16]. Moreover, it is particularly important to account for the daily variation in soil GHG fluxes within the study area, as fluctuations can be significant and may influence the representativeness of the measurements [17]. Previous research has highlighted optimal observation times for various crops and ecosystems, underscoring the need for site-specific sampling protocols. For example, Zhu et al. determined that the CO2 and N2O fluxes from 9:00–11:00 were representative of the daily fluxes in rice soil in Ningxia Province, China [18]. Similarly, Wang et al. found that soil CO2 fluxes at 9:00 and 21:00 closely matched the daily mean value in tobacco fields in Zhengzhou City [19]. Bruno et al. reported that 9:00–10:00 and 21:00–22:00 were the optimal sampling times for soil N2O in farmland in the United Kingdom and grasslands in Brazil, respectively [20]. Additionally, Cueva et al. observed that 17:00–19:00 and 20:00–21:00 were suitable sampling times for soil GHG emissions, contrasting with morning sampling times used in other studies [21]. Therefore, to accurately evaluate GHG emissions, determining the daily patterns of soil GHG fluxes and optimal sampling times in different ecosystems remains necessary.
Therefore, this study analyzed daily variations in GHG fluxes from rubber plantation soil under different organic substitution treatments using the static chamber method coupled with gas chromatography. The specific objectives of this study were (1) to characterize daily GHG flux patterns in rubber plantation soils under varying levels of organic substitution; (2) to explore how GHG emissions in rubber plantation soils change under levels of different organic substitution; (3) to identify the optimal sampling time for GHG fluxes under these conditions. This study aims to enhance the accuracy of GHG flux estimates in rubber plantation ecosystems, contributing to improved emission monitoring practices.

2. Materials and Methods

2.1. Study Area

The experimental area is located at Longjiang Farm in Baisha Li autonomous county, Hainan Island (19°22′35″ N, 109°17′41″ E, average elevation 120 m). The site features flat terrain, abundant rainfall, and a tropical monsoon climate, with a distinct wet season from May to November and a dry season from December to April. The average annual temperature is 23.4 °C, and the average annual precipitation is approximately 1960 mm, with roughly 80% of rainfall occurring during the wet season. The soil texture type of the experimental area is sandy clay loam [22]. The rubber plantation was planted in 2004 and rubber tapping was started in 2011. The rubber clones are PR107, and the spacing of the plants is 3 m × 5 m.

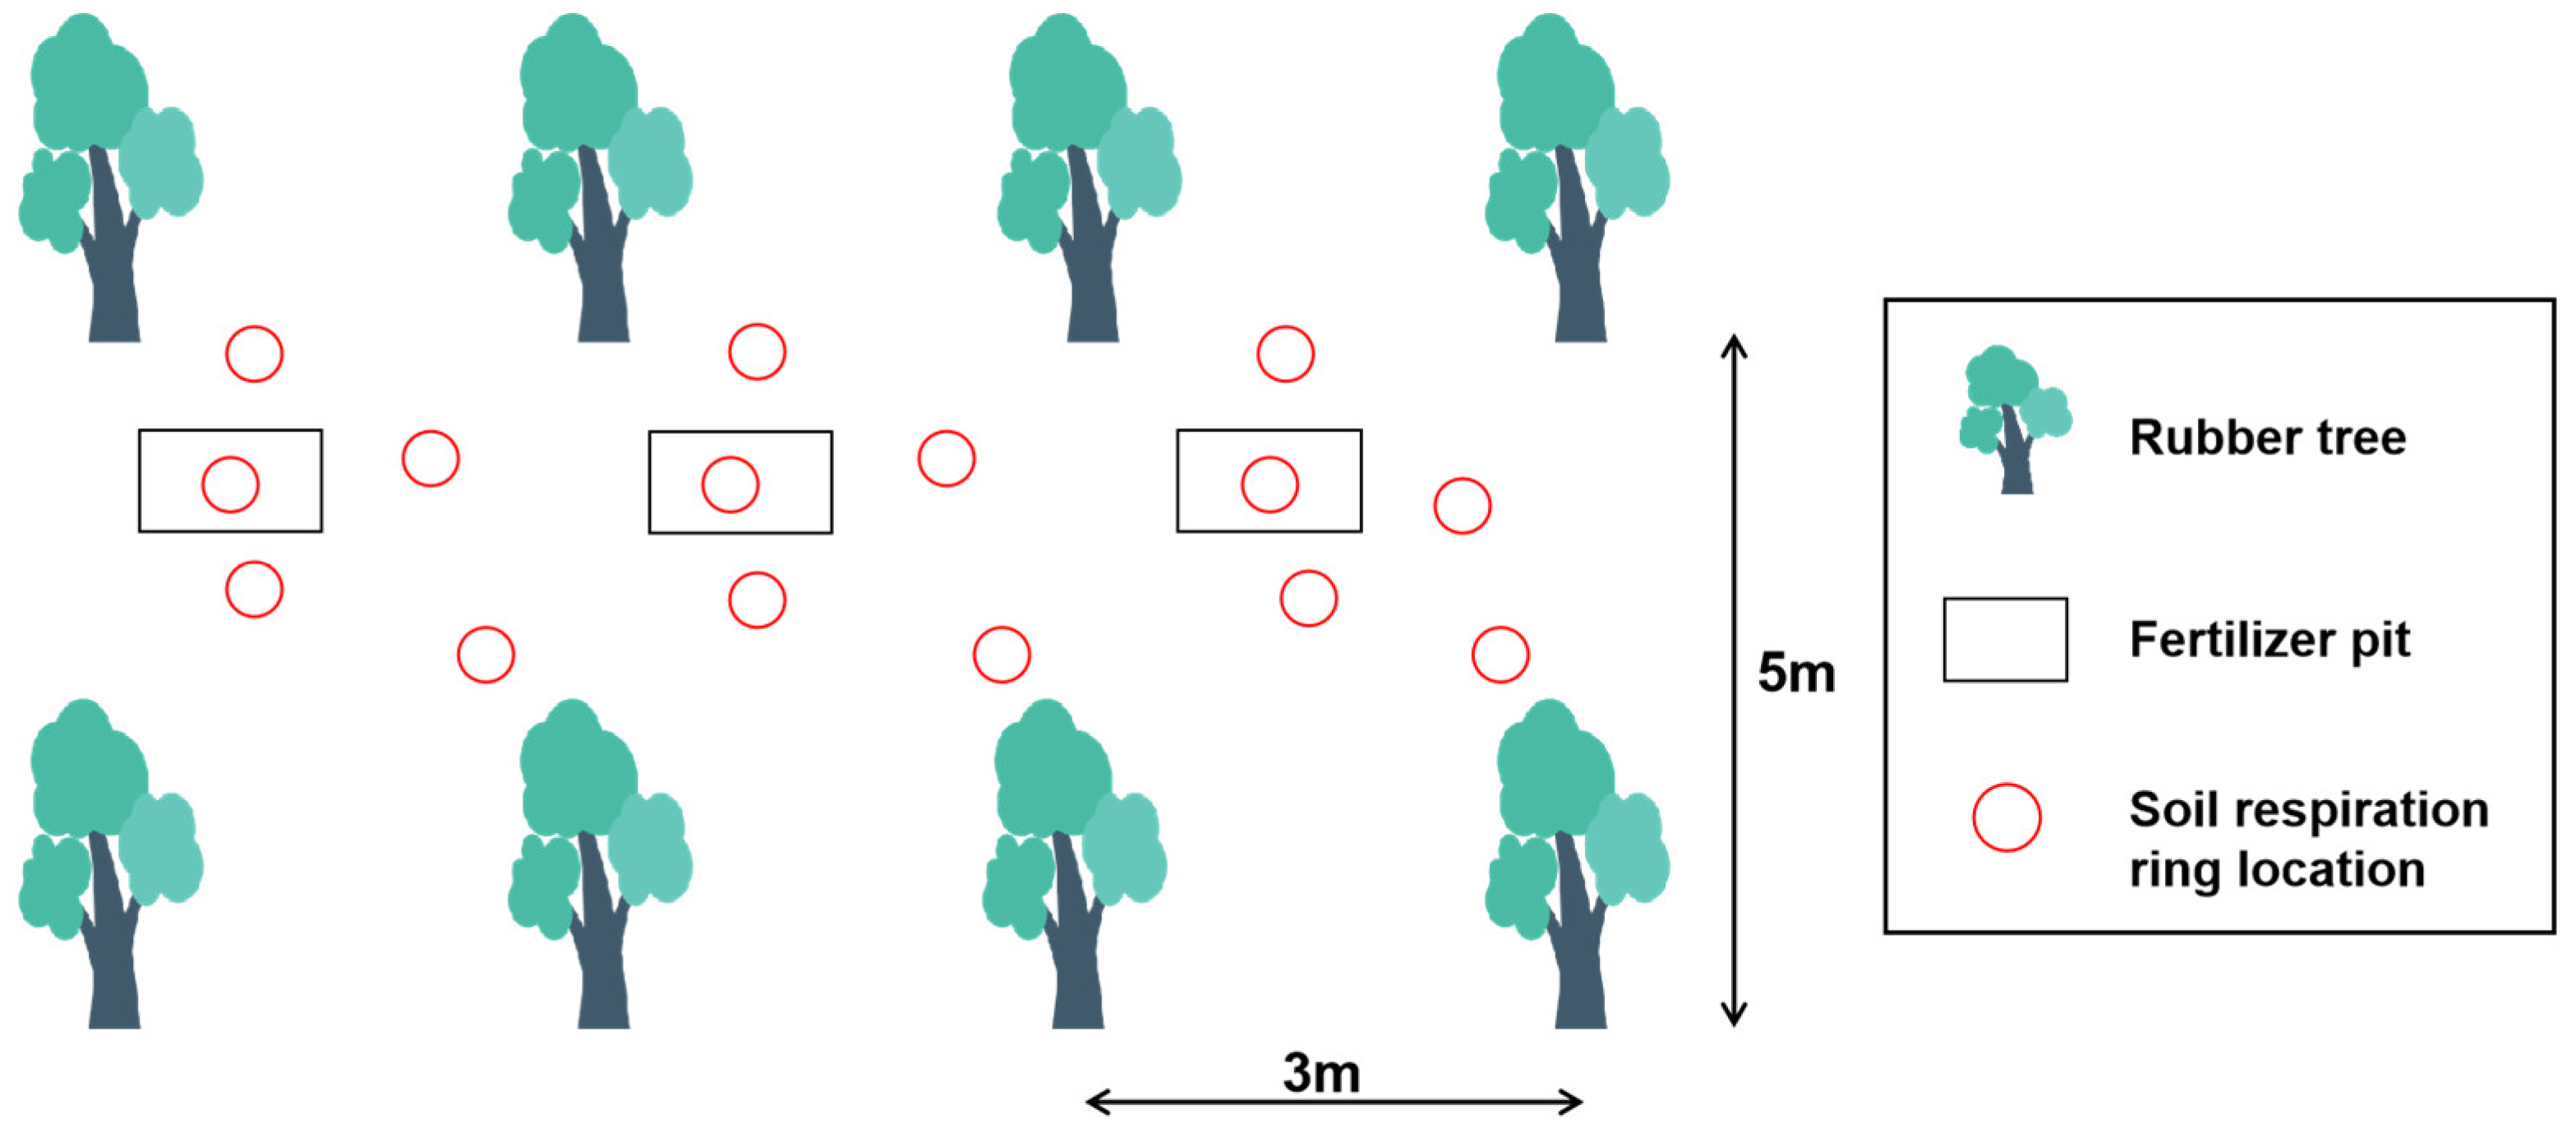
2.2. Experiment Design

The experiment was conducted on 7 October 2023 and 7 January 2024, covering both wet and dry seasons. Six organic substitution treatments were applied to assess their effects on GHG fluxes in rubber plantation soils: a control group (CK), conventional fertilization group (NPK), and organic substitution treatments in which organic fertilizer replaced 25% (25%M), 50% (50%M), 75% (75%M), and 100% (100%M) of chemical nitrogen fertilizer. Three replicates were set up for each treatment group, and five soil respiration rings were installed per replicate, totaling 72 soil respiration rings across all treatment groups (Figure 1).
To accurately capture soil GHG fluxes, monitoring was conducted continuously over 24 h periods using the static chamber-gas chromatography (SC-GC) method. Each soil respiration ring, made of PVC plastic tubes with a diameter of 0.20 m and a height of 0.10 m, was inserted 5–7 cm into the soil. A static chamber was placed atop each soil respiration ring to capture gas emissions. Initial gas samples were collected at 9:00 a.m., with subsequent samples taken 0, 10, and 20 min after placing the static chamber. Using a 30 mL syringe with a three-way valve, gas samples were collected and then stored in labeled containers with detailed sampling records. This sampling procedure was repeated at 3 h intervals until 9:00 a.m. the following day, providing a comprehensive 24 h record of soil GHG emissions.
Rubber plantations in the region are typically fertilized with organic fertilizers composed of cow dung (67% moisture content), containing 70 g kg−1 of total organic carbon, 5.76 g kg−1 of total nitrogen, 0.29 g kg−1 of total phosphorus, and 0.27 g kg−1 of total potassium. Compound fertilizers, consist of (urea, calcium superphosphate, and potassium chloride, with an N:P2O5:K2O ratio of 14:7:9). According to the farm’s standards, the annual fertilizer application for each rubber tree includes 20 kg of organic fertilizer and 2 kg of compound fertilizer. This equates to approximately 609 g of urea (46% N content), 1166 g of calcium superphosphate (12% P2O5 content), and 300 g of potassium chloride (60% K2O content).
In this study, organic fertilizer was applied as a single application in June, while chemical nitrogen fertilizer was split into two applications in June and September to provide consistent nutrient availability. Based on the principle of equal nitrogen substitution, each treatment’s fertilizer application rate varied according to the intended substitution level (Table 1). For each application, efforts were made to time fertilization after rainfall. Fertilizer pits were cleared prior to application, and fertilizer was evenly spread in the pits and then covered with a layer of soil to minimize nutrient loss and optimize fertilizer efficiency.

2.3. Measurement and Calculation of GHG Fluxes

The concentrations of CO2, CH4, and N2O in the gas samples were determined using a Gas Chromatograph (Agilent 7890B, Agilent Technologies, Santa Clara, CA, USA), with a carrier gas of high-purity N2 (21 mL min−1); the column was a HayesepQ (80–100 mesh), which operated at 60 °C. CO2 entered a nickel catalyst converter (Ni) before the detection and was reduced to CH4 by H2 before it was detected by a Flame Ionization Detector (FID). CH4 was detected using an FID detector and N2O using an Electrical Conductivity Detector (ECD) detector. Soil GHG fluxes were calculated according to Equation (1) [23]:
F = ρ H P P 0 T 0 T Δ C Δ t
where F is the GHG emission fluxes (mg m−2 h−1); ρ is the density of the gas at standard conditions (N2O: 1.977 kg m−3, CO2: 1.997 kg m−3, CH4: 0.717 kg m−3); H is the height of the static box (0.20 m); ΔC/Δt is the rate of change of the concentration in the static box; T0 and P0 are the absolute air temperature (T0 = 273.15 K) and air pressure (P0 = 101.325 kpa), respectively, at standard conditions; T is the absolute temperature in the static box; and P is the air pressure in the sampling location. F > 0 indicates that the gas is emitted from the soil into the atmosphere, and F < 0 indicates that the atmosphere is flowing into the soil or the soil is absorbing the gas from the atmosphere.
The correction factor for soil GHG fluxes is defined as the difference between the daily average of soil GHG fluxes and the real-time observation. The daily average of soil GHG fluxes is the sum of soil GHG fluxes at each sampling moment multiplied by the time interval of sampling (3 h) and divided by 24 h. The correction factor for soil GHG fluxes is calculated as described in (2) [24]:
C i = F m e a n F i
where Ci is the correction factor for GHG fluxes, Fi is the real-time observation of GHG fluxes, and Fmean is the daily average of GHG fluxes.

2.4. Soil Sample Collection and Analysis

For soil sampling, 0–10 cm of soil was taken in the vicinity of each soil respiration ring. Specifically, four soil samples were taken from each replicate and mixed to form a composite sample, resulting in three composite samples per treatment group. These samples were stored in self-sealing bags at room temperature and brought back to the laboratory. Then, the composite samples were placed in trays and mixed well, and a 10-mesh sieve was used to remove stones, animals, roots, and other non-soil materials. A portion of the sieved fresh soil was then stored in the refrigerator at 4 °C in a sealed container for the determination of soil ammonium nitrogen (NH4+-N) and nitrate nitrogen (NO3-N). The remaining portion was air-dried, ground, and sieved using a 100-mesh sieve. The sieved soil samples were sealed and stored under dry conditions for the determination of soil pH and soil organic carbon content (SOC).
Soil samples were collected at a depth of 0–10 cm for physicochemical property analysis (pH, SOC, NO3-N and NH4+-N). To determine soil pH, 10 g of air-dried soil was mixed with 25 mL of distilled water, and pH was measured using a calibrated pH meter. The SOC content was determined using the K2Cr2O7-H2SO4 oxidation method [7]. The soil NO3-N and NH4+-N contents were extracted with KCl solution, with NO3-N contents analyzed by ultraviolet (UV) spectrophotometry and NH4+-N contents determined by indophenol blue colorimetry [22]. Soil temperature and soil moisture were determined using a soil tester (Sigma PH368, Merck KGaA, Darmstadt, Germany) carried at the time of sampling, which was inserted 5–10 cm into the soil; after a period of a few minutes, values were read and recorded.

2.5. Statistical Analysis

Statistical analyses were performed using SPSS software v25.0. A one-way ANOVA was constructed using Duncan’s Multiple Polar Difference method to analyze significant differences in environmental factors (pH, SOC, NO3-N and NH4+-N) among the six treatments. Statistical significance was found at the p < 0.05 level.

3. Results

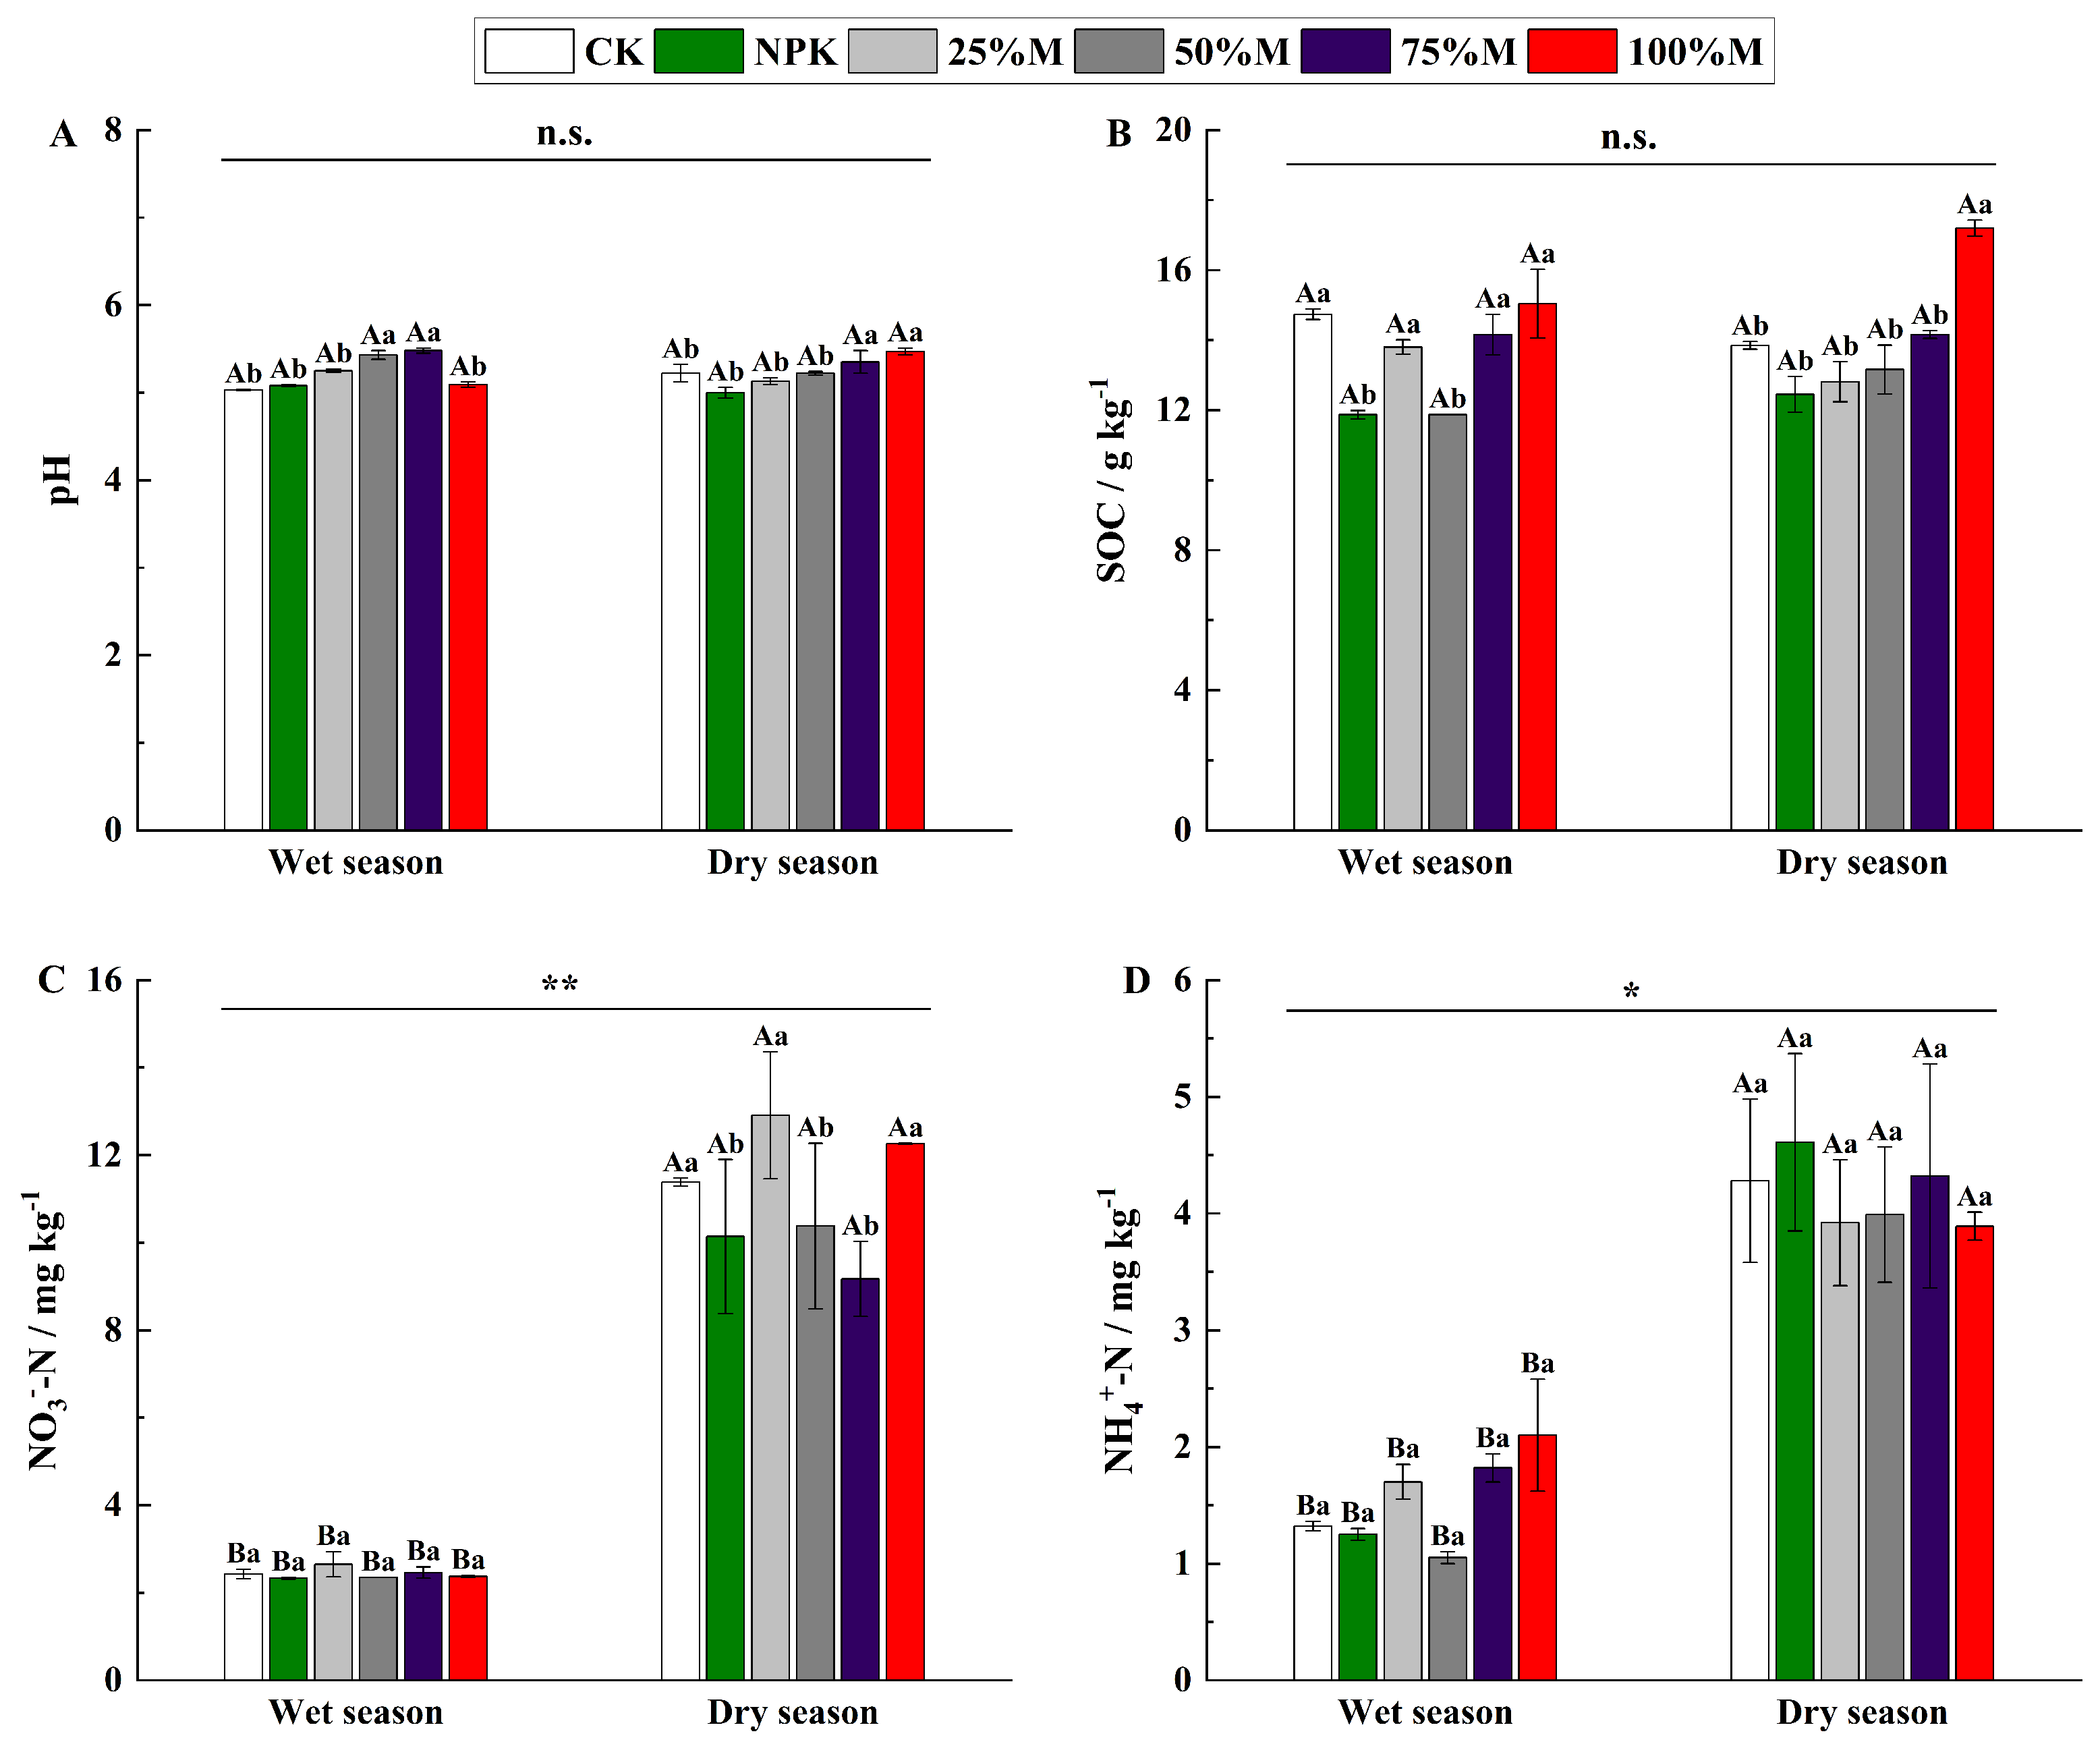
3.1. Soil Physical and Chemical Properties

The daily variation of soil temperature and moisture at 5 cm depth is shown in Figure 2. The diurnal patterns of soil temperature showed a single-peak curve. In the wet season, the lowest soil temperature occurred at 3:00, and the highest soil temperature occurred at 15:00. In the dry season, the lowest soil temperature occurred at 6:00, and it reached peak values at 15:00. The diurnal patterns of soil moisture were complicated; moisture increased around midnight (0:00–3:00), reached peak values at 18:00, and subsequently decreased in the wet season (Figure 2a). However, there were no obvious daily variations of soil moisture in the dry season (Figure 2b). Both soil temperature and soil moisture were higher in the wet season than in the dry season (Figure 2). Soil temperature was 14.64% higher in the wet season than in the dry season, and soil moisture was 33.80% higher than in the dry season.
In this study, soil pH, SOC, soil NO3N, and soil NH4+-N were measured (Figure 3). As shown, soil pH and SOC did not vary significantly between the wet and dry seasons (Figure 3A,B), with some differences between treatment groups. In the wet season, soil pH was not significantly different between CK and NPK, 25%M, and 100%M and was significantly different from the other treatment groups. The SOC was significantly different between CK and NPK and 25%M and was not significantly different from the other treatment groups. In the dry season, soil pH and SOC of the CK control group differed significantly only from those of the 100%M treatment group and not from the other treatment groups (Figure 3A,B). Soil NO3-N and soil NH4+-N contents were more variable and significantly different between the wet and dry seasons. Soil NO3-N content did not differ significantly between treatment groups in the wet season, and in the dry season the soil NO3-N content in the 25%M and 100%M treatment groups differed significantly from the other treatments, whereas soil NH4+-N content did not differ significantly between treatment groups in the wet and dry seasons (Figure 3C,D).

3.2. Daily Changes in Soil GHG Fluxes

Unlike the daily changes in soil temperature and moisture, soil GHG fluxes showed different daily characteristics during the wet and dry seasons (Figure 4).
In this study, the trend of soil CO2 fluxes showed a significant single-peak curve, which was higher during the day than at night, implying that the amount of CO2 emitted during the day was higher than at night. There were significant differences in soil CO2 fluxes between the wet and dry seasons and also between treatment groups. During the wet season, the maximum value of soil CO2 fluxes occurred at 15:00 and the minimum value at 3:00, with a range of 73.42–526.17 mg m−2 h−1 (Figure 4a). In the wet season, CO2 fluxes were higher in the 75%M, 100%M, and 50%M treatment groups than in the CK treatment group, which showed 75%M > 100%M > 50%M > CK. 25%M, and NPK treatment groups were lower than the CK treatment group, which showed CK > 25%M > NPK (Figure 4a). During the dry season, the maximum value of soil CO2 fluxes also occurred at 15:00 and the minimum value at 3:00, with a range of 102.38–446.16 mg m−2 h−11 (Figure 4b). CO2 fluxes were higher in all treatment groups than in the CK treatment group, showing 50%M > 75%M > 100%M > 25%M > NPK > CK (Figure 4b). Overall, the daily changes in soil CO2 emissions had a strong daily variation characteristic in both the wet and dry seasons, and the trend was very similar to that of soil temperature.
Compared to the daily variation of CO2 fluxes, CH4 fluxes were somewhat different. In this study, the soil CH4 fluxes showed negative values, indicating that CH4 was absorbed by the soil. The daily trend also showed a significant single-peak curve, which was lower during the day than at night. There was no significant difference in soil CH4 fluxes between the wet and dry seasons, and the differences between treatment groups were not significant. In the wet season, the minimum value of soil CH4 fluxes occurred at 15:00 and the maximum value at 3:00, with a variation range of −0.0202 to −0.0091 mg m−2 h−1. CH4 fluxes were higher in all treatment groups than in the CK treatment group, which showed that 25%M > NPK > 50%M > 100%M > 75%M > CK (Figure 4c). In the dry season, the minimum value of soil CH4 fluxes also appeared at 15:00 and the maximum value appeared at 3:00, with a variation range of −0.0247 to −0.0115 mg m−2 h−1. CH4 fluxes were lower than those in the CK treatment group in all treatment groups, as shown by CK > 50%M > 100%M > NPK > 75%M > 25%M (Figure 4d).
In this study, the trend of soil N2O fluxes also showed a significant single-peak curve, with the daily variation being higher during the day than at night, implying that the amount of N2O emitted during the day was higher than at night. There were also significant differences in soil N2O fluxes between the wet and dry seasons, with the difference being that there was no significant difference in soil N2O fluxes between treatment groups in the wet season, while there was a significant difference in the dry season. In the wet season, the maximum value of soil N2O fluxes also occurred at 15:00 and the minimum value at 3:00, with a range of 0.0101–0.0364 mg m−2 h−1. N2O fluxes were higher in all treatment groups than in the CK treatment group, which showed 100%M > 25%M > 50%M > NPK > 75%M > CK (Figure 4e). In the dry season, the maximum value of soil N2O fluxes also appeared at 15:00 and the minimum value appeared at 3:00, with a variation range of 0.0042–0.0965 mg m−2 h−1. N2O fluxes in all treatment groups were also higher than that in the CK treatment group, as shown by NPK > 50%M > 25%M > 75%M > 100%M > CK (Figure 4f). The N2O fluxes were similar to CO2 fluxes in terms of overall changes.

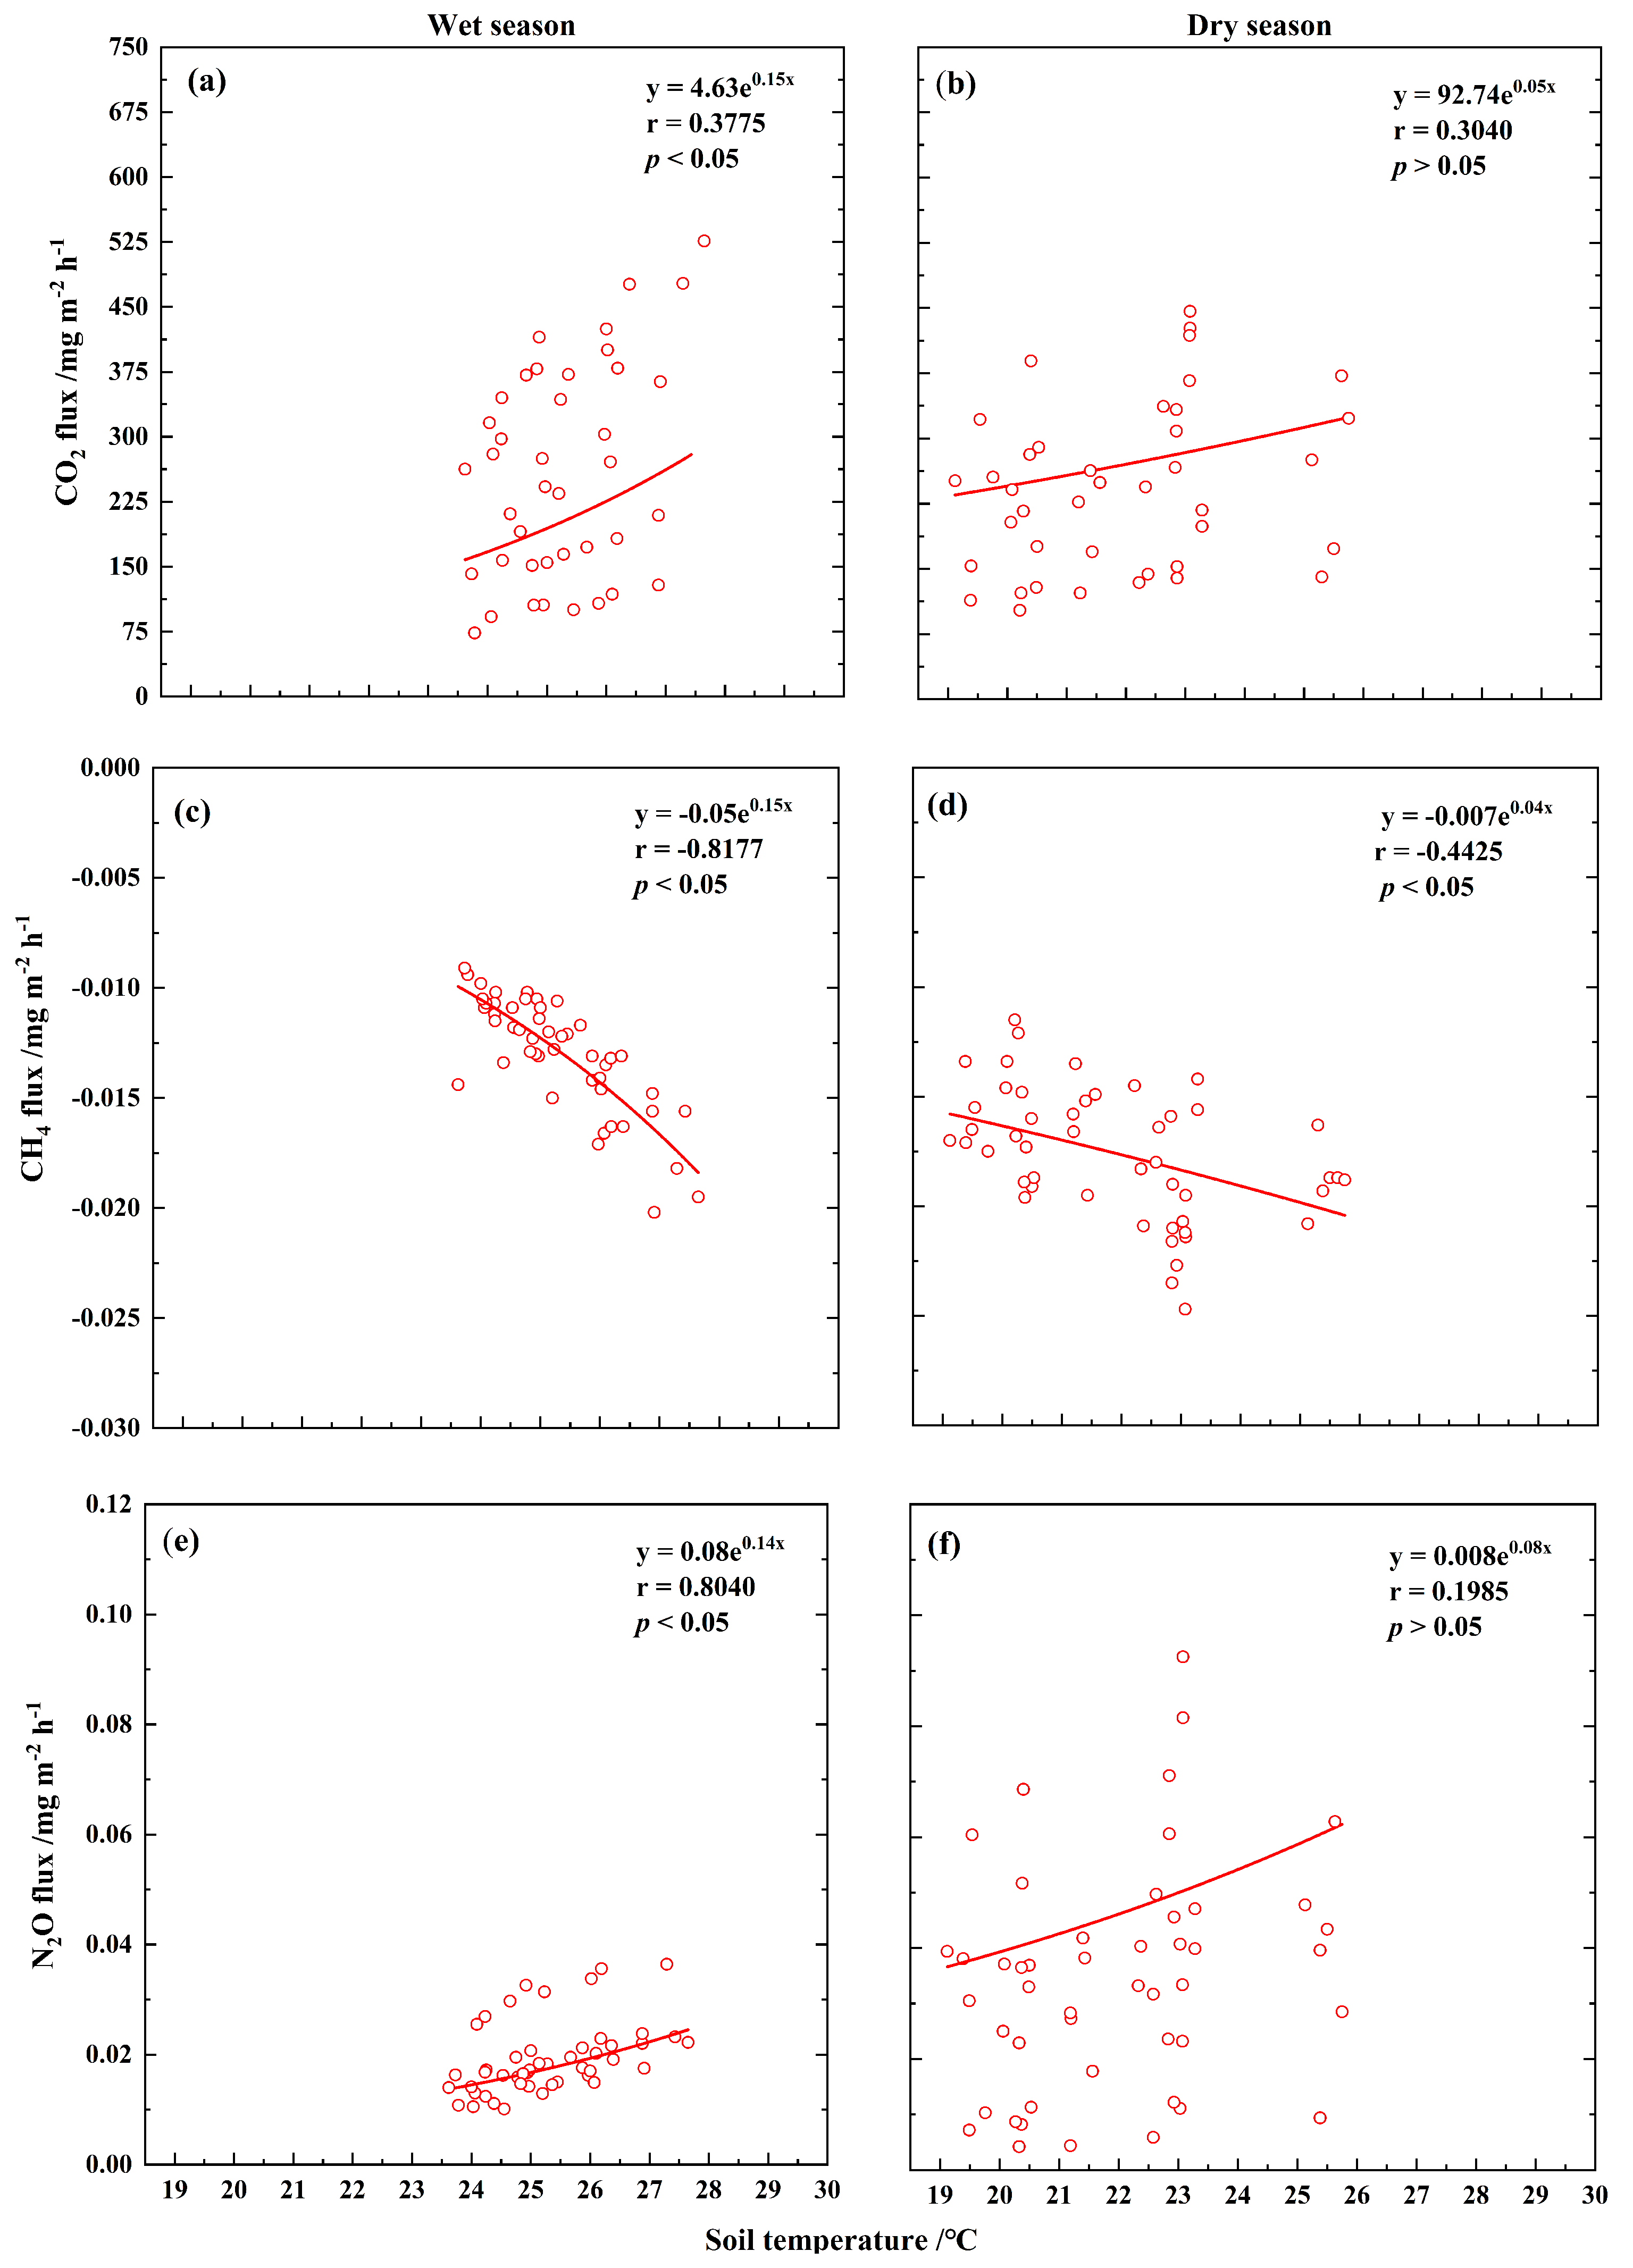
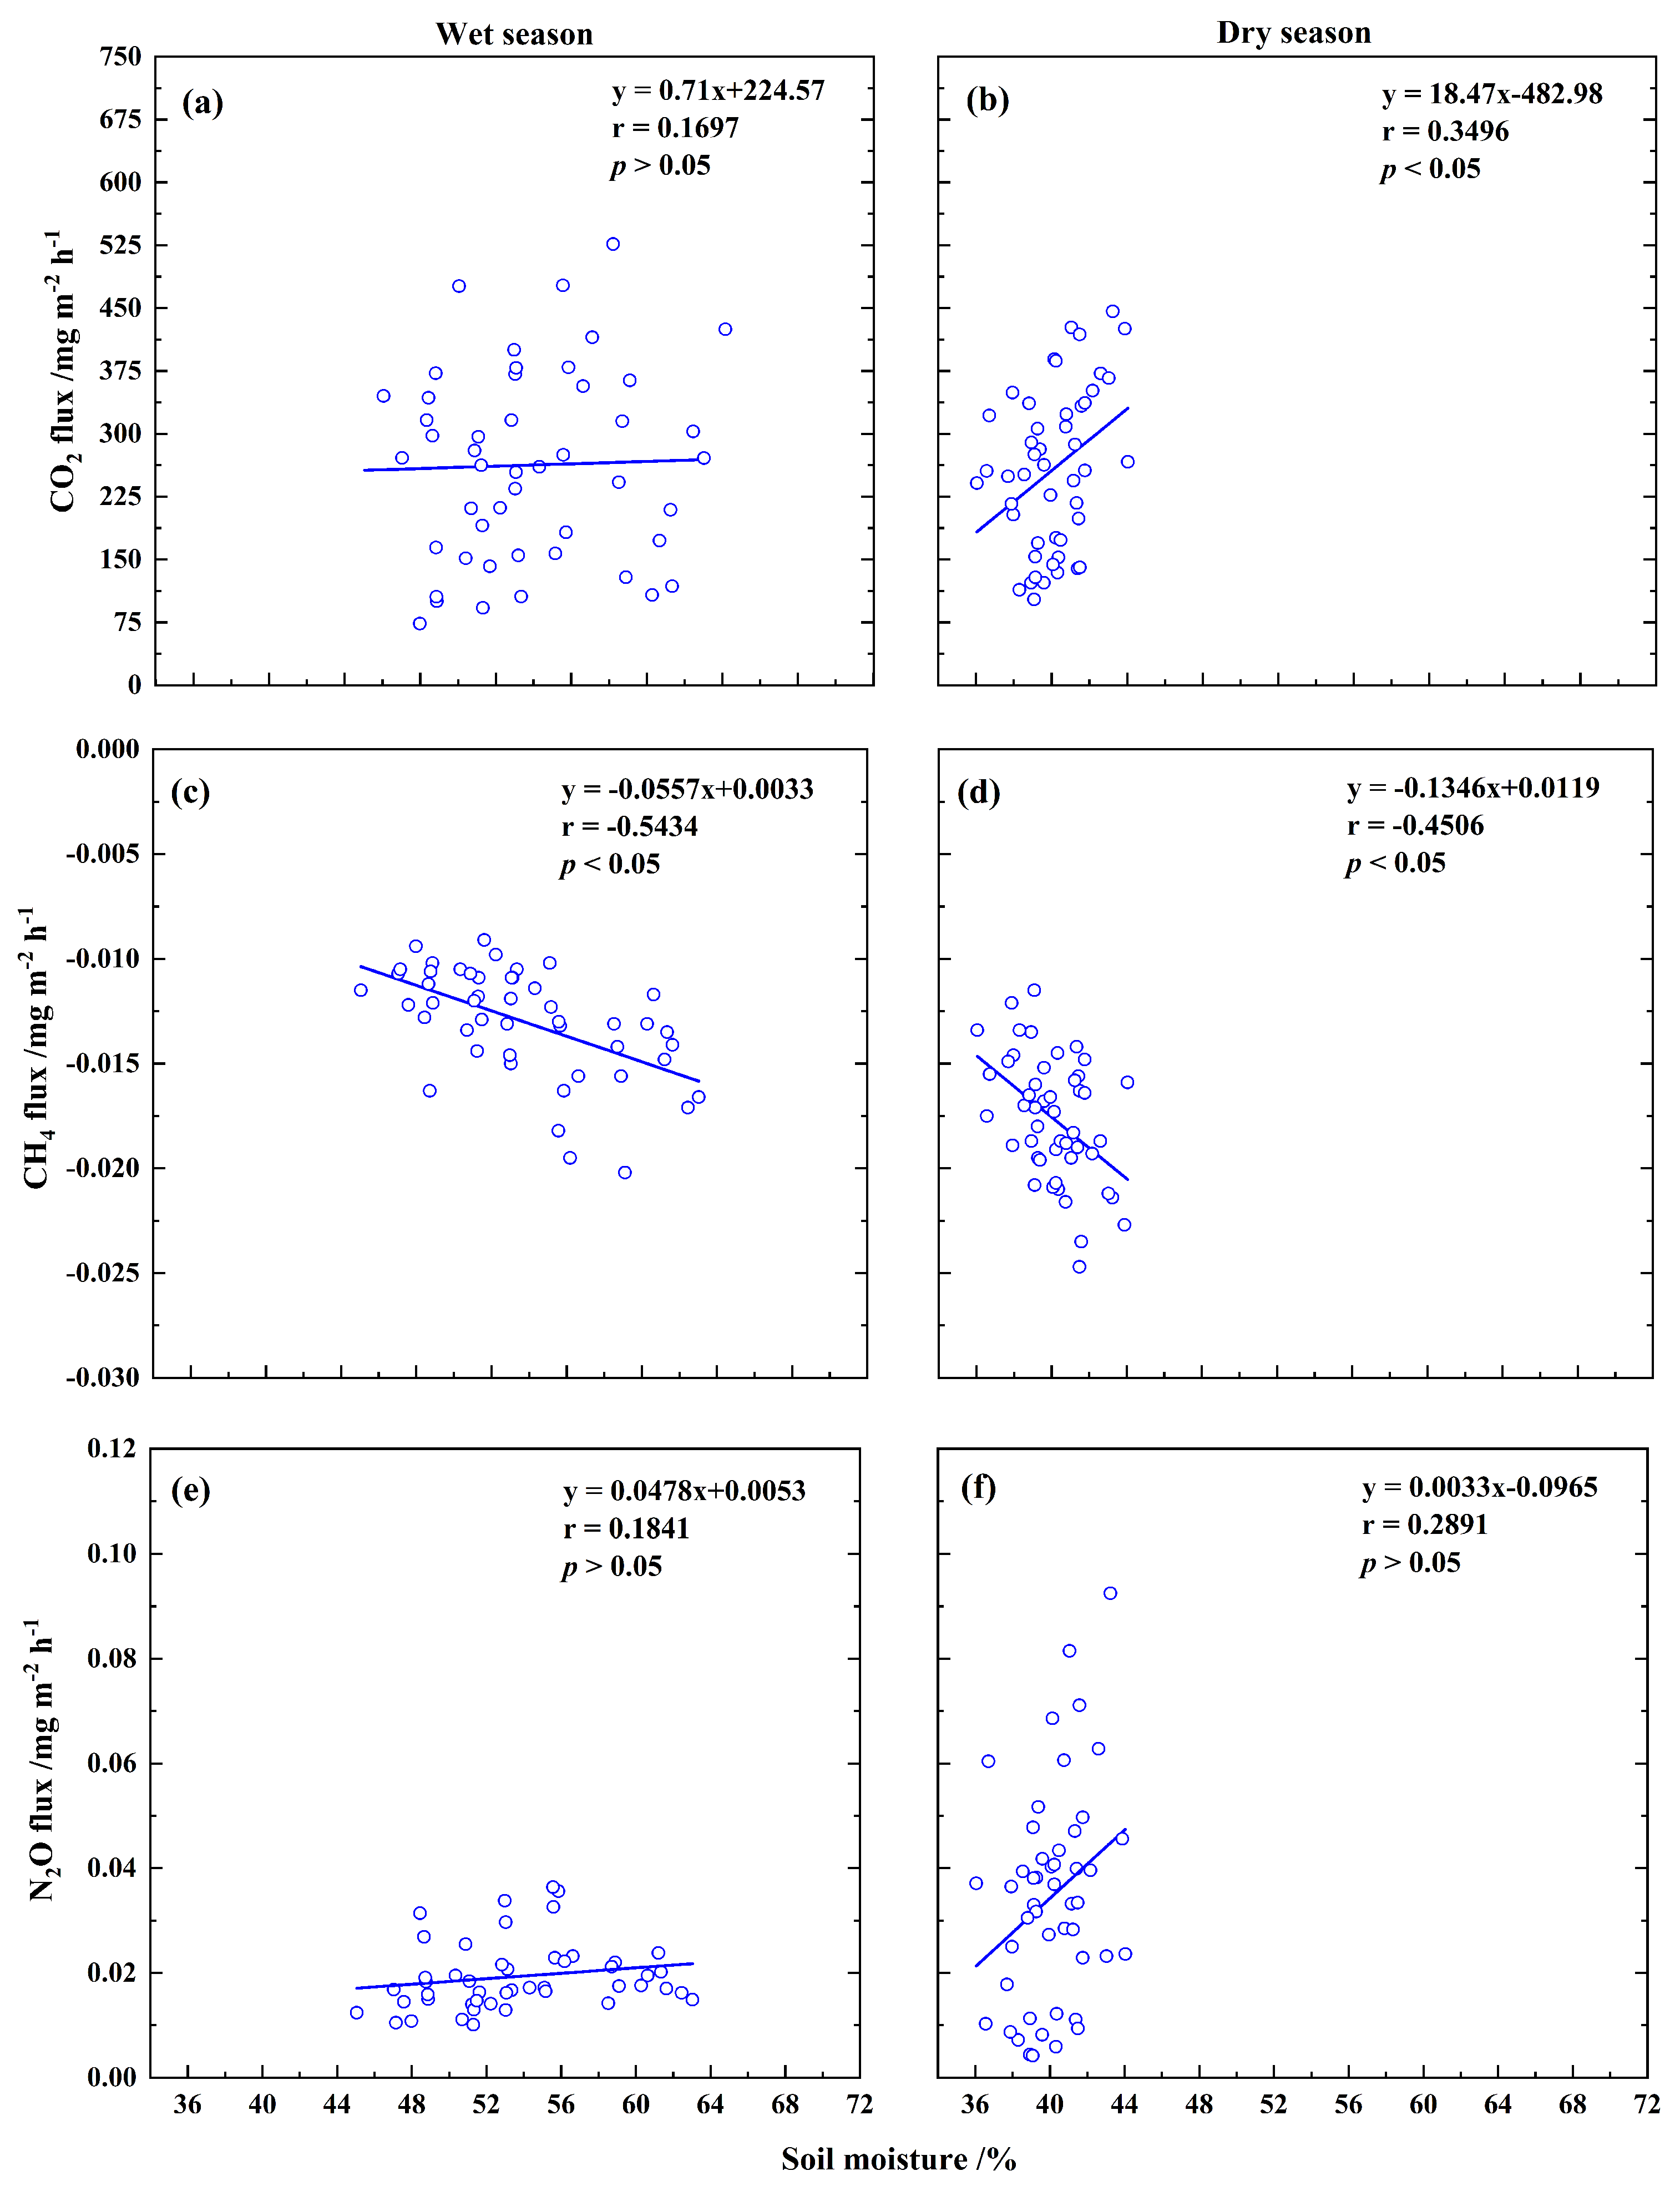
3.3. Relationships Between Soil GHG Fluxes and Soil Temperature or Moisture

Correlation analysis showed that the response of different GHG fluxes to soil temperature was different (Figure 5). The CO2 fluxes and N2O fluxes showed significant positive correlations with soil temperature in the rainy season but not in the dry season. Soil CH4 fluxes, on the other hand, showed a significant negative correlation with soil temperature in both the wet and dry seasons. Overall, all three soil GHG fluxes were more strongly correlated with soil temperature in the wet season than in the dry season.
The response of different GHG fluxes to soil moisture was also different. Regression analysis revealed (Figure 6) that soil CO2 fluxes were positively correlated with soil moisture, as evidenced by a non-significant correlation in the wet season and a significant correlation in the dry season. The relationship between soil CH4 fluxes and soil moisture showed a significant negative correlation in both the wet and dry seasons. Soil N2O fluxes were positively correlated with soil moisture in both the wet and dry seasons, in contrast to soil CH4 fluxes, and the correlation was not significant in both the wet and dry seasons.

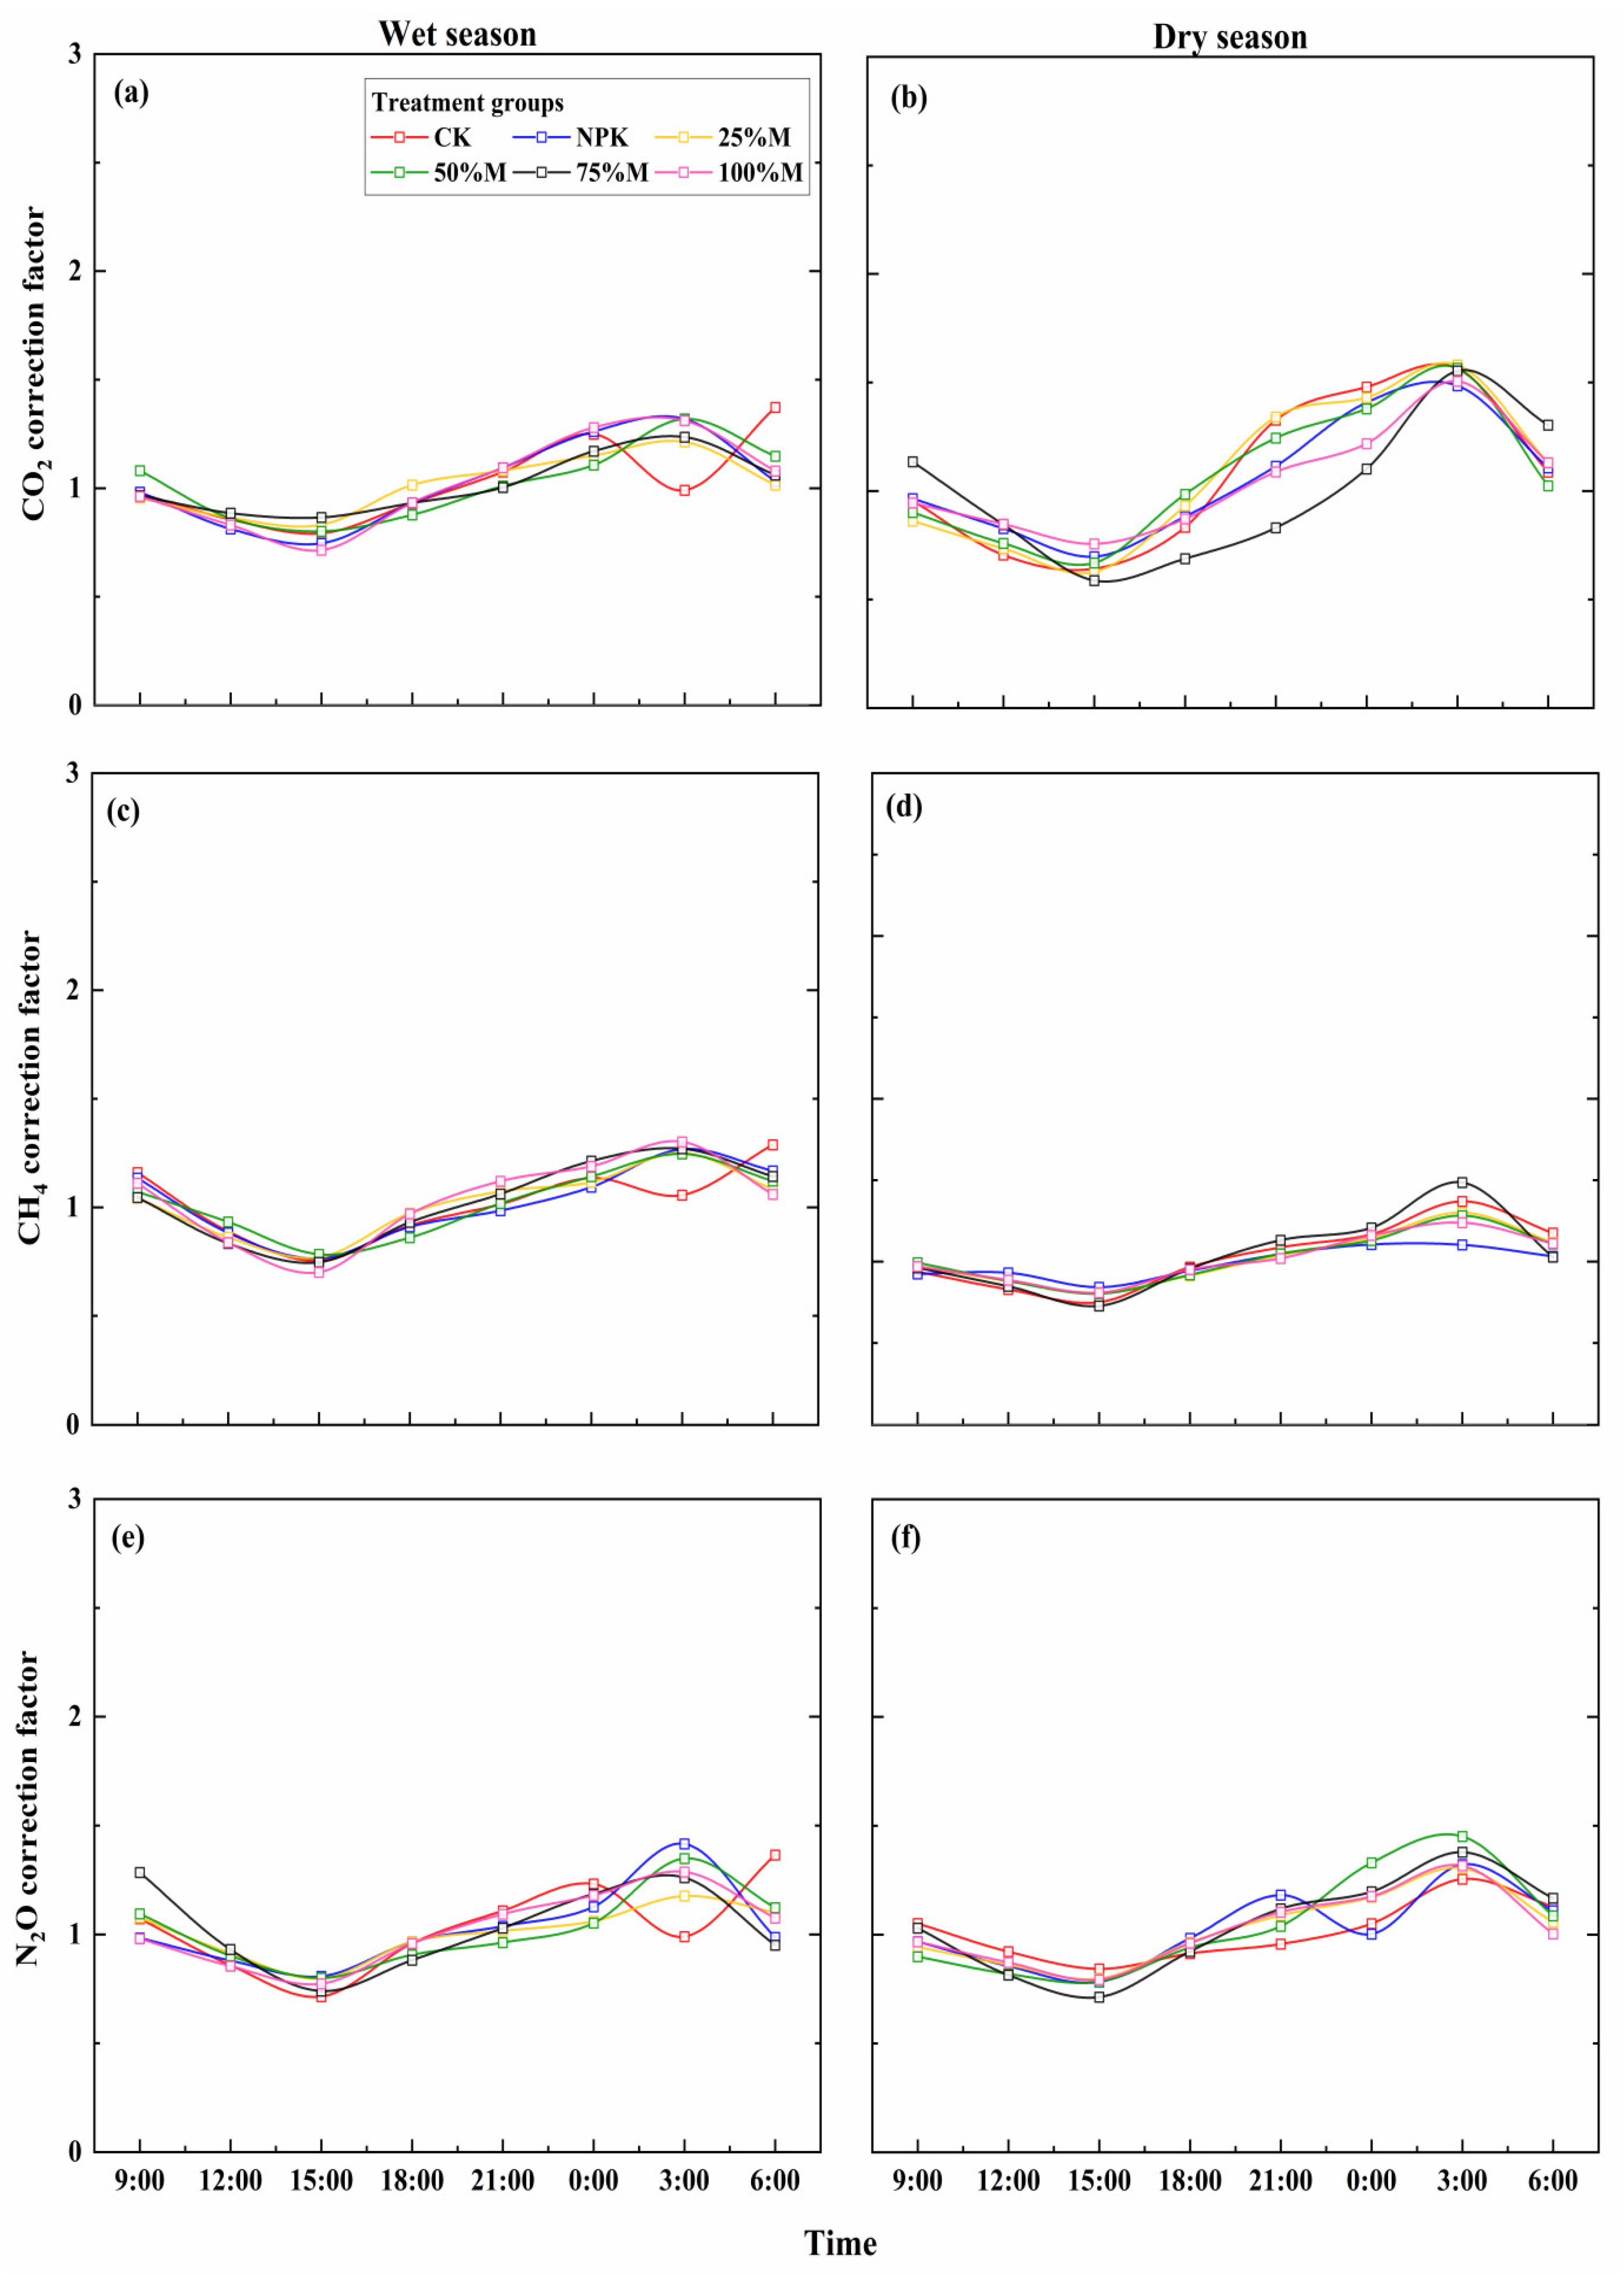
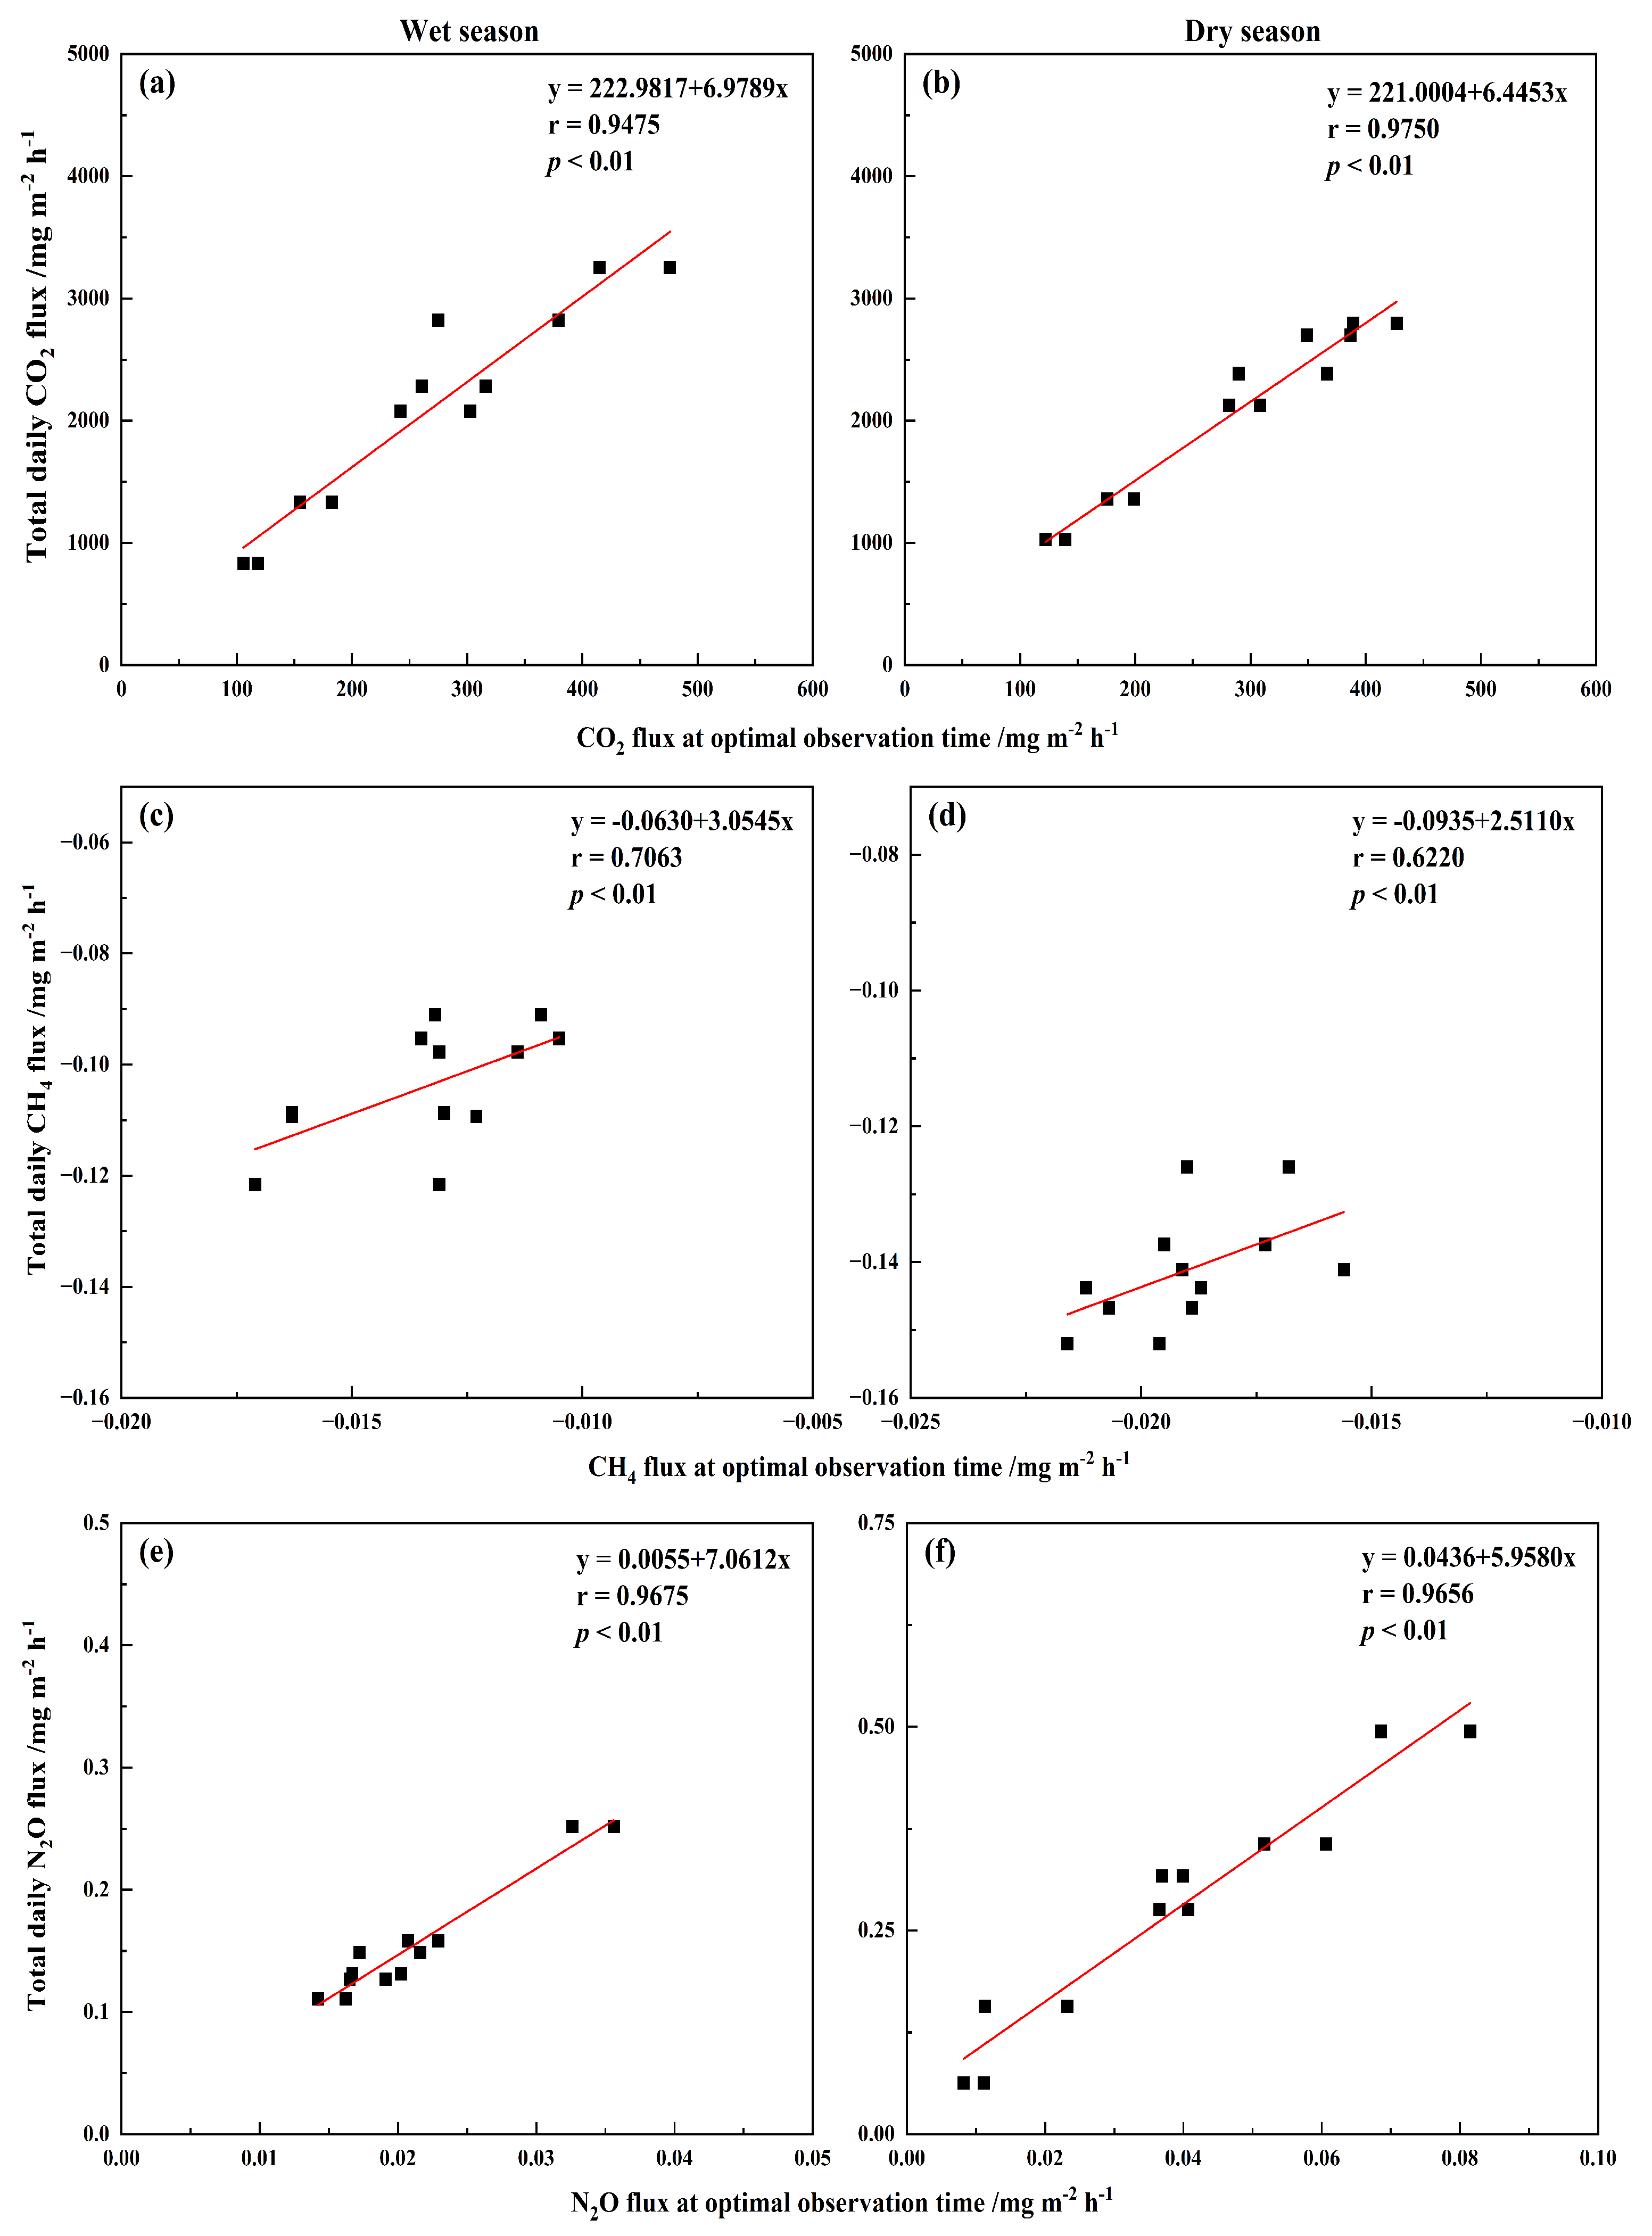
3.4. Correction Factor for GHG Fluxes

Because of the large spatial and temporal heterogeneity of soil GHG fluxes, the most representative moments of the day should be selected for observations to enhance the representativeness and accuracy of the observations when conducting studies on longer time scales, such as different seasons. Figure 7 shows the distribution of correction coefficients of CO2, CH4, and N2O fluxes with time. As can be seen from Figure 7, the correction factor of CO2 fluxes in the wet and dry seasons is closer to one at 9:00–12:00, indicating that the period of 9:00–12:00 can be used as the best time of day to observe CO2 fluxes. Similarly, the correction coefficients of CH4 and N2O fluxes are also closer to one at 9:00–12:00. To further analyze their representativeness, the fluxes of each GHG at the optimal moment in the wet and dry seasons were regressed against the total daily fluxes (Figure 8). For CO2 fluxes, the correlation coefficients with the total daily fluxes were 0.9475 (p < 0.01) in the wet season and 0.9750 (p < 0.01) in the dry season. The CH4 fluxes exhibited significant correlations with its total daily fluxes, and the correlation coefficients were 0.7023 (p < 0.01) and 0.6220 (p < 0.01) in the wet season and dry season, respectively. The N2O fluxes also showed significant correlations with its total daily fluxes, and the correlation coefficients were 0.9675 (p < 0.01) and 0.9656 (p < 0.01) in the wet season and dry season, respectively. All of these reached the significant level, indicating that the fluxes at these moments have strong correlation with the total daily fluxes and can be used as the optimal observation times for the study of GHGs in rubber plantations on a long time scale.

4. Discussion

4.1. Daily Variation of Soil GHG Fluxes

In this study, the mean values of soil GHG fluxes for each treatment group were calculated. The results showed that the average daily emission of soil CO2 was 194.1 mg m−2 h−1, the average daily uptake of soil CH4 was −0.0155 mg m−2 h−1, and the average daily emission of soil N2O was 0.011 mg m−2 h−1 in the CK treatment group (Table 2). The soil CO2 fluxes in this study were significantly lower than those in Xishuangbanna (soil CO2 fluxes of tropical rainforest and rubber plantation were 359.95 mg m−2 h−1 and 351.99 mg m−2 h−1). Soil CH4 uptake of rubber plantations in this study was also lower than that in Xishuangbanna (soil CH4 uptake was −0.11 mg m−2 h−1 and −0.02 mg m−2 h−1 for tropical rainforest and rubber plantation, respectively) [25]. However, it was higher than that of Southeast Asia (soil CH4 uptake of rubber plantations was −0.0104 mg m−2 h−1) [26]. Comparing with the results of other regions, we found that the emission of N2O from rubber plantation soil in this study was lower than those of Danzhou, Hainan [27], Xishuangbanna, and Yunnan [28], which may be due to differences in hydrothermal conditions.
Daily variation of soil GHG fluxes is a common phenomenon [29]. In this study, the daily variation of soil GHG fluxes in rubber forests under different levels of organic fertilizer substitution showed a clear single-peak curve (Figure 4). CO2 fluxes and N2O fluxes showed a trend of high in the daytime and low in the nighttime. CH4 fluxes showed CH4 uptake was high in the daytime and low in the nighttime, which is consistent with the results of Li et al. [30]. The CO2 fluxes and N2O fluxes showed that the dry season was saw greater fluxes than in the wet season, and there was no significant change in CH4 fluxes.
To accurately measure GHG fluxes with minimal labor, it is important to observe daily changes in GHG fluxes in different regions. It has been shown that 8:00–10:00 a.m. is the best observation time for CO2 fluxes and 8:00–12:00 a.m. is the best observation time for N2O fluxes in wheat fields [31]. Tai et al. showed that 8:00–10:00 a.m. was the best observation time for CO2 fluxes and N2O fluxes after fertilizer application in spring maize fields under shallow buried drip irrigation [32]. In this study, based on the results of the distribution of the correction coefficients over time, the observed soil GHG fluxes from 9:00–12:00 were closest to the daily average fluxes, which indicates that the fluxes of each soil GHG at this time of the day are most representative of the average fluxes over the day. It was concluded that 9:00–12:00 was the best time of day for the study of soil GHG fluxes from rubber forests in this region under different levels of organic fertilizer substitution (Figure 7 and Figure 8).

4.2. Effects of Organic Fertilizer Substitution on GHG Fluxes in Rubber Plantation Soils

Organic fertilizer application could led to alternations in soil structure and nutrient availability, subsequently influencing soil GHG emissions [33]. Compared with the CK treatment, fertilizer application increased soil CO2 fluxes and N2O fluxes during both dry and wet seasons (Figure 4), which was consistent with the result of Abbasi et al. and Qiu et al. [34,35]. In a four-year experiment, Abbasi et al. [34] found that organic-inorganic allotment treatments increased soil CO2 emission fluxes in a maize-soybean crop rotation system in Ontario, Canada. Qiu et al. [35] found that fertilizer application significantly increased soil CO2 and N2O emission fluxes in their experiments on fir plantations in Nanping, Fujian Province. However, the application of fertilizer had minimal influence on soil CH4 fluxes in this study.
In this study, the organic fertilizer replacement treatment significantly increased soil CO2 fluxes compared to the NPK treatment (Figure 4a,b). This effect is primarily because the organic and inorganic fertilizers could provide organic materials and accelerate soil microbial activity, thus enhancing CO2 fluxes [36]. Additionally, soil CO2 fluxes in organic substitution treatments (with the 25%M, 50%M, 75%M, and 100%M) were significantly higher than those in both CK and NPK treatments. In the wet season, CO2 fluxes gradually increased as organic fertilizer substitution increased (Figure 4a), whereas in the dry season, emissions peaked with substitution ratios ≤ 50%, then decreased as substitution exceeded 50% (Figure 4b). We speculate that this may be due to the low soil moisture during the dry season, which reduced microbial activity [37]. When the percentage of organic fertilizer substitution exceeded 50%, the soil accumulated a large amount of organic matter that failed to decompose, thus reducing soil CO2 fluxes.
Soil CH4 fluxes indicated CH4 uptake in this study, which is a typical pattern in most dry-land agricultural fields [38]. Soil CH4 fluxes are primarily affected by both methanogenic and methane-oxidizing microbial communities [39]. Additionally, the results showed that the organic fertilizer application slightly reduced CH4 uptake, but there were not significant differences between treatment groups (Figure 4c,d). This stability is likely due to the equilibrium maintained between CH4 production by methanogenic bacteria and CH4 consumption by methane-oxidizing bacteria. These two methanogens are mainly affected by factors such as soil temperature, moisture, and pH [40], which were not significantly affected by the different fertilization treatments in this study, so there were no significant differences in soil CH4 fluxes between treatment groups.
Soil N2O emissions arise mainly from nitrification and denitrification processes, which govern N2O fluxes in the soil ecosystem [41]. In this study, N2O fluxes were higher in the fertilizer treatments than in the CK treatment, which may be attributed to enhanced nitrification and denitrification driven by available N contents, which in turn promotes N2O emission [42]. Notably, N2O emissions decreased when organic fertilizer substitution exceeded 50%M (Figure 4e,f). This is because available nitrogen (NO3-N and NH4+-N contents) decreased as the organic fertilizer substitution ratios increased, which limited microbial processing efficiency and elevated N2O emissions [43]. In addition, organic fertilizer substitution improved soil structure, enhanced nitrogen use efficiency, and stabilized microbial communities, contributing to the observed decline in N2O fluxes [44].
The 25%M treatment group was superior to other organic fertilizer replacement treatment groups in reducing soil GHG fluxes compared to the NPK treatment group. Therefore, the 25%M treatment group is recommended as the optimum fertilizer treatment group for this study.

4.3. Effects of Soil Temperature and Soil Moisture on Soil GHG Fluxes

In this study, we examined the impact of different organic fertilizer substitution treatments on daily variation of GHG fluxes across wet and dry seasons. Soil temperature and soil moisture are key drivers of soil GHG fluxes, as these factors impact soil microbial activity [45], yet their effects vary between seasons and under organic substitution conditions.
There were positive correlations between soil CO2 fluxes and soil temperature or moisture (Figure 5 and Figure 6a,b), suggesting that increased microbial respiration and decomposition rates in warmer, moist soils elevated CO2 emissions [46]. Previous studies’ results also showed that, under sufficient moisture and nutrient substrate availability, the temperature primarily influences soil CO2 fluxes [47].
Correlation analysis results showed that soil CH4 fluxes were significantly and negatively correlated with soil temperature (Figure 5b,c), meaning that higher temperature enhanced CH4 uptake [48]. This could be because optimal conditions for most methanotrophic microorganisms is around 35–37 °C [49]. When soil temperatures fall below this level, higher temperatures lead to greater consumption [50]. Additionally, soil moisture is also negatively correlated with soil CH4 fluxes during the wet season (Figure 6b,c). Soil CH4 emissions increased under flooded conditions and uptake increased under dry conditions [51].
Similarly, soil N2O fluxes displayed a positive correlation with both temperature and moisture during the wet season (Figure 5 and Figure 6e,f). This is consistent with the results of Gao et al. and Wu et al. [52,53]. This might be caused by the fact that the nitrification-denitrification reaction was more active in the wet season [54] because soil temperature and soil moisture were higher in the wet season than in the dry season. The positive correlation between soil N2O fluxes and soil moisture shows a positive correlation, which is consistent with the results of most studies [55,56]. In the present study, there was a significant difference in soil N2O fluxes between the wet and dry seasons. We speculate that the main reason for this is that, in the tropics, soil temperatures and humidity are higher in both seasons, and substrate differences may be the main influencing factor. Our results showed that effective N was significantly higher in the dry season than in the wet season (Figure 3).
Considering the lack of long-term positional observations in this study, future research needs to focus on the effects of daily variability patterns on long time scales and other types of fertilization patterns on GHG fluxes from rubber forest soils. At the same time, as there are many factors that influence the GHG fluxes from rubber forest soils, future research needs to focus on considering the effects of other factors. In addition, fertilizer applications would affect soil nutrient dynamics and yield in rubber plantations. Therefore, future research also needs to focus on this aspect.

5. Conclusions

Accuracy estimation of GHG fluxes from rubber plantation soils necessitates a thorough understanding of their daily variation characteristics and the optimal sampling times. This study demonstrated that the optimal sampling window for reliable GHG flux measurement was identified as between 9:00 and 12:00 in the morning. Organic fertilizer substitution promoted soil CO2 and N2O emissions while having no significant effect on soil CH4 emissions, with CO2 and N2O emissions rising with the increased substitution ratios and declining when substitution exceeded thresholds of 50% for CO2 and 75% for N2O. Soil CO2 and N2O fluxes were positively correlated with soil temperature and soil moisture, and CH4 fluxes were negatively correlated with soil temperature and soil moisture in both wet and dry seasons. These results suggest that the daily variation characteristics of soil GHG fluxes should be taken into account when designing experiments or observation programs to improve the accuracy of annual GHG flux estimates in rubber plantation ecosystems.

Author Contributions

Conceptualization, W.L. (Wenjie Liu) and Q.Y.; formal analysis, W.Z.; funding acquisition, W.L. (Wenjie Liu), H.Y. and Q.Y.; methodology, W.X.; project administration, W.L. (Wenjie Liu) and Q.Y.; supervision, W.L. (Wenjie Liu) and Q.Y.; writing—original draft, W.Z.; writing—review and editing, H.R., W.A., W.L. (Wenjie Liu) and Q.Y.; data curation, W.Z., W.L. (Wen Lu), M.F. and Q.C. All authors have read and agreed to the published version of the manuscript.

Funding

This work was financially supported by the Fundamental Research Funds of Sanya Research Base, ICBR (No. 1630032022006), the National Natural Science Foundation of China (No. 42367034 and 32160291), the Key Research and Development Project of Hainan Province (No. ZDYF2022XDNY181).

Data Availability Statement

Data are contained within the article.

Conflicts of Interest

The authors declare no conflicts of interest.

References

  1. Mandloi, S.; Bangre, J.; Aher, B.S.; Sharma, O.P.; Prajapati, S.; Singh, S. Conservation Agriculture as a Climate Change Mitigation Strategy: A Review. Int. J. Environ. Clim. Change 2023, 13, 3230–3242. [Google Scholar] [CrossRef]
  2. IPCC. Climate Change 2023: Synthesis Report; Contribution of Working Groups I, II and III to the Sixth Assessment Report of the Intergovernmental Panel on Climate Change; IPCC: Geneva, Switzerland, 2023; pp. 1–34. Available online: https://www.ipcc.ch/report/sixth-assessment-report-cycle/ (accessed on 24 July 2024).
  3. Stijn, G.B.; Iris, C.; Márcio, F.A.L.; Gerard, W.K.; Jochen, M.; Mathias, C.; Dirk, R.; Wietse, B.; Paul, L.E.B. Soil aggregate stability governs field greenhouse gas fluxes in agricultural soils. Soil Biol. Biochem. 2024, 191, 109354. [Google Scholar] [CrossRef]
  4. Tian, H.; Lu, C.; Ciais, P.; Anna, M.M.; Josep, G.C.; Eri, S.; Deborah, N.H.; Kevin, R.G.; Stephen, S.; Zhang, B.; et al. The terrestrial biosphere as a net source of greenhouse gases to the atmosphere. Nature 2016, 531, 225–228. [Google Scholar] [CrossRef] [PubMed]
  5. Warren-Thomas, E.M.; Edwards, D.P.; Bebber, D.P.; Phourin, C.; Alex, N.D.; Tom, D.E.; Frances, H.L.; James, F.M.; Menghor, N.; Hannah, J.O.; et al. Protecting tropical forests from the rapid expansion of rubber using carbon payments. Nat. Commun. 2018, 9, 911. [Google Scholar] [CrossRef]
  6. Huang, Y.; Jing, Y.; Bei, M.; Yang, H.; Cha, Z.; Lin, Q.; Luo, W. Short-Term Effects of Organic Amendments on Soil Fertility and Root Growth of Rubber Trees on Hainan Island, China. J. For. Res. 2020, 31, 2137–2144. [Google Scholar] [CrossRef]
  7. Xu, W.; Yang, Q.; Jiang, Y.; Yu, J.; Li, J.; Liu, W.; Wu, Z. Improving soil pH, nutrient concentrations, and enzyme activities by green manure returning in young and mature rubber plantations on Hainan Island, China. Plant Soil 2024, 495, 341–358. [Google Scholar] [CrossRef]
  8. Kayama, M.; Kikuchi, S.; Uemura, A.; Takahashi, M. Growth Characteristics of Seven Willow Species Distributed in Eastern Japan in Response to Compost Application. Forests 2023, 14, 606. [Google Scholar] [CrossRef]
  9. Sidik, B.R.; Sutanto, A.; Zen, S.; Noor, R. Application pineapple liquid waste to increase fruit weight and vitamin C pineapple as biological learning resources. J. Phys. Conf. Ser. 2020, 1567, 022051. [Google Scholar] [CrossRef]
  10. Zhang, Y.; Nie, Y.; Liu, Y.; Huang, X.; Yang, Y.; Xiong, H.; Zhu, H.; Li, Y. Characteristics of Greenhouse Gas Emissions from Yellow Paddy Soils under Long-Term Organic Fertilizer Application. Sustainability 2022, 14, 12574. [Google Scholar] [CrossRef]
  11. Li, X.; Ma, J.; Yao, Y.; Liang, S.; Zhang, G.; Xu, H.; Kazuyuki, Y. Methane and nitrous oxide emissions from irrigated lowland rice paddies after wheat straw application and midseason aeration. Nutr. Cycl. Agroecosyst. 2014, 100, 65–76. [Google Scholar] [CrossRef]
  12. Liu, Y.; Li, H.; Hu, T.; Ali, M.; Li, J.; Zhu, R.; Jiao, X.; Jing, P. A quantitative review of the effects of biochar application on rice yield and nitrogen use efficiency in paddy fields: A meta-analysis. Sci. Total Environ. 2022, 830, 154792. [Google Scholar] [CrossRef] [PubMed]
  13. Zhou, M.; Zhu, B.; Wang, S. Stimulation of N2O emission by manure application to agricultural soils may largely offset carbon benefits: A global meta-analysis. Glob. Change Biol. 2017, 23, 4068–4083. [Google Scholar] [CrossRef] [PubMed]
  14. Song, H.; Wang, J.; Zhang, K.; Zhang, M.; Hui, R.; Sui, T.; Yang, L.; Du, W.; Dong, Z. A 4-year field measurement of N2O emissions from a maize-wheat rotation system as influenced by partial organic substitution for synthetic fertilizer. J. Environ. Manag. 2020, 263, 110384. [Google Scholar] [CrossRef] [PubMed]
  15. Andréa, S.B.E.; Leonardo, M.P.; Carolina, B.B.; Acacio, A.N.; Camila, B.B.; Janaina, B.C. Organic management increases soil nitrogen but not carbon content in a tropical citrus orchard with pronounced N2O emissions. J. Environ. Manag. 2019, 234, 326–335. [Google Scholar] [CrossRef]
  16. Mu, J.; Qi, J.; Yu, H.; Hu, C.; Mu, Y.; Qu, J. Dynamic chamber as a more reliable technique for measuring methane emissions from aquatic ecosystems. Sci. Total Environ. 2022, 851 Pt 1, 158147. [Google Scholar] [CrossRef]
  17. Ali, K.M.; Jasdeep, S.; Sandeep, K. Prediction of greenhouse gas emissions from agricultural fields with and without cover crops. Soil Sci. Soc. Am. J. 2022, 86, 1227–1240. [Google Scholar] [CrossRef]
  18. Zhu, J.; Zhang, Y.; Zheng, G.; Kong, D. Daily variation patterns of soil N2O and CO2 emissions in rice fields and determination of optimal observation time. Chin. Agric. Sci. Bull. 2014, 30, 146–150. [Google Scholar] [CrossRef]
  19. Wang, J.; Yang, J.; Chen, Y.; Yao, P.; Lu, Q.; Chen, S.; Chen, Z.; Wu, H.; Ye, X. Effects of continuous overturning of ryegrass on diurnal variation of CO2 in tobacco-growing soil profile in central Henan Province. Acta Tabacaria Sin. 2024, 30, 42–51. [Google Scholar] [CrossRef]
  20. Bruno, J.R.A.; Keith, A.S.; Rilner, A.F.; Abmael, S.C.; Abmael, S.C.; William, R.D.O.; Claudia, P.J.; Segundo, U.; Robert, M.B. Selection of the most suitable sampling time for static chambers for the estimation of daily mean N2O flux from soils. Soil Biol. Biochem. 2012, 46, 129–135. [Google Scholar] [CrossRef]
  21. Cueva, A.; Bullock, S.H.; López-Reyes, E.; Vargas, R. Potential bias of daily soil CO2 efflux estimates due to sampling time. Sci. Rep. 2017, 7, 11925. [Google Scholar] [CrossRef]
  22. Lu, W.; Xu, W.X.; Su, T.Y.; Yu, L.; Jiang, Y.M.; Lu, J.L.; Liu, W.J.; Yang, Q. Effects of replacing chemical nitrogen fertilizer with organic fertilizer at different rates on soil nutrients and enzyme activities in Hainan rubber forest. J. Trop. Biol. 2024, 15, 745–755. Available online: http://kns.cnki.net/kcms/detail/46.1078.S.20240328.1354.005.html (accessed on 13 September 2024).
  23. Lu, X.; Li, Y.; Wang, H.; Yu, L.; Jiang, Y.; Lu, J.; Liu, W.; Yang, Q. Responses of soil greenhouse gas emissions to different application rates of biochar in a subtropical Chinese chestnut plantation. Agric. For. Meteorol. 2019, 271, 168–179. [Google Scholar] [CrossRef]
  24. Ren, Z.; Wu, J.; Cai, L.; Wang, Z. Study on the daily variation of greenhouse gas emissions from dry-crop farmland under different management modes of straw and biomass charcoal. Territ. Nat. Resour. Study 2024, 6, 42–47. [Google Scholar] [CrossRef]
  25. Zhou, W.J.; Zhu, J.; Ji, H.; John, G.; Sha, L.; Song, Q.; Liu, Y.; Bai, X.; Lin, Y.; Gao, J.; et al. Drivers of difference in CO2 and CH4 emissions between rubber plantation and tropical rainforest soils. Agric. For. Meteorol. 2021, 304–305, 108391. [Google Scholar] [CrossRef]
  26. Rong, L.; Stefanie, G.; Sergey, B.; Piepho, H.-P.; Rhett, D.H.; Xu, J.; Georg, C. Converting forests into rubber plantations weakened the soil CH4 sink in tropical uplands. Land Degrad. Dev. 2019, 30, 2311–2322. [Google Scholar] [CrossRef]
  27. Yang, S.; Xian, Y.; Tang, W.; Fang, M.; Song, B.; Hu, Q.; Wu, Z. Patterns and Drivers of Greenhouse Gas Emissions in a Tropical Rubber Plantation from Hainan, Danzhou. Atmosphere 2024, 15, 1245. [Google Scholar] [CrossRef]
  28. Zhou, W.J.; Ji, H.; Zhu, J.; Zhang, Y.P.; Sha, L.Q.; Liu, Y.T.; Zhang, X.; Zhao, W.; Dong, Y.; Bai, X.L.; et al. The effects of nitrogen fertilization on N2O emissions from a rubber plantation. Sci. Rep. 2016, 6, 28230. [Google Scholar] [CrossRef]
  29. Lammirato, C.; Wallman, M.; Weslien, P.; Klemedtsson, L.; Rütting, T. Measuring frequency and accuracy of annual nitrous oxide emission estimates. Agric. For. Meteorol. 2021, 310, 108624. [Google Scholar] [CrossRef]
  30. Li, X.; Lun, X. Characteristics of daily changes in CO2, CH4, and N2O emissions from wheat fields under fertilizer and no-fertilizer measures. Ecol. Environ. Sci. 2014, 23, 178–182. [Google Scholar] [CrossRef]
  31. Tian, S.Z.; Ning, T.Y.; Chi, S.Y.; Wang, Y.; Wang, B.W.; Han, H.F.; Li, C.Q.; Li, Z.J. Diurnal variations of the greenhouse gases emission and their optimal observation duration under different tillage systems. Acta Ecol. Sin. 2012, 32, 879–888. [Google Scholar] [CrossRef]
  32. Tai, J.; Li, R.; Yang, H.; Ma, J.; Sa, R. Characterization of daily changes of N2O and CO2 in spring maize fields under different irrigation measures and the influencing factors. Ecol. Sci. 2023, 42, 1–8. [Google Scholar] [CrossRef]
  33. Walling, E.; Vaneeckhaute, C. Greenhouse gas emissions from inorganic and organic fertilizer production and use: A review of emission factors and their variability. J. Environ. Manag. 2020, 276, 111211. [Google Scholar] [CrossRef] [PubMed]
  34. Abbasi, N.A.; Madramootoo, C.A.; Zhang, T.; Tan, C.S. Soil nutrients and plant uptake parameters as related to greenhouse gas emissions. J. Environ. Qual. 2022, 51, 1129–1143. [Google Scholar] [CrossRef] [PubMed]
  35. Qiu, Q.; Ding, C.; Abubakari, S.M.; Feng, J.; Lei, M.; Gan, Z.; Zhu, B.; Hu, Y.-L. Contrasting impacts of fertilization on topsoil and subsoil greenhouse gas fluxes in a thinned Chinese fir plantation. J. Environ. Manag. 2024, 359, 121055. [Google Scholar] [CrossRef]
  36. Wang, K.; Shi, L.; Wang, S.; Wang, T.; Ma, L.; Zheng, W.; Li, Z.; Wang, Z.; Zhai, B. Responses of environmental and soil enzyme stoichiometric characteristics of wheat cropping system to fertilizer management in rain-fed areas of China. Environ. Sci. Pollut. Res. 2022, 29, 41520–41533. [Google Scholar] [CrossRef]
  37. Carla, C.P.; Dániel, T.; Johannes, R. Can moisture affect temperature dependences of microbial growth and respiration? Soil Biol. Biochem. 2021, 156, 108223. [Google Scholar] [CrossRef]
  38. Li, C.; Xiong, Y.; Huang, Q.; Xu, X.; Huang, G. Impact of irrigation and fertilization regimes on greenhouse gas emissions from the soil of mulching cultivated maize (Zea mays L.) field in the upper reaches of Yellow River, China. J. Clean. Prod. 2020, 259, 120873. [Google Scholar] [CrossRef]
  39. Hao, H.; Ma, W.; Yang, X.; Zhao, J.; Zhang, C.; Li, T. Effects of different fertilizer application modes on greenhouse gas emissions of watermelon in facilities. J. Agric. Environ. Sci. 2025, 44, 527–536. Available online: http://kns.cnki.net/kcms/detail/12.1347.S.20240620.0853.002.html (accessed on 15 November 2024).
  40. Feng, Y.; Wang, N.; Xie, H.; Li, J.; Li, G.; Xue, L.; Fu, H.; Feng, Y.; Gerrard, E.J.P.; Chen, D. Livestock manure-derived hydrochar is more inclined to mitigate soil Global Warming Potential than raw materials based on soil stoichiometry analysis. Biol. Fertil. Soils 2023, 59, 459–472. [Google Scholar] [CrossRef]
  41. Meng, C.; Xing, Y.; Ding, Y.; Zhang, Q.; Di, H.; Tang, C.; Xu, J.; Li, Y. Soil acidification induced variation of nitrifiers and denitrifiers modulates N2O emissions in paddy fields. Sci. Total Environ. 2023, 882, 163623. [Google Scholar] [CrossRef]
  42. Kim, D.-G.; Thomas, A.D.; Pelster, D.; Todd, S.R.; Alberto, S.-C. Greenhouse gas emissions in natural and agricultural lands in sub-Saharan Africa: Synthesis of available data and suggestions for further studies. Biogeosciences 2016, 13, 4789–4809. [Google Scholar] [CrossRef]
  43. Liu, C.Z. Effects of Organic Substitution and Staged Application of Nitrogen Fertilizer on Soil Nitrogen Fate and Nitrogen Efficiency of Spring Wheat. Master’s Thesis, Northeast Agricultural University, Harbin, China, 2021. [Google Scholar] [CrossRef]
  44. Liu, M.; Song, F.; Yin, Z.; Chen, P.; Zhang, Z.; Qi, Z.; Wang, B.; Zheng, E. Organic fertilizer substitutions maintain maize yield and mitigate ammonia emissions but increase nitrous oxide emissions. Environ. Sci. Pollut. Res. Int. 2023, 30, 53115–53127. [Google Scholar] [CrossRef] [PubMed]
  45. Priya, E.; Sudipta, S.; Pradip, K.M. A review on slow-release fertilizer: Nutrient release mechanism and agricultural sustainability. J. Environ. Chem. Eng. 2024, 12, 113211. [Google Scholar] [CrossRef]
  46. Liu, Y.; Aili-Buaidi, Y.; Yang, F.; He, Q. Winter soil respiration and its driving factors in the hinterland of Taklamakan Desert. Acta Ecol. Sin. 2015, 35, 6711–6719. Available online: https://link.cnki.net/urlid/11.2031.q.20141218.1100.009 (accessed on 15 November 2024).
  47. Andressa, U.A.; Daniele, R.C.; Eduardo, A.D.O.; Eduardo, H.; Jana, C.; Marta, P.-M.; Sergi, M.-B.; Carlos, A.M. Adjustments in photosynthetic pigments, PS II photochemistry and photoprotection in a tropical C4 forage plant exposed to warming and elevated [CO2]. Plant Physiol. Biochem. 2023, 194, 345–360. [Google Scholar] [CrossRef]
  48. Hu, R.; Hirano, T.; Sakaguchi, K.; Yamashita, S.; Cui, R.; Sun, L.; Liang, N. Spatiotemporal variation in soil methane uptake in a cool-temperate immature deciduous forest. Soil Biol. Biochem. 2023, 184, 109094. [Google Scholar] [CrossRef]
  49. Tian, M.; Shen, L.; Su, W. Progress of research on the effects of elevated atmospheric CO2 concentration on CH4 emission and related microbiological processes in rice fields. J. Appl. Ecol. 2024, 35, 2267–2281. [Google Scholar] [CrossRef]
  50. Ge, R.; Song, C.; Wang, L. Research progress on biochemical processes and influencing factors of wetland methane. Chin. J. Soil Sci. 2011, 42, 229–235. [Google Scholar] [CrossRef]
  51. Xie, X.; Liu, Q.; Li, X.; Li, W. Progress of research on factors affecting methane production and emission in paddy fields and emission reduction measures. Chin. J. Rice Sci. 2024, 38, 475–494. [Google Scholar] [CrossRef]
  52. Gao, N.; Zhang, F.; Bo, Q.; Tang, A.; Gao, J.R.; Wei, X.; Yue, S.; Shen, Y.; Li, S. Microbial and isotopomer analysis of N2O production pathways in calcareous film-mulched farmland. Biol. Fertil. Soils 2023, 59, 407–422. [Google Scholar] [CrossRef]
  53. Wu, Y.-F.; Whitaker, J.; Toet, S.; Amy, B.; Christian, A.D.; Niall, P.M. Diurnal variability in soil nitrous oxide emissions is a widespread phenomenon. Glob. Change Biol. 2021, 27, 4950–4966. [Google Scholar] [CrossRef] [PubMed]
  54. Liu, R.; Hayden, H.L.; Suter, H.; Hu, H.; Lam, S.K.; He, J.; Pauline, M.M.; Chen, D. The effect of temperature and moisture on the source of N2O and contributions from ammonia oxidizers in agricultural soil. Biol. Fertil. Soils 2017, 53, 141–152. [Google Scholar] [CrossRef]
  55. Yuan, J.; Yao, Y.; Guan, Y.; Mahran, S.; Li, J.; Liu, S.; Lu, Y.; Xu, G.; Du, M.; Li, G.; et al. Effects of land use patterns on soil properties and nitrous oxide flux on a semi-arid environmental conditions of Loess Plateau China. Glob. Ecol. Conserv. 2024, 51, e02899. [Google Scholar] [CrossRef]
  56. Zhou, Z.; Liu, Y.; Zhu, Q.; Lai, X.; Liao, K. Comparing the variations and controlling factors of soil N2O emissions and NO3-N leaching on tea and bamboo hillslopes. Catena 2020, 188, 104463. [Google Scholar] [CrossRef]
Figure 1. Schematic diagram of rubber plantation and soil respiration ring deployment.
Forests 16 00706 g001
Figure 2. Daily variation of soil temperature and moisture between wet season (a) and dry season (b).
Forests 16 00706 g002
Figure 3. Soil physicochemical properties of different treatment groups during the study period. (A) soil pH; (B) SOC; (C) soil NO3-N; (D) soil NH4+-N. Values in the bar graphs are means ± standard error (SE). Different lowercase letters represent significant differences among the different treatment groups. Different capital letters represent differences between the wet and dry seasons for the same treatment. In this case, the average values for the dry and wet seasons were compared. * p < 0.05, ** p < 0.01, n.s. indicates non-significant.
Forests 16 00706 g003
Figure 4. Daily variation in soil GHG fluxes between wet season and dry season. CO2 (a,b), CH4 (c,d), and N2O (e,f). Error bars in the figure indicate ± SE.
Forests 16 00706 g004
Figure 5. Correlation analysis of soil GHGs. CO2 (a,b), CH4 (c,d), and N2O (e,f) fluxes with soil temperature during the wet and dry seasons.
Forests 16 00706 g005
Figure 6. Correlation analysis of soil GHGs. CO2 (a,b), CH4 (c,d), and N2O (e,f) fluxes with soil moisture during the wet and dry seasons.
Forests 16 00706 g006
Figure 7. Distribution of correction coefficients for soil GHG fluxes over times of the day between wet season and dry season. CO2 (a,b), CH4 (c,d), and N2O (e,f).
Forests 16 00706 g007
Figure 8. Regression analysis of fluxes versus total daily fluxes for each GHG at the optimal observation time between wet season and dry season. CO2 (a,b), CH4 (c,d), and N2O (e,f).
Forests 16 00706 g008
Table 1. Fertilizer application in different treatment groups.
Treatment GroupsFertilizer Application in June from a Single Fertilization Pits
Urea (g)Calcium Superphosphate (g)Potassium Chloride (g)Organic Fertilizers (kg)
CK0000
NPK608.701166.00300.000
25%M456.52696.00253.004.70
50%M304.35236.00207.009.30
75%M152.170160.0014.00
100%M00110.0019.00
Table 2. Average daily fluxes in different treatment groups.
Treatment GroupsAverage Daily Fluxes (mg m−2 h−1)
CO2CH4N2O
CK194.1 ± 36.8 b−0.0155 ± 0.0033 a0.011 ± 0.002 c
NPK137.0 ± 29.4 c−0.0148 ± 0.0030 a0.028 ± 0.004 b
25%M216.1 ± 36.0 b−0.0152 ± 0.0023 a0.032 ± 0.005 ab
50%M317.4 ± 53.2 ab−0.0147 ± 0.0039 a0.040 ± 0.006 a
75%M325.5 ± 62.0 ab−0.0158 ± 0.0035 a0.026 ± 0.004 b
100%M372.0 ± 70.6 a−0.0160 ± 0.0043 a0.025 ± 0.005 b
Note: The different lowercase letters represent significant differences among the different treatment groups.
Disclaimer/Publisher’s Note: The statements, opinions and data contained in all publications are solely those of the individual author(s) and contributor(s) and not of MDPI and/or the editor(s). MDPI and/or the editor(s) disclaim responsibility for any injury to people or property resulting from any ideas, methods, instructions or products referred to in the content.

