Article

Phylogenomics and Floristic Origin of Endiandra R.Br (Lauraceae) from New Caledonia

Co-Innovation Center for Sustainable Forestry in Southern China, State Key Laboratory of Tree Genetics and Breeding, College of Life Sciences, Nanjing Forestry University, Nanjing 210037, China
*
Author to whom correspondence should be addressed.
Forests 2025, 16(4), 705; https://doi.org/10.3390/f16040705
Submission received: 21 March 2025 / Revised: 18 April 2025 / Accepted: 19 April 2025 / Published: 20 April 2025
(This article belongs to the Special Issue Forest Tree Breeding: Genomics and Molecular Biology)

Abstract

:
New Caledonia is a biodiversity hotspot with flora closely related to that of Australia and has received considerable attention. Endiandra (Cryptocaryeae; Lauraceae) is distributed from tropical Asia to Oceania, including New Caledonia, with northeastern Australia and New Guinea as diversity centers, but the genus in New Caledonia remains understudied. Here, four species of Endiandra native to New Caledonia were sequenced, and their complete plastome sequences were analyzed. A plastome-based phylogenomic tree of Cryptocaryeae was reconstructed, and divergence times were estimated. The phylogenomic tree supports the monophyly of Endiandra. Interestingly, the species of Endiandra from New Caledonia were grouped into two separate subclades, with one subclade including three species and the other subclade containing only one species. The stem and crown ages of the first subclade were 33.18 Ma and 14.5 Ma, respectively, and the second subclade diverged by approximately 10.36 Ma. The structural characteristics of the newly sequenced plastomes were compared with those of Beilschmiedia species from different continents. The results indicate that the plastome sequences of the four species of Endiandra are longer than those of Beilschmiedia. Additionally, Endiandra has more simple sequence repeats (SSRs) than Beilschmiedia, though the difference is slight. The Guanine-Cytosine (GC) content of Endiandra was lower than that of Beilschmiedia. Five highly variable regions were identified, including matK-rps16, ycf1, petA-psbJ, petN-psbM, and ndhF. The Endiandra species in New Caledonia originated through long-distance dispersal followed by local divergence, rather than vicariance. Additionally, we identified at least two instances of floristic exchange between New Caledonia and Australia. Our study provides further evidence for understanding the biogeographic history between these two regions.

1. Introduction

New Caledonia, an archipelago in the southwestern Pacific, harbors rich and unique flora, with its floristic origin attracting considerable interest [1,2,3,4]. Previous studies have suggested that New Caledonia was a fragment of Zealandia which separated from Australia in the late Cretaceous and drifted to its current location via tectonic rotation in the Paleocene [5]. However, the island remained submerged throughout much of the Paleocene and Eocene [6], precluding terrestrial plant colonization and prompting investigations into the origin of its biota.
The genus Endiandra R.Br. (Lauraceae, Cryptocaryeae) belongs to the subtribe Beilschmiediinae, which also includes Beilschmiedia Nees, Hexapora Hook.f., Potameia Thouars, Sinopora J.Li, N.H.Xia & H.W.Li, Syndiclis Hook.f., and Yasunia van der Werff. Endiandra is phylogenetically close to Beilschmiedia but differs morphologically in stamen number; Endiandra typically has three stamens, whereas Beilschmiedia has nine [7]. Endiandra contains 131 species that are distributed from tropical Asia to Oceania, with diversity center in New Guinea and northeastern Australia. Nine species have been recorded from New Caledonia [8,9]. Given its restricted diversity in New Caledonia and close ties to Australian lineages, Endiandra serves as an ideal model to investigate the floristic origin of New Caledonia.
To date, no comprehensive phylogenetic study has focused exclusively on New Caledonian Endiandra. Munzinger and Gemmill [9] reconstructed a phylogenetic tree for New Caledonian Cryptocaryeae using nrITS sequences, revealing that Endiandra species were divided into two major clades. Song et al. [10] conducted a comprehensive phylogenetic and biogeographic study of Cryptocaryeae, which indicated that Endiandra likely originated from Australia and its neighboring islands. However, their analysis included only two species native to New Caledonia: Endiandra lecardii Guillaumin and Endiandra poueboensis Guillaumin. Song et al. [10] neither obtained complete plastome sequences nor analyzed the plastome structural features. As a result, it is necessary to conduct a comparative genomic study of the plastomes and reconstruct a phylogeny to understand the plastome characteristics of Endiandra in New Caledonia and the floristic relationships between Australia and New Caledonia.
In this study, we used herbariomics and sequenced four species of Endiandra from New Caledonia (Endiandra baillonii (Pancher & Sebert) Guillaumin, Endiandra lecardii, Endiandra polyneura Schitr., and Endiandra poueboensis). These represent four of the nine known endemic species, providing the most comprehensive genomic sampling of New Caledonian Endiandra to date. We analyzed the plastome structural characteristics of the four New Caledonian Endiandra species and compared them with the published plastomes of Beilschmiedia from Australia (Beilschmiedia obtusifolia (F.Muell. ex Meisn.) F.Muell.), America (Beilschmiedia immersinervis Sachiko Nishida) and Asia (Beilschmiedia Linocieroides H.W.Li). To clarify the systematic position of Endiandra within the Cryptocaryeae of Lauraceae, determine its monophyly, and estimate the divergence time, we obtained all available complete plastome data of the Cryptocaryeae and combined them with newly sequenced plastomes of the four Endiandra species from New Caledonia to reconstruct a comprehensive phylogenomic tree.

2. Materials and Methods

2.1. Taxon Sampling, DNA Extraction, and Genomic Sequencing

Leaf samples (approximately 1 × 1 cm) were extracted from herbarium specimens collected in New Caledonia for four Endiandra species. Detailed sampling information is provided in Table 1. The purpose of this study was to resolve the phylogenomic relationships of species from New Caledonia, and thus we included only one sample per species. To ensure accurate identification of the four Endiandra species in our single-sample study, all leaf specimens were first authenticated by taxonomic experts specializing in New Caledonian Lauraceae. Additionally, we extracted nrITS sequences from these four species and aligned them with their corresponding published sequences in the NCBI (E. baillonii: PQ589692, E. lecardii: PQ589703, E. poueboensis: HG315592, and E. polyneura: PQ589705) for molecular verification. We obtained pairwise identity scores of 99.8% for E. baillonii and perfect 100% matches for E. lecardii, E. poueboensis, and E. polyneura, providing robust molecular confirmation of our taxonomic identifications. The total DNA was extracted using a modified CTAB method [11]. We conducted double extractions for each sample and combined the DNA from both processes to enhance the DNA quality. In light of the severe degradation of DNA from herbarium specimens, we did not subject the DNA samples to supersonic fragmentation during the library construction process [12,13]. Sequencing was performed using the Illumina NovoSeq 6000 at Novogene Co., Ltd. (Beijing, China). The input amount for each DNA library was consistently 750 ng, with all libraries achieving a quality assessment grade of A. We obtained an average sequencing volume of approximately 2 GB per sample. In addition, we obtained 83 published plastomes of the Cryptocaryeae from the NCBI and the Lauraceae Chloroplast Genome Database (LCGDB), including 37 Beilschmiedia species, 21 Cryptocarya species, 13 Endiandra species, 1 Eusideroxylon species, 1 Potameia species, and 10 Syndiclis species. The distribution of sampled species of Endiandra was shown in Figure 1. Sequence information was provided in Supplementary Table S1, and this was used collectively for subsequent phylogenetic analysis.

2.2. Genome Assembly and Annotation

We performed plastome assembly with the parameters R = 15, w = 0.6, and k = 21, 45, 85, 115, 127 using GetOrganelle 1.7.5.0 [14] on a Linux system. All four species were all successfully assembled into circularized plastomes with no fragment loss, demonstrating high-quality plastome sequences. For initial annotation, we utilized a published sequence (NC_051912) of Endiandra as a reference in Geseq (https://chlorobox.mpimp-golm.mpg.de/geseq.html, accessed on 24 February 2025) [15]. We manually adjusted the four sample sequences using the same sequence of Endiandra (NC_051912) as a reference in Geneious Prime 2023.2.1 and generated the plastome maps using OGDRAW (https://chlorobox.mpimp-golm.mpg.de/OGDraw.html, accessed on 26 February 2025) [16].

2.3. Phylogenomic Analyses

We established a dataset of plastomes for phylogenomic analyses using MAFFT 7.480 [17] with the “auto” alignment strategy and aligned the plastome sequences, followed by automatic trimming with TrimAL 1.4.1 [18]. To select models, we employed ModelFinder [19]. The model selected by ModelFinder was the “best fit model”. Phylogenomic trees were reconstructed using the maximum likelihood (ML) method in IQ-TREE v2.1.2 [20].

2.4. Divergence Time Estimation

Following Yang et al. [13], we employed five fossil calibrations to date the phylogenomic tree. For narrow age-range fossils, direct bounds were applied; Virginianthus calycanthoides Friis et al. (C1) constrained the crown age of the Laurales to be 107.7–113 Ma [21], while Jerseyanthus calycanthoides Crepet et al. (C2) dated the Calycanthus-Chimonanthus split to be 85.8–86.8 Ma [21]. Similarly, Machilus maomingensis Jin & Tang (C5) calibrated the Machilus stem age to be 33.7–33.9 Ma [22], modeled as B (0.337, 0.339). For broader age estimates, we implemented lognormal distributions with offset (p = 0.1) and scale (c = 0.2) parameters. For Neusenia tetrasporangiata Eklund (C3), the Neocinnamomum stem node (72.1–86.3 Ma) [23] was calibrated to be L (0.71, 0.1, 0.2), and for Alseodaphne changchangensis Jin & Li (C4), the Persea crown group (37–48 Ma) [24] was calibrated as L (0.37, 0.1, 0.2).
Divergence time estimation was performed using MCMCtree v1.3.1 [25] under the GTR + G substitution model (model = 7) for ML-based branch length, gradient vector, and Hessian matrix estimation. We set rgene_gamma and sigma2_gamma to G (1, 27.7) and G (1, 4.5), respectively. Two independent MCMC runs were conducted (burnin = 2,000,000, sampfreq = 100, nsample = 10,000). Parameter convergence was confirmed in Tracer v1.7.2 [26], with all ESS values >200. The final tree was visualized using tvBOT [27].

2.5. Analysis of Simple Sequence Repeats and Functional Duplicated Sequences

We used MISA (https://webblast.ipk-gatersleben.de/misa, accessed on 27 February 2025) [28] to obtain the counts of mono-, di-, tri-, tetra-, penta-, and hexa-nucleotide repeats, with repetition thresholds set to 10, 5, 4, 3, 3, and 3, respectively. The obtained information was compiled into a table for downstream analysis. We used the REPuter tool (https://bibiserv.cebitec.uni-bielefeld.de/reputer, accessed on 28 February 2025) [29] to acquire repetitive sequence information, with “the maximum computed repeats” and “the minimal repeat size” set to 50 and 8, respectively. The obtained information was also tabulated. Finally, we used the “ggplot2” package [30] in R 4.4.1 [31] to visualize the information in the tables.

2.6. Analysis of IR Boundaries and Nucleotide Polymorphism

We utilized CPJSdraw v1.0.0 [32] to conduct the analysis of IR boundaries, employing sequences in the gb format for this purpose. For the nucleotide polymorphism analysis, we employed DnaSP v5 [33] software prior to the analysis. The sequences were aligned using MAFFT 7.480 [17], and subsequent analysis was performed using the fasta format with specified parameters (window length = 600, step size = 200).

2.7. Codon Usage Bias Analysis

Because codon usage bias analysis required protein-coding sequences (CDS), we extracted the 79 CDS from the plastomes in Geneious Prime 2023.2.1, exported them as a csv file, and then converted the csv file to fasta format using a Perl script [34]. Subsequently, we removed sequences that did not meet the analysis requirements. After screening, we used MEGA to calculate the relative synonymous codon usage (RSCU) values for each sequence. During this process, the RSCU values of codons encoding Met (M) (ATG/AUG), Trp (W) (TGG/UGG), and the three stop codons (TAG, TGA, and TAA) were excluded. Finally, we summarized the RSCU values across all sequences and generated a visualization using the “ggplot2” package [30] in R 4.4.1 [31].

3. Results

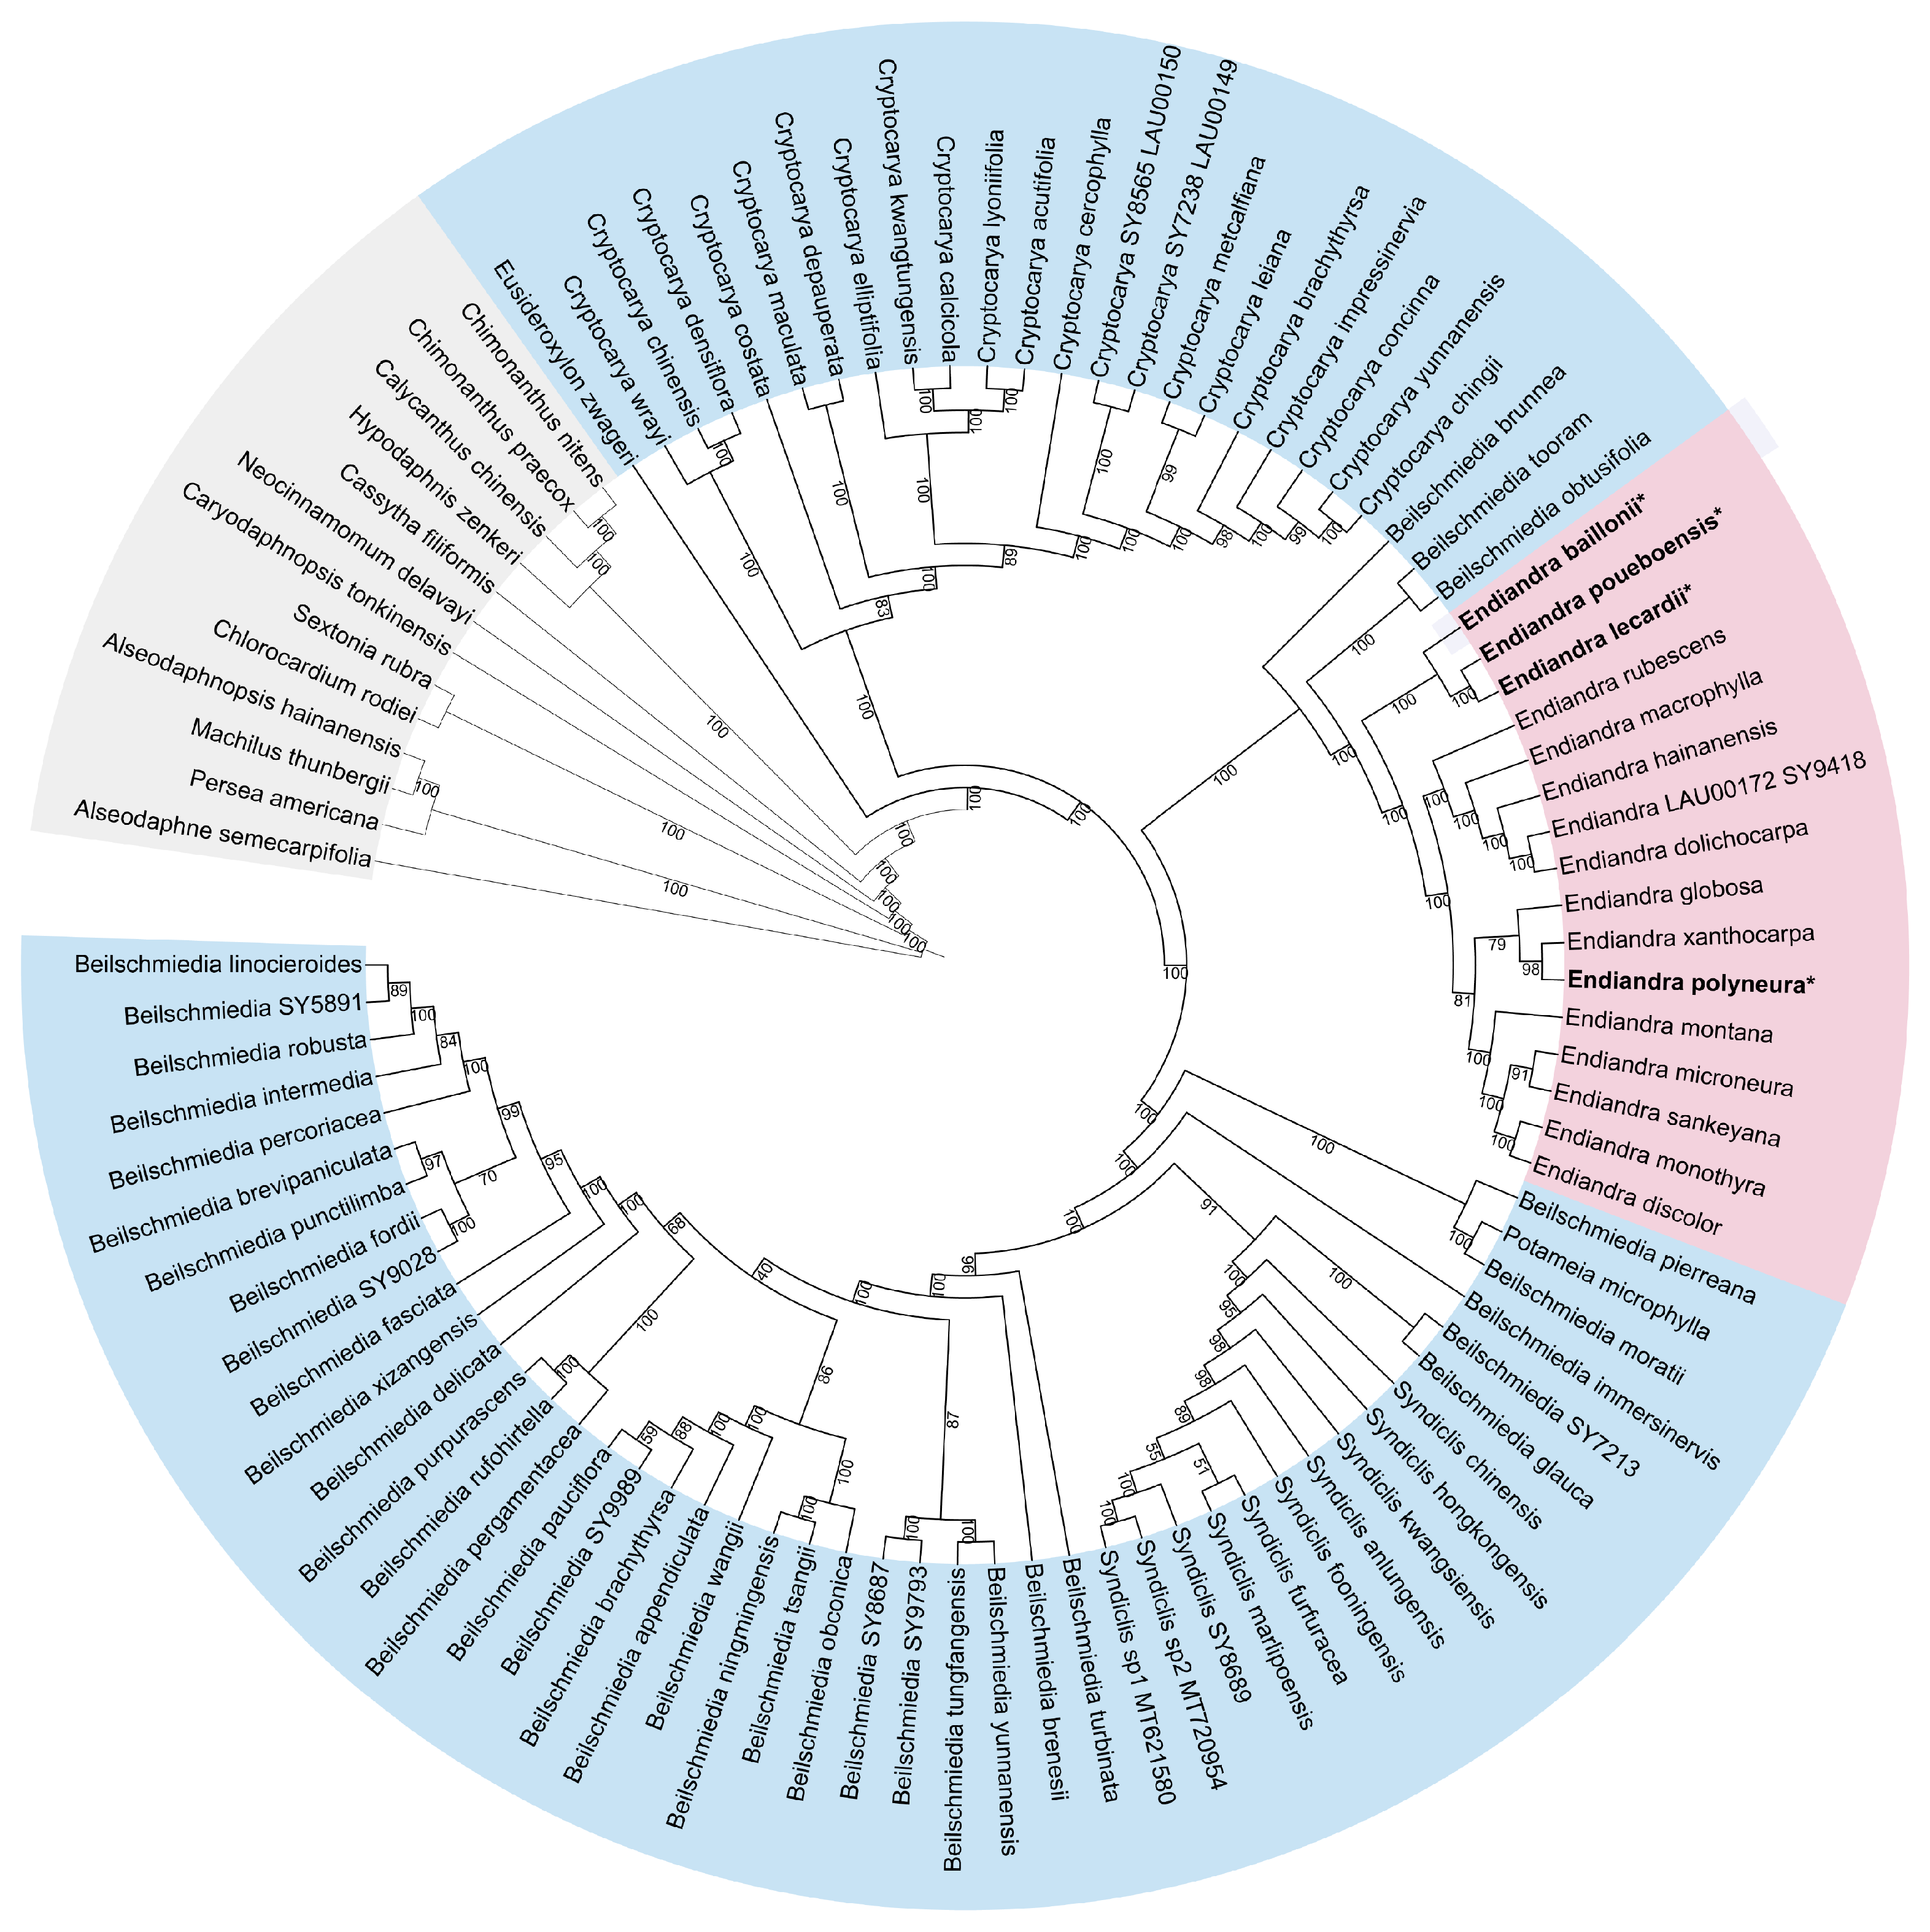
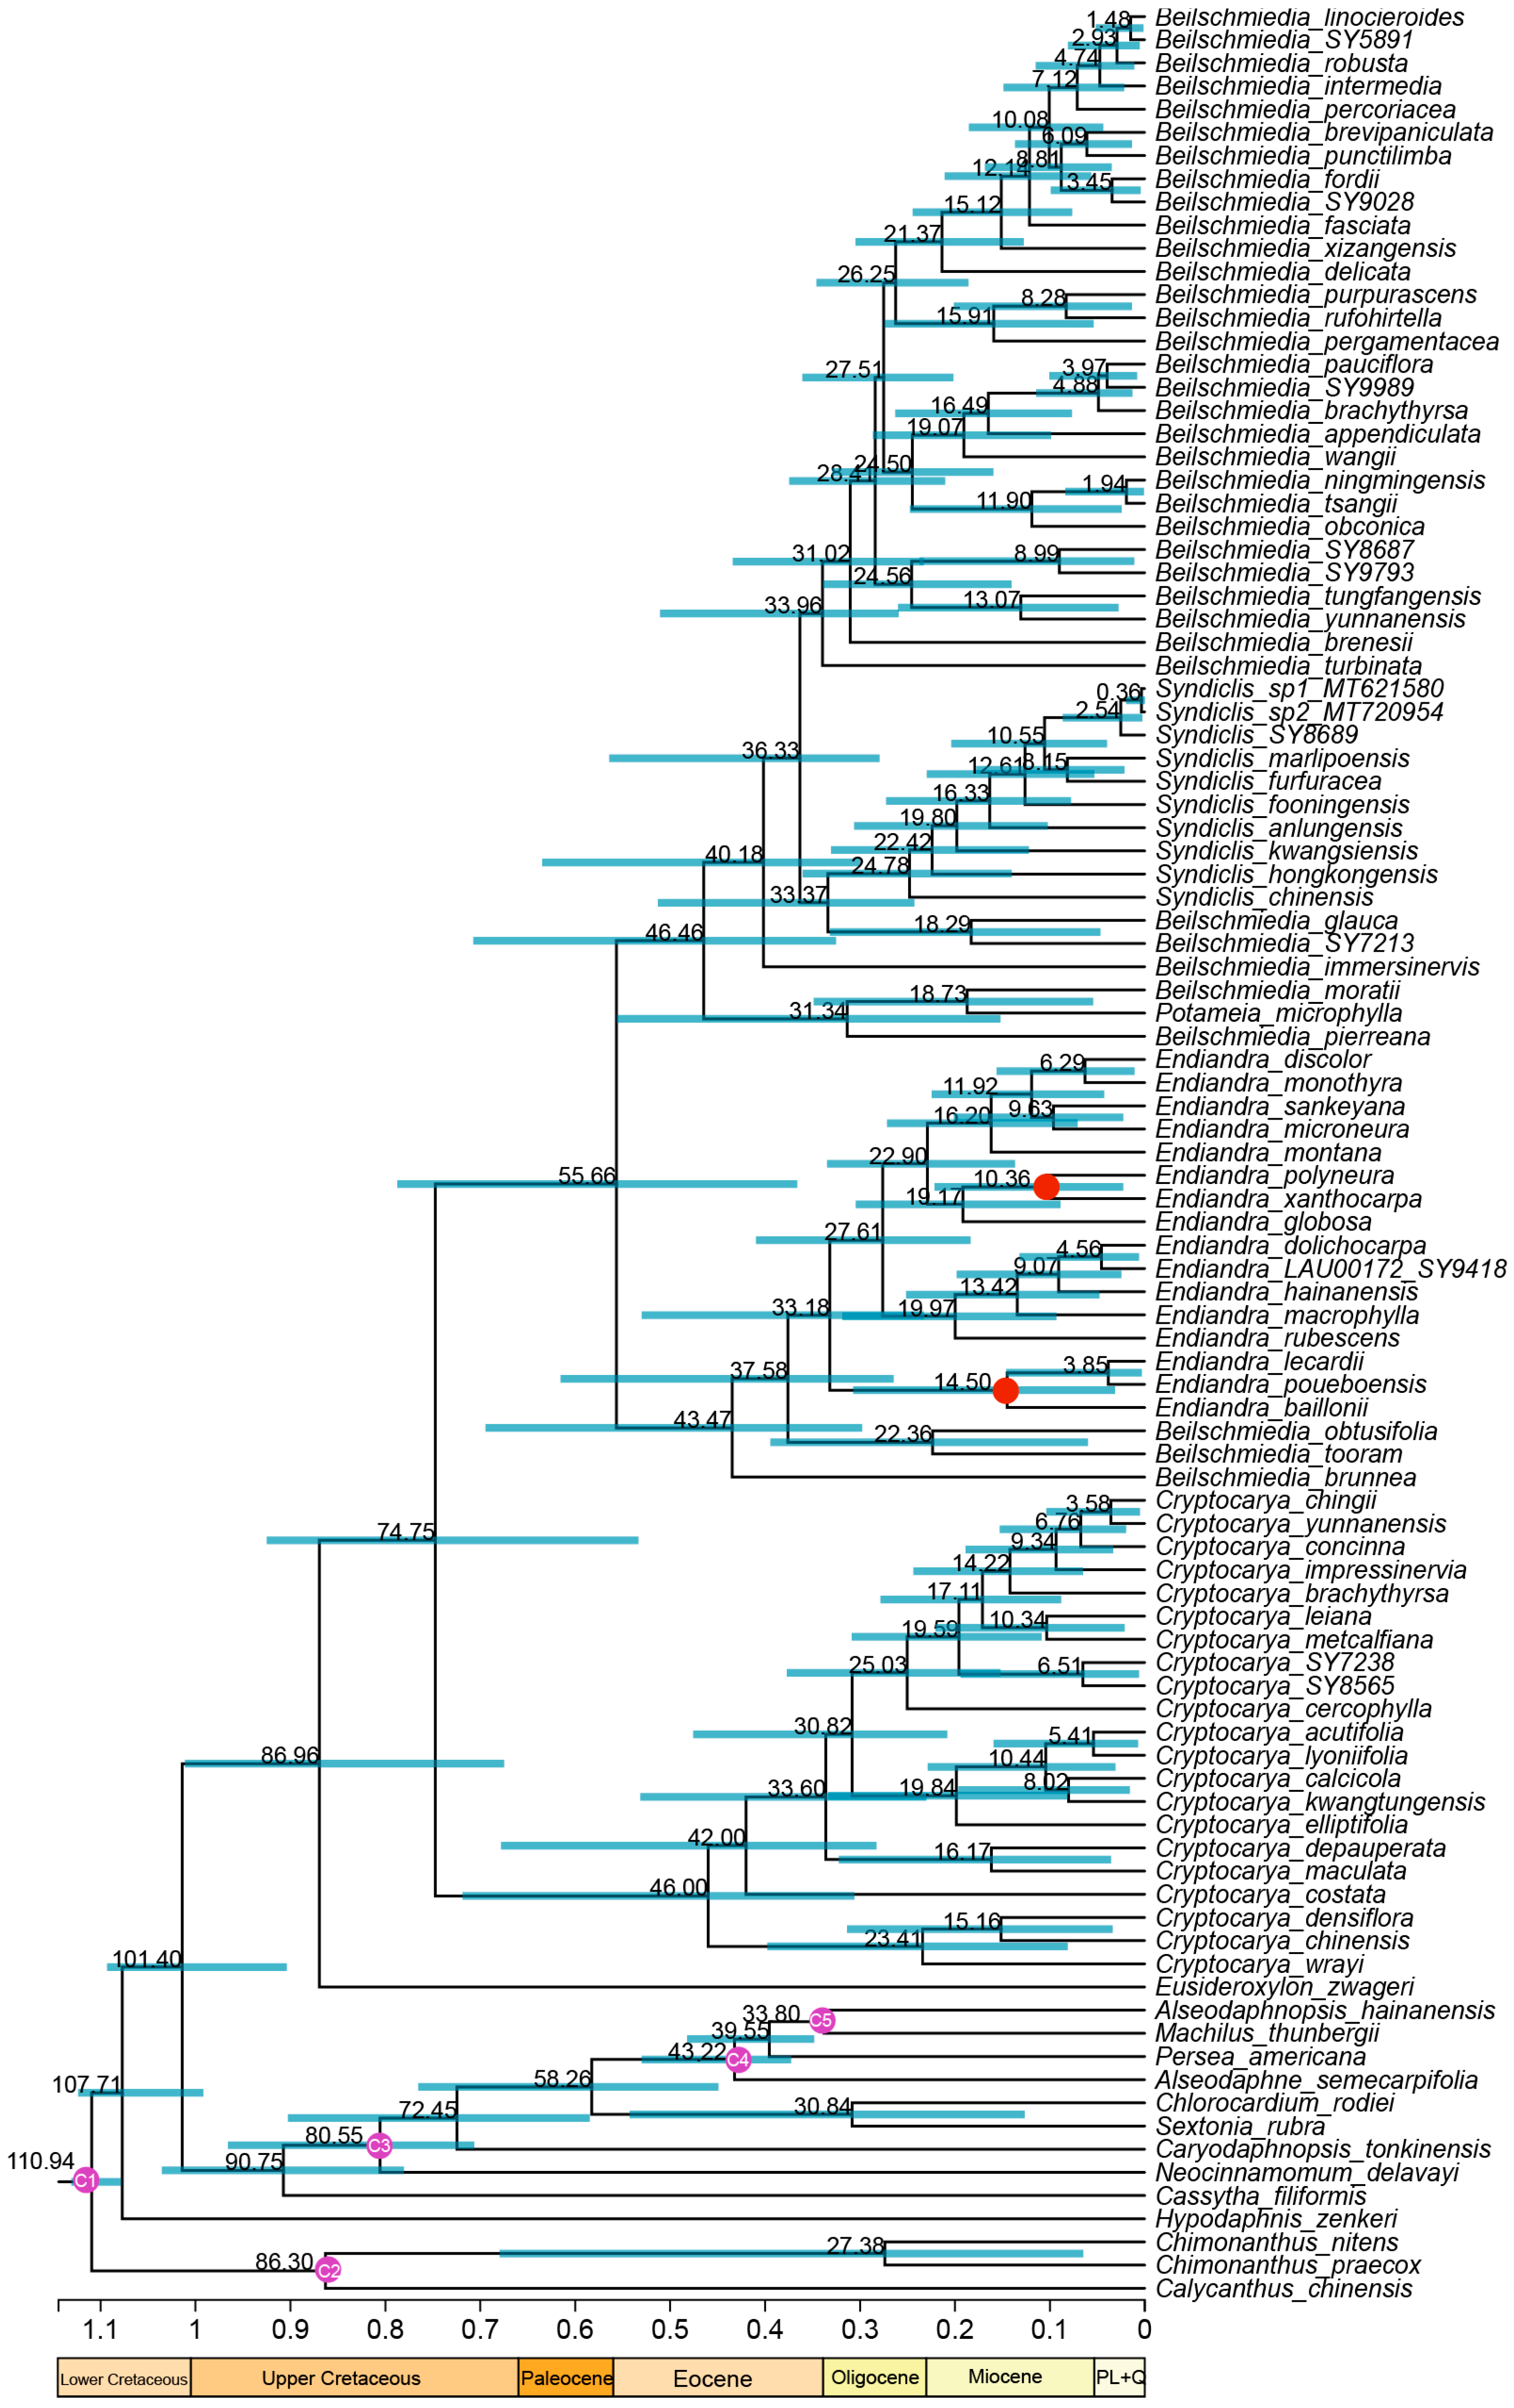
3.1. Phylogenetic Analysis and Diversification Times

We obtained a well-resolved phylogenomic tree of the Cryptocaryeae (Figure 2). Beilschmiedia was not monophyletic. Endiandra was closely related to three species of Beilschmiedia (B. obtusifolia, B. tooram (F.M.Bailey) B.Hyland, and B. brunnea B.Hyland) from Australia. Within Endiandra, the four species from New Caledonia were separated into two subclades: E. lecardii, E. poueboensis, and E. baillonii constituting a small subclade and E. polyneura, together with E. xanthocarpa B.Hyland and E. globosa Maiden & Betche from Queensland and New South Wales, forming another small subclade. The phylogenomic reconstruction demonstrated that Syndiclis formed a monophyletic group sister to a small clade containing two Beilschmiedia species, while Potameia microphylla Kosterm., Beilschmiedia moratii van der Werff, and B. pierreana Robyns & R.Wilczek constituted a distinct African clade. Cryptocarya R.Br. was resolved as a monophyletic clade, and Eusideroxylon Teijsm. & Binn. emerged as an independent branch.
Divergence time estimation revealed that the stem age of Endiandra was 37.58 Ma (95% HPD: 26.46~61.54 Ma), and the crown age was 33.18 Ma (95% HPD: 23.3~53.01 Ma). The four New Caledonian Endiandra were grouped into two separate subclades; the first subclade comprised three species (E. baillonii, E. poueboensis, and E. lecardii), while the second subclade contained only one species (E. polyneura). For the first subclade, the stem and crown ages were 33.18 Ma and 14.5 Ma (95% HPD: 3.13~30.73 Ma), respectively. The second subclade containing only E. polyneura diverged from its sister E. xanthocarpa at 10.36 Ma (95% HPD: 2.27~22.16 Ma) (Figure 3).

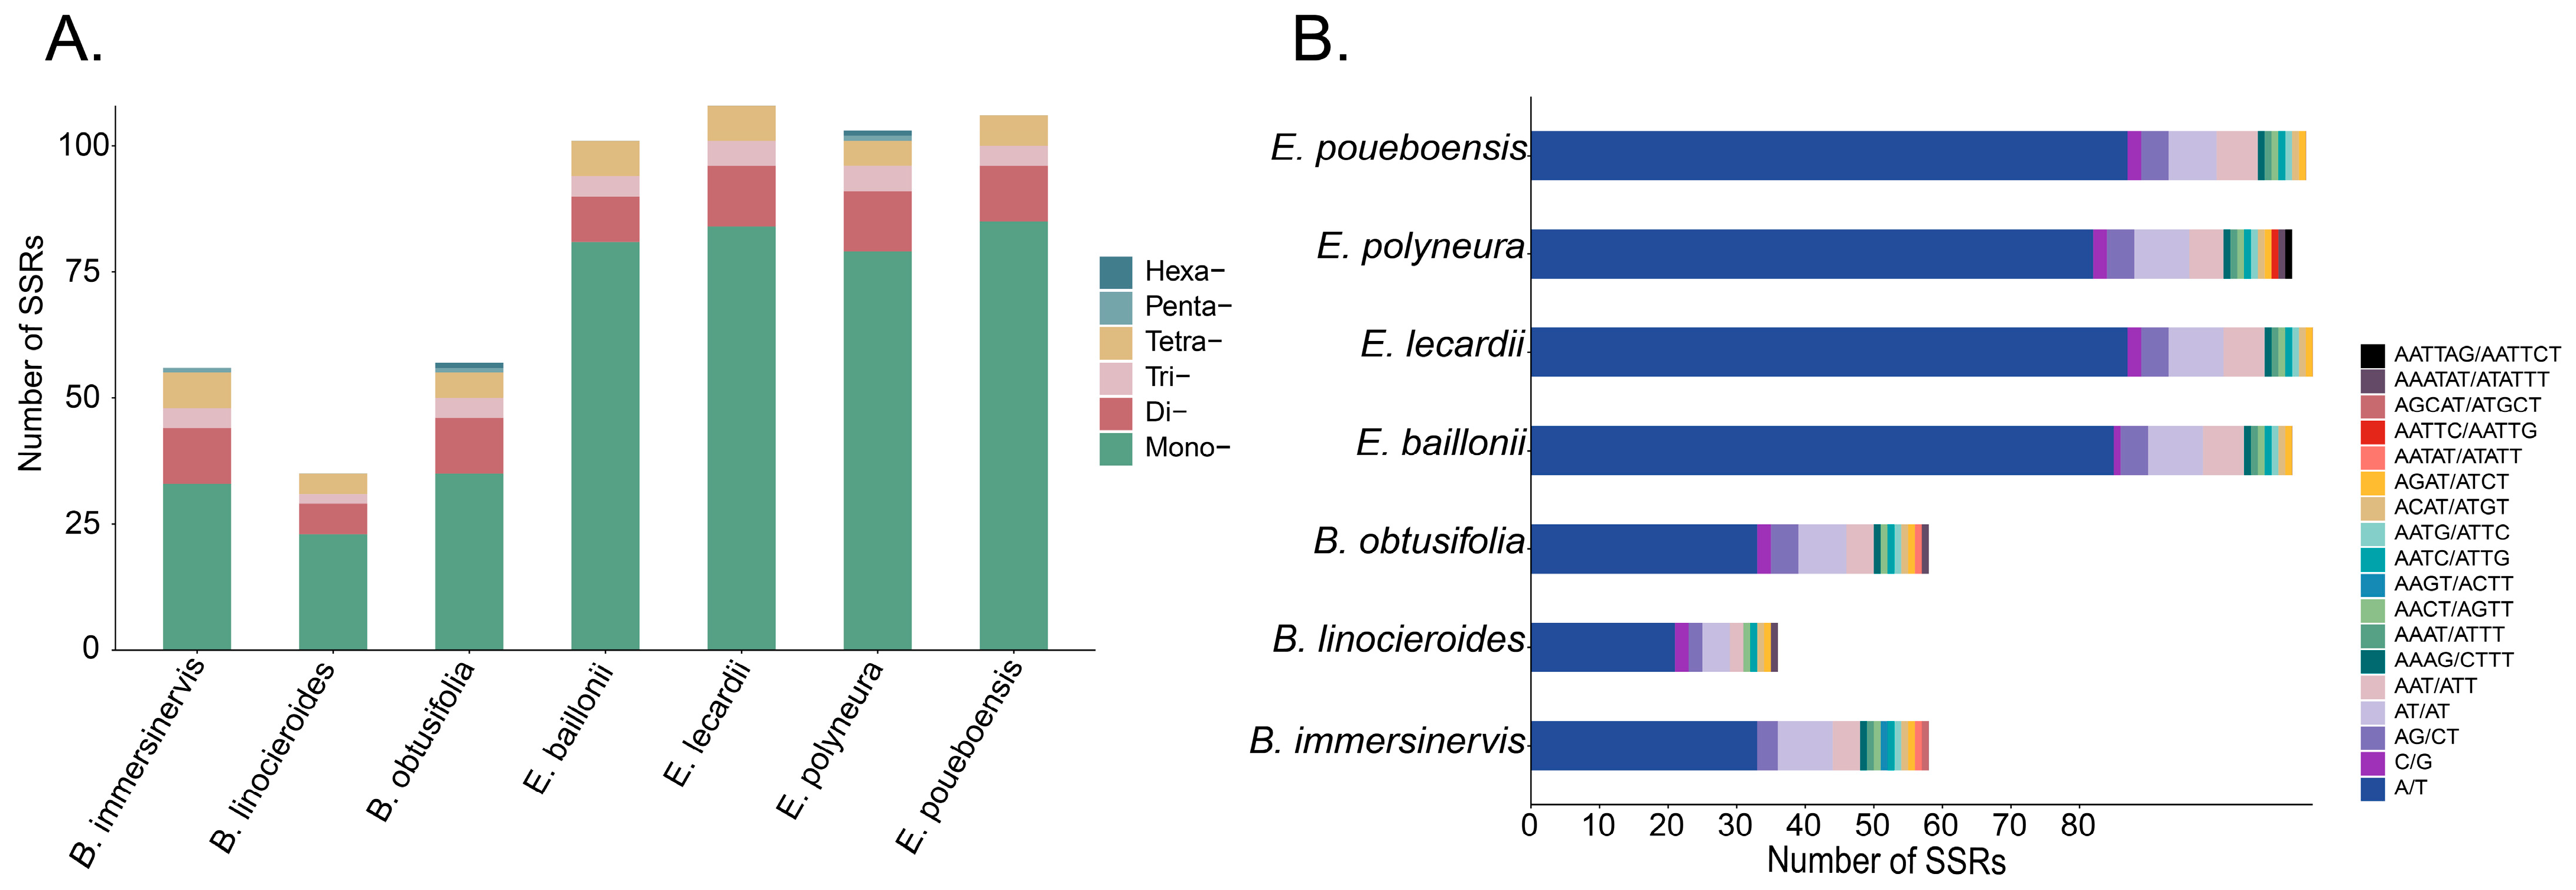
3.2. Characteristics of the New Caledonian Endiandra

The complete plastome sequences of four Endiandra species exhibited the typical Lauraceae structure, consisting of a pair of inverted repeats (IRs), a large single-copy (LSC) region, and a small single-copy (SSC) region (Figure 4). However, the length of each region varied among the species. The sequence of E. polyneura, at 158,339 bp was the longest among the four species. Its LSC region measured 89,044 bp, the SSC region was 18,259 bp long, and each of the two IRs was 25,518 bp in length. The plastome sequence of E. baillonii was 158,313 bp long, with the LSC region being 89,094 bp long, the SSC region being 18,213 bp long, and both of the IRs being 25,503 bp long. The plastome sequence of E. lecardii was 158,261 bp long, with the LSC region being 89,062 bp long, the SSC region being 18,203 bp long, and both of the IRs being 25,498 bp long. The plastome sequence of E. poueboensis, which was 158,259 bp long and the shortest among the four species, had an LSC region 89,060 bp in length, an SSC region 18,199 bp long, and IRs which were each 25,500 bp long. The plastome sequences of the four Endiandra species were longer than those of the Beilschmiedia species. The GC content of the four Endiandra species was 39.0%, lower than that of the three Beilschmiedia species (Table 2). All four plastomes of the New Caledonian Endiandra contained 131 genes in total, with the CDS, rRNA, and tRNA being 86, 8, and 37, respectively (Table 2).

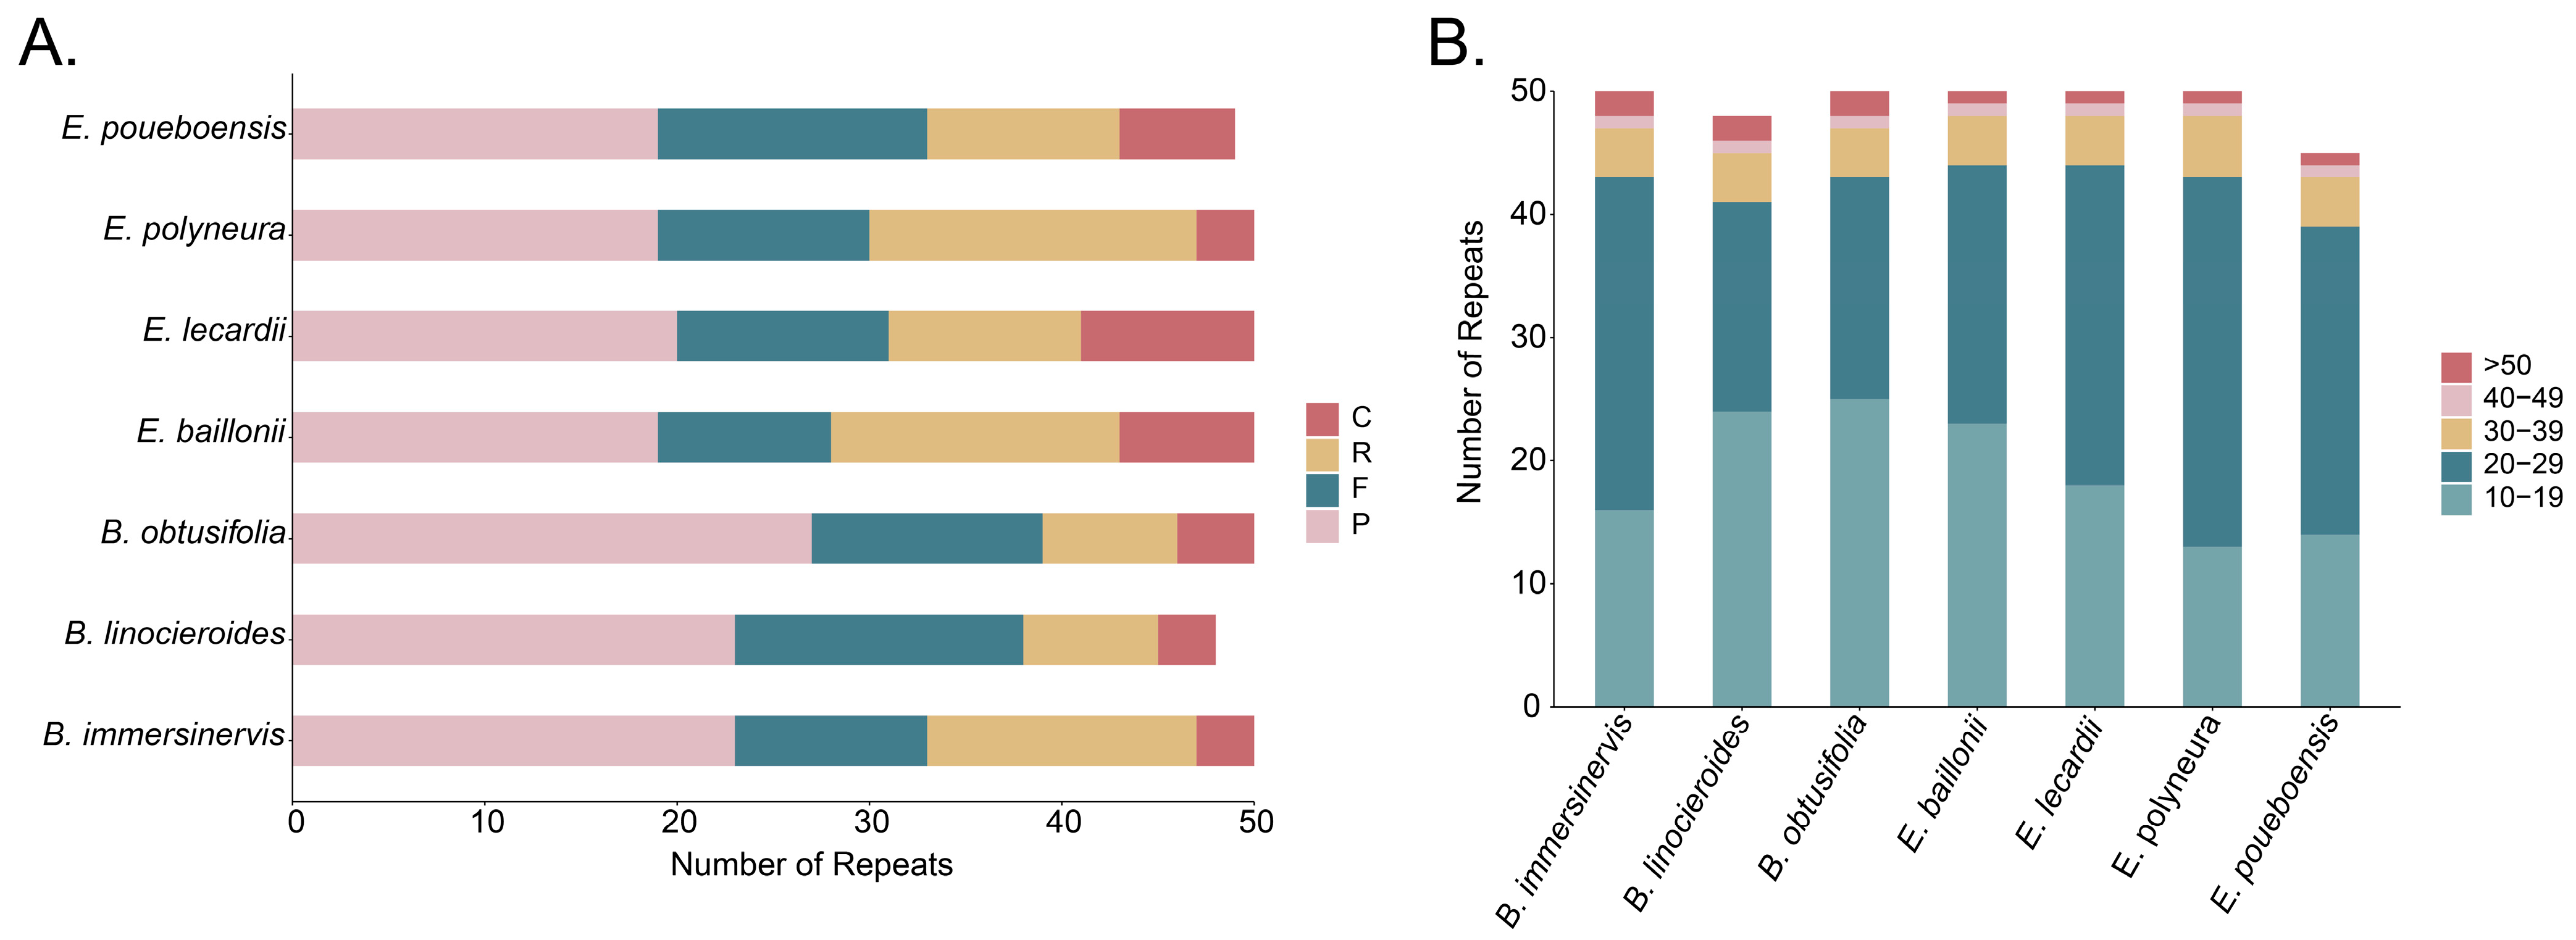
3.3. Analysis of Repeated Sequences

An analysis of simple sequence repeats (SSRs) revealed that the selected species of Beilschmiedia and Endiandra all contained six types of SSRs (i.e., mononucleotide repeats, dinucleotide repeats, tetranucleotide repeats, trinucleotide repeats, pentanucleotide repeats, and hexanucleotide repeats) (Figure 5A), but significant variation was found in the numbers. The total SSRs of B. immersinervis, B. linocieroides, and B. obtusifolia were 56, 35, and 57, respectively, while the total SSRs of E. baillonii, E. Lecardii, E. polyneura, and E. poueboensis were 101, 108, 103, and 106, respectively. As depicted in Figure 5A, the primary difference in total SSRs between the two genera lay in the quantity of mononucleotide repeats (B. immersinervis (33), B. linocieroides (23), B. obtusifolia (35), E. baillonii (81), E. Lecardii (84), E. polyneura (79), and E. poueboensis (85)).
Among the 18 repeat units (Figure 5B), there was also a significant difference in the total number between Beilschmiedia and Endiandra. The mononucleotide repeat unit A/T accounted for this large difference in the total numbers. The number of A/T repeat units in B. immersinervis, B. linocieroides, and B. obtusifolia was 33, 21, and 33, respectively, while the number of A/T repeat units in E. baillonii, E. Lecardii, E. polyneura, and E. poueboensis was 85, 87, 82, and 87, respectively.
The selected species of Beilschmiedia and Endiandra contained four types of repetitive sequences (Figure 6A): palindromic repeats (P), forward repeats (F), reverse repeats (R), and complementary repeats (C). In general, the total number of repetitive sequence types did not vary significantly among the species. However, notable differences were found when examining the individual types. All species of Beilschmiedia possessed a higher number of palindromic repeats (P) (B. immersinervis (23), B. linocieroides (23), and B. obtusifolia (27)) when compared with the species of Endiandra (E. baillonii (19), E. lecardii (20), E. polyneura (19), and E. poueboensis (19)). B. linocieroides (15) possessed the highest number of forward repeats (F), while E. baillonii (9) had the lowest number. E. baillonii (15) had the highest number of reverse repeats (R), whereas B. linocieroides (7) and B. obtusifolia (7) had the lowest number. In terms of complementary repeats (C), E. baillonii (7) had the highest number, while B. immersinervis (3), B. linocieroides (3), and E. polyneura (3) had the lowest number.
According to an analysis of the lengths, the seven species displayed similar total numbers across the five length categories (Figure 6B). However, when examining the specific length ranges, differences emerged. B. obtusifolia had the greatest number of sequences (25) in the 10–19 bp range, E. polyneura had the greatest number (30) in the 20–29 bp range, and E. polyneura also had the greatest number (5) in the 30–39 bp range. The remaining species had four sequences in this range. In the 40–49 bp range, all species had one sequence, and in the >50 bp range, the species of Beilschmiedia possessed two sequences each, while the species of Endiandra had one sequence each.

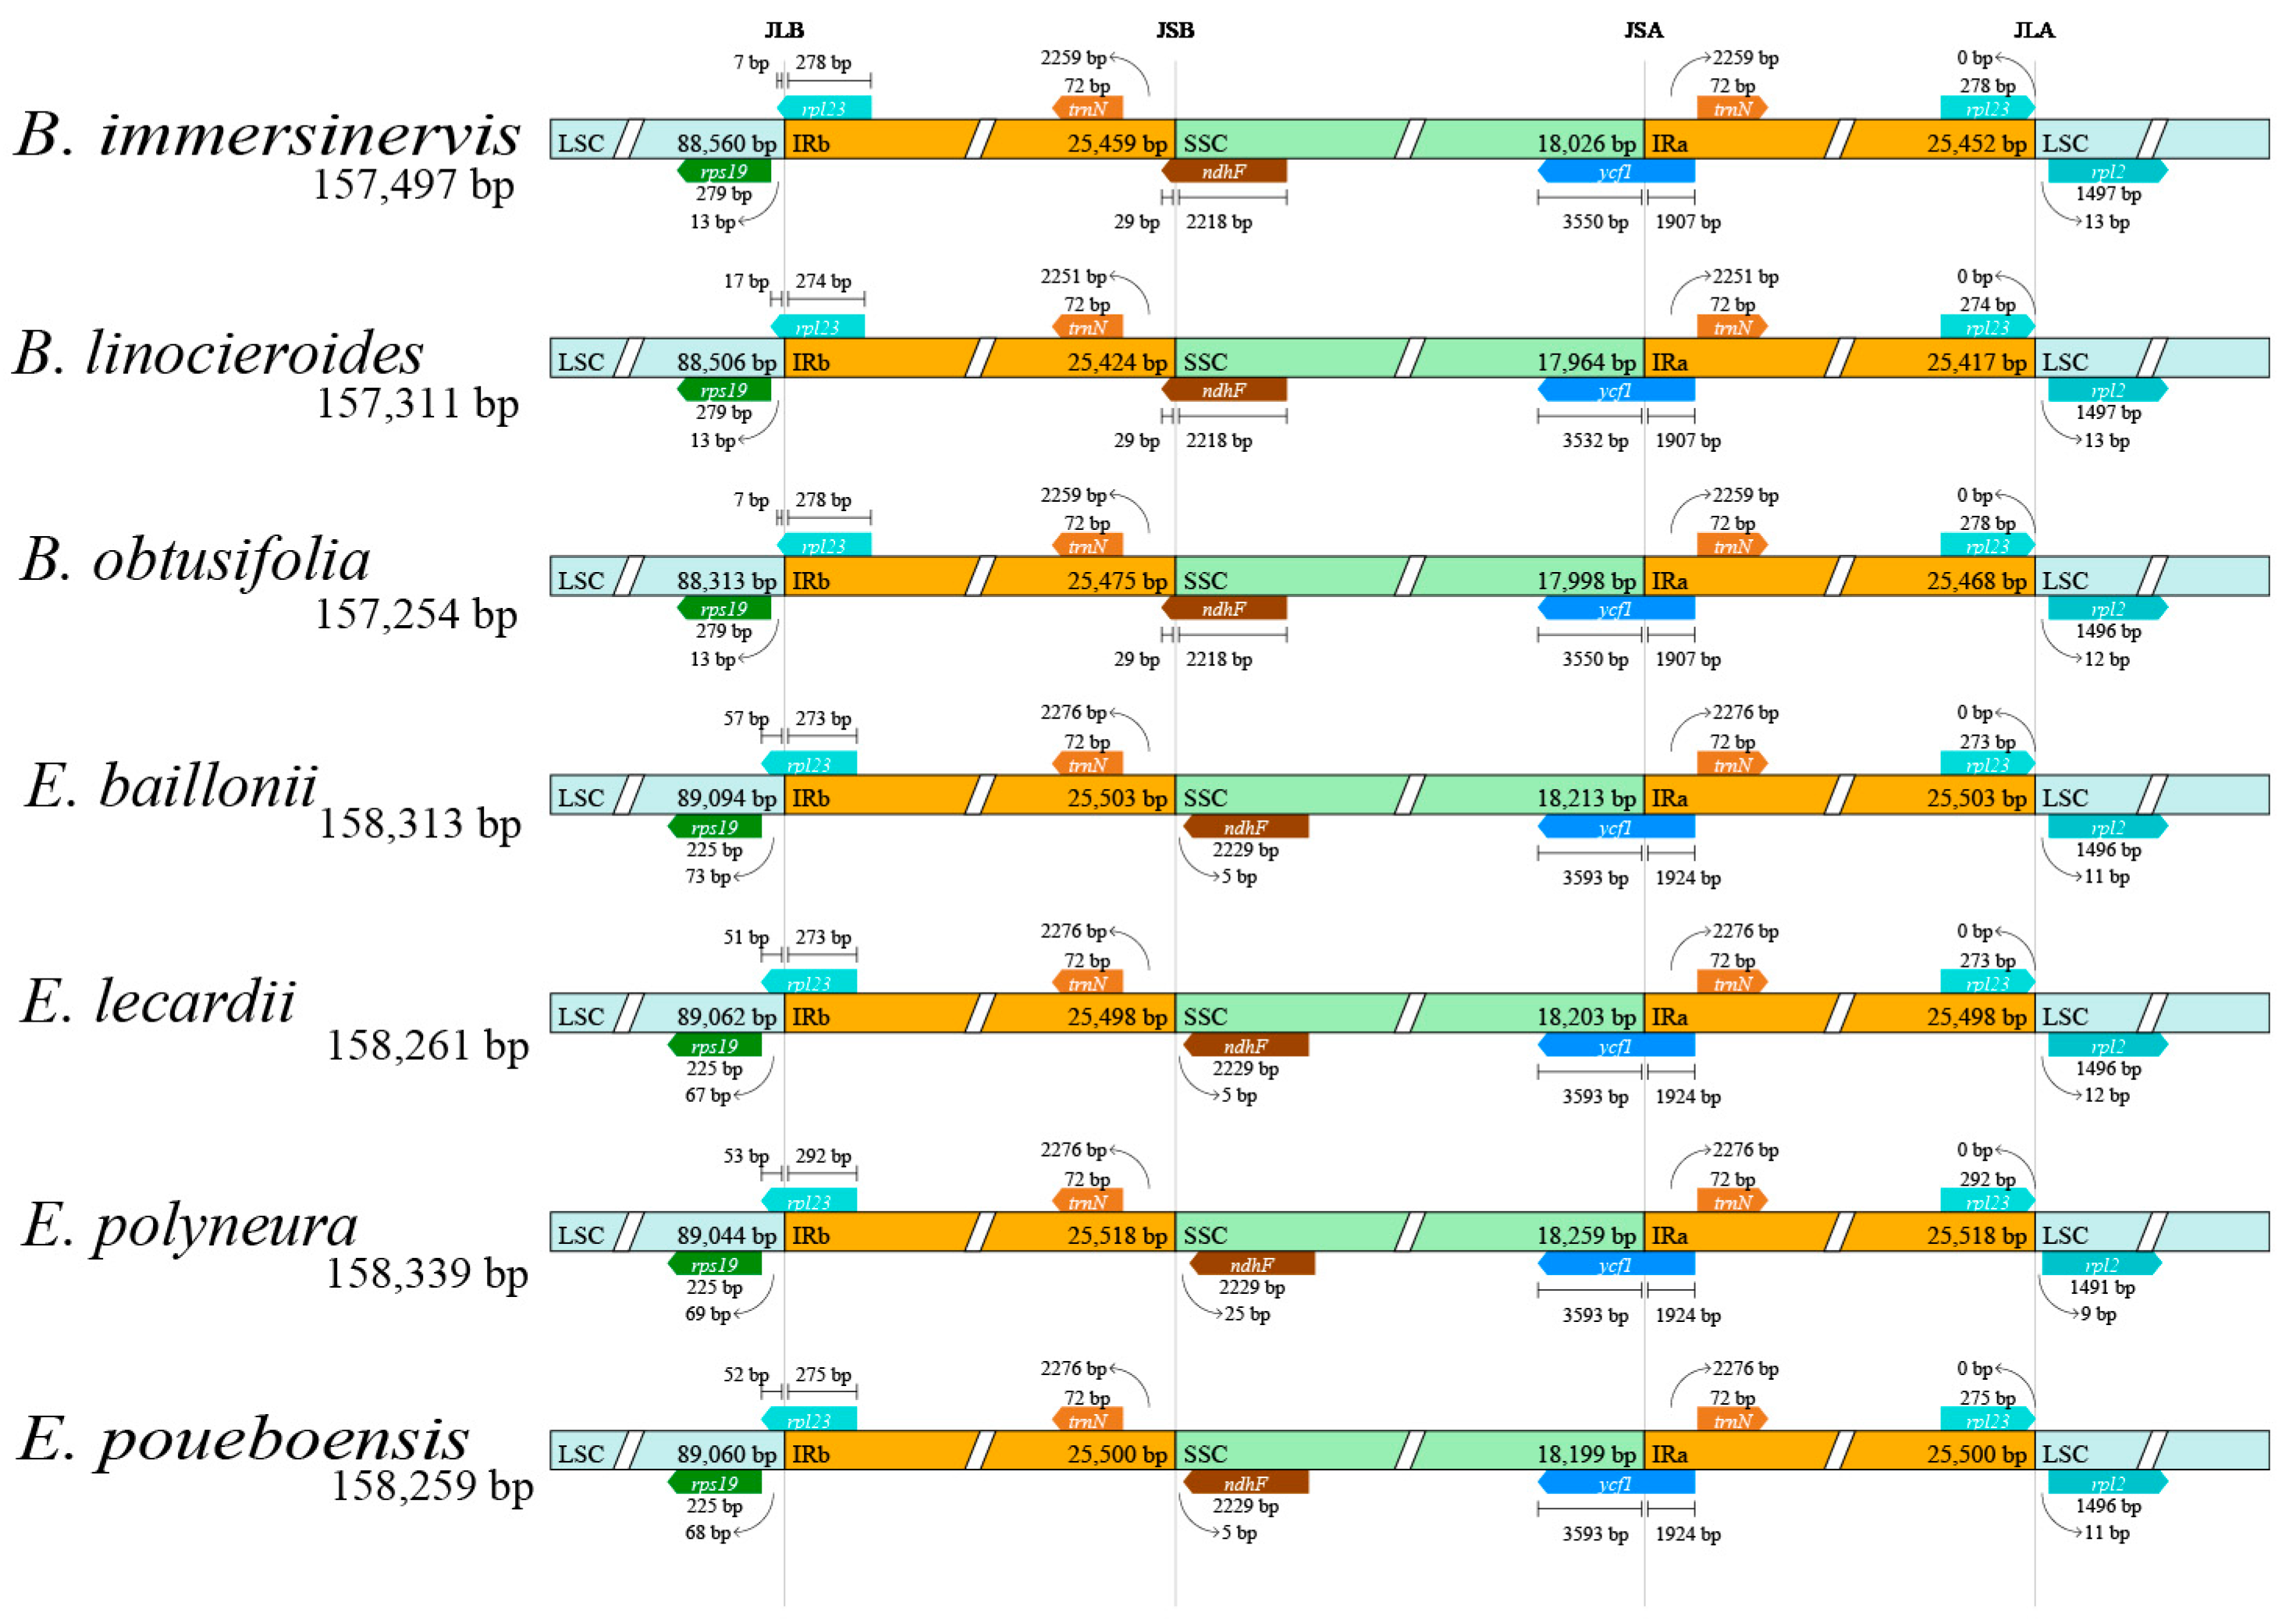
3.4. Analysis of IR Boundaries

We conducted a comparative analysis of the boundaries of the four IR junctions: JLB (LSC/IRb), JSB (SSC/IRb), JSA (SSC/IRa), and JLA (LSC/IRa) (Figure 7). The boundaries of LSC/IRb, SSC/IRa, and LSC/IRa were consistent across the seven species compared. The LSC/IRb boundary was located within the rpl23 gene. In Beilschmiedia, the interval length between the LSC/IRb boundary and rps19 was consistently 13 bp, whereas in Endiandra, this interval exhibited significantly greater variation, spanning from 63 to 76 bp. The SSC/IRa boundary was located within the ycf1 gene. In Beilschmiedia, the interval between the SSC/IRa boundary and trnN ranged from 2251 to 2259 bp, while in Endiandra, this interval was consistently 2276 bp across all species. The LSC/IRa boundary was located within the intergenic region between rpl23 and rpl2. In Beilschmiedia, the interval between the LSC/IRa boundary and rpl2 ranged from 11 to 12 bp, whereas in Endiandra this interval varied between 9 and 12 bp. The only difference was in the location of the SSC/IRb boundary; in the three species of Beilschmiedia, it was located in the ndhF gene, whereas in the four species of Endiandra, it was in the trnN-ndhF intergenic region. In Beilschmiedia, the spacer between the SSC/IRb boundary and trnN ranged from 2251 to 2259 bp, whereas in Endiandra, this region was consistently 2276 bp in all species. In E. baillonii, E. lecardii, and E. poueboensis, the interval between the SSC/IRb boundary and ndhF was consistently 5 bp, whereas in E. polyneura, the interval between the SSC/IRb boundary and ndhF was 25 bp.

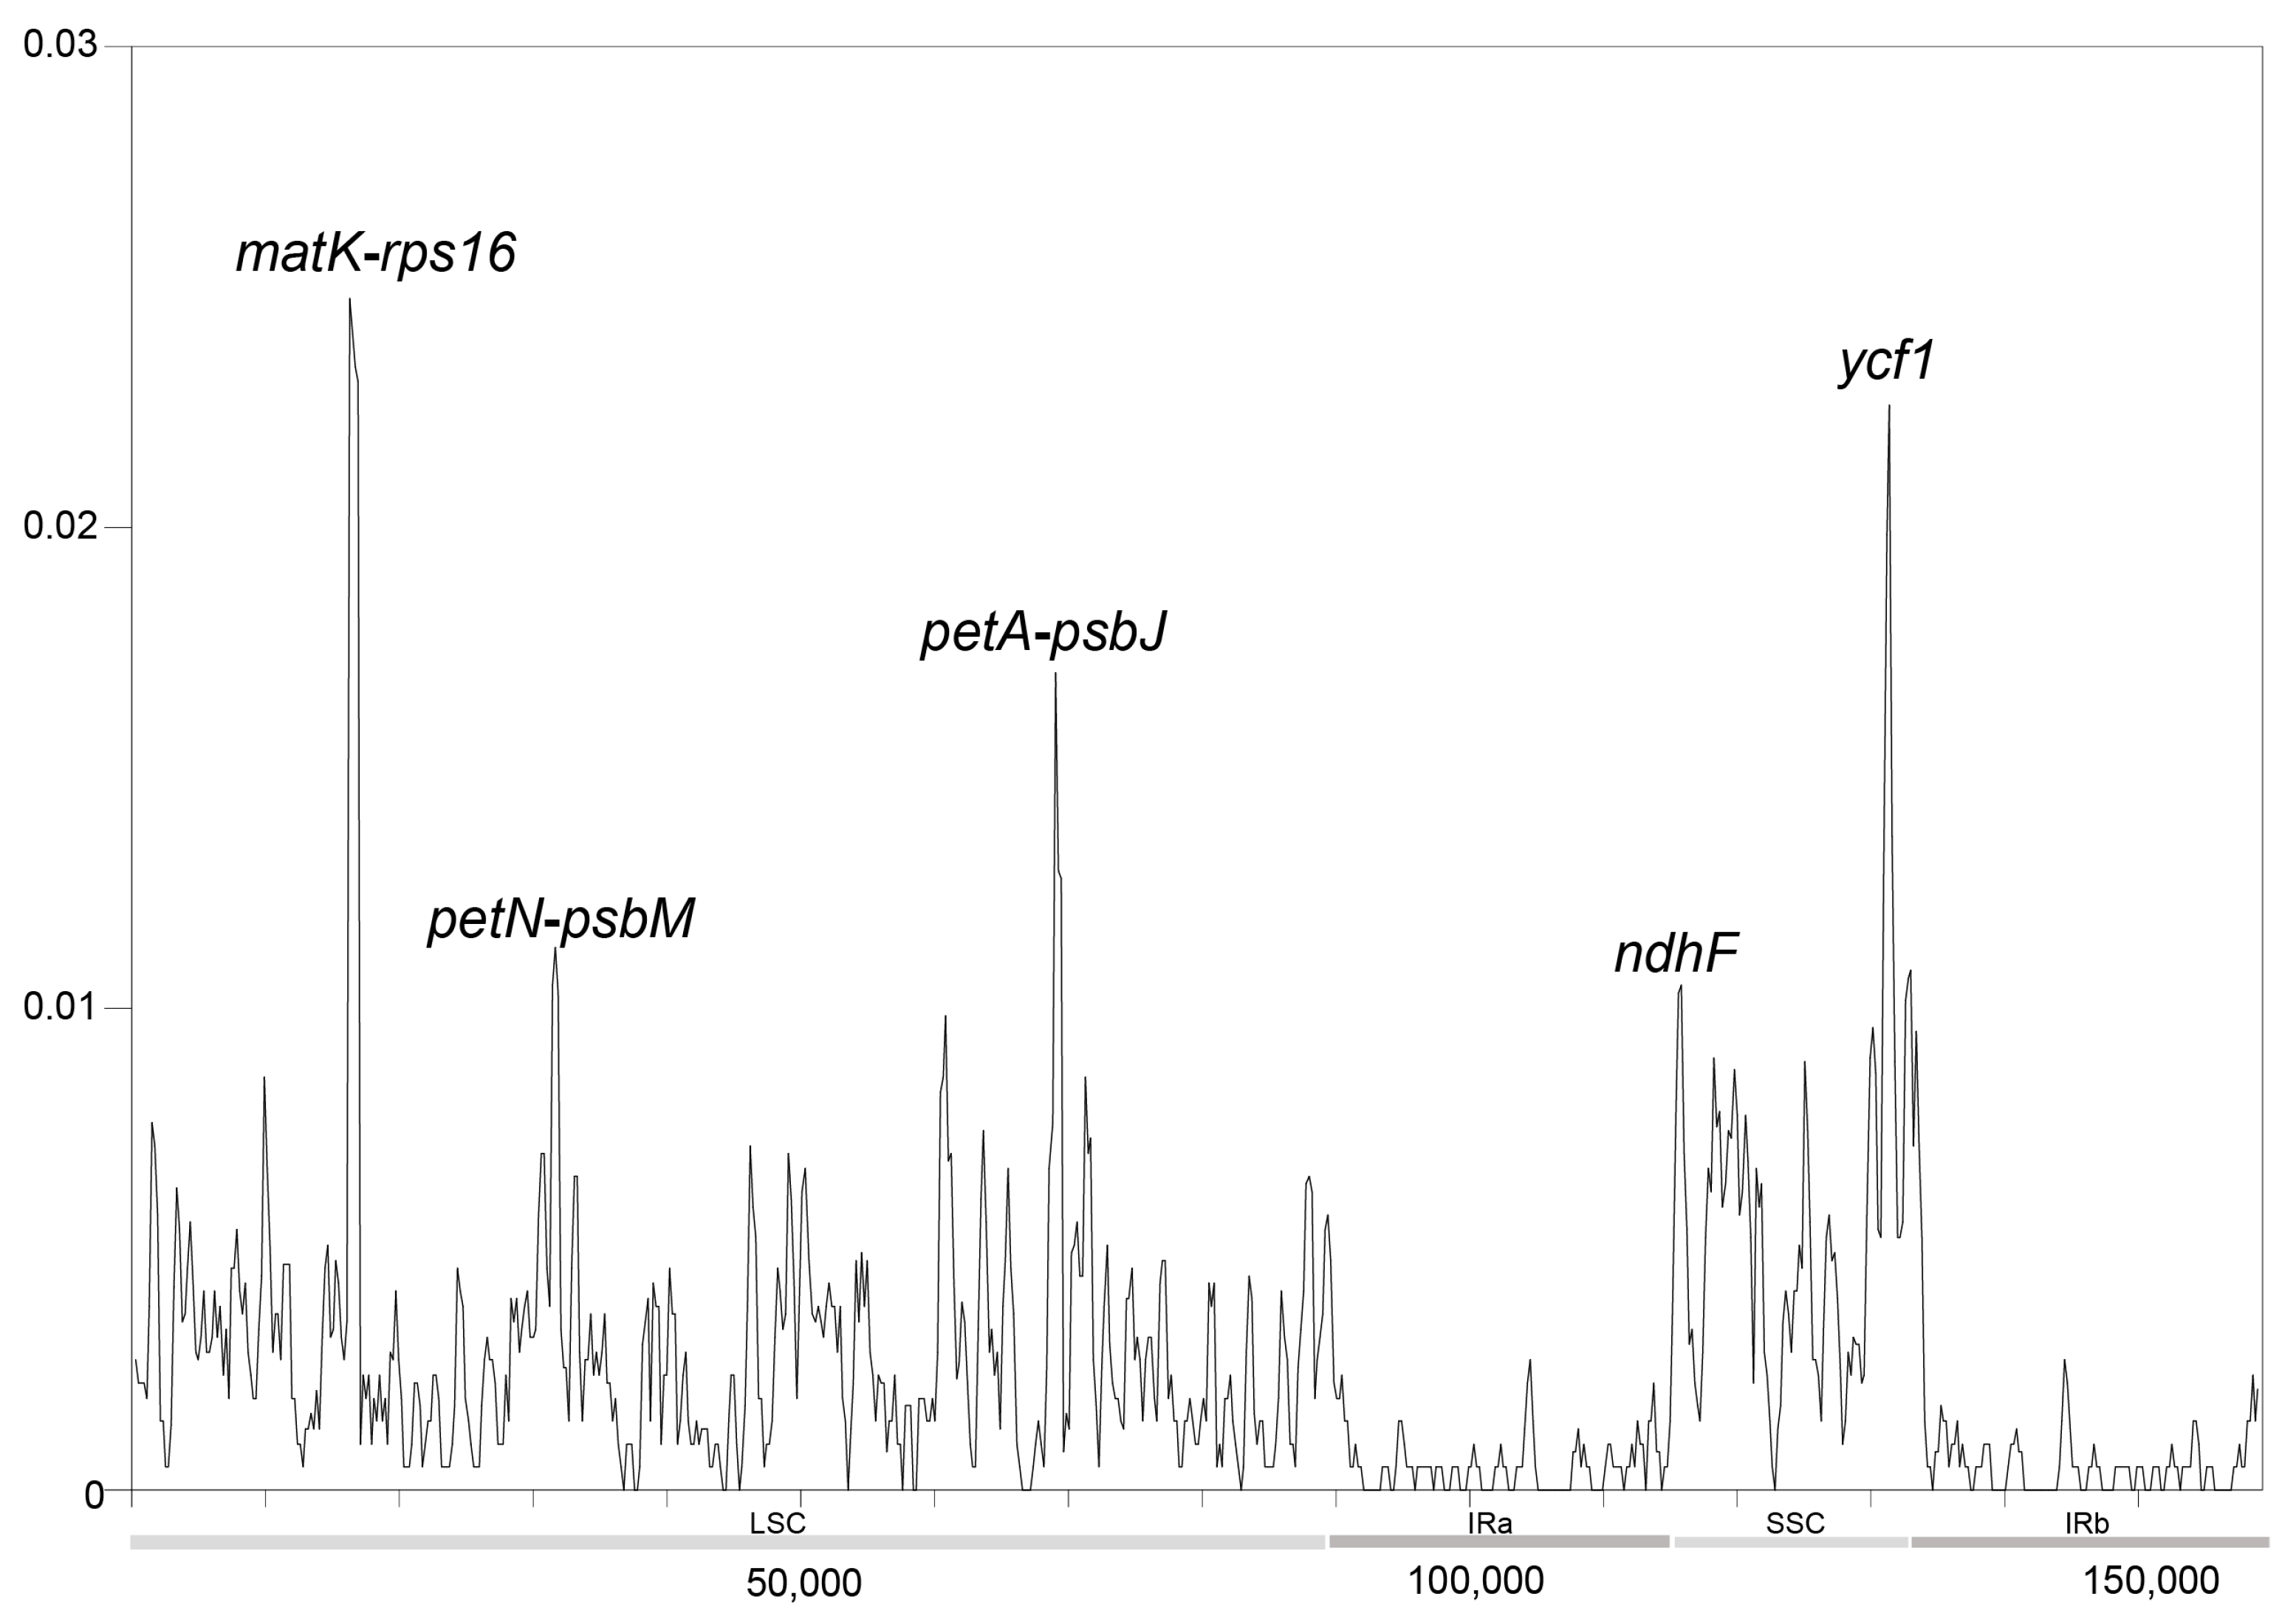
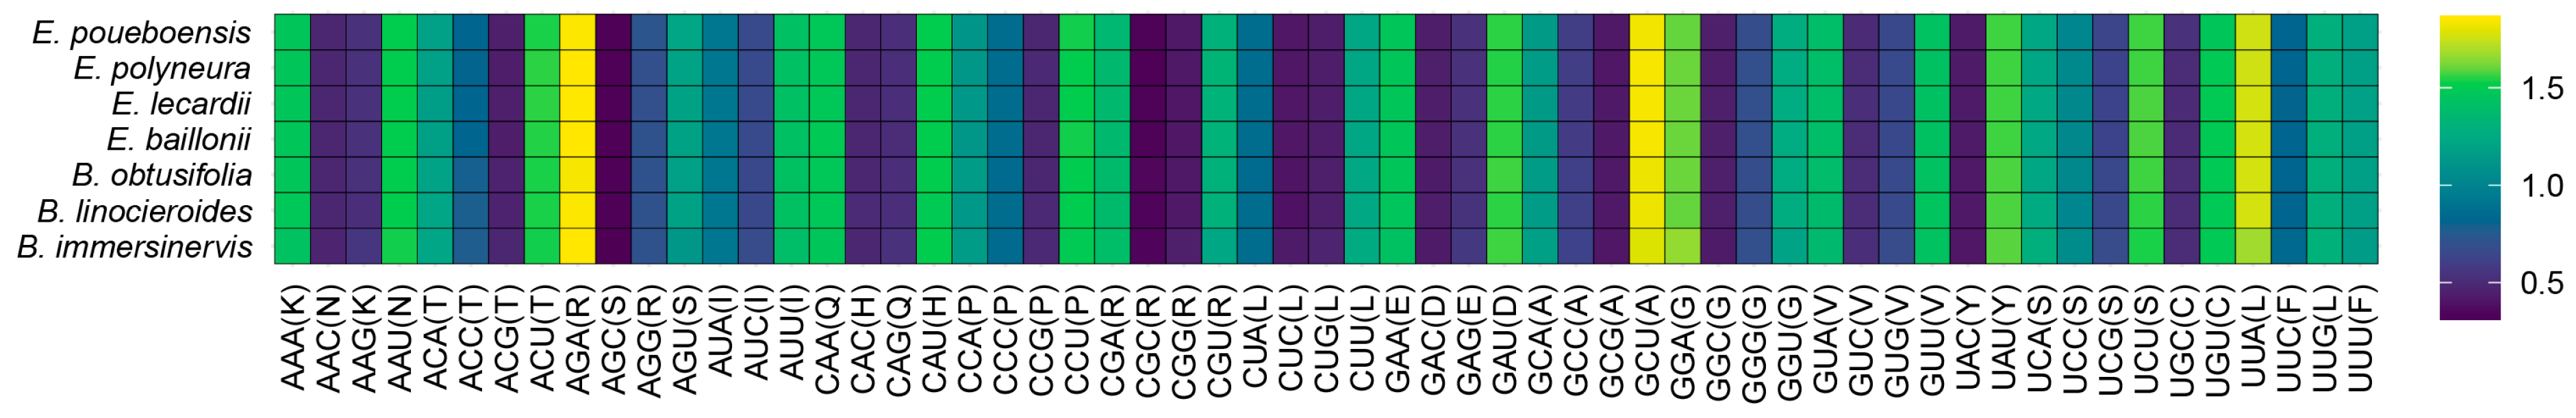
3.5. Nucleotide Polymorphism and Codon Usage Bias Analysis

According to the analysis of nucleotide polymorphism (Figure 8), the IR regions in the plastome structure of the seven species were more conserved than the LSC and SSC regions. Variations in the genera Beilschmiedia and Endiandra mainly occurred in the LSC and SSC regions. Five gene regions and intergenic spacers displayed high nucleotide diversity. Among them, the matK-rps16 intergenic region in the LSC region exhibited the highest nucleotide diversity, with a Pi value of 0.02476, followed by the ycf1 gene in the SSC region (Pi = 0.02254). The petA-psbJ (Pi = 0.0127) and petN-psbM (Pi = 0.01127) intergenic regions, as well as the ndhF gene (Pi = 0.01048), also showed high diversity.
Our analysis of the codon usage bias (Figure 9) indicated that the RSCU values of all codons calculated for the seven species did not display significant differences among them. However, from a codon perspective, codons ending with C or G had lower RSCU values (<1.0), while those ending with A or U had higher RSCU values (>1.0).

4. Discussion

4.1. Phylogenomics of the Cryptocaryeae and the New Caledonian Species of Endiandra

We conducted a phylogenomic study on the Cryptocaryeae based on complete plastome sequences and obtained a well-resolved phylogenomic tree. The findings are consistent with those of Li et al. [35], confirming that Beilschmiedia is not monophyletic. The American species of Beilschmiedia and the Asian species of Beilschmiedia formed a clade, and the African species of Beilschmiedia and Potameia constituted a separate clade. Syndiclis, together with two sympatric Beilschmiedia species, formed a clade. We also corroborated the monophyly of Endiandra, though its monophyletic status requires further validation through more extensive sampling. Our phylogenomic tree demonstrates that Endiandra and the Australian Beilschmiedia formed a larger clade. However, given the likely polyphyletic nature of Beilschmiedia itself, our results can only suggest a closer phylogenetic affinity between Endiandra and the Australian Beilschmiedia. We acknowledge that the exact evolutionary relationship between Endiandra and Australian Beilschmiedia remains to be elucidated through further investigation.
Our new phylogenomic tree suggests that the four newly sequenced species of Endiandra from New Caledonia do not form a monophyletic group. Endiandra lecardii, E. poueboensis, and E. baillonii constitute a small subclade, which diverged early in Endiandra. Endiandra polyneura alone is sister to the Australian species E. xanthocarpa. The phylogenetic relationship of E. polyneura is also supported by the nrITS-based phylogenetic tree [9]. The identification of the four New Caledonian Endiandra samples we collected was verified by experts and nrITS sequence alignment. However, we are aware that the limited sample size imposes constraints on fully resolving phylogenetic relationships within the genus. Therefore, we are committed to expanding the species sampling across all Endiandra species in future research efforts. This will enable us to refine and enhance the understanding of the phylogeny, thereby providing a more comprehensive view of the evolutionary relationships within Endiandra.

4.2. Plastome Characteristics of the New Caledonian Species of Endiandra

The newly obtained plastomes in our study of Endiandra are similar to those previously reported in the Beilschmiedia group in terms of size, structure, and other aspects [35]. Li et al. [35] analyzed the genome of the species of Endiandra from Australia and compared it with other members of the Beilschmiedia group. They found no significant differences between Endiandra and Beilschmiedia in the number or type of simple sequence repeats (SSRs). In this study, however, we found noticeable differences in the SSRs between Beilschmiedia and the New Caledonian Endiandra. In addition, we also identified differences between the two genera in the position of the SSC/IRb boundary regions and the IR region. The New Caledonian species displayed significant expansion, indicating that the species of Endiandra from New Caledonia have evolved distinct characteristics, which is probably related to the local environment [36].
Our comparative genomic analysis of the four New Caledonian Endiandra species revealed distinct characteristics in E. polyneura, including the unique presence of hexanucleotide SSRs absent in congeners, exclusive possession of three specific mononucleotide repeat types (AATTG/AATTC, AAATAT/ATATTT, and AATTAG/AATTCT), and markedly different functional repeat profiles, exhibiting the highest reverse repeats (R) and lowest complement repeats (C) among the studied species. These structural divergences in repeat elements may explain the phylogenetic distinctness of E. polyneura, which failed to cluster with its congeneric species in our analysis.
The plastomes of Beilschmiedia and Endiandra exhibited overall structural similarities. This is primarily attributable to their close phylogenetic relationship [10,35,37] and the relatively slow evolutionary rate of plastomes [38,39]. Our analysis of nucleotide polymorphism suggests that the IR regions in the plastome are rather conserved, which is consistent with the findings of other plastome analyses [40,41]. The substitution rate in the IR regions is significantly lower than that in the SC region [40,42,43,44], a feature likely related to the maintenance of plastid structural stability [45]. Furthermore, we identified five hypervariable regions, namely matK-rps16, petN-psbM, petA-psbJ, ndhF, and ycf1. These hypervariable regions can serve as valuable references for taxonomic studies on species of Endiandra [46].

4.3. The Floristic Origin of Endiandra in New Caledonia

Previous studies have proposed two hypotheses regarding the biogeographic origins of New Caledonian flora. The first is the Gondwanan vicariance hypothesis, suggesting that species of Endiandra were already present in New Caledonia when it separated from Gondwana and subsequently underwent in situ survival and gradual diversification. The second is the long-distance dispersal hypothesis, arguing that the species colonized the island via oceanic currents or bird-mediated dispersal [47,48,49]. According to Song et al. [10], Endiandra originated from Australia and subsequently dispersed to New Caledonia. Our divergence time estimates indicate that the earliest divergence of the E. lecardii-E.poueboensis-E.bailonii subclade from the remaining Endiandra species was at 33.18 Ma, much later than the formation of the island. These findings lead us to favor the long-distance dispersal hypothesis for the arrival of Endiandra in New Caledonia.
Our findings also corroborated the study by Munzinger and Gemmill [9], who said that the Endiandra species of New Caledonia are the result of at least two separate dispersal events followed by diversification. The findings imply that floristic exchanges between New Caledonia and Australia occurred multiple times. Our findings provide new clues for elucidating the biogeographic history of New Caledonia and the adjacent Australia. However, since both our study and that of Song et al. [10] included only a limited number of Endiandra species (without all New Caledonian representatives being sampled), our current understanding on the origin of the genus on this island remains preliminary. Further studies will be required to reach more definitive conclusions.

5. Conclusions

We used Endiandra from New Caledonia as a case to test the vicariance and dispersal hypothesis on the floristic origin and conducted a comparative genomic and phylogenomic study of the genus and its closely related genera. Our phylogenomic study indicates that the four sampled Endiandra species native to New Caledonia were grouped into two separate subclades, with three of them forming a subclade and E. polyneura and two Australian species of Endiandra constituting a separate subclade. The divergence time estimation indicates that the earliest divergence of the New Caledonian Endiandra occurred at 33.18 Ma, which is later than the geological formation of the island, suggesting that the New Caledonian Endiandra originated from dispersal rather than vicariance. In addition, the genus Endiandra colonized New Caledonia via at least two independent dispersal events, with the neighboring Australia representing the most probable source, given the strong biogeographic connectivity between these two regions. Our study provides a new case to elucidate the floristic origins of New Caledonia. In future studies, we aim to refine the phylogenomic and biogeographic understanding of Endiandra by incorporating a broader sampling of species within this genus.

Supplementary Materials

The following supporting information can be downloaded at https://www.mdpi.com/article/10.3390/f16040705/s1. Table S1: Sequence information of the Cryptocaryeae from the NCBI and LGGDB.

Author Contributions

Conceptualization, Y.Y.; methodology, J.S. and C.S.; software, J.S. and C.S.; validation, Y.Y.; formal analysis, J.S.; investigation, J.S.; resources, Y.Y.; data curation, J.S.; writing—original draft preparation, J.S.; writing—review and editing, J.S. and Y.Y.; visualization, Y.Y.; supervision, Y.Y. and Z.Y.; project administration, Y.Y.; funding acquisition, Y.Y. All authors have read and agreed to the published version of the manuscript.

Funding

This research was funded by the National Natural Science Foundation of China (Nos. 32270217).

Data Availability Statement

The complete plastome sequence data of Endiandra baillonii, E. lecardii, E. polyneura, and E. poueboensis will be submitted to the NCBI (https://www.ncbi.nlm.nih.gov, accessed on 24 March 2025) during the revision process.

Acknowledgments

We thank David Boufford of Harvard University Herbaria for his help with the English.

Conflicts of Interest

The authors declare no conflicts of interest.

References

  1. Myers, N.; Mittermeier, R.A.; Mittermeier, C.G.; da Fonseca, G.A.B.; Kent, J. Biodiversity hotspots for conservation priorities. Nature 2000, 403, 853–858. [Google Scholar] [CrossRef] [PubMed]
  2. Heads, M. Biogeographical affinities of the New Caledonian biota: A puzzle with 24 pieces. J. Biogeogr. 2010, 37, 1179–1201. [Google Scholar] [CrossRef]
  3. Pillon, Y. Time and tempo of diversification in the flora of New Caledonia. Bot. J. Linn. Soc. 2012, 170, 288–298. [Google Scholar] [CrossRef]
  4. Pouteau, R.; Trueba, S.; Field, T.S.; Isnard, S. New Caledonia: A Pleistocene refugium for rain forest lineages of relict angiosperms. J. Biogeogr. 2015, 42, 2062–2077. [Google Scholar] [CrossRef]
  5. He, T.; Lamont, B.B.; Fogliani, B. Pre-Gondwanan-breakup origin of Beauprea (Proteaceae) explains its historical presence in New Caledonia and New Zealand. Sci. Adv. 2016, 2, 1501648. [Google Scholar] [CrossRef]
  6. Schellart, W.P.; Lister, G.S.; Toy, V.G. A Late Cretaceous and Cenozoic reconstruction of the Southwest Pacific region: Tectonics controlled by subduction and slab rollback processes. Earth Sci. Rev. 2006, 76, 191–233. [Google Scholar] [CrossRef]
  7. Rowher, J.G. Toward a phylogenetic classification of the Lauraceae: Evidence from matK sequences. Syst. Bot. 2000, 25, 60–71. [Google Scholar]
  8. Munzinger, J.; McPherson, G.; Bruy, D. Novitates neocaledonicae XV: Two new species of Endiandra from New Caledonia. Adansonia 2024, 46, 19–28. [Google Scholar] [CrossRef]
  9. Munzinger, J.; Gemmill, C.E.C. Molecular insights into apecies selimitations of Cryptocarya, Endiandra, and Beilschmiedia (Lauraceae) in New Caledonia and neighbouring islands. Phytotaxa 2025, 681, 233–264. [Google Scholar] [CrossRef]
  10. Song, Y.; Xia, S.-W.; Tan, Y.-H.; Yu, W.-B.; Yao, X.; Xing, Y.-W.; Corlett, R.T. Phylogeny and biogeography of the Cryptocaryeae (Lauraceae). Taxon 2023, 72, 1244–1261. [Google Scholar] [CrossRef]
  11. Li, J.-L.; Wang, S.; Yu, J.; Wang, L.; Zhou, S.-L. A modified CTAB protocol for plant DNA extraction. Chin Bull Bot. 2013, 48, 72–78. [Google Scholar]
  12. Kates, H.R.; Doby, J.R.; Siniscalchi, C.M.; LaFrance, R.; Soltis, D.E.; Soltis, P.S.; Guralnick, R.P.; Folk, R.A. The effects of herbarium specimen characteristics on short-read NGS sequencing success in nearly 8000 specimens: Old, degraded samples have lower DNA yields but consistent sequencing success. Front. Plant Sci. 2021, 12, 669064. [Google Scholar] [CrossRef] [PubMed]
  13. Yang, Z.; Ferguson, D.K.; Yang, Y. New insights into the plastome evolution of Lauraceae using herbariomics. BMC Plant Biol. 2023, 23, 387. [Google Scholar] [CrossRef] [PubMed]
  14. Jin, J.-J.; Yu, W.-B.; Yang, J.-B.; Song, Y.; dePamphilis, C.W.; Yi, T.-S.; Li, D.-Z. GetOrganelle: A fast and versatile toolkit for accurate de novo assembly of organelle genomes. Genome Biol. 2020, 21, 241. [Google Scholar] [CrossRef]
  15. Tillich, M.; Lehwark, P.; Pellizzer, T.; Ulbricht-Jones, E.S.; Fischer, A.; Bock, R.; Greiner, S. GeSeq- versatile and accurate annotation of organelle genomes. Nucleic Acids Res. 2017, 45, W6–W11. [Google Scholar] [CrossRef]
  16. Greiner, S.; Lehwark, P.; Bock, R. OrganellarGenomeDRAW (OGDRAW) version 1.3.1: Expanded toolkit for the graphical visualization of organellar genomes. Nucleic Acids Res. 2019, 47, W59–W64. [Google Scholar] [CrossRef]
  17. Katoh, K.; Standley, D.M. MAFFT multiple sequence alignment software version 7: Improvements in performance and usability. Mol. Biol. Evol. 2013, 30, 772–780. [Google Scholar] [CrossRef]
  18. Capella-Gutiérrez, S.; Silla-Martínez, J.M. Gabaldón T. trimAl: A tool for automated alignment trimming in large-scale phylogenetic analyses. Bioinformatics 2009, 25, 1972–1973. [Google Scholar] [CrossRef]
  19. Kalyaanamoorthy, S.; Minh, B.Q.; Wong, T.K.F.; von Haeseler, A.; Jermiin, L.S. ModelFinder: Fast model selection for accurate phylogenetic estimates. Nat. Methods 2017, 14, 587–589. [Google Scholar] [CrossRef]
  20. Nguyen, L.T.; Schmidt, H.S.; Haeseler, A.V.; Minh, B.Q. IQ-TREE: A fast and effective stochastic algorithm for estimating maximum-likelihood phylogenies. Mol. Biol. Evol. 2024, 32, 268–274. [Google Scholar] [CrossRef]
  21. Massoni, J.; Doyle, J.; Sauquet, H. Fossil calibration of Magnoliidae, an ancient lineage of angiosperms. Palaeontol. Electron. 2015, 18, 1–25. [Google Scholar] [CrossRef] [PubMed]
  22. Li, L.; Madriñán, S.; Li, J. Phylogeny and biogeography of Caryodaphnopsis (Lauraceae) inferred from low-copy nuclear gene and ITS sequences. Taxon 2016, 65, 433–443. [Google Scholar] [CrossRef]
  23. Eklund, H. Lauraceae flowers from the late cretaceous of North Carolina, U.S.A. Bot. J. Linn. Soc. 2000, 132, 397–428. [Google Scholar] [CrossRef]
  24. Li, J.-Z.; Qiu, J.; Liao, W.-B.; Jin, J.-H. Eocene fossil Alseodaphne from Hainan Island of China and its paleoclimatic implications. Sci. China Ser. D-Earth Sci. 2009, 52, 1537–1542. [Google Scholar] [CrossRef]
  25. Puttick, M.N. MCMCtreeR: Functions to prepare MCMCtree analyses and visualize posterior ages on trees. Bioinformatics 2019, 35, 5321–5322. [Google Scholar] [CrossRef]
  26. Rambaut, A.; Drummond, A.J.; Xie, D.; Baele, G.; Sucnard, M.A. Posterior summarization in Bayesian phylogenetics using Tracer 1.7. Syst. Bio. 2018, 67, 901–904. [Google Scholar] [CrossRef]
  27. Xie, J.-M.; Chen, Y.-R.; Cai, G.-J.; Cai, R.-L.; Hu, Z.; Wang, H. Tree Visualization By One Table (tvBOT): A web application for visualizing, modifying and annotating phylogenetic trees. Nucleic Acids Res. 2023, 51, W587–W592. [Google Scholar] [CrossRef]
  28. Beier, S.; Thiel, T.; Munch, T.; Scholz, U.; Mascher, M. MISA-web: A web server for microsatellite prediction. Bioinformatics 2017, 33, 2583–2585. [Google Scholar] [CrossRef]
  29. Kurtz, S.; Choudhuri, J.V.; Ohlebusch, E.; Schleiermacher, C.; Stoye, J.; Giegerich, R. REPuter: The manifold applications of repeat analysis on a genomic scale. Nucleic Acids Res. 2001, 29, 4633–4642. [Google Scholar] [CrossRef]
  30. Wickham, H. ggplot2: Elegant Graphics for Data Analysis; Springer: Berlin/Heidelberg, Germany, 2016. [Google Scholar]
  31. R Core Team. R: A Language and Environment for Statistical Computing; R Foundation for Statistical Computing: Vienna, Austria, 2020; Available online: https://www.r-project.org (accessed on 27 February 2025).
  32. Li, H.-E.; Guo, Q.-Q.; Xu, L.; Gao, H.-D.; Liu, L.; Zhou, X.-Y. CPJSdraw: Analysis and visualization of junction sites of chloroplast genomes. PeerJ 2023, 11, e14500. [Google Scholar] [CrossRef]
  33. Librado, P.; Rozas, J. DnaSP v5: A software for comprehensive analysis of DNA polymorphism data. Bioinformatics 2009, 25, 1451–1452. [Google Scholar] [CrossRef] [PubMed]
  34. Wall, L.; Christiansen, T.; Orwant, J. Programming Perl, 3rd ed.; O’Reilly Media, Inc.: Sebastopol, CA, USA, 2000. [Google Scholar]
  35. Li, H.-W.; Liu, B.; Davis, C.C.; Yang, Y. Plastome phylogenomics, systematics, and divergence time estimation of the Beilschmiedia group (Lauraceae). Mol. Phylogenet. Evol. 2020, 151, 106901. [Google Scholar] [CrossRef] [PubMed]
  36. Proctor, J. Vegetation and soil and plant chemistry on ultramafic rocks in the tropical Far East. Perspect. Plant Ecol. Evol. Syst. 2003, 6, 105–124. [Google Scholar] [CrossRef]
  37. Song, Y.; Yu, W.B.; Tan, Y.H.; Jin, J.J.; Wang, B.; Yang, J.B.; Corlett, R.T. Plastid phylogenomics improve phylogenetic resolution in the Lauraceae. J. Syst. Evol. 2020, 58, 423–439. [Google Scholar] [CrossRef]
  38. Drouin, G.; Daoud, H.; Xia, J. Relative rates of synonymous substitutions in the mitochondrial, chloroplast and nuclear genomes of seed plants. Mol. Phylogenet. Evol. 2008, 49, 827–831. [Google Scholar] [CrossRef]
  39. Dobrogojski, J.; Adamiec, M.; Luciński, R. The chloroplast genome: A review. Acta Physiol. Plant. 2020, 42, 98. [Google Scholar] [CrossRef]
  40. Yang, J.-P.; Zhang, F.-W.; Ge, Y.-J.; Yu, W.-H.; Xue, Q.-Q.; Wang, M.-T.; Wang, H.-M.; Xue, Q.-Y.; Liu, W.; Niu, Z.-T.; et al. Effects of geographic isolation on the Bulbophyllum chloroplast genomes. BMC Plant Biol. 2022, 22, 201. [Google Scholar] [CrossRef]
  41. Hu, Q.-D.; Qian, R.-J.; Zhang, Y.-J.; Ma, X.-H.; Ye, Y.-J.; Zhang, X.-L.; Lin, L.; Liu, H.-J.; Zheng, J. Complete chloroplast genome molecular structure, comparative and phylogenetic analyses of Sphaeropteris lepifera of Cyatheaceae family: A tree fern from China. Sci Rep. 2023, 13, 1356. [Google Scholar] [CrossRef]
  42. Wolfe, K.H.; Li, W.-H.; Sharp, P.M. Rates of nucleotide substitution vary greatly among plant mitochondrial, chloroplast, and nuclear DNAs. Proc. Natl. Acad. Sci. USA 1987, 84, 9054–9058. [Google Scholar] [CrossRef]
  43. Smith, D.R. Mutation rates in plastid genomes: They are lower than you might think. Genome Biol. Evol. 2015, 7, 1227–1234. [Google Scholar] [CrossRef]
  44. Wu, C.S.; Chaw, S.M. Evolutionary stasis in cycad plastomes and the first case of plastome gc-biased gene conversion. Genome Biol. Evol. 2015, 7, 2000–2009. [Google Scholar] [CrossRef] [PubMed]
  45. Marechal, A.; Brisson, N. Recombination and the maintenance of plant organelle genome stability. New Phytol. 2010, 186, 299–317. [Google Scholar] [CrossRef] [PubMed]
  46. Zhu, W.; Zhang, H.-R.; Li, Q.-S.; Cao, Z.-Y.; Song, Y.; Xin, P.-Y. Complete plastid genome sequences of three tropical African Beilschmiediineae trees (Lauraceae: Crytocaryeae). Forests 2024, 15, 832. [Google Scholar] [CrossRef]
  47. Carpenter, R.J.; Read, J.; Jaffré, T. Reproductive traits of tropical rain-forest trees in New Caledonia. J. Trop. Ecol. 2003, 19, 351–365. [Google Scholar] [CrossRef]
  48. Grandcolas, P.; Murienne, J.; Robillard, T.; Desutter-Grandcolas, L.; Jourdan, H.; Guilbert, E.; Deharveng, L. New Caledonia: A very old Darwinian island? Phil. Trans. R. Soc. B. 2008, 363, 3309–3317. [Google Scholar] [CrossRef]
  49. Nattier, R.; Pellens, R.; Robillard, T.; Jourdan, H.; Legendre, F.; Caesar, M.; Nel, A.; Grandcolas, P. Updating the phylogenetic dating of New Caledonian biodiversity with a meta-analysis of the available evidence. Sci. Rep. 2017, 7, 3705. [Google Scholar] [CrossRef]
Figure 1. Distribution of sampled Endiandra species. Orange indicates New Caledonia (range of four newly obtained Endiandra species).
Forests 16 00705 g001
Figure 2. Maximum likelihood (ML) tree of the Cryptocaryeae based on complete plastome sequences. Taxa in bold with preceding asterisks (*) represent the four newly sequenced New Caledonian Endiandra species in our research. Numbers at nodes are bootstrap support values.
Forests 16 00705 g002
Figure 3. Time tree. The numbers at the nodes represent the mean divergence times, with blue bars indicating 95% HPD. Purple circles mark five fossil calibration points. Red circles highlight the divergence node of Endiandra from New Caledonia.
Forests 16 00705 g003
Figure 4. Circular representation of the complete plastome of Endiandra. Genes inside the circle are transcribed clockwise, and those outside the circle are transcribed counterclockwise. Genes with different functions are color-coded. The darker gray color in the inner circle shows the GC content, whereas the lighter gray color shows the AT content. LSC = large single copy; SSC = small single copy; IRA and IRB = inverted repeat.
Forests 16 00705 g004
Figure 5. Number of simple sequence repeats (SSRs). (A) Variation in six types of SSRs across the seven species compared. (B) Variation in different repeat unit types across the seven species compared.
Forests 16 00705 g005
Figure 6. Characteristics of repetitive sequences. (A) Variation in the four types of repetitive sequences across the seven species compared. P = palindromic repeats; F = forward repeats; R = reverse repeats; C = complement repeats. (B) Variation in repetitive sequences of different lengths across the seven species compared.
Forests 16 00705 g006
Figure 7. A comparison of the junctions between the IRs and LSC and SSC regions among the plastomes of the seven species compared.
Forests 16 00705 g007
Figure 8. Variation in nucleotide polymorphism (Pi).
Forests 16 00705 g008
Figure 9. Heatmap of codon distribution for all shared protein-coding genes in the plastomes of the seven species. Lighter colors indicate higher RSCU values.
Forests 16 00705 g009
Table 1. Information on voucher specimens.
SpeciesCollectionLocalityHerbarium
Endiandra bailloniiGuillaum A & Baumann-Bodenheim MG. 6659New CaledoniaA
Endiandra lecardiiLowry II & Prescott P. 6807New Caledonia (Province du Nord)MO
Endiandra polyneuraGuillaum A & Baumann-Bodenheim MG. 7213New CaledoniaA
Endiandra poueboensisMcPherson G. 18988New Caledonia (Province du Nord)MO
Table 2. Summary of a comparison of sequences of species of Beilschmiedia and Endiandra.
E. bailloniiE. lecardiiE. polyneuraE. poueboensisB. immersinervisB. linocieroidesB. obtusifolia
Size (bp)158,313158,261158,339158,259157,497157,311157,254
GC (%)39.039.039.039.039.239.239.3
Lsc size in bp89,09489,06289,04489,06088,56188,50688,313
Ssc size in bp18,21318,20318,21318,19918,02617,96417,998
IRs size in bp25,49825,49825,51825,50025,45925,42425,475
Number of coding sequences86868686848484
Number of rRNA8888888
Number of tRNA37373737373737
Disclaimer/Publisher’s Note: The statements, opinions and data contained in all publications are solely those of the individual author(s) and contributor(s) and not of MDPI and/or the editor(s). MDPI and/or the editor(s) disclaim responsibility for any injury to people or property resulting from any ideas, methods, instructions or products referred to in the content.

