Article

Determining a Safe Distance Zone for Firefighters Using a High-Resolution Global Canopy Height Dataset—A Case in Türkiye

Faculty of Forestry, İzmir Kâtip Çelebi University, 35620 İzmir, Türkiye
Forests 2025, 16(4), 709; https://doi.org/10.3390/f16040709
Submission received: 11 March 2025 / Revised: 9 April 2025 / Accepted: 10 April 2025 / Published: 21 April 2025

Abstract

:
Safety zones protect firefighters from bodily injury and death caused by exposure to dangerous heat levels. These zones are defined by maintaining a safe distance from combustible fuels, a safe separation distance (SSD) derived from flame height. This study aimed to determine safety zones, integrating an existing automated identification-of-safety-zone model with vegetation height derived from a freely available high-resolution global canopy height dataset for Manavgat Forest Management Directorate (FMD) in Türkiye. Flame height, terrain slope, size of a safety zone, and distance to the closest road were also used as input in this model. The results indicated that vegetation height from high-resolution global canopy height offered promising results for determining potential safety zones (SZs) associated with SSD. Integrating the global canopy height dataset into the existing model could assist in determining the safety zone in the absence of lidar. Thus, this spatial model would provide a framework for decision-makers to develop fire prevention and suppression strategies for higher fire risk areas, especially before and during a fire.

1. Introduction

Fires take place in a dynamic environment, where a wide range of physical processes affect fire behavior at multiple spatial and time scales [1,2]. Firefighters work near flames to remove fuels and construct containment lines that reduce potential damage to lives and properties and conserve natural assets at risk during their wide variety of fire management activities [1,2,3,4]. Their working environments, including rapid changes in weather, topography, and vegetation composition, cause unexpected fire behavior and put forest firefighters’ lives at risk of injury or death due to exposure to intense heat produced by fuel combustion [2,3,4].
Given the known dangers of wildland fires, many firefighter deaths are reported each year in fire-prone regions around the world. The causes of death among wildland firefighters are diverse, including burnover/entrapments, aviation and vehicle use, heart attacks, falling trees/rolling rocks, and smoke inhalation, among others [1,5]. According to historical records, firefighter deaths in Australia between 1901 and 2017 totaled 99, accounting for 11% of the total deaths caused by wildfire, approximately averaging one death per year [2,5]. The number of wildland fire fatalities in Southern European countries, including Greece, Portugal, Spain, and Sardinia (Italy), was analyzed by Molani-Terren et al. [6] for different periods. For Sardinia (Italy), there were a total of 865 deaths between 1945 and 2016, and 280 of them were firefighters, representing 32%. Over similar periods, Greece (1977–2016) and Portugal (1963–2016) have similar figures; around 20% of total deaths were firefighters, an approximate average of 1 death per year [2,5,7,8]. Between 1980 and 2010 in Spain, the deaths of firefighters and volunteer firefighters accounted for 48% of total wildland fire-related fatalities, equivalent to 4 deaths per year [9]. In Canada, 165 wildland fire suppression-related fatalities were reported from 1941 to 2010, averaging more than 2 deaths per year [10]. In the USA, over the 109-year period between 1910 and 2018, there were a total of 1154 firefighter fatalities, averaging 10 deaths per year. Regardless of the country, fire trapping was reported as the main cause of the fatalities, including civilians and firefighters [5].
Along with the increase in the frequency, intensity, and size of wildland fires worldwide, firefighter safety and lives will be at greater risk due to working in a complex fire environment. To avoid the risk of injury or death from the fire, especially burnover and entrapment, several safety protocols and instructions have been established [11,12,13]. The well-known one is establishing a safety zone, part of an interconnected and independent system called lookouts, communications, escape routes, and safety zones (LCES) [14,15,16]. Safety zones (SZs) are critical to preventing injuries and fatalities by providing a buffer between firefighters and the fire. Thus, the safety zones should be sufficiently large, open areas with no or little flammable material that enables firefighters to escape the harmful impact of fire [2,3]. These areas could be naturally sparse vegetation or unvegetated areas, as well as areas where fuel has been cleared, either mechanically or through controlled burns [1,11,16,17,18]. Also, the size of the safety zones (SZs) needs to consider the number of firefighters and equipment involved in fire suppression. These zones provide a safe separation distance (SSD) between fuels and firefighters, keeping the impact of radiative and convective heating due to surrounding or nearby flames at safe, non-harmful levels [18].
Many models have been developed for determining the SSD and they are generally based on radiant heat modeling, considering flame height and flame length [12]. Also, the review by Butler [11] provides more detail about the SZs and SSD model developed in the past and future needs for defining wildland firefighter safety zones. Although radiative models are widely adapted, it relies on simplified assumptions, including flat terrain, stable flame temperature and emissivity, and lack of connective heat transfer. According to this model, the SSD between firefighters and flames is calculated as four times flame height and the potential flame height has been estimated as two times vegetation height in a crown fire [11,12,13,16]. On the other hand, other SSD models developed under different scenarios with complex environment demonstrated the importance of connective energy flux, affected by fuel, different terrain, and weather conditions [13,19,20,21]. It means that SZs should have larger SSDs in steep slope or when downwind. Thus, Butler [13] suggested adjusting the SSD calculation for convective heat flux by incorporating a ‘slope–wind factor’ (Δ).
SSD = 8 × Hv × Δ,
where Hv refers to vegetation height. If the fire occurs in flat terrain and low wind speed, SSD is eight times vegetation height.
Although SZs are easy to estimate using Equation (1) for the slope–wind factor of 1, implementation of the SSD by firefighters during wildfire requires the ability to accurate calculations of vegetation height, which introduces subjectivity and potential interpretive errors [22,23,24]. Hence, automatic identification of safety zones across large areas prior to the outbreak of wildfires helps and enhances the safety of firefighters during fire suppression. With the development of advanced technology, detailed information on the spatial distribution of vegetation, topography, and climate data, provided by high-resolution remote sensing (RS) in conjunction with geographical information science (GIS), helps to determine and map all potential safety zones. For instance, Dennison et al. [3] conducted a study to develop a model for automatically determining safety zones in southern Sierra Nevada, USA. This study employed decision rules using lidar-measured vegetation height, flame height, and terrain slope, obtained from lidar and orthoimage data. The results indicate that the developed model offers a flexible framework for determining the safety zone, although it does not account for the slope–wind factor (Δ). Also, a study by Campbell et al. [18] introduced the Safe Separation Distance Score (SSDS), calculated from lidar-derived terrain and surface models, to evaluate safety zones. The SSDS represents the relative suitability of all potential safety zones according to their size, geometry, and surrounding vegetation height. Moreover, Campbell et al. [1] developed an online mapping tool, Safe Separation Distance Evaluator (SSDE), using Google Earth Engine (GEE) to assess potential safety zone suitability anywhere in the USA. For this tool, different sources of vegetation height data (airborne lidar, LANDFIRE Existing Vegetation Height (30 m), and GEDI/Landsat-derived vegetation height dataset (30 m)), one of the factors affecting the size of SZs, were tested for rapidly mapping potential SZs over the entire US. Although the airborne lidar represented the most accurate SZs compared to others and the results of the tool were promising, the results required validation from the ground before use.
While the need to determine and utilize safety or survival zones by wildland firefighters may differ from one country to another, these zones are recognized as vital elements of operational safety systems. However, the study, which is related to delineating SZs based on the SSD obtained from RS-based vegetation height data before the wildland fire outbreak, is limited (i.e., to the USA) due to lack of technology or policy (availability of hardware, software, lidar data, or policy). In this study, the objective is to determine SZs using well-known decision rules conducted by Dennison et al. [3] based on freely available high-resolution global canopy height dataset in the Mediterranean region of Türkiye. In addition to the high-resolution global canopy height dataset, which was used to determine flame height and openness, terrain slope and road network data were employed to determine size of the SZs and the distance to the nearest road. Thus, this automated model can help determine if the designated safety zones are suitable for protecting firefighters. It can also assist firefighters in their decision-making, thereby reducing the risk of injuries and fatalities.

2. Materials and Methods

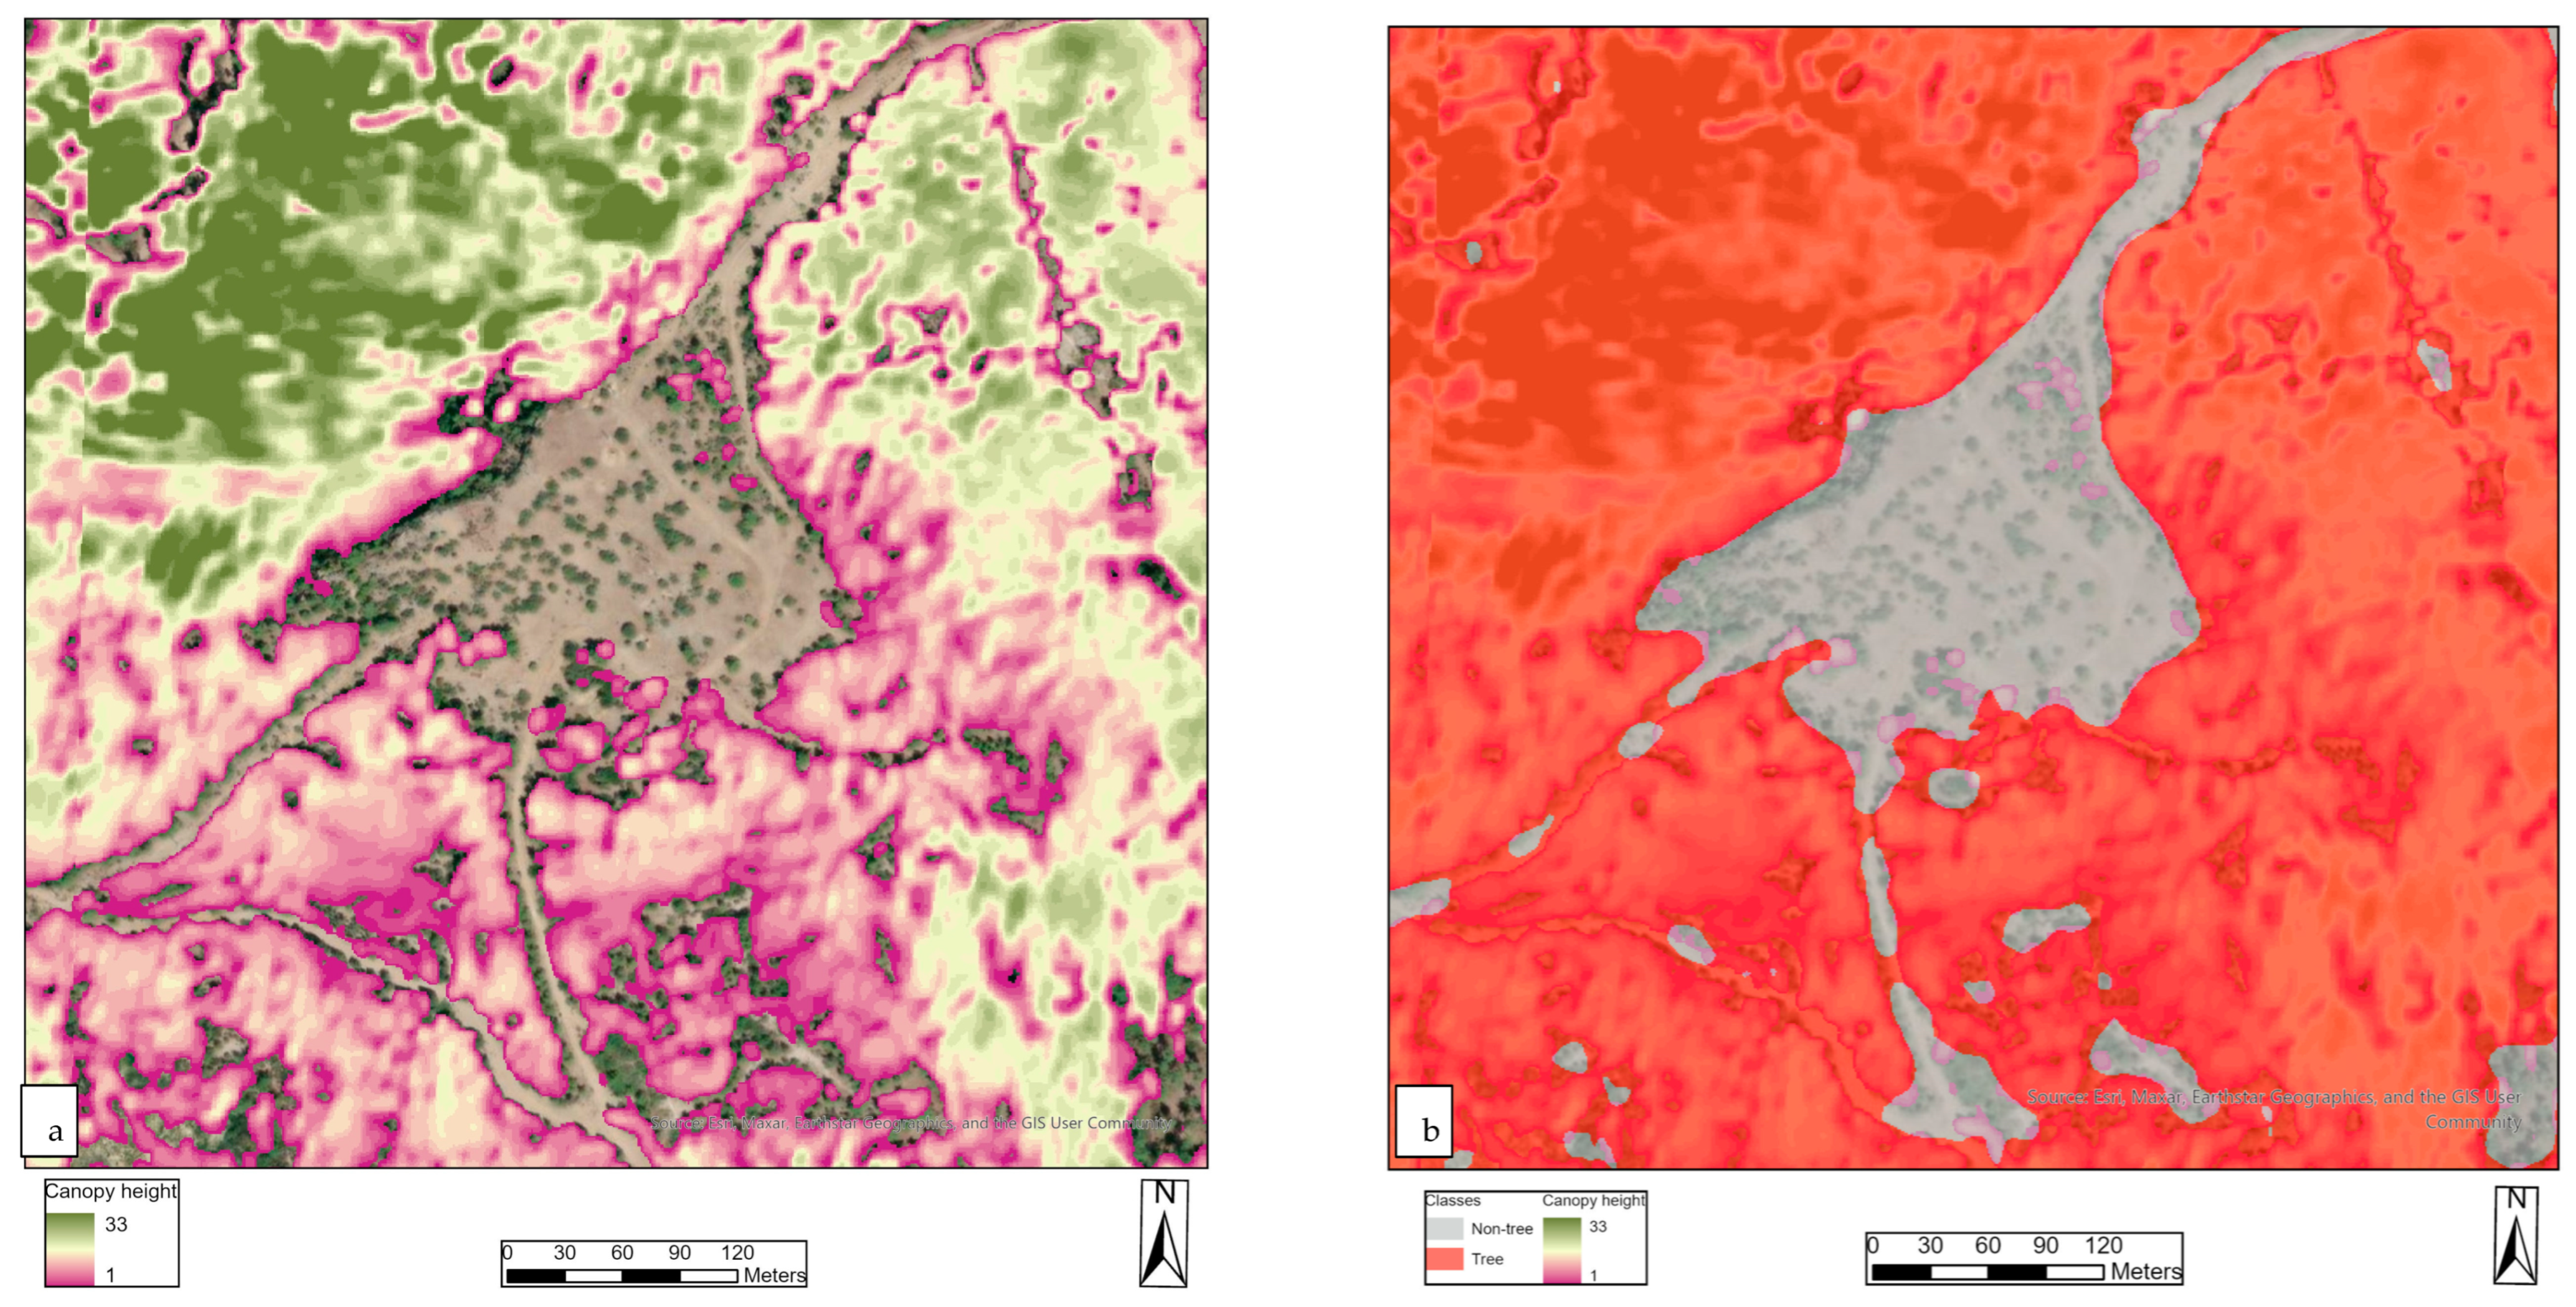
2.1. Study Area and Data

Manavgat Forest Management Directorate (FMD) within the Antalya Regional Directorate of (RDF) Forestry was selected as a study area (Figure 1) due to its location in the Mediterranean region of Türkiye, which is highly susceptible to forest fires. Historically, the largest fires in Türkiye have generally occurred in this region [25]. As in many Mediterranean countries, villages are often scattered throughout the forest. However, the population has recently migrated from rural areas to cities, leading to a dense accumulation of flammable materials in the forest [26]. Also, millions of tourists (local and foreign) visit the region annually, which makes tourism the primary source of income for the region. Meanwhile, this human mobility increases the probability of forest fire [27]. Thus, Antalya RFD had the largest burned forest area, with one-third (90,703 ha) of the total burned area in Türkiye between 2004 and 2022 [28]. In particular, a significant portion of the burned area resulted from the fires within the boundary of Manavgat MDF in 2021 (called Manavgat Forest Fires), which damaged 139,503 hectares of forest. The Manavgat Forest fire was the largest in the history of the Republic of Türkiye and caused significant damage to many settlements or placed them at considerable risk. Moreover, it caused the death of civilians and firefighters. According to GDF total fatality of firefighters was 141 between 1968 and 2023, which is an average of 2.5 deaths per year in Türkiye. Similar to other countries, fire trapping was the main cause of the fatalities.
Manavgat FMD encompasses 90,208.90 ha, with 51,670.8 ha (57%) covered by forest. Of the forested area, only 26% is degraded forest, which has less than 10% of canopy cover (13,530.3 ha). The study area has a wide range of elevations, from 0% to 98%, with an average elevation of 30%. The vegetation in the study area is composed of conifers. The dominant tree species are Turkish pine (Pinus brutia T.), which is pure stand, or mixed mainly with Black pine (Pinus nigra), other conifer species (i.e., Juniper (Juniperus spp.), Cedar (Cedrus libani), Taurus fir (Abies cilicica), and deciduous tree (Oak (Quercus spp.)). Also, the typical woody shrubland of the Mediterranean climate zone, maquis, is widely distributed within the study area. Coniferous trees with low moisture and high resin content and maquis have rapid ignition potential, increasing forest fire risk [29].
For this study, a freely available high-resolution global canopy height map dataset was employed to calculate the SSD for potential safety zones within the Manavgat FMD. The high-resolution global canopy height map dataset was generated by Tolan et al. [30] through a collaboration between the World Resources Institute (WRI) and Meta, with a 1 m resolution. The study analyzed satellite images from 2009 to 2020, focusing on data from 2018 to 2020, accounting for 80% of the data. The AI model named DiNOv2 was used for the study in conjunction with various remote sensing data sources (i.e., aerial lidar and RGB imagery from satellites and drones). The developed AI model predicted canopy height with a mean absolute error of 2.8 m. Also, detailed information related to the very-high-resolution global canopy height map dataset (i.e., training data, model, data sources, and approaches) is provided in the study by Tolan et al. [30]. In addition to the vegetation height map dataset, a Digital Elevation Model (DEM) was generated using the topographic map with a 10 m contour line acquired from the Antalya RDF. Then, a slope map was generated from the newly generated DEM, with 10 m resolution. Furthermore, we obtained the forest management plan map and topographic map for the Manavgat FMD from Antalya RDF. We utilized land use/land cover maps (forest and non-forest classes) generated from the Manavgat FMD Forest management plan maps to identify SZs within the forested area. A road network dataset derived from 1:25,000 scale topographic maps was used to determine the distance to the safety zone from the closest road. Thus, this spatial analysis facilitates more effective planning of evacuation routes and emergency access during a fire.

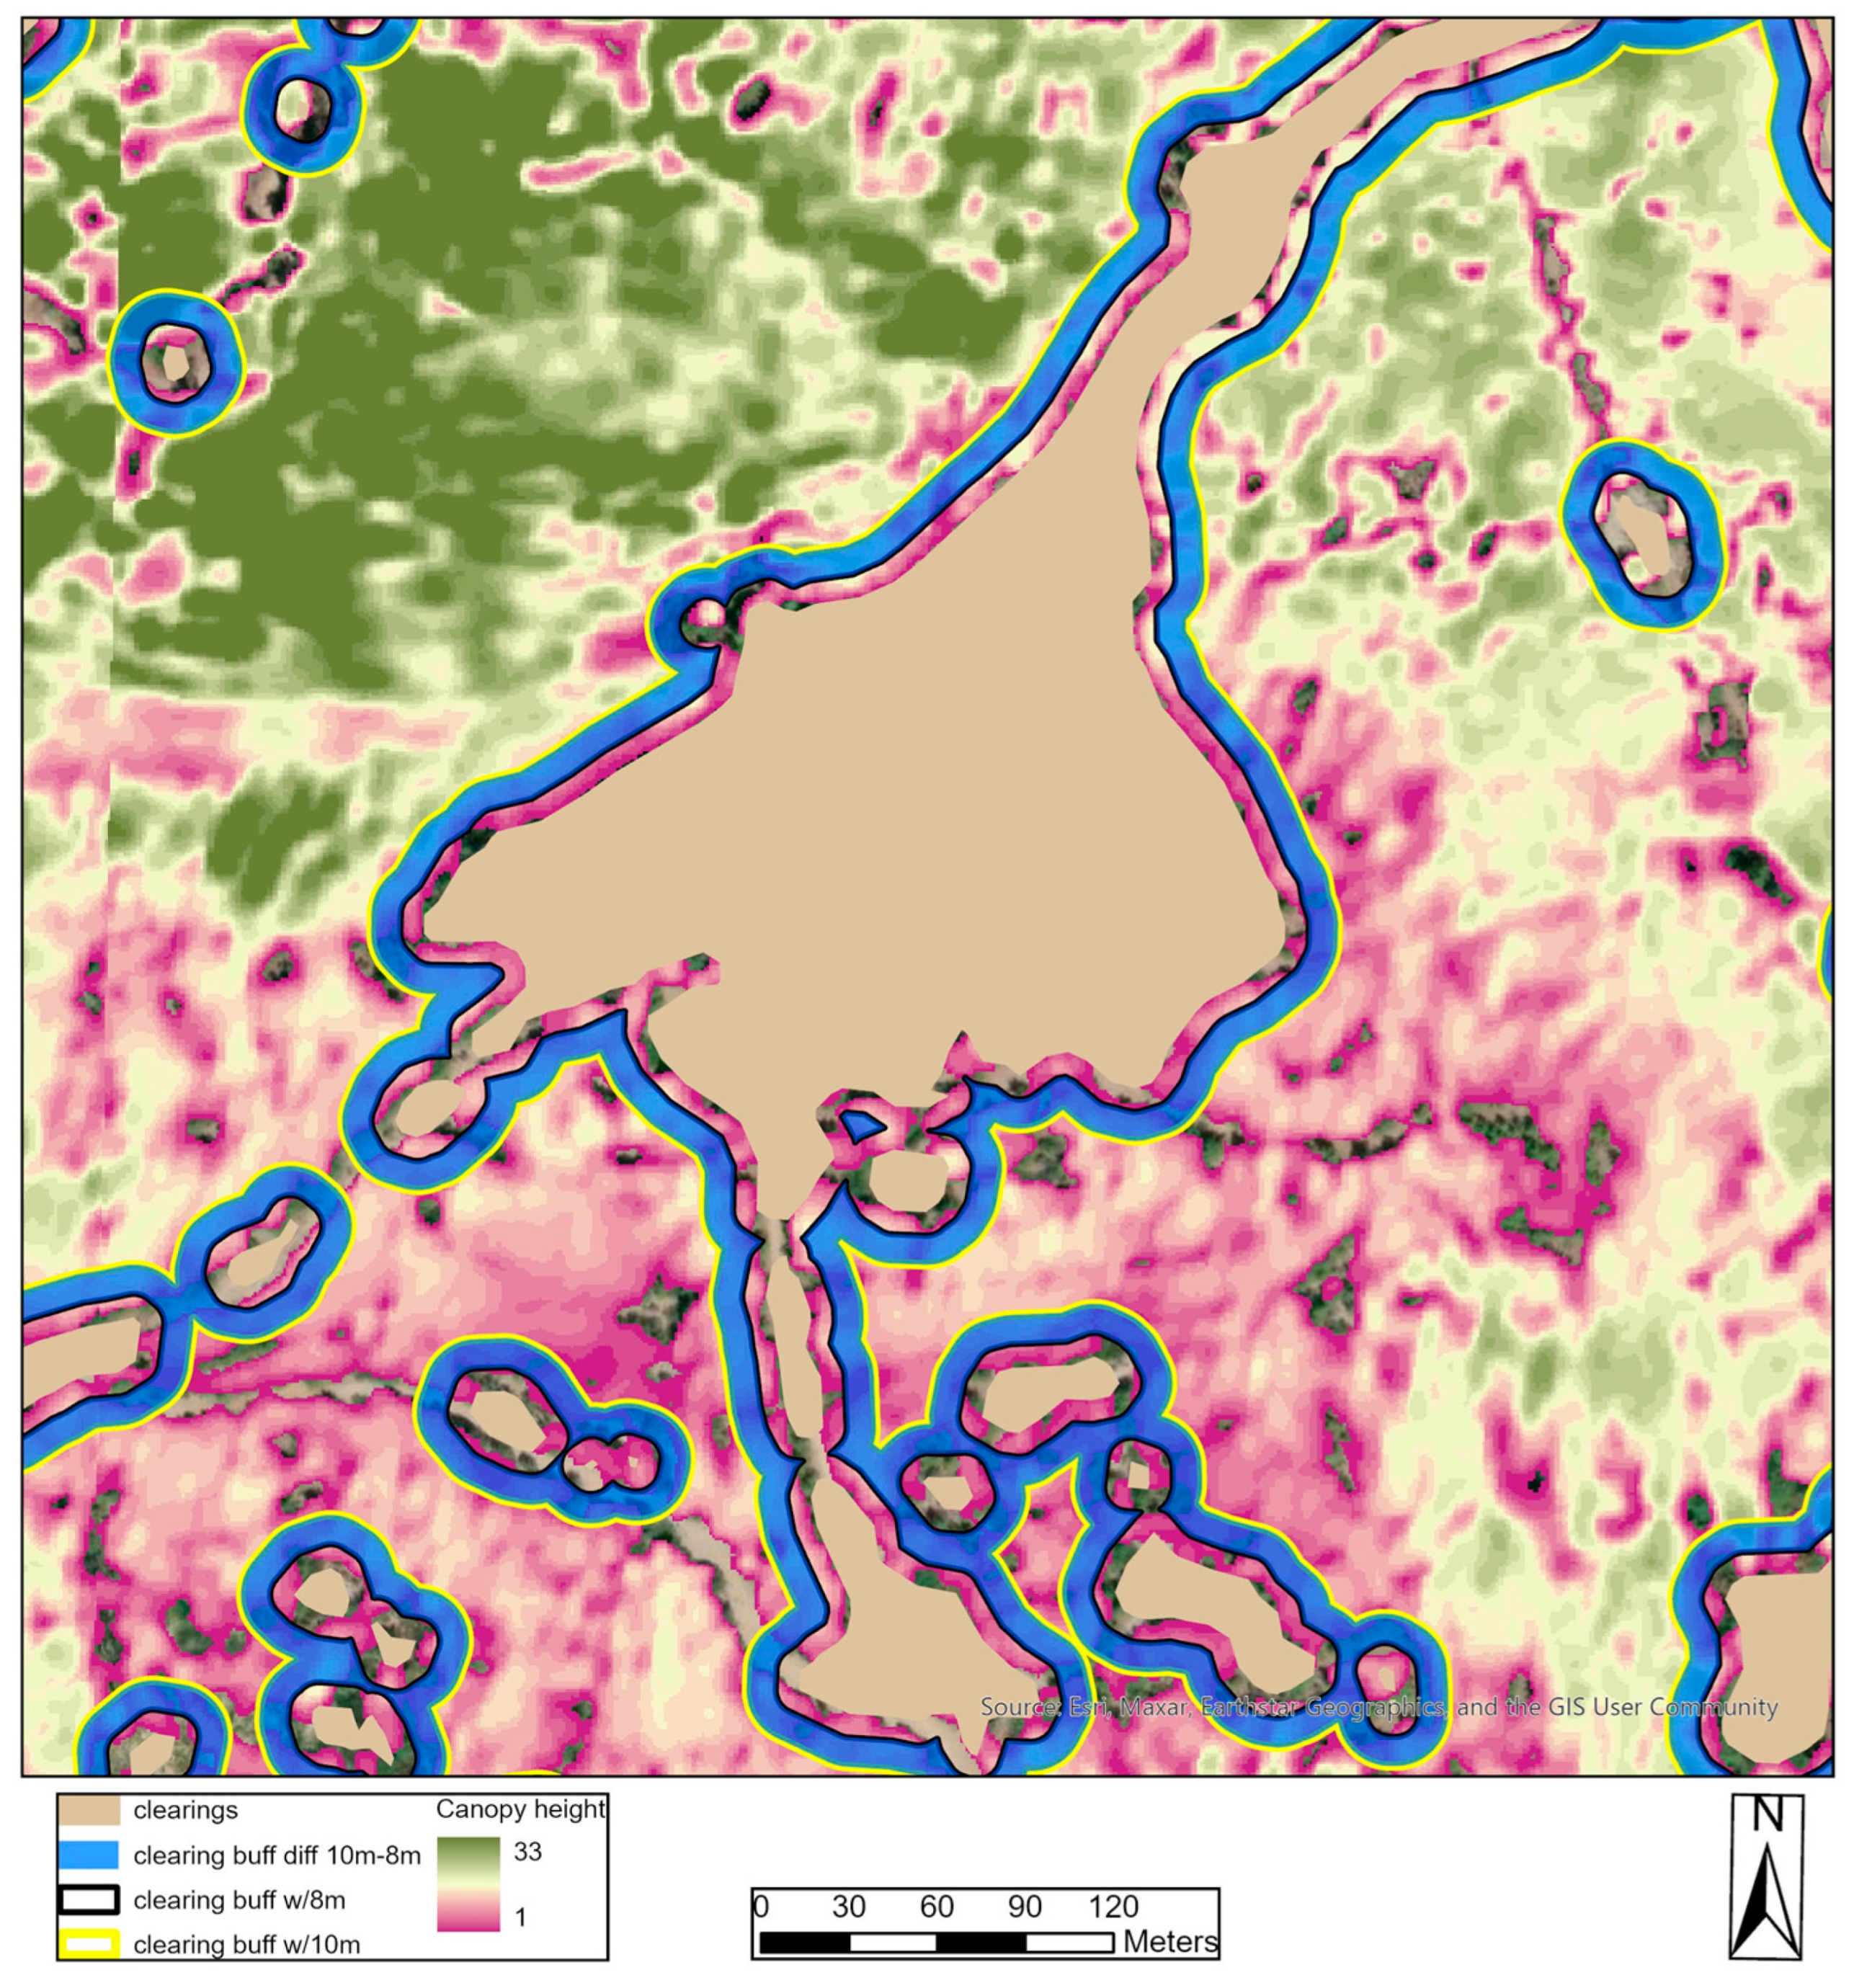
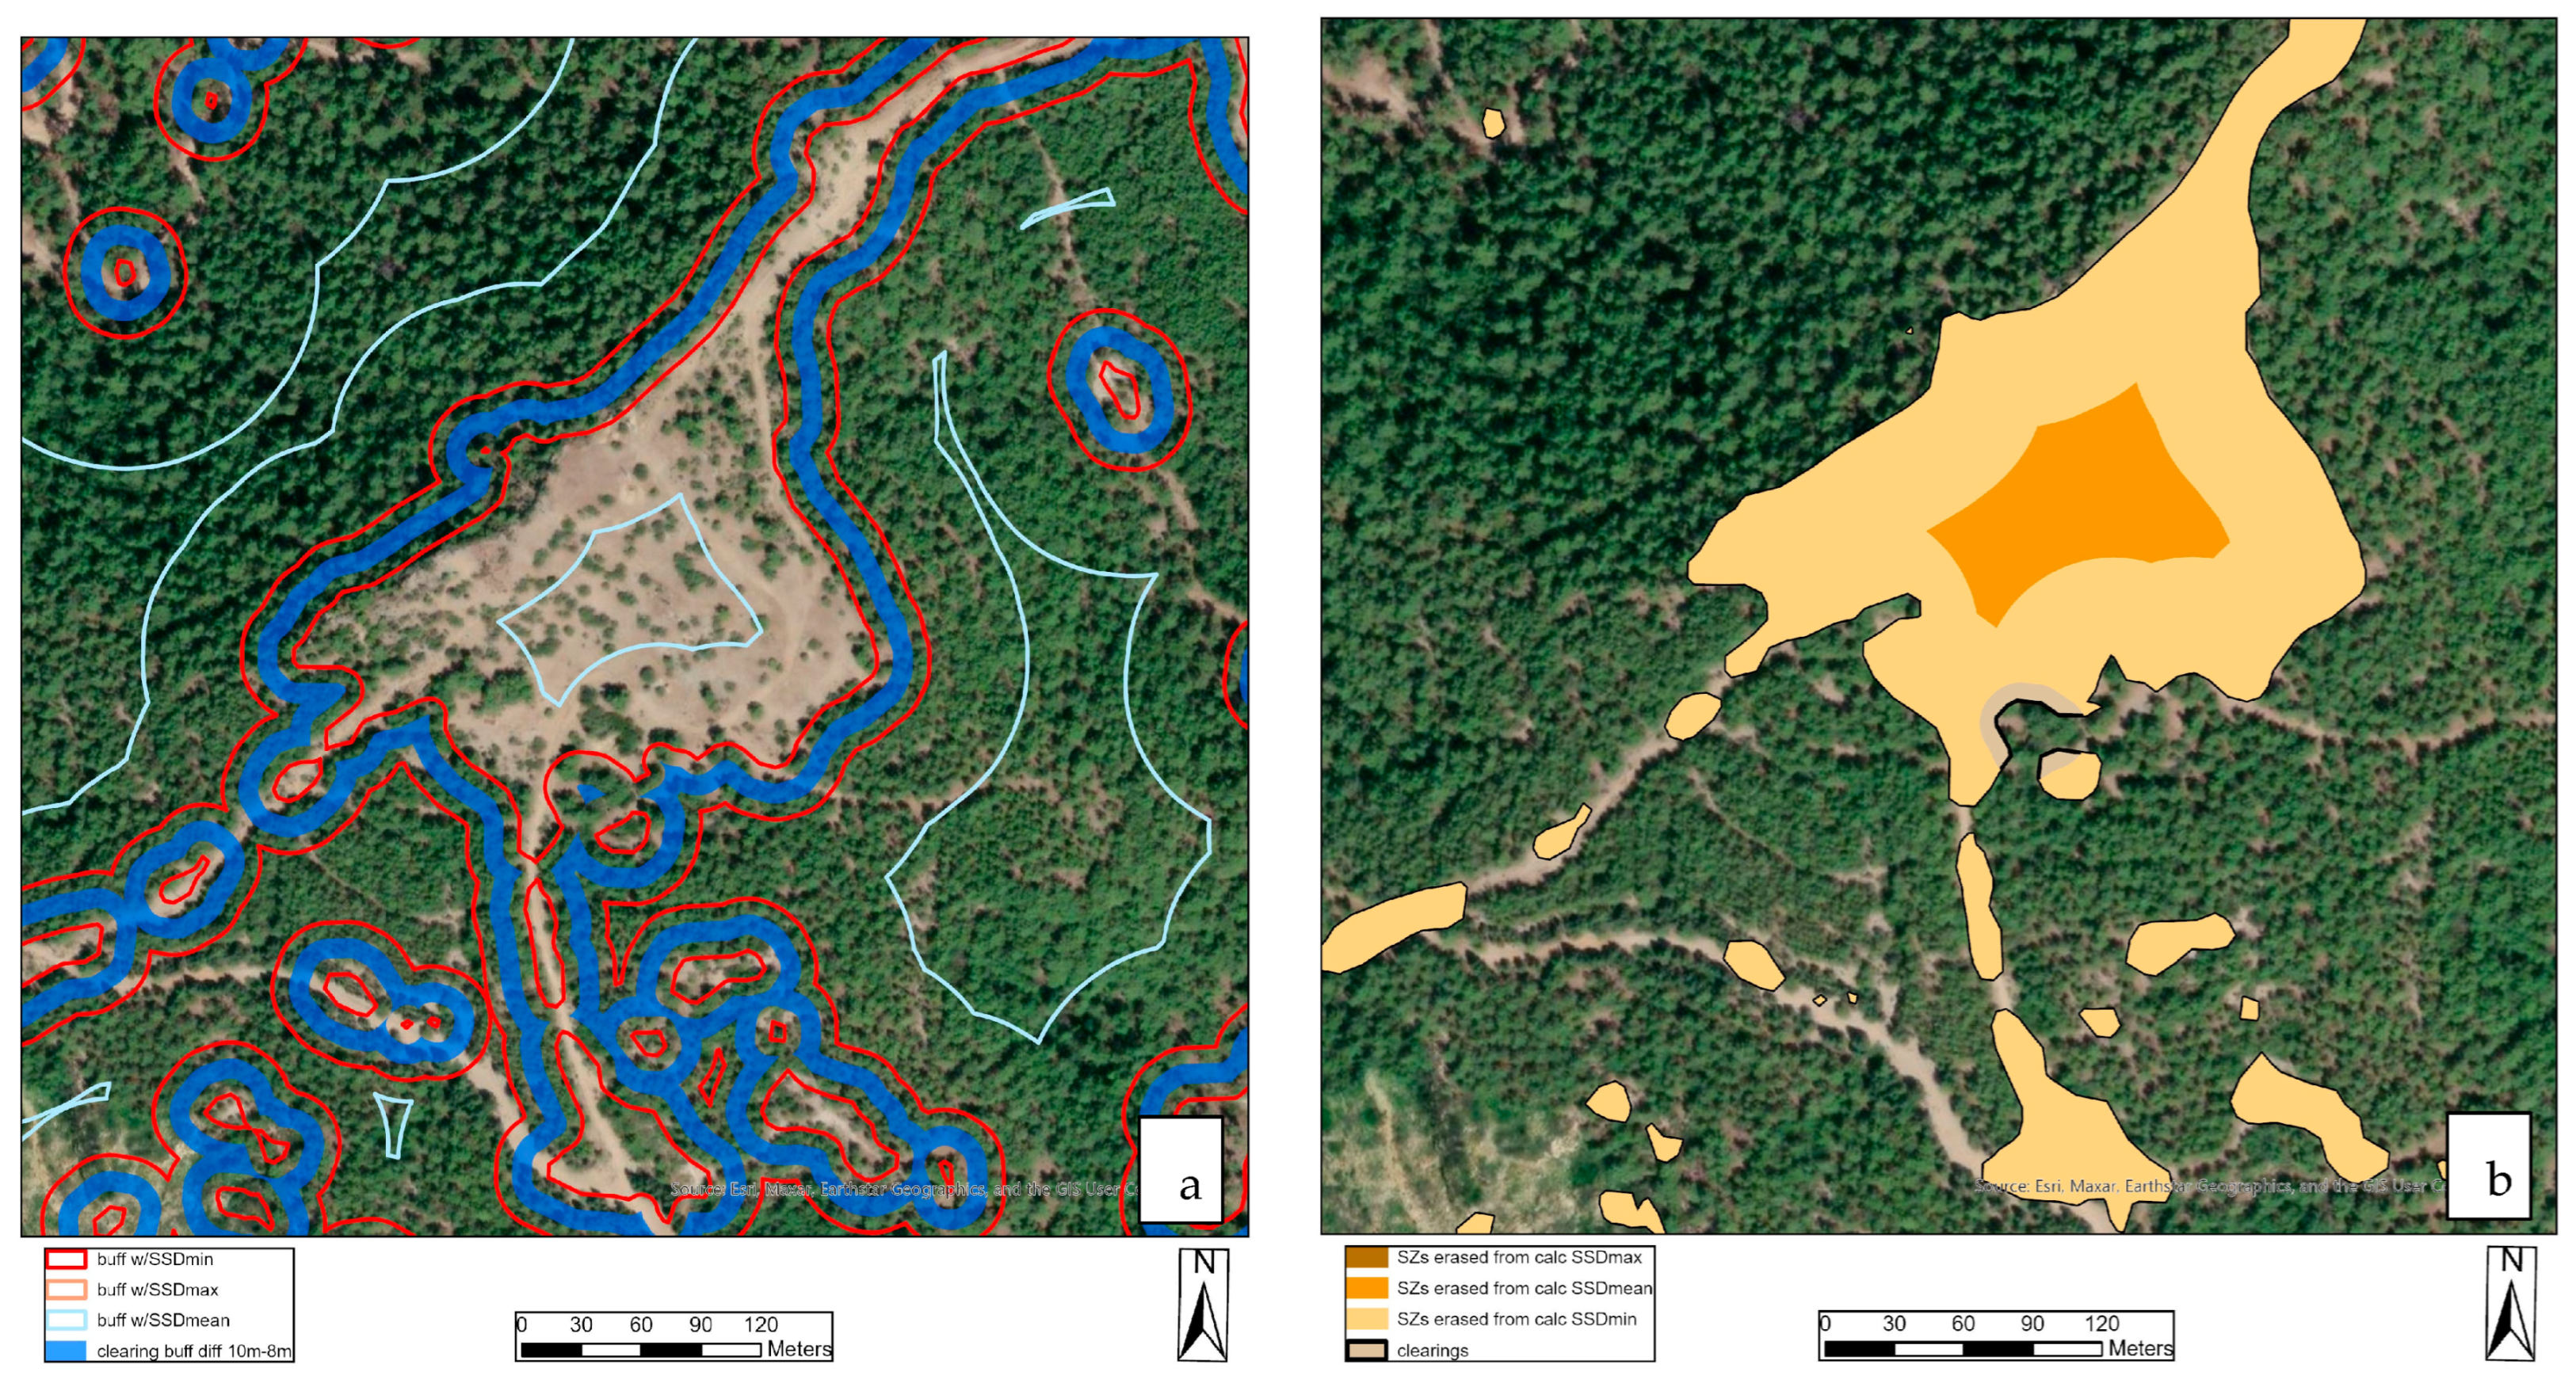
2.2. Safety Zone Models
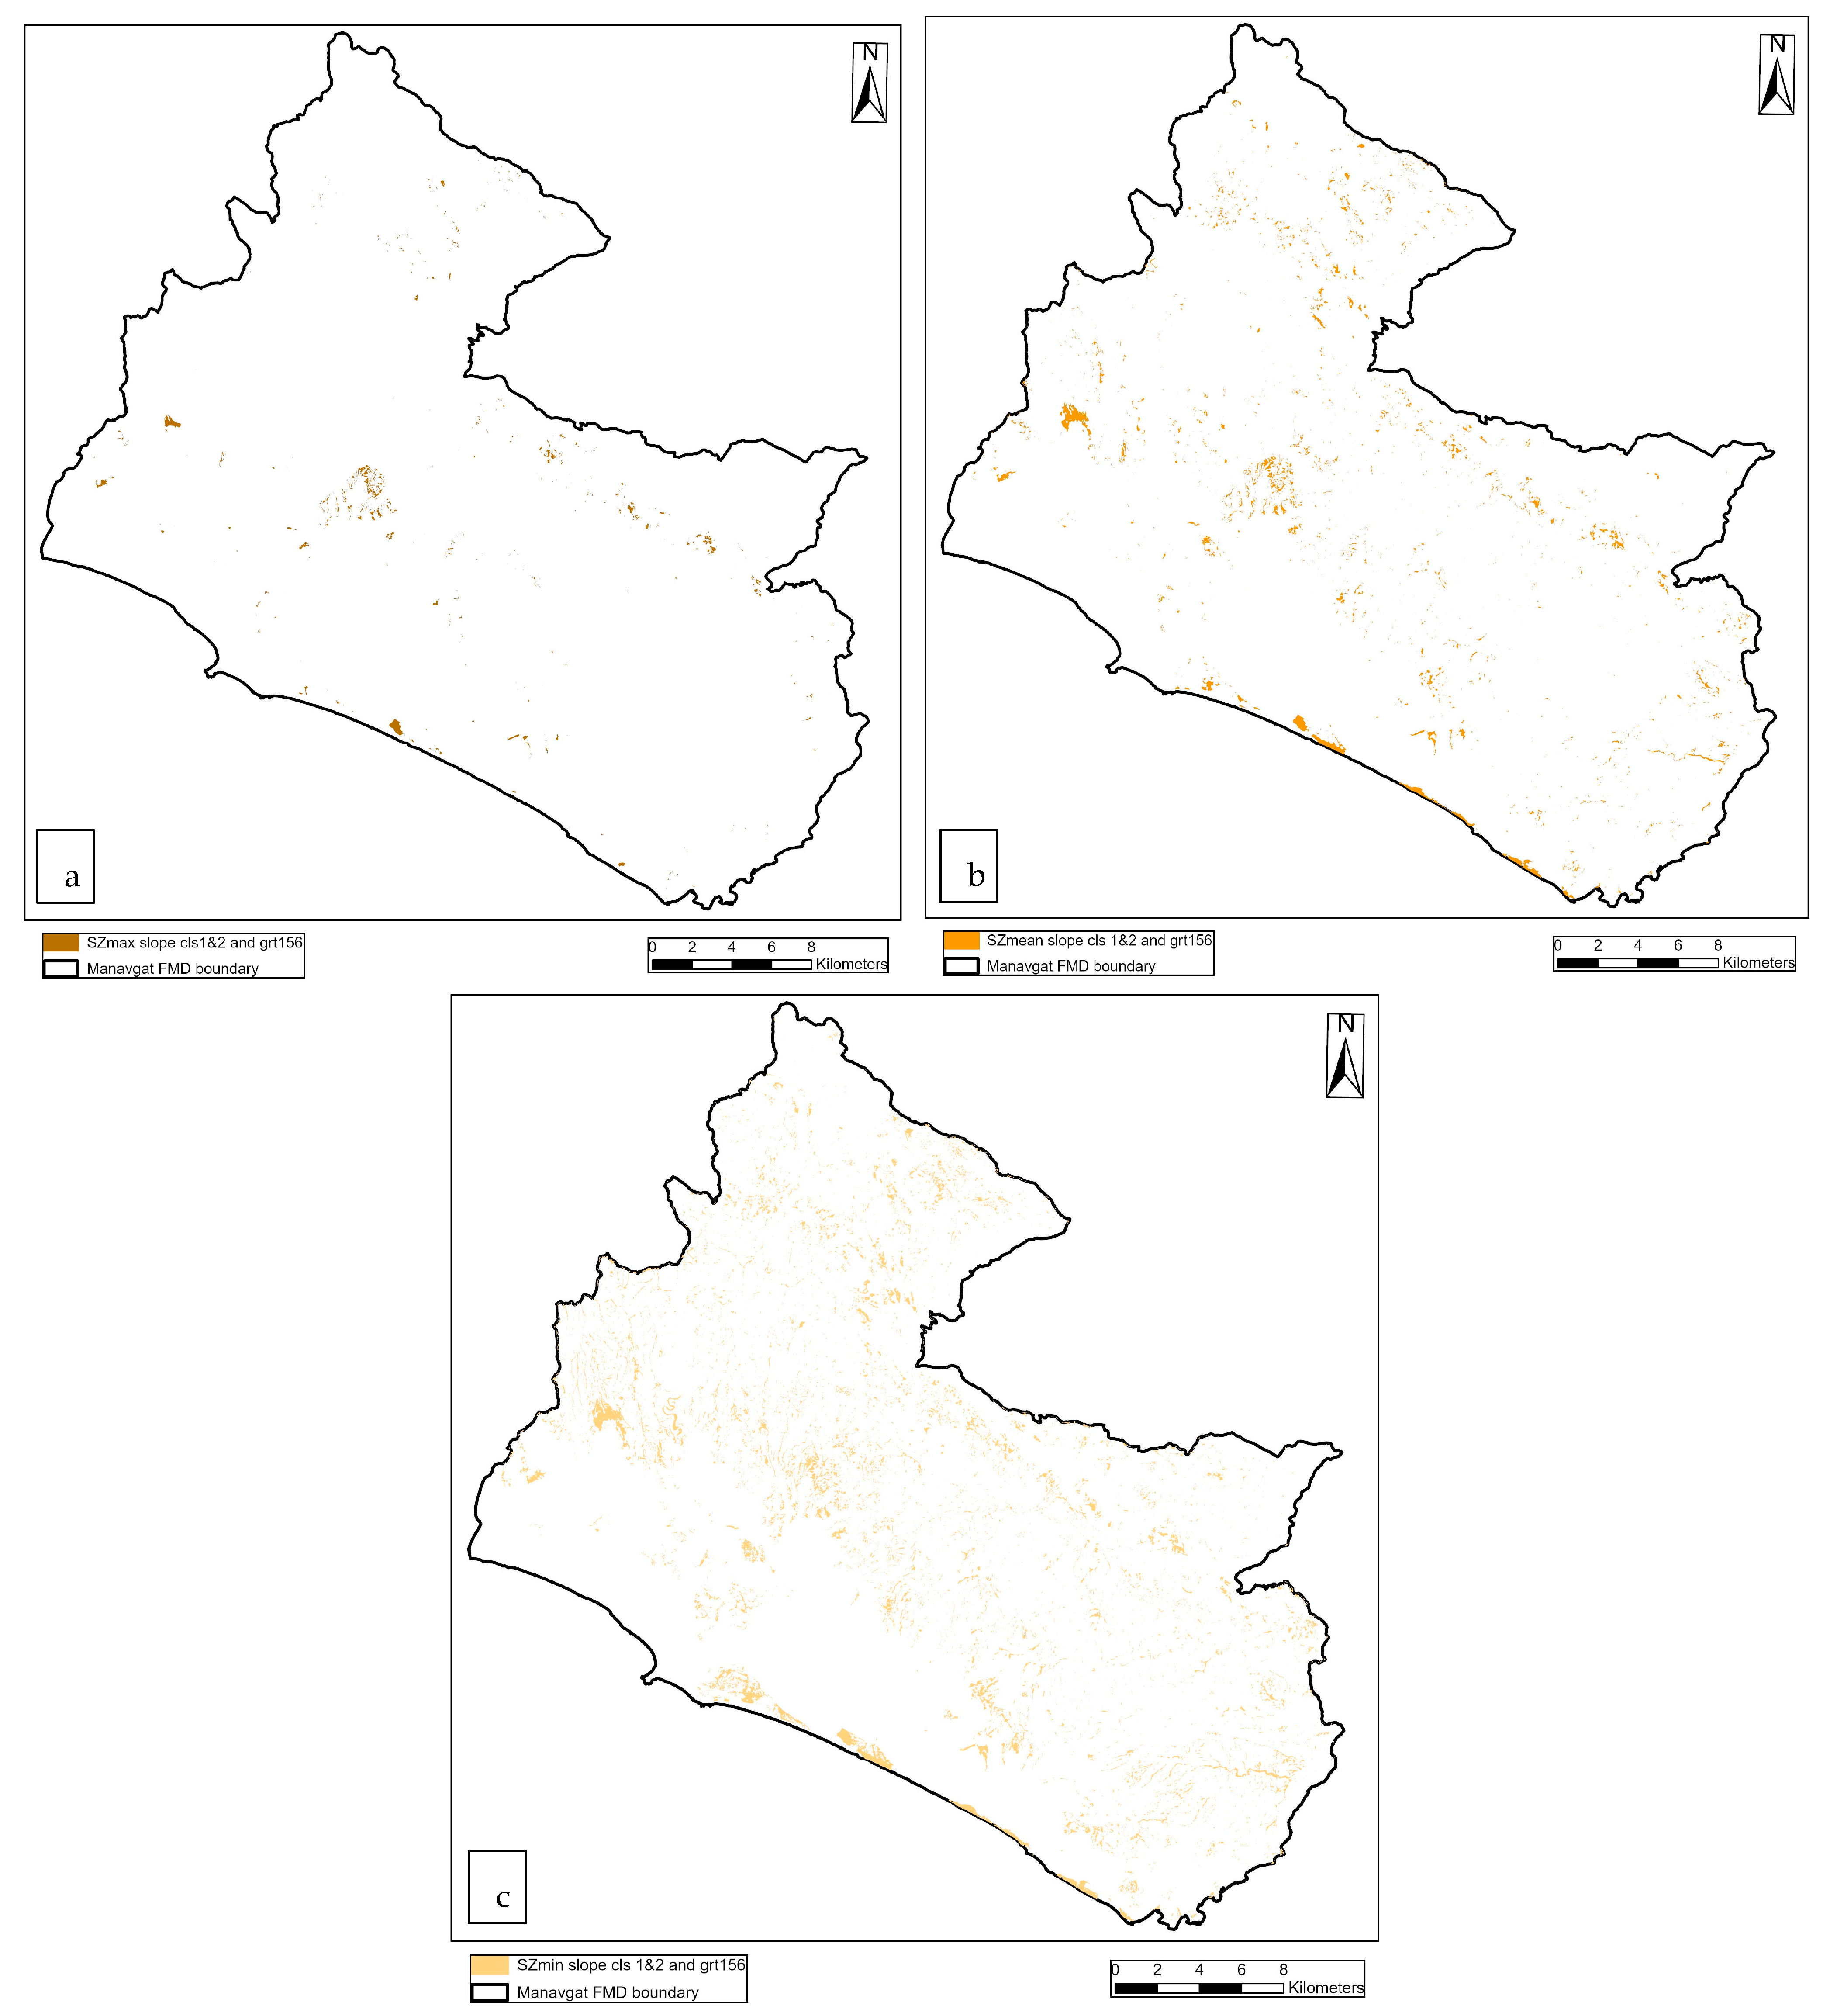
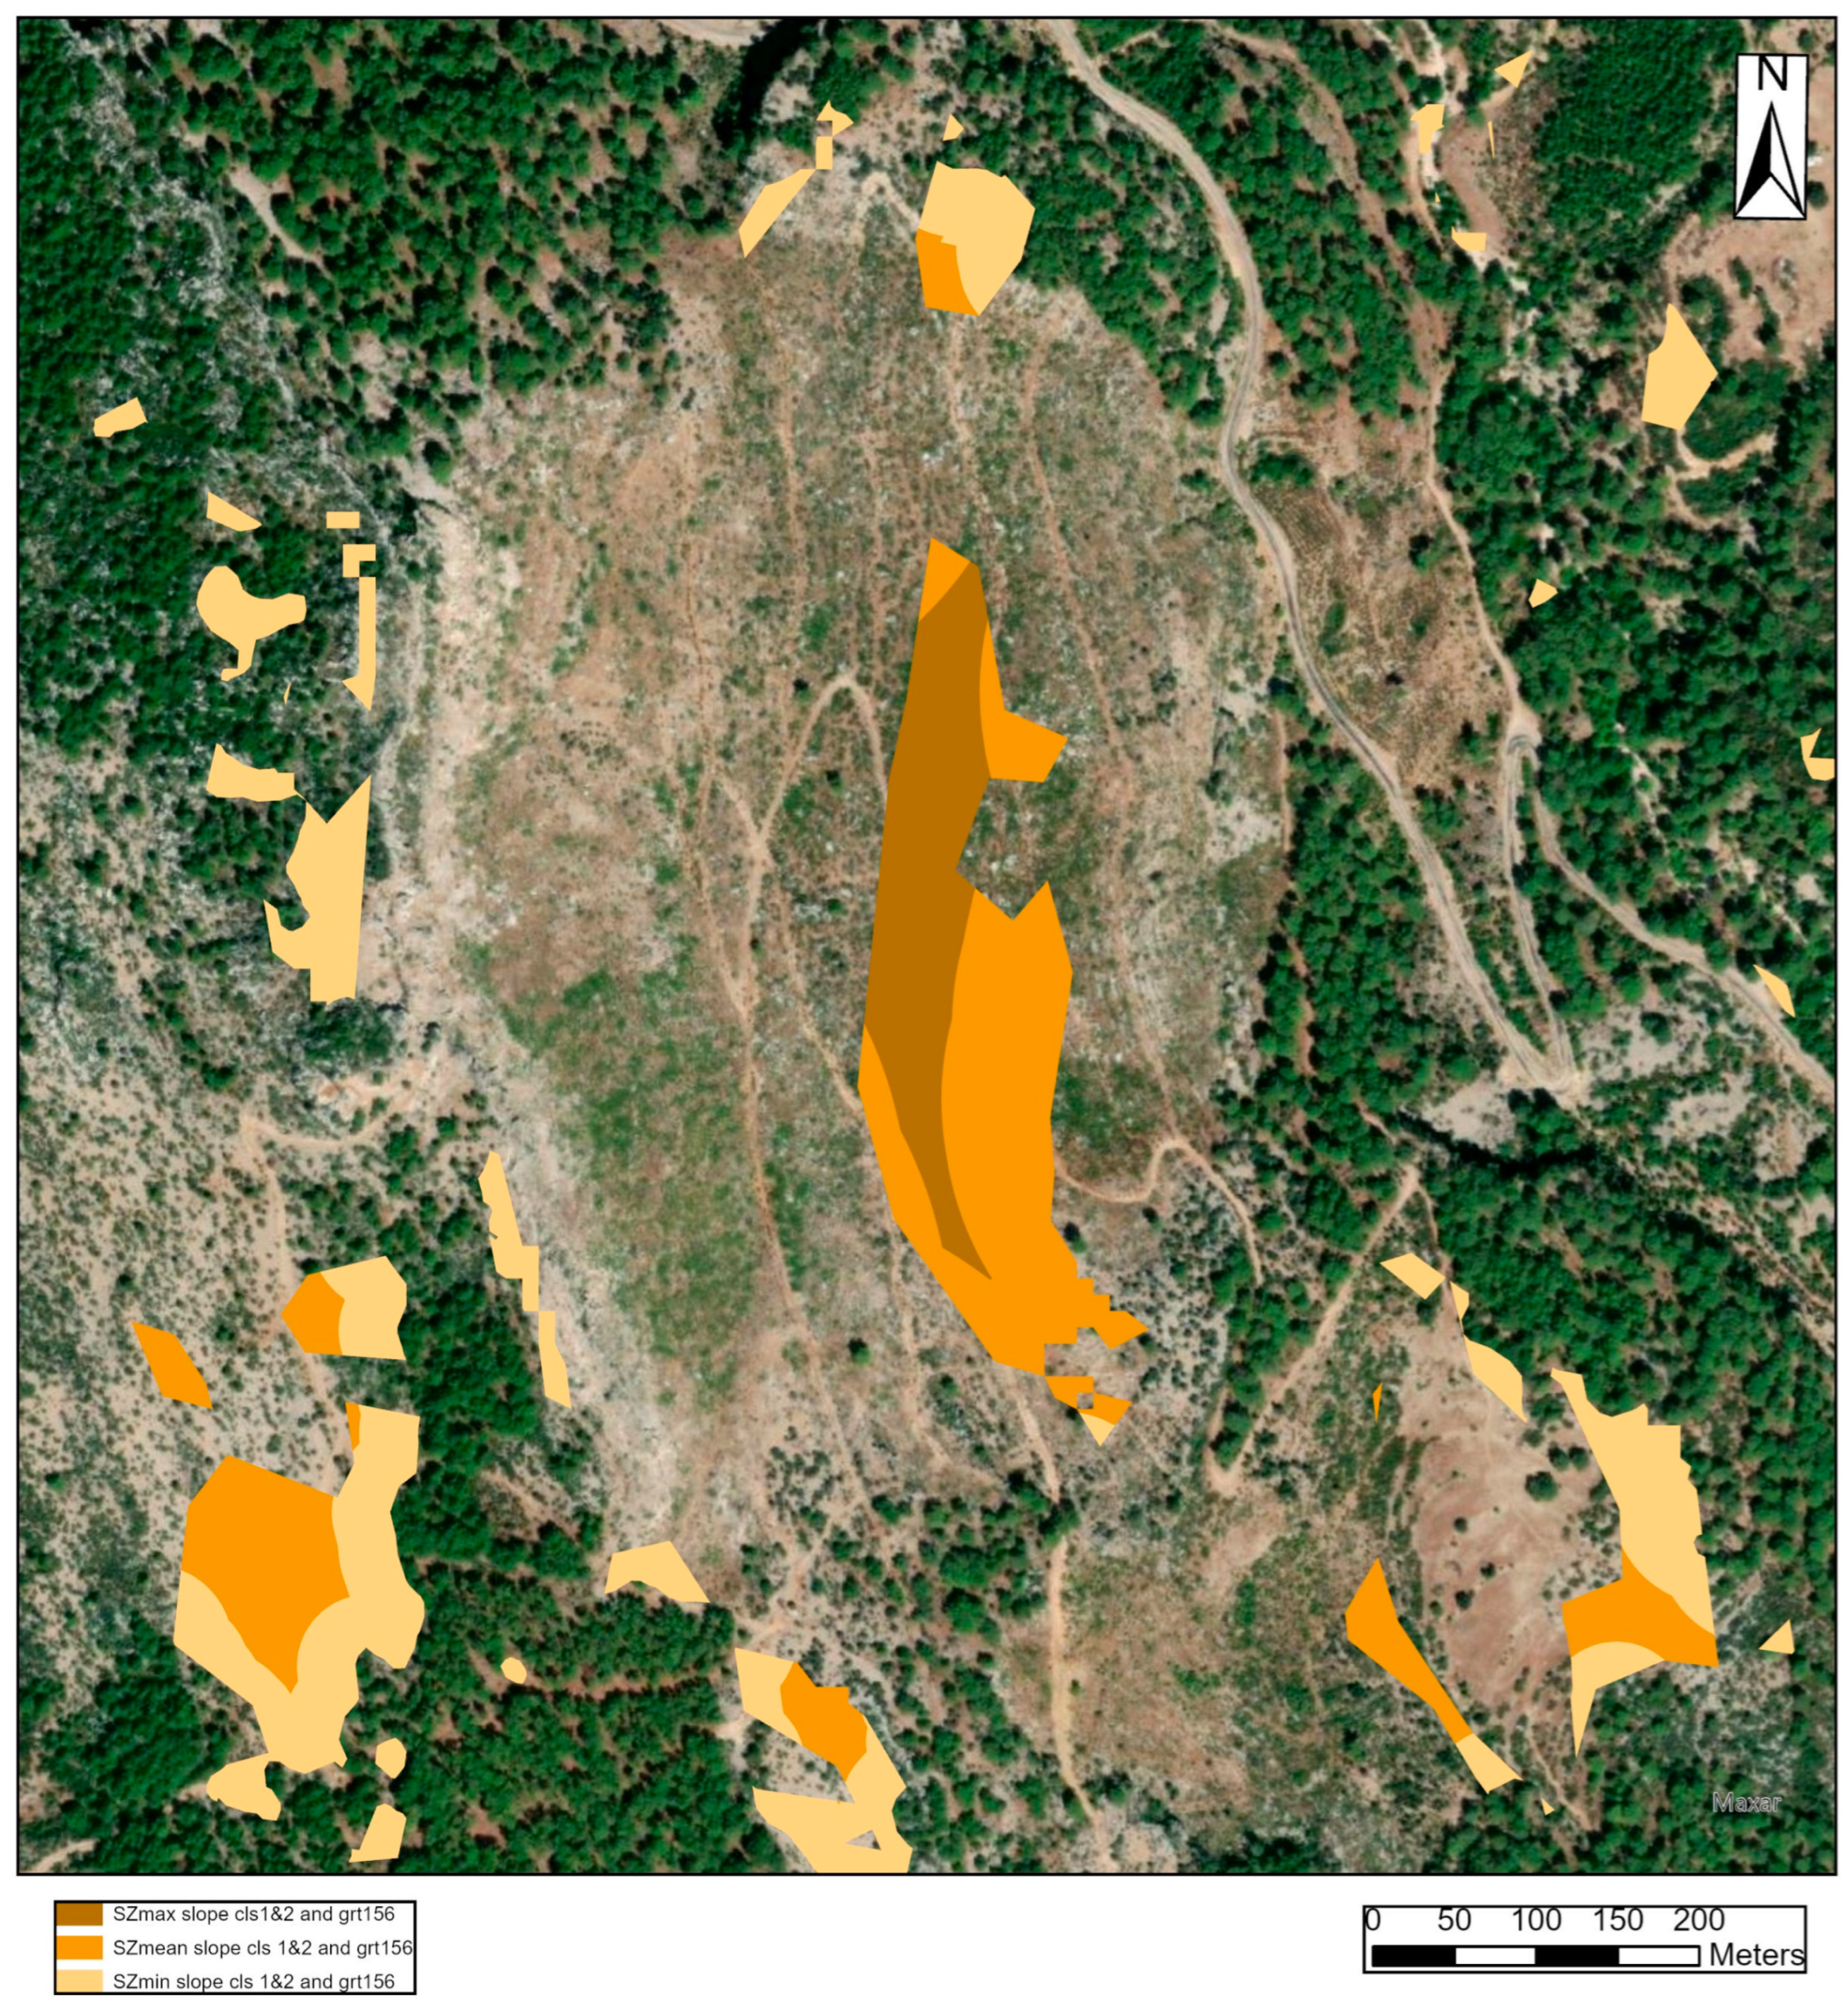
While developing a model to identify SZs, the vegetation height dataset is used to assess the SSD, which is determined by flame height. After SSD is calculated, the safety zone must be large enough to protect both firefighter personnel and equipment. The studies by Dennison et al. [3] and Campbell et al. [18] used a canopy height model (CHM) derived from high-resolution airborne Light Detection and Ranging (lidar) data, which provides detailed information on terrain and vegetation height to identify SSD and estimate potential SZs. However, due to the cost of lidar data, there are no lidar data, or when lidar data are available, there is limited access to lidar data in many parts of the world. Regarding lidar data limitations, we employed a high-resolution global canopy height map dataset to determine SSD and assess potential SZs.
The high-resolution global canopy height map dataset is a pixel-based representation of height, in meters, above the ground surface. The dataset was downloaded from the Google Earth Engine platform for our study area. Before downloading the dataset, the canopy height dataset was reprojected into the UTM Zone. Then, to eliminate noise, the maximum canopy height was calculated based on frequency, which was 33 m. Once the canopy height datasets were downloaded, the decision rule by Dennison et al. [3] was followed. ArcGIS Pro was used for the analysis. Firstly, a tree/non-tree map was generated using threshold values, where the pixel values equal to or greater than 1 m in height were classified as a tree, while all pixel values less than or equal to 1 m in height were classified as non-tree (Figure 2), to determine forest clearings (non-vegetated areas). Then, we applied a kernel filter with 10% within a 30 m diameter circular, the same as Cambell et al. [18], to the newly generated tree/non-tree classification map for preventing small and/or single trees. If the tree area covered less than 10% within a 30 m kernel circle, it was reclassified as a non-tree area (Figure 2). We have not performed any sensitivity analysis to determine the impact of the kernel diameter and percentage, which directly impact the SZs model. However, the visual comparison of new tree/non-tree classification was quite acceptable with the images.
After generating two classes (tree/non-tree) of map datasets, clearings need to be identified for SSD identification and SZ calculation. Cambell et al. [18] used lidar data, which allows single crown delineation along with height information and automatically determines the open areas. Hence, they identified the clearings by buffering surrounding tree pixels by 8 m (Equation (1)). Eight meters represents the best-case scenario of SSD with low wind, low slope, and 1 m tall surrounding trees (8 × 1 × 1) [11]. In our study, we followed a similar approach to Campbell et al. [18]. A high-resolution global canopy height map dataset could not have any specific information about individual crown boundaries. Thus, only non-tree areas were exported and converted to vector data. These areas were buffered with 8 m towards the forest area to determine any remaining non-tree areas and include them within every clearing. To assess the vegetation height surrounding the clearings, non-tree vector data buffered with 10 m [18] were extracted from the clearing with an 8 m buffer. Then, these newly generated areas of interest surrounding the clearings were used to clip a high-resolution global vegetation height map dataset (Figure 3).
Once the area of interest was determined for assessing the vegetation height around the clearings, the zonal statistic was employed to calculate the minimum, maximum, and mean height of the vegetation within clipped surrounding areas. These values (min, max, and mean) were employed to calculate the SSD using Equation (1). After calculating the SSDs, we used these SSD values to buffer the buffered difference of 10 and 8 m areas, but this time, two-sided buffers were employed (Figure 4). There were three different clearings (SZs) based on SSDs calculated from three different vegetation heights (minimum, maximum, and mean values). Then, we clipped these three different SZs by using the clearings, which non-tree areas vector data generated after filtering processes.
In order to determine the SZs within forested areas where fire mainly occurred, a forest area map was generated from the Manavgat FMD Forest management plan. According to this plan, Manavgat FMD is composed of different land use/land cover types, including settlement, agriculture, water, forest (degraded forest—less than 10% canopy cover, and productive forest—greater than 11% canopy cover), bare ground, and rocks. We generated two classes: forest and non-forest areas. The forest class includes degraded forest, productive forest, and plantation forest. Open areas, powerline zones, and mining areas located within forest boundaries are also classified as forests according to the Forest Act in Turkish forestry. Therefore, these areas were classified as forests (Figure 1). Non-forest classes are composed of water, settlements, agricultural areas, and rocks. Once the forest map was generated, SZs (clearings) were intersected with it to identify their location and the number of them within the forest.
The slope should be considered a limiting factor in SZ qualification, as it can increase heat exposure and radiative energy transfer while making accessibility more challenging. Hence, a slope map was generated for the study area using the DEM provided by Antalya RDF. Then, we classified slope data into three classes: (1) less or equal to 10%, (2) between 10% and 20%, and (3) equal to or greater than 20%. Slope classes 1 and 2 were selected and converted to a feature class; then, they were intersected with potential SZs calculated from SSD with min, max, and mean values of vegetation height. While assessing the potential SZs, we also need to consider a contiguous area big enough to accommodate equipment and personnel. The minimum size was 156 m2, assuming 20 firefighters and 2 vehicles [3,22]. Based on that, all clearings equal to or greater than 156 m2 within slope classes 1 and 2 were qualified as SZs in this study.

3. Results

In this study, SSD was determined using a high-resolution global canopy cover map dataset. After classifying areas as tree and non-tree using the kernel filters, a total of 21,902 clearings were identified within the boundary of Manavgat FMD, of which 19,599 were located in forested areas. The clearings within forested areas did not include unvegetated areas such as water bodies, agricultural areas, and settlements. SSD was calculated based on different vegetation height values (minimum, maximum, and mean height surrounding clearings) that affect flame height values and size of the SZs. Appendix A shows the potential SZ maps assessed SSD values within forested areas in Manavgat FMD. The maps indicated that utilizing the high-resolution global canopy height map dataset for the vegetation conditions would provide a sufficient number of potential safety zones, even in the best-case scenarios of low slope and low wind.
Vegetation height is a key factor in determining SZs based on SSD because it affects the flame height. Based on the zonal statistic results, Table 1 summarizes the minimum, mean, and maximum values of vegetation height within 2 m buffered areas surrounding clearings. The range of vegetation height within 2 m buffered areas was quite similar for the minimum and mean values of vegetation height, but the average vegetation height for the minimum and mean values of vegetation height was relatively larger. SSD was calculated using Equation (1) (low slope and low wind); for this table, the average vegetation height was used as an example. The taller the vegetation, the bigger the SSD value. When the SSD was calculated for every clearing based on three different vegetation height values, the potential SZ associated with an SSD was identified within forested areas without considering slope and area of equipment and personnel (Table 2). The findings showed that the size and number of SZs decreased when SSD had higher values. In particular, SZ assessed with SSDmin had a higher number (26, 675) and larger area (16, 225.62), while the number of SZs assessed with SSDmean and SSDmax were 4660 and 541, respectively. The area of SZ with SSDmean was approximately one-third of the area of SZ(SSD min), and the area of SZ(SSD min) was almost ten times bigger than the area of SZ(SSD max).
When considering slope and area factors for assessing potential SZs determined from three different SSDs, the total area of SZs within the study areas was reduced (Figure 5). In general, the north and northeastern sides of the study area have steep slopes; thus, potential SZs located there were mostly eliminated.
After applying area and slope rules, the number of SZs decreased slightly for SZ(SSD min), while it increased for SZ(SSD mean) and SZ(SSD max). However, the total area of SZs (Table 3) were relatively small compared to the total area of SZs without slope and area rule in Table 2 for all three SZs. We also calculated minimum, mean, and maximum areas for all SZs. The minimum area for all SZs was the same, while SZ(SSD min) had a larger area (65.156 ha) and the maximum area for SZ(SSD mean) and SZ(SSD max) were 42.2035 ha and 28.9976 ha, respectively. In contrast, the mean areas were 0.1668 ha, 0.2303 ha, and 0.1668 ha for SZ(SSD min), SZ(SSD mean), and SZ(SSD max), respectively.
Although we used 20% slope for the SZ decision rule, this slope value was divided into two classes: (1) less than 10% and (2) greater than 10% and less than 20%. Based on that, the area and number of SZs from three different SSDs were estimated (Table 4). The findings showed that slope class 2 had a larger area of SZs than the slope class 1 for all SZs. The number of SZs in slope class 2 were doubled the number of SZs in slope class 1.
Furthermore, based on road network datasets, the distances of SZ to road was calculated using Euclidean distance. The map highlighted that most of the potential SZs are located close to the road network, mainly within the 250 m buffer zone. Along with distance, the total area of SZs becomes smaller (Figure 6).

4. Discussion

This study aimed to utilize existing automated metric and models for determining potential safety zones for firefighters using a high-resolution global canopy cover height map dataset within the Mediterranean region of Türkiye. Along with extreme climate events, wildfire risk has increased in size, frequency, and intensity worldwide [31]. Thus, the safety of firefighters has recently gained more attention and importance during firefighting. Firefighters traditionally identify and define SZs on-site on limited geospatial information and visual interpretation from their experience [23,24]. Even so, the term SZs integrated into firefighting decreased the average annual fatalities in the 1960s [13]. Therefore, mapping potential safety zones ahead of a fire or before fire season using a spatial model along with remote sensing data offers a practical and valuable tool for firefighters. This approach supports informed decision-making concerning firefighter evacuation procedures in case of entrapment/burnover, ultimately reducing the risk of injuries and fatalities.
As it is known, slope and wind are significant factors that unexpectedly affect fires. However, we used low slope and low wind (i.e., 1) values for SSD calculation because the use of the freely available data for vegetation height information was evaluated for mapping SZs areas associated with SSD. Although map results were promising, it requires validation under the ground vegetation conditions. In addition to vegetation height information, area and accessibility were other important factors for defining potential SZs. Once SZs were determined using vegetation height, the safe zone also required an area greater than 156 m2 and located on a slope of less than 20% [3,22]. Figure 7 can be given as an example of a spatial model, considering slope and the size for SZ. In addition, using 10 m resolution slope data seems to cause data loss; thus, it would be more accurate to use higher resolution DEM data, particularly derived from lidar data if it is available for generating a slope dataset [3,18].
Additionally, the distance of SZs to the road was assessed using Euclidean distance, which provided information about how potential SZs are close to the road. However, it did not address any information about travel time because it is affected by many parameters, including slope, vegetation, travel types (vehicle or foot), and road conditions [3,17,32]. Still, it would be a practical solution to map how close or reachable those SZ areas are for firefighters and better to add those parameters into future safe zone model studies.
Recently, this spatial model has been integrated into an open-access web mapping tool for determining suitable SZs. The tool allows users to identify potential SZs only within the contiguous USA [1]. With this study, we also evaluated how available vegetation data can be employed to assess SSZ areas in different regions where fire becomes a growing threat. Based on the results, our analysis offers practical and objective solutions to firefighters during firefighting similar to previous studies [1,3,18]. However, datasets need to be validated with current ground conditions, particularly vegetation conditions on the ground. Also, after generating these maps, it would be better to provide training on how to use those maps in case of a fire.

5. Conclusions

In this study, the use of a high-resolution global canopy height map dataset with existing spatial models to determine safety zones regarding vegetation height was evaluated. For this study, decision tree guidelines were employed to assess the suitability of safety zones by considering factors such as distance from fuels and roads, vegetation height, and slope. The findings showed that high-resolution global canopy height datasets can provide the required information about vegetation height, which affects flame height, for identifying safety zones. The results also indicated that when the vegetation height increased in the surrounding clearings, the size of SZs decreased relative to SSDs. This study may help delineate the SZs in high-fire-risk areas worldwide rather than focusing on a limited region using existing datasets and models. Thus, generating SZs map ahead of a fire or before fire season would increase the safety of the firefighters and reduce the fatalities and injuries. For this study, only a limited set of parameters was used in this model, such as assuming low wind and slope. Even utilizing a spatial model in conjunction with remote sensing data to map potential safety zones before the fire season by considering the slope wind factor low offers a valuable and objective tool for firefighters. However, conditions such as slope and wind factors (rather than assuming them low) need to be adjusted to ensure accuracy and practical applications of SZs in future studies.

Funding

This research received no external funding.

Data Availability Statement

All links to input data are reported in the manuscript, and all output data are available upon request to the authors.

Acknowledgments

I would like to thank the anonymous reviewers for their valuable feedback on the manuscript.

Conflicts of Interest

The author declares no conflicts of interest.

Appendix A

Figure A1. Maps of the potential SZ, assessed using three different SSD values, SSD max (a), SSD mean (b), SSD min (c) within forested areas in Manavgat FMD.
Forests 16 00709 g0a1

References

  1. Campbell, M.J.; Dennison, P.E.; Thompson, M.P.; Butler, B.W. Assessing potential safety zone suitability using a new online mapping tool. Fire 2022, 5, 5. [Google Scholar] [CrossRef]
  2. Page, W.G.; Butler, B.W. An empirically based approach to defining wildland firefighter safety and survival zone separation distances. Int. J. Wildland Fire 2017, 26, 655–667. [Google Scholar] [CrossRef]
  3. Dennison, P.E.; Fryer, G.K.; Cova, T.J. Identification of firefighter safety zones using lidar. Environ. Model. Softw. 2014, 59, 91–97. [Google Scholar] [CrossRef]
  4. Alexander, M.E.; Taylor, S.W.; Page, W.G. Wildland firefighter safety and fire behavior prediction on the fireline. In Proceedings of the 13th International Wildland Fire Safety Summit & 4th Human Dimensions Wildland Fire Conference, Boise, ID, USA, 20–24 April 2015. [Google Scholar]
  5. Haynes, K.; Short, K.; Xanthopoulos, G.; Viegas, D.X.; Ribeiro, L.M.; Blanchi, R. Wildfires and WUI fire fatalities. In Encyclopedia of Wildfires and Wildland-Urban Interface (WUI) Fires; Manzello, S.L., Ed.; Springer: Cham, Switzerland, 2020; p. 16. [Google Scholar]
  6. Molina-Terrén, D.M.; Xanthopoulos, G.; Diakakis, M.; Ribeiro, L.; Caballero, D.; Delogu, G.M.; Viegas, D.X.; Silva, C.A.; Cardil, A. Analysis of forest fire fatalities in southern Europe: Spain, Portugal, Greece and Sardinia (Italy). Int. J. Wildland Fire 2019, 28, 85–98. [Google Scholar] [CrossRef]
  7. Blanchi, R.; Leonard, J.; Haynes, K.; Opie, K.; James, M.; de Oliveira, F.D. Environmental circumstances surrounding bushfire fatalities in Australia 1901–2011. Environ. Sci. Policy 2014, 37, 192–203. [Google Scholar] [CrossRef]
  8. Diakakis, M.; Xanthopoulos, G.; Gregos, L. Analysis of forest fire fatalities in Greece: 1977–2013. Int. J. Wildland Fire 2016, 25, 797–809. [Google Scholar] [CrossRef]
  9. Cardil, A.; Molina, D.M. Factors causing victims of wildland fires in Spain (1980–2010). Hum. Ecol. Risk Assess. 2015, 21, 67–80. [Google Scholar] [CrossRef]
  10. Alexander, M.E.; Buxton-Carr, P. Wildland fire suppression related fatalities in Canada, 1941–2010: A preliminary report. In Proceedings of the 11th International Wildland Fire Safety Summit, Missoula, MT, USA, 4–8 April 2011. [Google Scholar]
  11. Butler, B.W. Wildland firefighter safety zones: A review of past science and summary of future needs. Int. J. Wildland Fire 2014, 23, 295–308. [Google Scholar] [CrossRef]
  12. Butler, B.W.; Cohen, J.D. Firefighter safety zones: A theoretical model based on radiative heating. Int. J. Wildland Fire 1998, 8, 73–77. [Google Scholar] [CrossRef]
  13. Butler, B.; Parsons, R.; Mell, W. Recent findings relating to firefighter safety zones. In Proceedings of the Large Wildland Fires Conference, Missoula, MT, USA, 19–23 May 2014. [Google Scholar]
  14. Gleason, P. Lookouts, Communications, Escape Routes, and Safety Zones. Available online: https://www.coloradofirecamp.com/fire-origins/LCES-gleason.htm (accessed on 20 August 2024).
  15. Thorburn, R.W.; Alexander, M.E. LACES versus LCES: Adopting an “A” for “Anchor Points” to improve wildland firefighter safety. In Proceedings of the 2001 International Wildland Fire Safety Summit, Missoula, MT, USA, 6–8 November 2001. [Google Scholar]
  16. National Wildfire Coordinating Group. Incident Response Pocket Guide. 2014. Available online: https://www.dnr.wa.gov/publications/rp_cb_incident_response_pocket_guide.pdf (accessed on 3 January 2022).
  17. Alexander, M.E.; Mutch, R.W.; Davis, K.M.; Bucks, C.M. Wildland fires: Dangers and survival. In Auerbach’s Wilderness Medicine, 7th ed.; Elsevier: Philadelphia, PA, USA, 2017; pp. 276–318. Available online: https://www.researchgate.net/publication/292328217_Wildland_fires_dangers_and_survival (accessed on 25 August 2024).
  18. Campbell, M.J.; Dennison, P.E.; Butler, B.W. Safe separation distance score: A new metric for evaluating wildland firefighter safety zones using lidar. Int. J. Geogr. Inf. Sci. 2017, 31, 1448–1466. [Google Scholar] [CrossRef]
  19. Zarate, L.; Arnaldos, J.; Casal, J. Establishing safety distances for wildland fires. Fire Saf. J. 2008, 43, 565–575. [Google Scholar] [CrossRef]
  20. Rossi, J.L.; Simeoni, A.; Moretti, B.; Leroy-Cancellieri, V. An analytical model based on radiative heating for the determination of safety distances for wildland fires. Fire Saf. J. 2011, 46, 520–527. [Google Scholar] [CrossRef]
  21. Frankman, D.; Webb, B.W.; Butler, B.W.; Jimenez, D.; Forthofer, J.M.; Sopko, P.; Shannon, K.S.; Hiers, J.K.; Ottmar, R.D. Measurements of convective and radiative heating in wildland fires. Int. J. Wildland Fire 2012, 22, 157–167. [Google Scholar] [CrossRef]
  22. Andrews, P.L.; Bevins, C.D.; Seli, R.C. BehavePlus Fire Modeling System, Version 4.0; User’s Guide. Gen. Tech. Rep. RMRS-GTR-106, Revised; Department of Agriculture, Forest Service, Rocky Mountain Research Station: Ogden, UT, USA, 2009; Volume 106, p. 132. [Google Scholar]
  23. Steele, J. Effective Firefighter Safety Zone Size: A Perception of Firefighter Safety. In Proceedings of the 4th International Wildland Fire Safety Summit, Edmonton, AB, Canada, 10–12 October 2000; Butler, B.W., Shannon, K.S., Eds.; International Association of Wildland Fire: Missoula, MT, USA, 2000; pp. 171–177. [Google Scholar]
  24. Bechtold, W.A.; Zarnoch, S.J.; Burkman, W.G. Comparisons of modeled height predictions to ocular height estimates. South. J. Appl. For. 1998, 22, 216–221. [Google Scholar] [CrossRef]
  25. Türkan, S.; Özel, G.; Güney, C.O.; Ünal, C.; Şentürk, Ö.; Özkan, K. A New Approach to Determine the Influence of Weather Conditions on Forest Fire Risk in the Mediterranean Region of Türkiye. Mugla J. Sci. Technol. 2023, 9, 1–10. [Google Scholar] [CrossRef]
  26. Demir, E. The Assesment of the Population and Social Characteristics of Antalya. Turk. Acad. Res. Rev. 2022, 7, 75–96. [Google Scholar]
  27. Güney, C.O.; Ryan, K.C.; Güney, A.; Hood, S.M. Wildfire in Turkey-Fire management challenges at an ancient crossroads of nature & culture. Wildfire 2019, 28, 20–26. [Google Scholar]
  28. General Directorate of Forestry (GDF). Forestry Statistics 2022. Publications of General Directorate of Forestry. 2022. Available online: https://www.ogm.gov.tr/tr/e-kutuphane/resmi-istatistikler (accessed on 10 September 2024).
  29. Gazzard, R. Risk Management Control Measure: Toolkit for Practitioners and Advisors; UK Vegetation Fire Risk Management: London, UK, 2012; p. 24. Available online: http://news.bbc.co.uk/2/shared/bsp/hi/pdfs/10_10_12_fire_control_measures.pdf (accessed on 31 March 2025).
  30. Tolan, J.; Yang, H.I.; Nosarzewski, B.; Couairon, G.; Vo, H.V.; Brandt, J.; Spore, J.; Majumdar, S.; Haziza, D.; Vamaraju, J.; et al. Very high resolution canopy height maps from RGB imagery using self-supervised vision transformer and convolutional decoder trained on aerial lidar. Remote Sens. Environ. 2014, 300, 113888. [Google Scholar] [CrossRef]
  31. Moreira, F.; Ascoli, D.; Safford, H.; Adams, M.A.; Moreno, J.M.; Pereira, J.M.; Catry, F.X.; Armesto, J.; Bond, W.; González, M.E.; et al. Wildfire management in Mediterranean-type regions: Paradigm change needed. Environ. Res. Lett. 2020, 15, 011001. [Google Scholar] [CrossRef]
  32. Alexander, M.E.; Baxter, G.J.; Dakin, G.R. How much time does it take for a wildland firefighter to reach a safety zone. Wildfire Mag. 2013, 12–13. [Google Scholar]
Figure 1. Study area (Manavgat FMD) (a), forested area (b), and slope map (c).
Forests 16 00709 g001
Figure 2. The high-resolution global canopy vegetation height model (a), representing vegetation height ≥ 1 m and vegetation height ≤ 33 m, a view of the classified vegetation height data (b) after filtering as tree and non-tree (clearings).
Forests 16 00709 g002
Figure 3. Buffered clearing with 8 m and 10 m, and the extracted area from these buffered areas that was used to calculate vegetation height around the clearings.
Forests 16 00709 g003
Figure 4. An example of using SSD values calculated from three different vegetation heights (minimum, maximum, and mean values) for buffering (a) and an example of the assessment of potential clearings (SZs) calculated from SSD (b).
Forests 16 00709 g004
Figure 5. The map of potential SZ areas, assessed using three different SSD values, SSD max (a), SSD mean (b), and SSD min (c) within forested areas in Manavgat FMD, with less than 20% slope and greater than 156 m2.
Forests 16 00709 g005
Figure 6. Distance to road network.
Forests 16 00709 g006
Figure 7. An example showing the impact of different vegetation heights (min, mean, and max) on potential SZs associated with SSDs.
Forests 16 00709 g007
Table 1. Vegetation height (Vh) values within 2 m buffered areas and surrounding clearings, and the calculated SSDs from these Vh values.
Vh(min)Vh(mean)Vh(max)
Average Vh within 2 m buffered areas (m)1.655.079.86
Range of Vh within 2 m buffered areas (m)1–241–251–33
Median Vh within 2 m buffered areas (m)1.004.779.00
SSD (m)13.1240.5678.88
Vh indicates vegetation height.
Table 2. The number of SZs associated with SSDs and their estimated areas within the forested area without considering slope and size.
Number of ClearingTotal Area
(ha)
SZ(SSD min)26,67516,225.62
SZ(SSD mean)46606267.37
SZ(SSD max)5411584.89
Table 3. The number of SZs associated with SSDs and their estimated areas, where the slope is less than 20% and the area is greater than 156 m2.
Number of SZsAreamin
(ha)
Areamean
(ha)
Areamax
(ha)
Total Area (ha)
SZ(SSD min)21,9870.01560.166865.1563666.62
SZ(SSD mean)61440.01560.230342.20351415.19
SZ(SSD max)13390.01570.267828.9976358.45
Table 4. The number of SZs associated with SSDs and their estimated areas within two different slope classes and area is greater than 156 m2.
Number of SZs in Slope 1 * Class Area in Slope 1 Class (ha)Number of SZs in Slope 2 ** Class Area in Slope 2 Class (ha)
SZ(SSD min)71201505.3814,8582161.23
SZ(SSD mean)1966621.674.178793.33
SZ(SSD max)420154.11919204.35
*: slope is less than 10%; **: slope is greater than 10% and less than 20%.
Disclaimer/Publisher’s Note: The statements, opinions and data contained in all publications are solely those of the individual author(s) and contributor(s) and not of MDPI and/or the editor(s). MDPI and/or the editor(s) disclaim responsibility for any injury to people or property resulting from any ideas, methods, instructions or products referred to in the content.

