
Intra-Plant Variation in Leaf Dry Mass per Area (LMA): Effects of Leaf–Shoot Orientation and Vertical Position on Dry Mass and Area Scaling


Abstract
1. Introduction
2. Materials and Methods
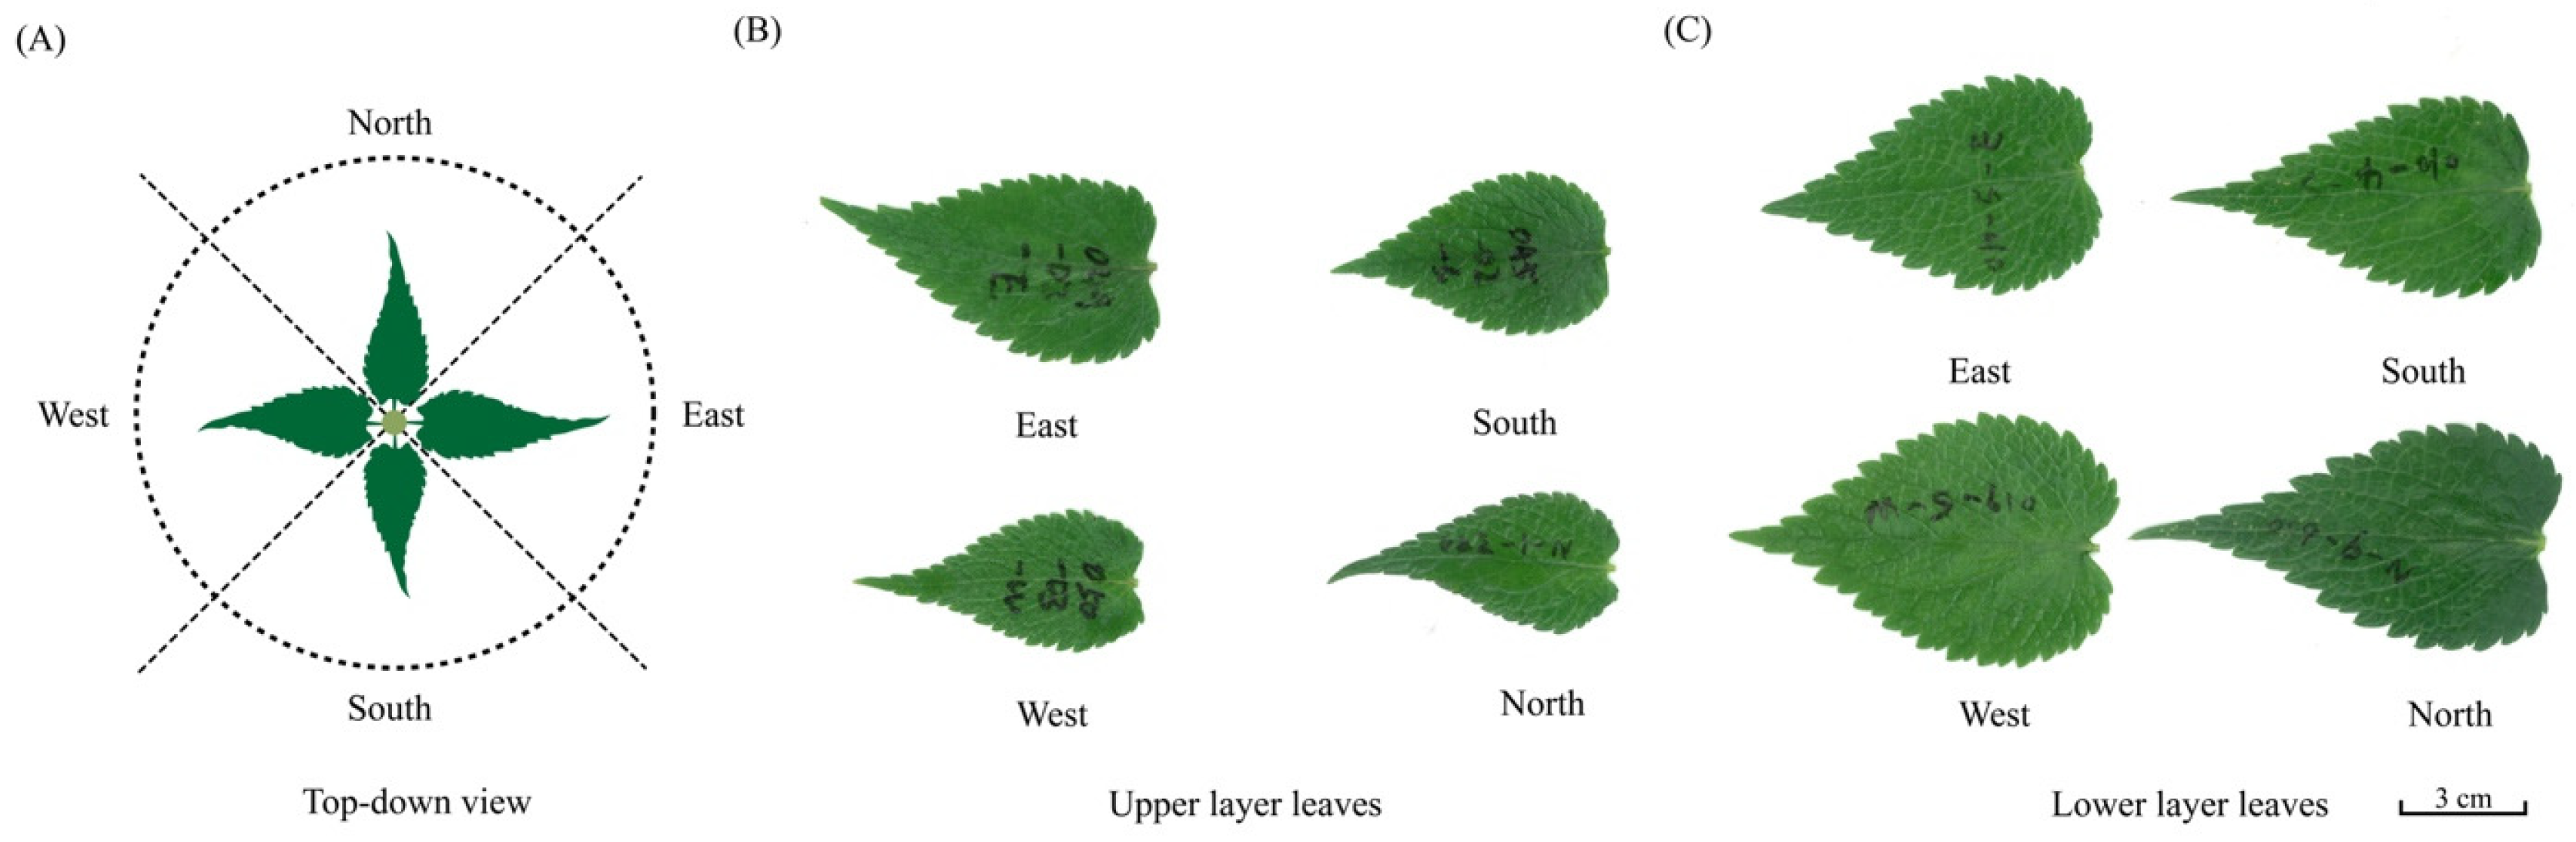
2.1. Leaf Collection
2.2. Leaf Measurements
2.3. Statistical Methods
3. Results
4. Discussion
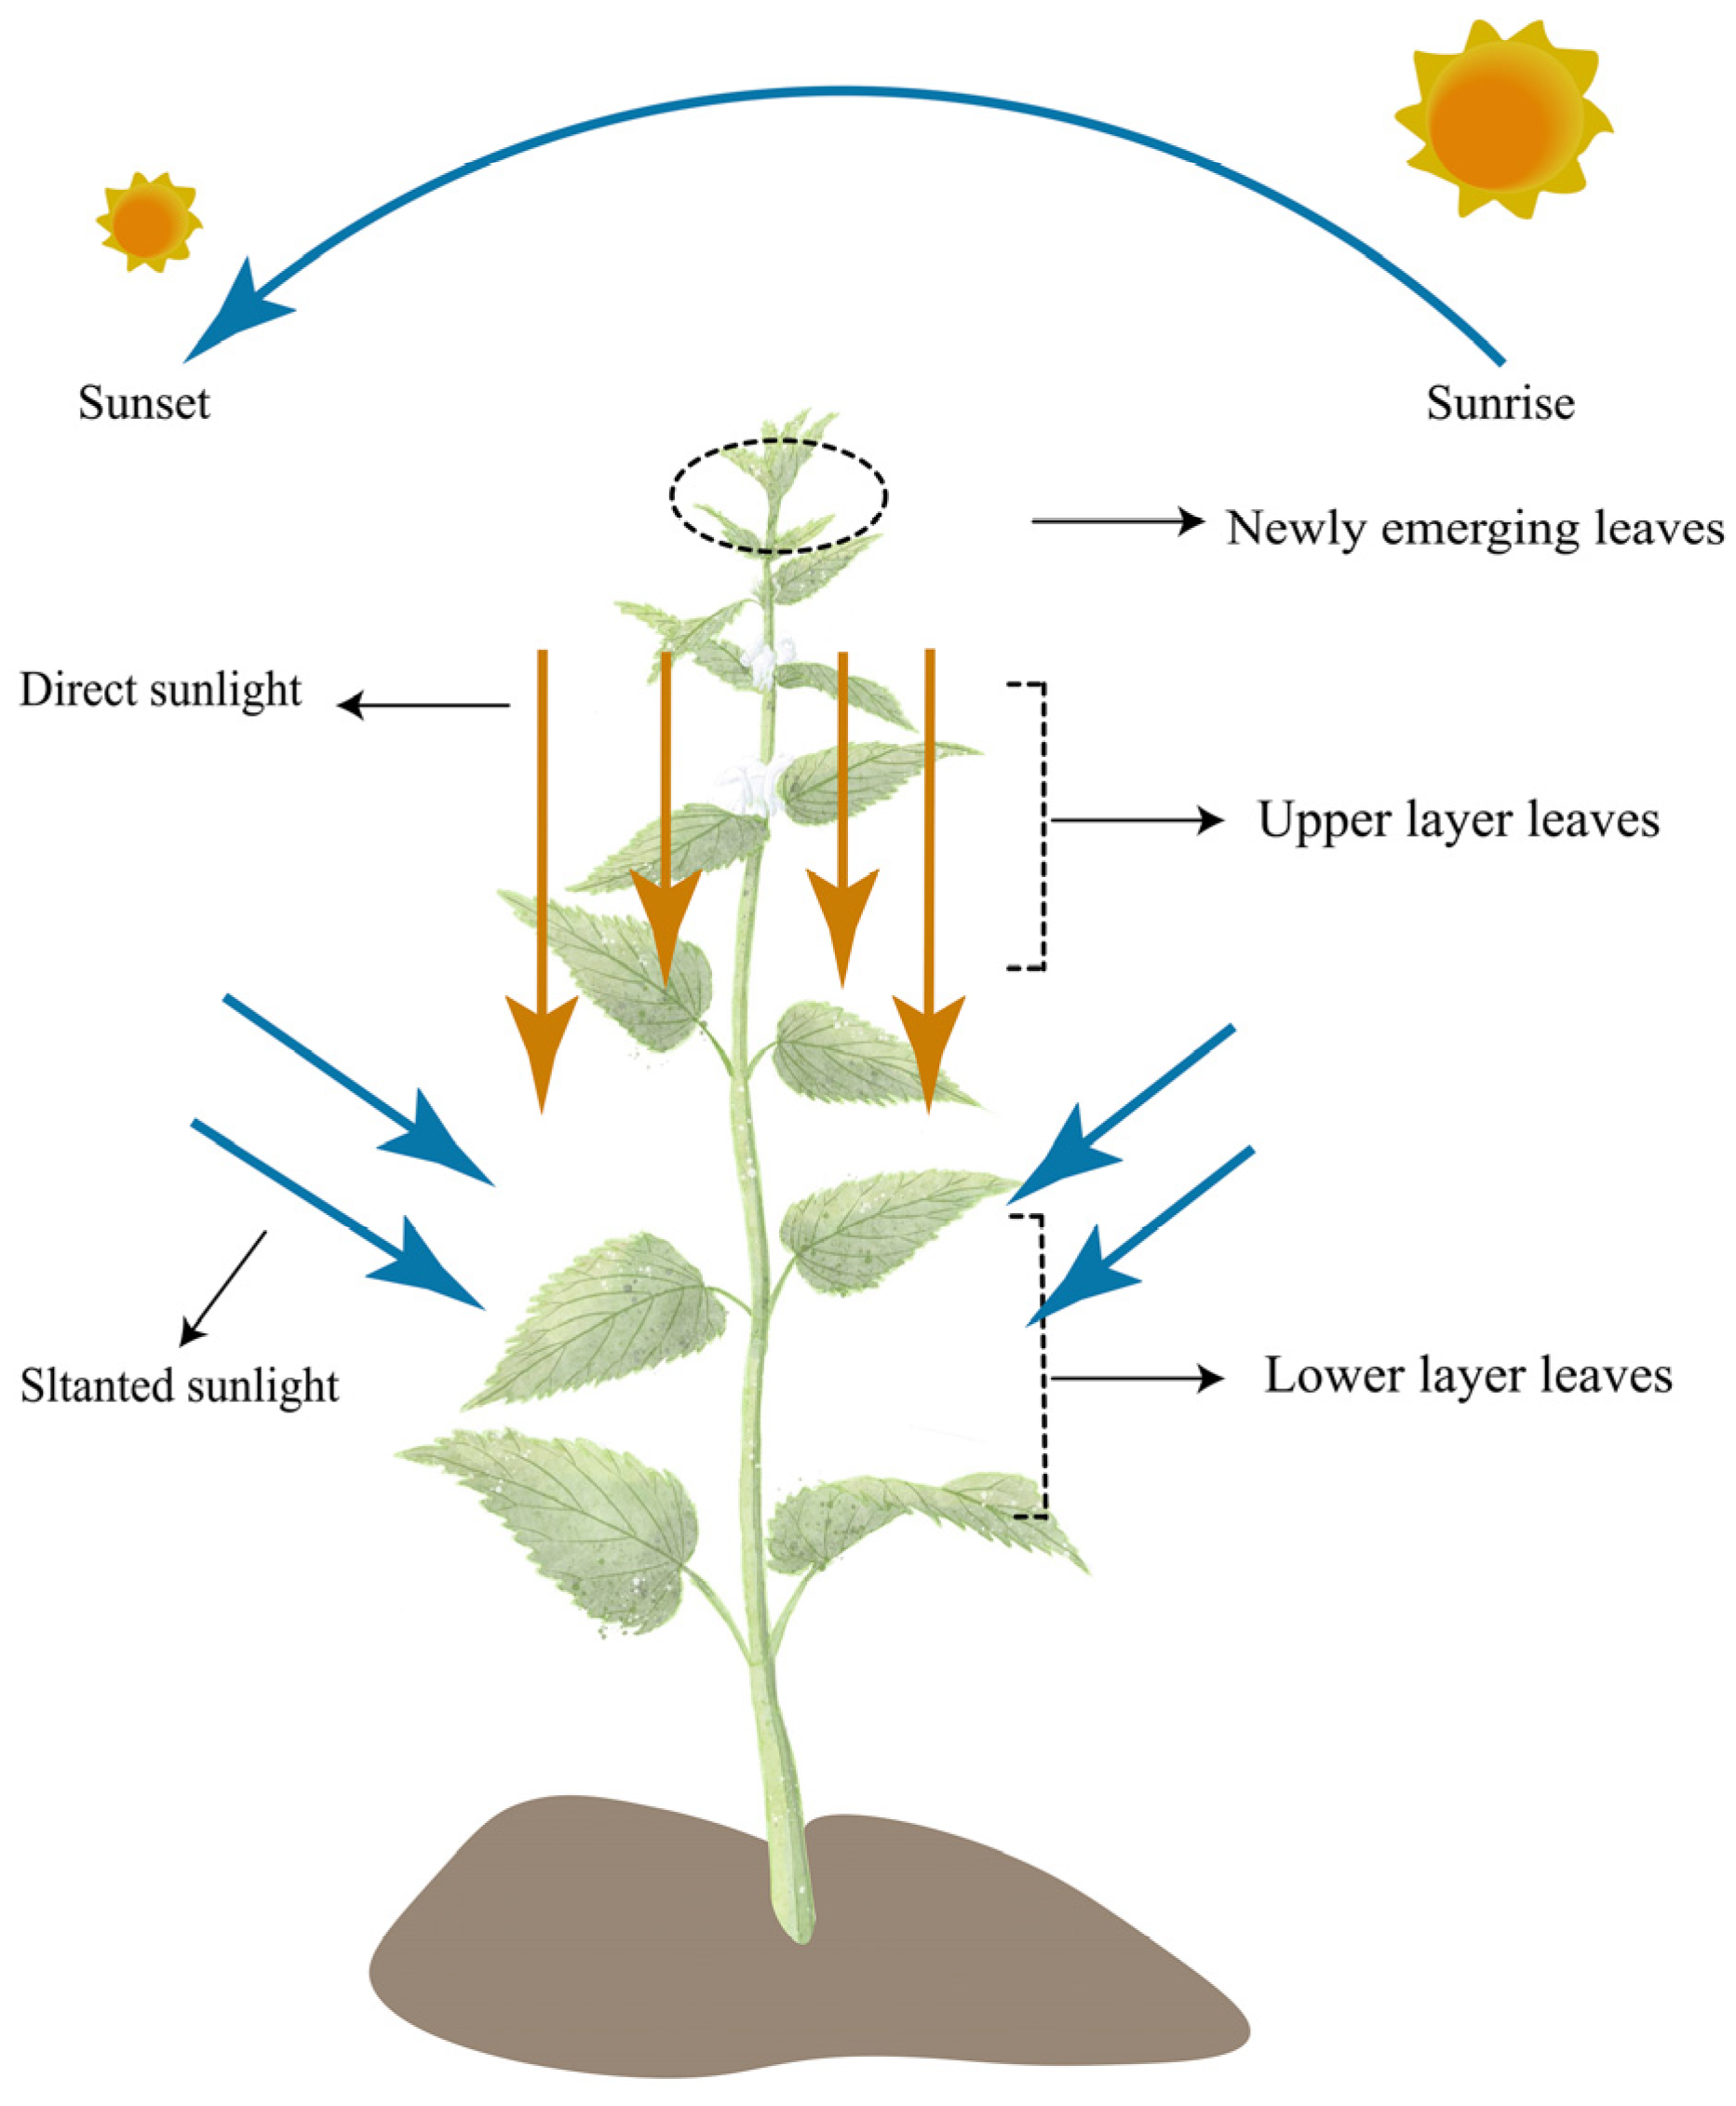
4.1. Leaf Biomass Allocation for Photosynthesis Area Across Vertical Positions
4.2. Leaf Biomass Allocation Photosynthesis Area Across Leaf–Shoot Orientations
5. Conclusions
Supplementary Materials
Author Contributions
Funding
Data Availability Statement
Acknowledgments
Conflicts of Interest
References
- Nakamura, Y.; Hashimoto, H. Characteristics of Photosynthate Partitioning during Chloroplast Development in Avena Leaves. Plant Physiol. 1988, 87, 458–462. [Google Scholar] [CrossRef]
- Adams, W.W., III; Terashima, I. (Eds.) The Leaf: A Platform for Performing Photosynthesis; Advances in Photosynthesis and Respiration; Springer International Publishing: Cham, Switzerland, 2018; Volume 44, ISBN 978-3-319-93592-8. [Google Scholar]
- Niklas, K.J.; Shi, P.; Gielis, J.; Schrader, J.; Niinemets, Ü. Editorial: Leaf Functional Traits: Ecological and Evolutionary Implications. Front. Plant Sci. 2023, 14, 1169558. [Google Scholar] [CrossRef] [PubMed]
- Huang, W.; Gielis, J.; Shi, P. Editorial: The Adaptation, Plasticity and Extinction of Forest Plants to Climate Change: Mechanisms behind the Morphological, Physiological, Phenological and Ecological Traits. Front. Ecol. Evol. 2024, 12, 1488465. [Google Scholar] [CrossRef]
- Wright, I.J.; Reich, P.B.; Cornelissen, J.H.C.; Falster, D.S.; Groom, P.K.; Hikosaka, K.; Lee, W.; Lusk, C.H.; Niinemets, Ü.; Oleksyn, J.; et al. Modulation of Leaf Economic Traits and Trait Relationships by Climate. Glob. Ecol. Biogeogr. 2005, 14, 411–421. [Google Scholar] [CrossRef]
- Shipley, B.; Lechowicz, M.J.; Wright, I.; Reich, P.B. Fundamental Trade-Offs Generating the Worldwide Leaf Economics Epectrum. Ecology 2006, 87, 535–541. [Google Scholar] [CrossRef]
- Dolezal, J.; Jandova, V.; Macek, M.; Liancourt, P. Contrasting Biomass Allocation Responses across Ontogeny and Stress Gradients Reveal Plant Adaptations to Drought and Cold. Funct. Ecol. 2021, 35, 32–42. [Google Scholar] [CrossRef]
- Bond-Lamberty, B.; Haddock, L.M.; Pennington, S.C.; Sezen, U.U.; Shue, J.; Megonigal, J.P. Salinity Exposure Affects Lower-Canopy Specific Leaf Area of Upland Trees in a Coastal Deciduous Forest. For. Ecol. Manag. 2023, 548, 121404. [Google Scholar] [CrossRef]
- Niinemets, Ü.; Portsmuth, A.; Tena, D.; Tobias, M.; Matesanz, S.; Valladares, F. Do We Underestimate the Importance of Leaf Size in Plant Economics? Disproportional Scaling of Support Costs within the Spectrum of Leaf Physiognomy. Ann. Bot. 2007, 100, 283–303. [Google Scholar] [CrossRef] [PubMed]
- Mu, Y.; He, K.; Shi, P.; Wang, L.; Deng, L.; Shi, Z.; Liu, M.; Niklas, K.J. Comparison between Computer Recognition and Manual Measurement Methods for the Estimation of Leaf Area. Ann. Bot. 2024, 134, 501–510. [Google Scholar] [CrossRef]
- Wright, I.J.; Reich, P.B.; Westoby, M.; Ackerly, D.D.; Baruch, Z.; Bongers, F.; Cavender-Bares, J.; Chapin, T.; Cornelissen, J.H.C.; Diemer, M.; et al. The Worldwide Leaf Economics Spectrum. Nature 2004, 428, 821–827. [Google Scholar] [CrossRef]
- Li, G.; Yang, D.; Sun, S. Allometric Relationships between Lamina Area, Lamina Mass and Petiole Mass of 93 Temperate Woody Species Vary with Leaf Habit, Leaf Form and Altitude. Funct. Ecol. 2008, 22, 557–564. [Google Scholar] [CrossRef]
- Guo, X.; Schrader, J.; Shi, P.; Jiao, Y.; Miao, Q.; Xue, J.; Niklas, K.J. Leaf-Age and Petiole Biomass Play Significant Roles in Leaf Scaling Theory. Front. Plant Sci. 2023, 14, 1322245. [Google Scholar] [CrossRef] [PubMed]
- Poorter, H.; Niinemets, Ü.; Poorter, L.; Wright, I.J.; Villar, R. Causes and Consequences of Variation in Leaf Mass per Area (LMA): A Meta-analysis. New Phytol. 2009, 182, 565–588. [Google Scholar] [CrossRef]
- Niklas, K.J. Plant Allometry: The Scaling of Form and Process; The University of Chicago Press: Chicago, IL, USA, 1994. [Google Scholar]
- Enquist, B.J. Universal Scaling in Tree and Vascular Plant Allometry: Toward a General Quantitative Theory Linking Plant Form and Function from Cells to Ecosystems. Tree Physiol. 2002, 22, 1045–1064. [Google Scholar] [CrossRef]
- Niklas, K.J.; Cobb, E.D.; Niinemets, Ü.; Reich, P.B.; Sellin, A.; Shipley, B.; Wright, I.J. “Diminishing Returns” in the Scaling of Functional Leaf Traits across and within Species Groups. Proc. Natl. Acad. Sci. USA 2007, 104, 8891–8896. [Google Scholar] [CrossRef] [PubMed]
- Milla, R.; Reich, P.B. The Scaling of Leaf Area and Mass: The Cost of Light Interception Increases with Leaf Size. Proc. R. Soc. B Biol. Sci. 2007, 274, 2109–2115. [Google Scholar] [CrossRef]
- Niklas, K.J.; Cobb, E.D.; Spatz, H.-C. Predicting the Allometry of Leaf Surface Area and Dry Mass. Am. J. Bot. 2009, 96, 531–536. [Google Scholar] [CrossRef]
- Ye, Y.; Kitayama, K.; Onoda, Y. A Cost–Benefit Analysis of Leaf Carbon Economy with Consideration of Seasonal Changes in Leaf Traits for Sympatric Deciduous and Evergreen Congeners: Implications for Their Coexistence. New Phytol. 2022, 234, 1047–1058. [Google Scholar] [CrossRef]
- Pan, S.; Liu, C.; Zhang, W.; Xu, S.; Wang, N.; Li, Y.; Gao, J.; Wang, Y.; Wang, G. The Scaling Relationships between Leaf Mass and Leaf Area of Vascular Plant Species Change with Altitude. PLoS ONE 2013, 8, e76872. [Google Scholar] [CrossRef]
- Thakur, D.; Rathore, N.; Chawla, A. Increase in Light Interception Cost and Metabolic Mass Component of Leaves Are Coupled for Efficient Resource Use in the High Altitude Vegetation. Oikos 2019, 128, 254–263. [Google Scholar] [CrossRef]
- Jiao, Y.; Niklas, K.J.; Wang, L.; Yu, K.; Li, Y.; Shi, P. Influence of Leaf Age on the Scaling Relationships of Lamina Mass vs. Area. Front. Plant Sci. 2022, 13, 860206. [Google Scholar] [CrossRef] [PubMed]
- Chen, L.; He, K.; Shi, P.; Lian, M.; Yao, W.; Niklas, K.J. Influence of Tree Size on the Scaling Relationships of Lamina and Petiole Traits: A Case Study Using Camptotheca Acuminata Decne. Ecol. Evol. 2024, 14, e70066. [Google Scholar] [CrossRef] [PubMed]
- Wright, I.J.; Reich, P.B.; Westoby, M. Strategy Shifts in Leaf Physiology, Structure and Nutrient Content between Species of High- and Low-rainfall and High- and Low-nutrient Habitats. Funct. Ecol. 2001, 15, 423–434. [Google Scholar] [CrossRef]
- Atkinson, L.J.; Campbell, C.D.; Zaragoza-Castells, J.; Hurry, V.; Atkin, O.K. Impact of Growth Temperature on Scaling Relationships Linking Photosynthetic Metabolism to Leaf Functional Traits. Funct. Ecol. 2010, 24, 1181–1191. [Google Scholar] [CrossRef]
- Chen, R.; Xiao, S.; Dong, C.; Xie, S.; Zhang, L.; Wu, F.; Tu, C.; Liu, Q.-X.; Wang, S.; Niinemets, Ü.; et al. Ontogenetic Shifts in Leaf Biomass Allocation in Crop Plants. Natl. Sci. Rev. 2024, 11, nwae349. [Google Scholar] [CrossRef]
- Nicotra, A.B.; Atkin, O.K.; Bonser, S.P.; Davidson, A.M.; Finnegan, E.J.; Mathesius, U.; Poot, P.; Purugganan, M.D.; Richards, C.L.; Valladares, F.; et al. Plant Phenotypic Plasticity in a Changing Climate. Trends Plant Sci. 2010, 15, 684–692. [Google Scholar] [CrossRef] [PubMed]
- Sack, L.; Melcher, P.J.; Liu, W.H.; Middleton, E.; Pardee, T. How Strong Is Intracanopy Leaf Plasticity in Temperate Deciduous Trees? Am. J. Bot. 2006, 6, 829–839. [Google Scholar] [CrossRef]
- Koike, T.; Kitao, M.; Maruyama, Y.; Mori, S.; Lei, T.T. Leaf Morphology and Photosynthetic Adjustments among Deciduous Broad-Leaved Trees within the Vertical Canopy Profile. Tree Physiol. 2001, 21, 951–958. [Google Scholar] [CrossRef]
- Coble, A.P.; Cavaleri, M.A. Vertical Leaf Mass per Area Gradient of Mature Sugar Maple Reflects Both Height-Driven Increases in Vascular Tissue and Light-Driven Increases in Palisade Layer Thickness. Tree Physiol. 2017, 37, 1337–1351. [Google Scholar] [CrossRef]
- Valladares, F.; Pearcy, R.W. The Geometry of Light Interception by Shoots of Heteromeles Arbutifolia: Morphological and Physiological Consequences for Individual Leaves. Oecologia 1999, 121, 171–182. [Google Scholar] [CrossRef]
- Iio, A.; Fukasawa, H.; Nose, Y.; Kato, S.; Kakubari, Y. Vertical, Horizontal and Azimuthal Variations in Leaf Photosynthetic Characteristics within a Fagus Crenata Crown in Relation to Light Acclimation. Tree Physiol. 2005, 25, 533–544. [Google Scholar] [CrossRef]
- Sarlikioti, V.; De Visser, P.H.B.; Marcelis, L.F.M. Exploring the Spatial Distribution of Light Interception and Photosynthesis of Canopies by Means of a Functional–Structural Plant Model. Ann. Bot. 2011, 107, 875–883. [Google Scholar] [CrossRef]
- Hikosaka, K.; Niinemets, Ü.; Anten, N.P.R. (Eds.) Canopy Photosynthesis: From Basics to Applications; Advances in Photosynthesis and Respiration; Springer: Dordrecht, The Netherlands, 2016; Volume 42, ISBN 978-94-017-7290-7. [Google Scholar]
- Fotis, A.T.; Curtis, P.S. Effects of Structural Complexity on Within-Canopy Light Environments and Leaf Traits in a Northern Mixed Deciduous Forest. Tree Physiol. 2017, 37, 1426–1435. [Google Scholar] [CrossRef] [PubMed]
- Asner, G.P.; Martin, R.E.; Carranza-Jiménez, L.; Sinca, F.; Tupayachi, R.; Anderson, C.B.; Martinez, P. Functional and Biological Diversity of Foliar Spectra in Tree Canopies throughout the Andes to Amazon Region. New Phytol. 2014, 204, 127–139. [Google Scholar] [CrossRef] [PubMed]
- Challis, A.; Rymer, P.D.; Ahrens, C.W.; Hardy, G.; Byrne, M.; Ruthrof, K.X.; Tissue, D.T. Environmental and Genetic Drivers of Physiological and Functional Traits in a Key Canopy Species. Environ. Exp. Bot. 2024, 226, 105904. [Google Scholar] [CrossRef]
- De Freitas, G.V.; Da Cunha, M.; Vitória, A.P. A Systematic Review of Leaf and Wood Traits in the Neotropics: Environmental Gradients and Functionality. Trees 2024, 38, 551–572. [Google Scholar] [CrossRef]
- Osnas, J.L.D.; Lichstein, J.W.; Reich, P.B.; Pacala, S.W. Global Leaf Trait Relationships: Mass, Area, and the Leaf Economics Spectrum. Science 2013, 340, 741–744. [Google Scholar] [CrossRef] [PubMed]
- Koester, R.P.; Skoneczka, J.A.; Cary, T.R.; Diers, B.W.; Ainsworth, E.A. Historical Gains in Soybean (Glycine Max Merr.) Seed Yield Are Driven by Linear Increases in Light Interception, Energy Conversion, and Partitioning Efficiencies. J. Exp. Bot. 2014, 65, 3311–3321. [Google Scholar] [CrossRef] [PubMed]
- Editorial Committee of the Flora of China Lamium Linnaeus. Flora of China; Science Press: Beijing, China, 1994; Volume 17, p. 157. [Google Scholar]
- Shi, P.; Ratkowsky, D.; Li, Y.; Zhang, L.; Lin, S.; Gielis, J. A General Leaf Area Geometric Formula Exists for Plants—Evidence from the Simplified Gielis Equation. Forests 2018, 9, 714. [Google Scholar] [CrossRef]
- Shi, P.; Gielis, J.; Quinn, B.K.; Niklas, K.J.; Ratkowsky, D.A.; Schrader, J.; Ruan, H.; Wang, L.; Niinemets, Ü. ‘Biogeom’: An R Package for Simulating and Fitting Natural Shapes. Ann. N. Y. Acad. Sci. 2022, 1516, 123–134. [Google Scholar] [CrossRef]
- R Core Team R: A Language and Environment for Statistical Computing; The R Foundation for Statistical Computing: Vienna, Austria, 2022.
- Smith, R.J. Use and Misuse of the Reduced Major Axis for Line-Fitting. Am. J. Phys. Anthropol. 2009, 140, 476–486. [Google Scholar] [CrossRef] [PubMed]
- Efron, B.; Tibshirani, R.J. An Introduction to the Bootstrap; Chapman and Hall/CRC: New York, NY, USA, 1993. [Google Scholar]
- Sandhu, H.S.; Shi, P.; Kuang, X.; Xue, F.; Ge, F. Applications of the Bootstrap to Insect Physiology. Fla. Entomol. 2011, 94, 1036–1041. [Google Scholar] [CrossRef]
- Warton, D.I.; Weber, N.C. Common Slope Tests for Bivariate Errors-in-Variables Models. Biom. J. 2002, 44, 161–174. [Google Scholar] [CrossRef]
- Yamori, W.; Evans, J.R.; Von Caemmerer, S. Effects of Growth and Measurement Light Intensities on Temperature Dependence of CO2 Assimilation Rate in Tobacco Leaves. Plant Cell Environ. 2010, 33, 332–343. [Google Scholar] [CrossRef]
- Coble, A.P.; Cavaleri, M.A. Light Drives Vertical Gradients of Leaf Morphology in a Sugar Maple (Acer Saccharum) Forest. Tree Physiol. 2014, 34, 146–158. [Google Scholar] [CrossRef] [PubMed]
- Lafont, T.R.; Gallant, M.C.; Julien, F.; Céréghino, R.; Leroy, C. Light Intensity Mediates Phenotypic Plasticity and Leaf Trait Regionalization in a Tank Bromeliad. Ann. Bot. 2023, 132, 443–454. [Google Scholar] [CrossRef]
- Sterck, F.J.; Bongers, F. Crown Development in Tropical Rain Forest Trees: Patterns with Tree Height and Light Availability. J. Ecol. 2001, 89, 1–13. [Google Scholar] [CrossRef]
- Liu, Z.; Zhao, M.; Zhang, H.; Ren, T.; Liu, C.; He, N. Divergent Response and Adaptation of Specific Leaf Area to Environmental Change at Different Spatio-temporal Scales Jointly Improve Plant Survival. Glob. Change Biol. 2023, 29, 1144–1159. [Google Scholar] [CrossRef]
- Zhang, J.; Ge, J.; Dayananda, B.; Li, J. Effect of Light Intensities on the Photosynthesis, Growth and Physiological Performances of Two Maple Species. Front. Plant Sci. 2022, 13, 999026. [Google Scholar] [CrossRef]
- West, G.B.; Brown, J.H. The Origin of Allometric Scaling Laws in Biology from Genomes to Ecosystems: Towards a Quantitative Unifying Theory of Biological Structure and Organization. J. Exp. Biol. 2005, 208, 1575–1592. [Google Scholar] [CrossRef]
- Oldham, A.R.; Sillett, S.C.; Tomescu, A.M.F.; Koch, G.W. The Hydrostatic Gradient, Not Light Availability, Drives Height-related Variation in Sequoia Sempervirens (Cupressaceae) Leaf Anatomy. Am. J. Bot. 2010, 97, 1087–1097. [Google Scholar] [CrossRef]
- Kalve, S.; Fotschki, J.; Beeckman, T.; Vissenberg, K.; Beemster, G.T.S. Three-Dimensional Patterns of Cell Division and Expansion throughout the Development of Arabidopsis Thaliana Leaves. J. Exp. Bot. 2014, 65, 6385–6397. [Google Scholar] [CrossRef]
- Butrim, M.J.; Royer, D.L.; Miller, I.M.; Dechesne, M.; Neu-Yagle, N.; Lyson, T.R.; Johnson, K.R.; Barclay, R.S. No Consistent Shift in Leaf Dry Mass per Area Across the Cretaceous—Paleogene Boundary. Front. Plant Sci. 2022, 13, 894690. [Google Scholar] [CrossRef]
- López, R.; Cano, F.J.; Martin-StPaul, N.K.; Cochard, H.; Choat, B. Coordination of Stem and Leaf Traits Define Different Strategies to Regulate Water Loss and Tolerance Ranges to Aridity. New Phytol. 2021, 230, 497–509. [Google Scholar] [CrossRef]
- Filartiga, A.L.; Klimeš, A.; Altman, J.; Nobis, M.P.; Crivellaro, A.; Schweingruber, F.; Doležal, J. Comparative Anatomy of Leaf Petioles in Temperate Trees and Shrubs: The Role of Plant Size, Environment and Phylogeny. Ann. Bot. 2022, 129, 567–582. [Google Scholar] [CrossRef] [PubMed]
- Westoby, M.; Wright, I.J. The Leaf Size—Twig Size Spectrum and Its Relationship to Other Important Spectra of Variation among Species. Oecologia 2003, 135, 621–628. [Google Scholar] [CrossRef] [PubMed]
- Funk, J.L.; Vitousek, P.M. Resource-Use Efficiency and Plant Invasion in Low-Resource Systems. Nature 2007, 446, 1079–1081. [Google Scholar] [CrossRef] [PubMed]
- Wang, H.; Prentice, I.C.; Wright, I.J.; Warton, D.I.; Qiao, S.; Xu, X.; Zhou, J.; Kikuzawa, K.; Stenseth, N.C. Leaf Economics Fundamentals Explained by Optimality Principles. Sci. Adv. 2023, 9, eadd5667. [Google Scholar] [CrossRef] [PubMed]
- Li, Y.; Shi, P.; Niinemets, Ü.; Song, Y.; Yu, K.; Schrader, J.; Niklas, K.J. Diminishing Returns among Lamina Fresh and Dry Mass, Surface Area, and Petiole Fresh Mass among Nine Lauraceae Species. Am. J. Bot. 2022, 109, 377–392. [Google Scholar] [CrossRef]
- Niinemets, U.; Kull, O. Biomass Investment in Leaf Lamina versus Lamina Support in Relation to Growth Irradiance and Leaf Size in Temperate Deciduous Trees. Tree Physiol. 1999, 19, 349–358. [Google Scholar] [CrossRef]
- Niklas, K.J. A Mechanical Perspective on Foliage Leaf Form and Function. New Phytol. 1999, 143, 19–31. [Google Scholar] [CrossRef]
- Niinemets, Ü.; Portsmuth, A.; Tobias, M. Leaf Size Modifies Support Biomass Distribution among Stems, Petioles and Mid-ribs in Temperate Plants. New Phytol. 2006, 171, 91–104. [Google Scholar] [CrossRef] [PubMed]


| Leaf Traits | Source of Variation | Sum of Squares | Degrees of Freedom | Mean Square | F Value | p Value |
|---|---|---|---|---|---|---|
| log (M) | LSO | 0.13 | 3 | 0.04 | 0.282 | 0.838 |
| VP | 109.75 | 1 | 109.75 | 715.672 | <0.001 | |
| VP | 0.22 | 3 | 0.07 | 0.485 | 0.693 | |
| Residuals | 266.52 | 1738 | 0.15 | |||
| log (A) | LSO | 0.07 | 3 | 0.02 | 0.136 | 0.939 |
| VP | 97.05 | 1 | 97.05 | 603.252 | <0.001 | |
| VP | 0.26 | 3 | 0.09 | 0.536 | 0.658 | |
| Residuals | 279.60 | 1738 | 0.16 | |||
| LMA | LSO | 39 | 3 | 12.98 | 0.870 | 0.456 |
| VP | 158 | 1 | 158.28 | 10.610 | <0.01 | |
| VP | 21 | 3 | 7.14 | 0.478 | 0.697 | |
| Residuals | 25926 | 1738 | 14.92 |
| Spatial Positions | Sample Size | Fitted Equation | 95% Confidence Interval of the Slope | 95% Confidence Interval of the Intercept | r2 |
|---|---|---|---|---|---|
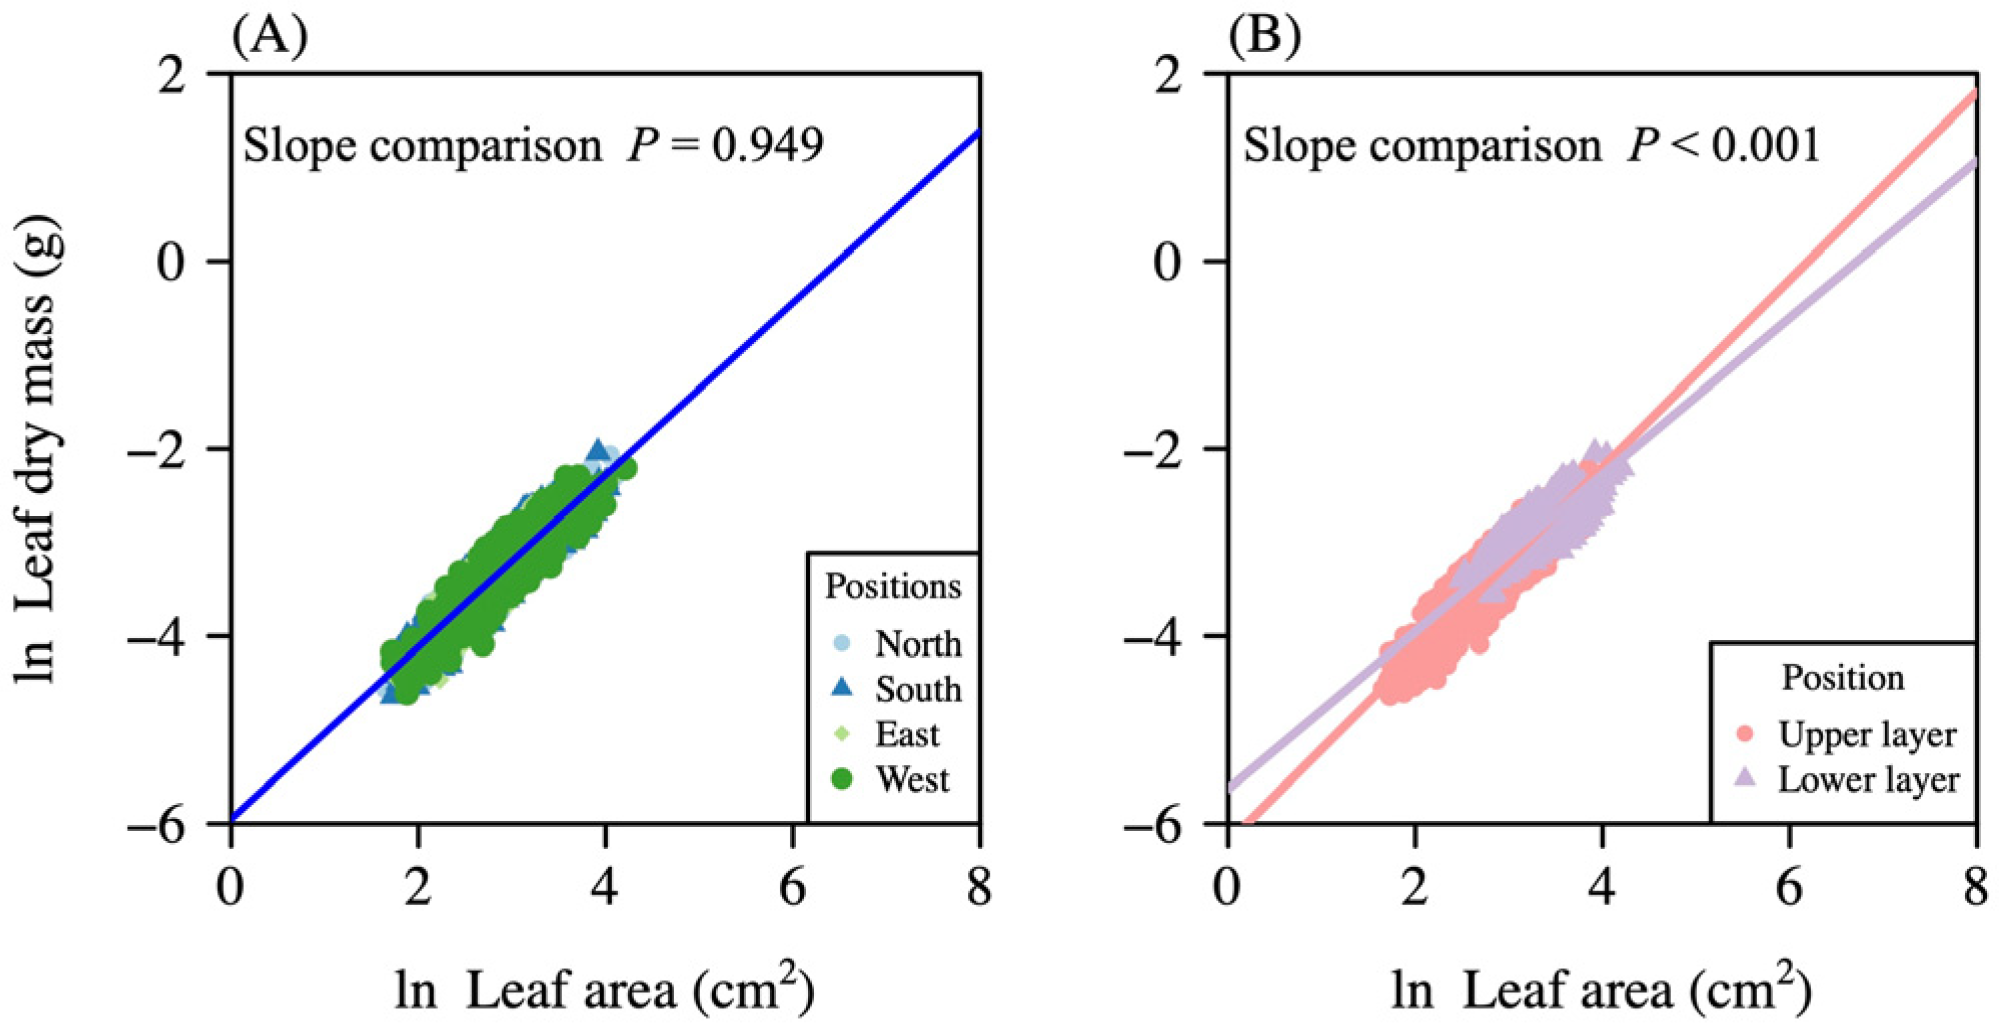
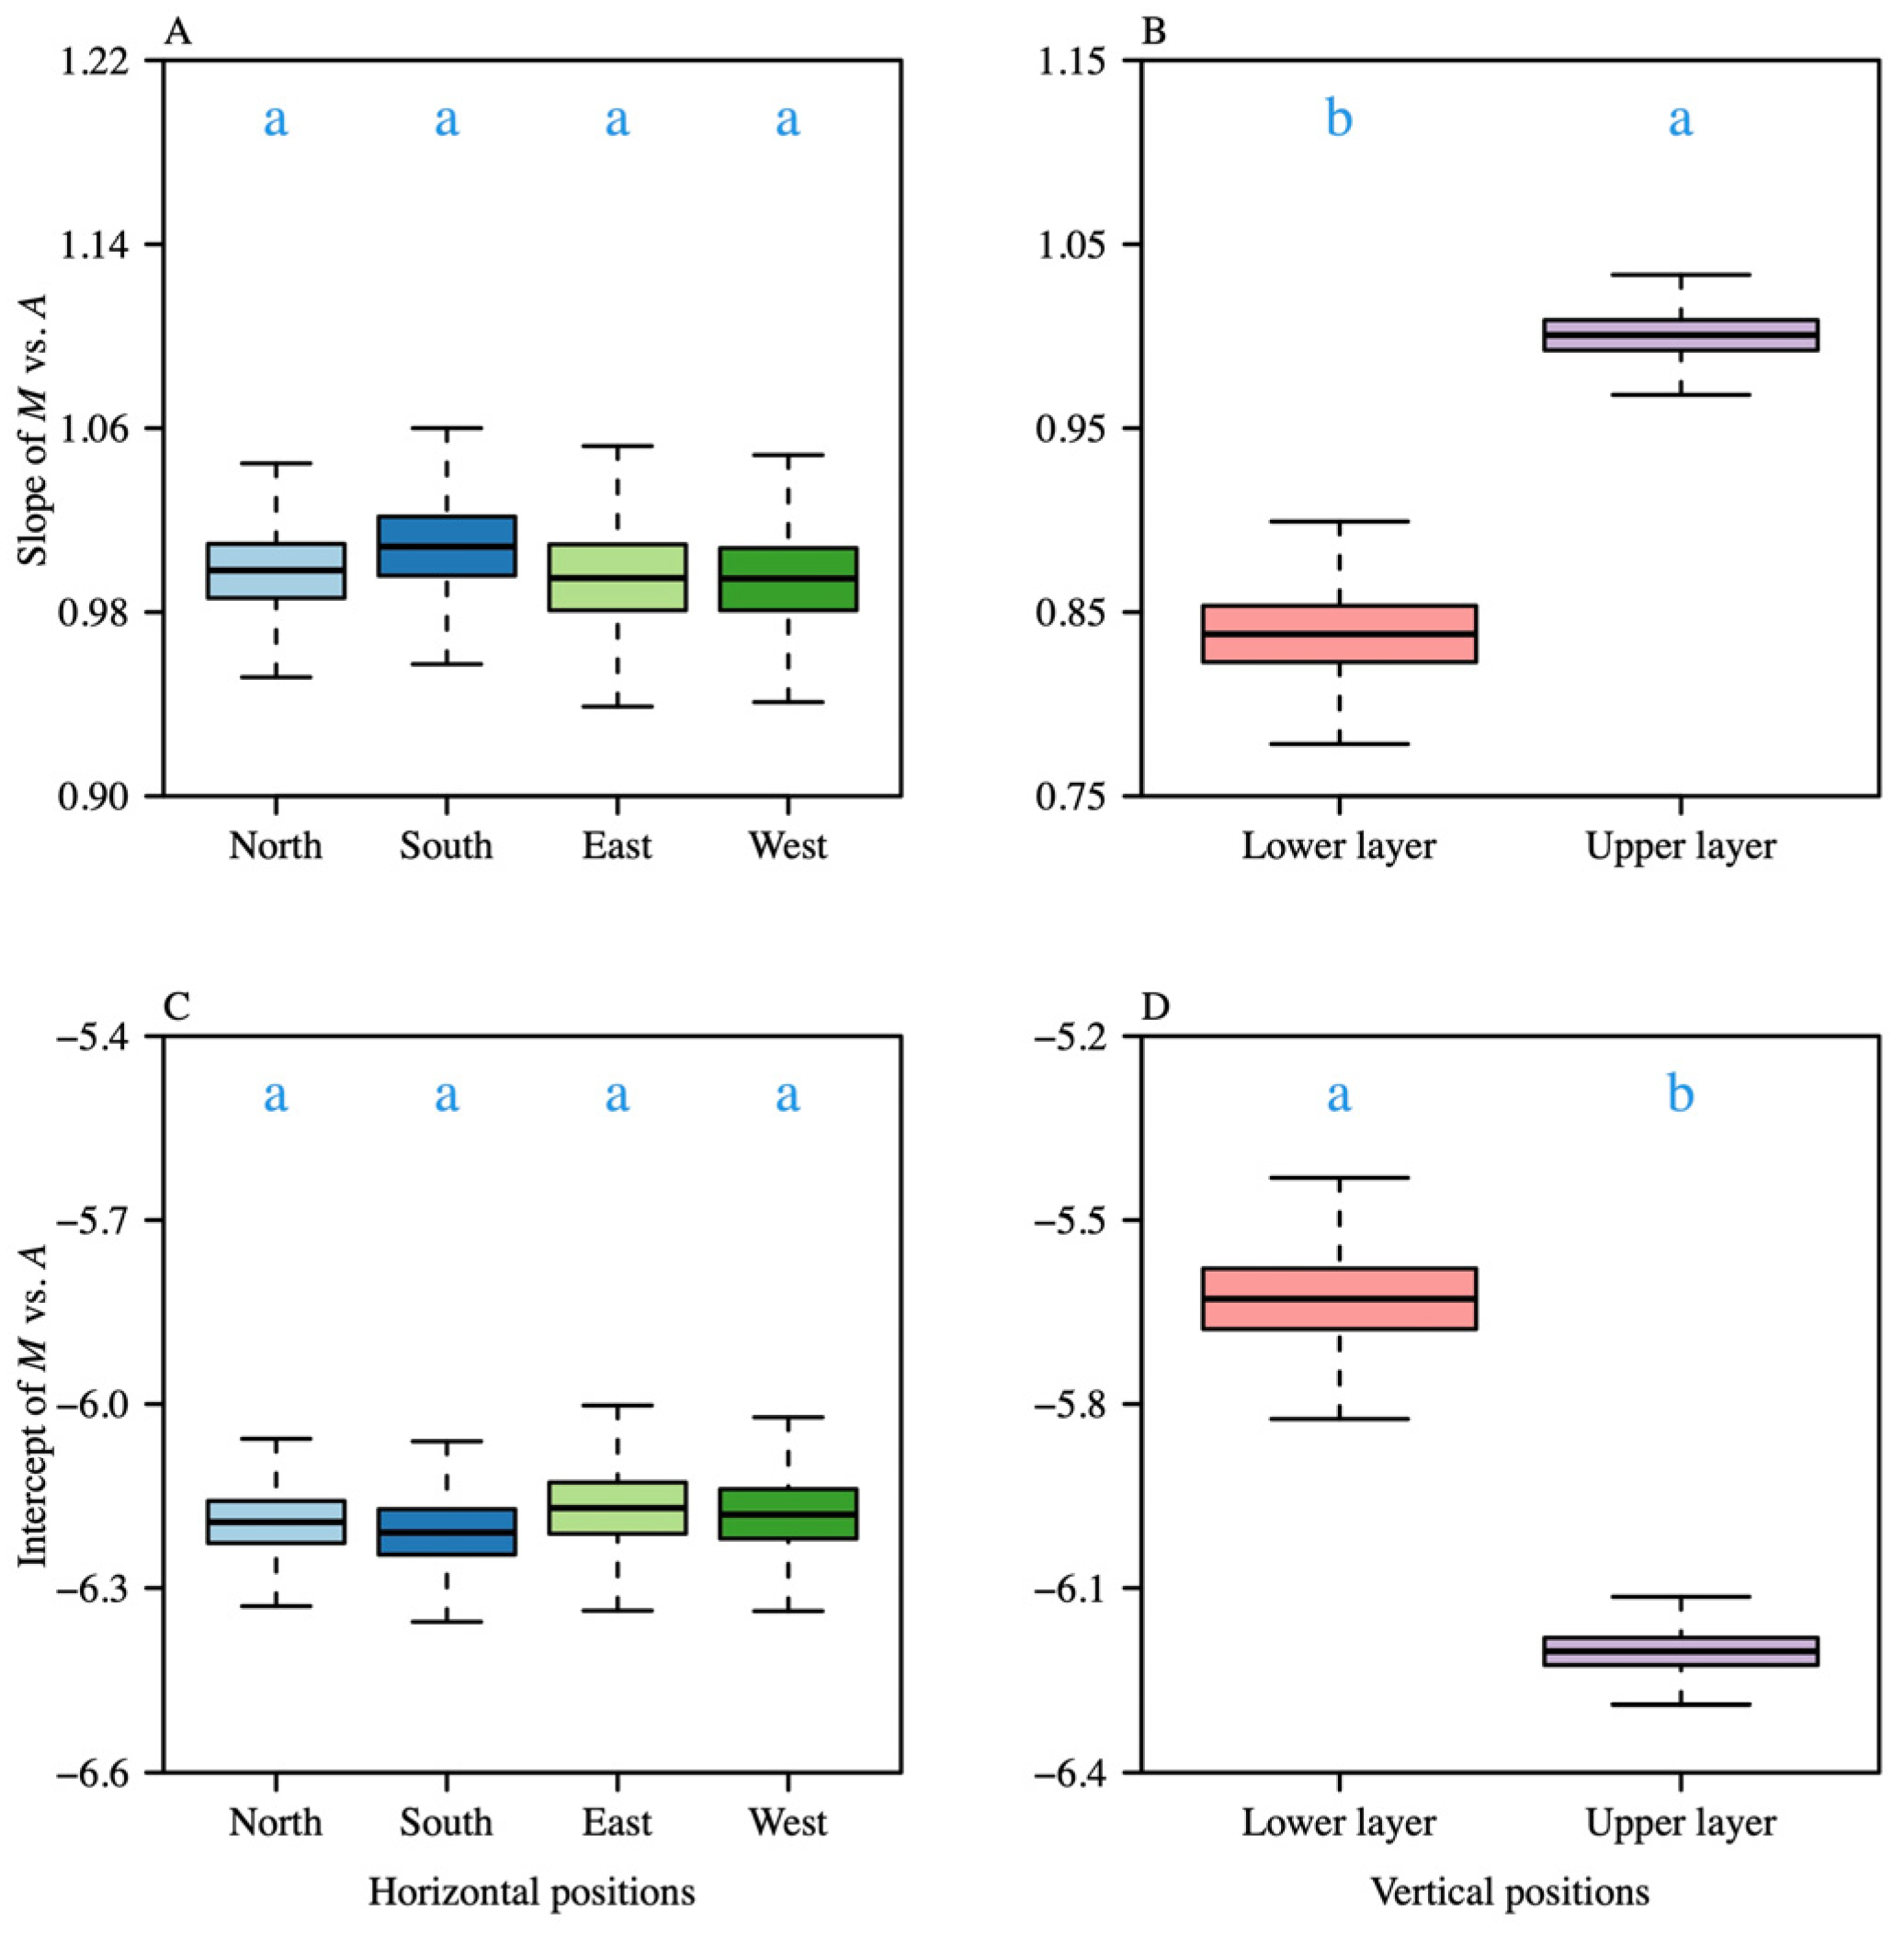
| Pooled data | 1746 | y = −6.189 + 0.999 x | (0.981, 1.019) | (−6.245, −6.134) | 0.824 |
| North | 450 | y = −6.193 + 0.998 x | (0.964, 1.034) | (−6.297, −6.093) | 0.843 |
| South | 450 | y = −6.209 + 1.009 x | (0.971, 1.047) | (−6.321, −6.099) | 0.826 |
| East | 423 | y = −6.171 + 0.995 x | (0.955, 1.036) | (−6.289, −6.051) | 0.808 |
| West | 423 | y = −6.179 + 0.994 x | (0.995, 1.034) | (−6.295, −6.064) | 0.816 |
| Lower layer | 472 | y = −5.630 + 0.838 x | (0.793, 0.884) | (−5.780, −5.485) | 0.545 |
| Upper layer | 1274 | y = −6.202 + 1.001 x | (0.977, 1.025) | (−6.268, −6.137) | 0.790 |
Disclaimer/Publisher’s Note: The statements, opinions and data contained in all publications are solely those of the individual author(s) and contributor(s) and not of MDPI and/or the editor(s). MDPI and/or the editor(s) disclaim responsibility for any injury to people or property resulting from any ideas, methods, instructions or products referred to in the content. |
© 2025 by the authors. Licensee MDPI, Basel, Switzerland. This article is an open access article distributed under the terms and conditions of the Creative Commons Attribution (CC BY) license (https://creativecommons.org/licenses/by/4.0/).
Share and Cite
Guo, X.; Zheng, Y.; Chen, Y.; Zhou, Z.; Xue, J. Intra-Plant Variation in Leaf Dry Mass per Area (LMA): Effects of Leaf–Shoot Orientation and Vertical Position on Dry Mass and Area Scaling. Forests 2025, 16, 724. https://doi.org/10.3390/f16050724
Guo X, Zheng Y, Chen Y, Zhou Z, Xue J. Intra-Plant Variation in Leaf Dry Mass per Area (LMA): Effects of Leaf–Shoot Orientation and Vertical Position on Dry Mass and Area Scaling. Forests. 2025; 16(5):724. https://doi.org/10.3390/f16050724
Chicago/Turabian StyleGuo, Xuchen, Yiwen Zheng, Yuanmiao Chen, Zhidong Zhou, and Jianhui Xue. 2025. "Intra-Plant Variation in Leaf Dry Mass per Area (LMA): Effects of Leaf–Shoot Orientation and Vertical Position on Dry Mass and Area Scaling" Forests 16, no. 5: 724. https://doi.org/10.3390/f16050724
APA StyleGuo, X., Zheng, Y., Chen, Y., Zhou, Z., & Xue, J. (2025). Intra-Plant Variation in Leaf Dry Mass per Area (LMA): Effects of Leaf–Shoot Orientation and Vertical Position on Dry Mass and Area Scaling. Forests, 16(5), 724. https://doi.org/10.3390/f16050724