Article

Cold-Season Precipitation and Latitudinal Differences Are Key Drivers of Salix alba Genetic Diversity in Arid Zones

1
College of Life Science, Shihezi University, Shihezi 832003, China
2
Xinjiang Production and Construction Corps Key Laboratory of Oasis Town and Mountain-Basin System Ecology, Shihezi 832003, China
*
Author to whom correspondence should be addressed.
Forests 2025, 16(5), 725; https://doi.org/10.3390/f16050725
Submission received: 16 March 2025 / Revised: 17 April 2025 / Accepted: 22 April 2025 / Published: 24 April 2025
(This article belongs to the Section Forest Biodiversity)

Abstract

:
Salix alba L. (Linnaeus, 1753; Salicaceae), a widely distributed riparian species, remains understudied regarding its genetic diversity patterns and driving factors in arid zone ecosystems. In this study, 320 Salix alba samples were collected from 10 geographic unit groups in Xinjiang, China, a typical arid zone, and analyzed using a comprehensive approach that incorporated SSR molecular marker technology with multi-dimensional data on geographic and climatic factors. The analysis revealed that: (1) The genetic diversity of Salix alba in the arid zone was found to be relatively rich, with populations in the humid areas of northern Xinjiang (e.g., Shannon’s index of I = 0.45 in Ili) significantly higher than those in the extreme arid regions of southern Xinjiang (e.g., Hotan), with I = 0.0762 in Yili. Further analysis using both STRUCTURE (K = 3) and PCoA methods confirmed the division of Salix alba populations in Xinjiang into three independent genetic clusters, with 65% of the observed genetic variation originating from differences between these populations. (2) Secondly, climatic factors exhibited higher explanatory power than geographic factors in elucidating variations in genetic distances among individuals. Cold season precipitation differences (Bio19, r = 0.621) and the coefficient of variation of annual precipitation (Bio17, r = 0.588) were identified as the primary drivers of these variations. Conversely, the latitudinal difference (r = 0.487) and geographic distance (r = 0.207) exhibited a significant impact on genetic distance, underscoring the importance of geo-graphic factors in shaping genetic variation.

1. Introduction

Salix alba, or white willow, is a deciduous tree that is common in the Northern Hemisphere [1] and is native to Europe, Western Asia and Central Asia. It is a diecious, wind-pollinated plant [2], with downy seeds that are widely dispersed by wind and water [3], and is naturally found in riparian zones and moist habitats.
As a widespread tree of the genus Salix in the Willow family, it is a typical species of riparian zones [4], and its natural distribution is concentrated in temperate and cold temperate wet habitats, playing a crucial role in maintaining the stability of riparian ecosystems [4,5,6]. However, due to its fast-growing characteristics and strong adaptability to drought, salinity, and other adversities [7], Salix alba is also found in the marginal oases of arid zones and along seasonal rivers. It is a dominant species in the plains and valley forests of the Erqi River basin in Xinjiang [8,9]. The majority of current research on Salix alba focuses on population genetic diversity in temperate riparian zones (e.g., the Danube River Basin in Europe) [10,11]. However, there is still a paucity of systematic analyses of the characteristics of Salix alba genetic diversity and the drivers of Salix alba within the arid zone.
Genetic diversity is the fundamental basis upon which species can adapt to environmental change and maintain their evolutionary potential [12,13]. In arid zones, environmental extremes exert a dual influence on plant genetic diversity. On the one hand, geographical isolation, such as that caused by mountain ranges or habitat fragmentation, can impede gene flow [14], thereby compelling populations to depend on self-fertilization or clonal reproduction. This, in turn, can result in a decline in genetic diversity [4,15,16]. To illustrate this point, consider the findings of research conducted on Tamarix chinensis L. in the Yellow River Delta. This research demonstrated that habitat fragmentation had a significant impact on population genetic diversity, with local oases exhibiting a capacity to maintain high gene flow through hydrological connectivity [17]. Conversely, strong selection pressures have been demonstrated to contribute to the maintenance of biodiversity through two mechanisms: high-frequency gene exchange and phenotypic plasticity [18,19]. Salix alba (e.g., Northern Salix P.) frequently achieves a balance between reproductive efficiency and genetic variation through clonal reproduction in conditions of drought stress. Furthermore, there is a significant correlation between genetic differentiation and geographic distance [20], suggesting that the synergistic effects of geographic isolation and climatic stress may significantly influence genetic structure.
Xinjiang, a typical arid region in the hinterland of the Eurasian continent, has a distinctive topography of ‘three mountains and two basins’ (Tianshan Mountains, Altay Mountains, and Kunlun Mountains separating the Tarim and Junggar basins) [21]. This geographical configuration has resulted in significant geographical isolation and marked differences in precipitation, thereby establishing the region as a natural experimental ground for analyzing the response of plant genetic diversity to environmental heterogeneity.
The present study focuses on a single environmental factor or a specific species, and there is still a paucity of systematic discussion on the changes of Salix alba genetic diversity under geo-climatic interactions. In light of this, the present study aims to analyze (1) the spatial characteristics of Salix alba genetic diversity in the arid zone, and (2) how the genetic differentiation of Salix alba is driven by geographic isolation and climate change through SSR molecular markers combined with geographic-climatic multidimensional analyses, with Salix alba as the target. The findings of this study will contribute to a more comprehensive understanding of the genetic differentiation factors of Salix alba in arid environments and will provide a theoretical foundation for the conservation of its genetic diversity in these zones.

2. Materials and Methods

2.1. Study Area

Xinjiang (73°40′–96°18′ E, 34°25′–49°10′ N) is located in the hinterland of the Asian-European continent and is a typical arid climate zone (average annual precipitation < 200 mm). Its geomorphological pattern is characterized by the Tianshan Mountains, Altay Mountains, and Kunlun Mountains, which surround the Tarim and Junggar Basins, forming multiple geographical barriers. The northern border is distinguished by a semi-humid climate (annual precipitation > 300 mm), influenced by the westerly wind belt. In contrast, the southern border is characterized by the expanses of an extremely arid desert (annual precipitation < 50 mm in the Taklamakan Desert). The eastern border and the Tianshan Mountain area represent an oasis-Gobi intertwined zone and a vertical climate zone, respectively.

2.2. Design of Experiments

2.2.1. Sample Collection

In this study, 320 samples of wild Salix alba were collected in Xinjiang in consecutive years (2022–2023). The GPS was utilized to locate the sample points, and the collected samples were stored in an ultra-low-temperature refrigerator (BCD-601WDPR, Haier, Qingdao, China) at −80 °C. To ensure the uniformity of the molecular experiments, they were conducted after collection to eliminate batch operation errors.
To ensure the spatial representativeness and ecological rationality of the samples, the whole territory was divided into 10 geographic unit groups according to the administrative divisions, and each group was further subdivided into independent populations according to the administrative boundaries at the county/corps level. (Table 1) This ensured that each population represented a geographic isolation (>50 km) and homogeneity of habitats (Figure 1). Despite the sampling design being based on administrative boundaries, the geographic isolation of the selected areas matched the climatic gradient (e.g., annual precipitation > 300 mm in the humid zone in the northern Xinjiang vs. <50 mm in the extreme arid zone in the southern Xinjiang) and covered the major eco-climatic zones of Xinjiang, such as the Tarim Basin Desert and the humid zone of the Ili Valley, so that the effects of environmental heterogeneity on genetic diversity could be analyzed effectively.

2.2.2. DNA Extraction and SSR Primer Selection

In this study, genomic DNA was extracted from 320 Salix alba leaf samples using the CTAB method [22]. The concentration and purity of the samples were measured using a NanoDrop-1000 spectrophotometer (Thermo Scientific, Wilmington, DE, USA) (A260/A280 ratio 1.8–2.0), and all samples were uniformly diluted to 50 ng/µL to eliminate batch errors.
The process of PCR amplification was conducted using a total of six samples in conjunction with 18 pairs of primers, as supplied for testing [23,24,25]. The electrophoresis conditions employed were 120 V for a duration of 30 min. The assessment of primer amplification efficiency was facilitated utilizing EB staining, utilizing a gel imaging system (K8160, Kechuang Ruixin, Beijing, China). Following a rigorous selection process, ten pairs of highly polymorphic primers (PIC > 0.5) with clear bands and sizes as expected were ultimately selected for subsequent analyses (Table 2 and Table 3).
The PCR products that demonstrated successful completion of the agarose electrophoresis sampling test were subsequently subjected to capillary electrophoresis. The configuration of the sample system was conducted in accordance with 1 µL 10-fold dilution of PCR products, incorporating the addition of the capillary electrophoresis internal standard, deionized formamide, and establishing a molecular weight ratio of −0.5 µL:8.5 µL. The configuration of the sample system was undertaken at the molecular weight internal standard ratio, deionized formamide 0.5 µL:8.5 µL, and 9 µL was added to the sample plate and sequenced using a 3730XL sequencer (Foster City, CA, USA).

2.2.3. Characterization of Genetic Diversity and Analysis of Population Genetic Structure

To assess the genetic diversity of Salix alba, PopGene32 was used to comprehensively analyze the genetic characteristics of Salix alba populations. Key genetic diversity indicators such as the number of alleles (Na), number of effective alleles (Ne), expected heterozygosity (He), and Shannon’s diversity index (I) were focused on. Nei’s genetic identity (I) and genetic distance (D) were used to measure the degree of genetic differentiation between and within populations.
The genetic clustering patterns were analyzed using STRUCTURE 2.3.4 software, and the raw data were normalized by DataFormatter to set a burn-in period of 50,000 steps and 50,000 MCMC iterations. This was performed to simulate genetic groupings with K = 1–10 (20 repetitions). The optimal K value was determined by Structure Harvester based on the ΔK method to determine the optimal K value, and CLUMPAK to generate the genetic component mixing ratio map [26].

2.2.4. Research on Drivers of Genetic Diversity

The geographic and climatic factor data were obtained from field sampling coordinates and the WorldClim database (v2.1, 30″ spatial resolution; available online: http://www.worldclim.org/, accessed on 15 January 2025). The geographic factors include geographic distance (Euclidean distance based on the WGS84 coordinate system), longitude, latitude, and elevation [27]. Climatic factors encompass 19 bioclimatic variables (Bio1-Bio19, e.g., mean annual temperature, annual precipitation, coldest season precipitation, etc.). All environmental data were spatially interpolated by ArcGIS 10.8 to match the coordinates of the sampling points and standardized (Z-score) to eliminate scale differences. To resolve the driver effects, the geographic and climatic variables were integrated to construct a random forest model (R4.4.2 package randomForest, parameters: ntree = 500, mtry = 5). The top five climate factors were filtered by calculating the variable significance (%IncMSE) through 10-fold cross-validation [28].
The Mantel test (vegan package mantel test function, permutation test 999 times) was then used to analyze the significance association of the genetic distance matrix (calculated based on Nei’s D) with the geographic distance matrix and the climatic distance matrix (Euclidean distance) [29].

3. Results and Analyses

3.1. Analysis of Genetic Diversity and Population Genetic Structure

3.1.1. Analysis of Genetic Diversity Indicators

The genetic diversity indicators of Salix alba populations in Xinjiang exhibited significant spatial associations with the geoclimatic gradient (Table 4). The wetter areas in northern Xinjiang (e.g., Ili and Urumqi) exhibited significantly higher genetic diversity compared to other regions, attributable to higher annual precipitation (>300 mm) and effective hydrological connectivity. The Ili population demonstrated the highest genetic diversity in Xinjiang, as evidenced by its high number of effective alleles (Ne = 1.371) and the Shannon index (I = 0.309). The Urumqi population also exhibited higher diversity (Ne = 1.293, I = 0.233). In the arid regions of southern Xinjiang, such as Hotan and Kashgar, habitat fragmentation and extremely low annual precipitation (less than 50 mm) have been identified as key factors in limiting biodiversity. Genetic diversity is significantly diminished in these areas, with the Hotan population exhibiting the lowest genetic diversity values across all of Xinjiang (Ne = 1.048 and I = 0.076).
In the transition region, the oasis upstream of the Tarim River (Aksu) exhibited the highest number of alleles (Ne = 1.172, I = 0.174), attributable to localized improved hydrological conditions. Hami, as a Gobi-oasis intertwining zone, demonstrated active gene flow (Nm = 3.931), which effectively mitigated the genetic isolation. It is noteworthy that the Turpan Basin, a hyper-arid core area (with an annual precipitation of less than 20 mm), exhibited the highest level of genetic differentiation within the entire territory (Gst = 0.957). Gene flow remained almost stagnant (Nm = 0.023), underscoring the profound impact of extreme drought on the gene exchange among populations.
The spatial pattern of genetic diversity was found to be highly consistent with the climatic gradient of ‘humid in the north, arid in the south, and heterogeneous in the transition zone’. This finding serves to confirm the central role of water efficiency in driving the genetic structure of plants in the arid zone.

3.1.2. Genetic Distance and Similarity

Genetic distance and similarity analyses of Salix alba populations in Xinjiang (Table 5) revealed that Tacheng and Hotan exhibited the most significant genetic distance (GD = 0.2131) and the lowest genetic similarity coefficient (0.808). These findings indicate that these two locations were separated by the Tien Shan mountain range (horizontal distance > 1300 km) and exhibited extreme climatic differences (Tacheng experienced an annual precipitation of approximately 250 mm, whereas Hotan received less than 50 mm). This emphasises the synergistic impact of geographic barriers and drought stress on the studied populations. The present study aims to highlight the synergistic effect of geographical barriers and drought stress.
In contrast, populations within the northern boundary (e.g., Altay and Tacheng) were geographically close (<200 km) and hydrologically well connected, with minimal genetic distance (GD = 0.0155), high genetic similarity (0.9846), and active gene flow (Nm = 3.187), suggesting that successive habitats effectively maintained genetic homogenization.
The differentiation of long-distance populations in the northern and southern borders was particularly significant. For instance, the genetic distance between Ili in the northern border and Kashgar in the southern border (horizontal distance > 800 km) (GD = 0.1552) was considerably higher than that of the proximate populations within the northern border (e.g., Ili and Tacheng, GD = 0.0637). This further confirms the hypothesis that geographical distance amplifies the effect of genetic differentiation.

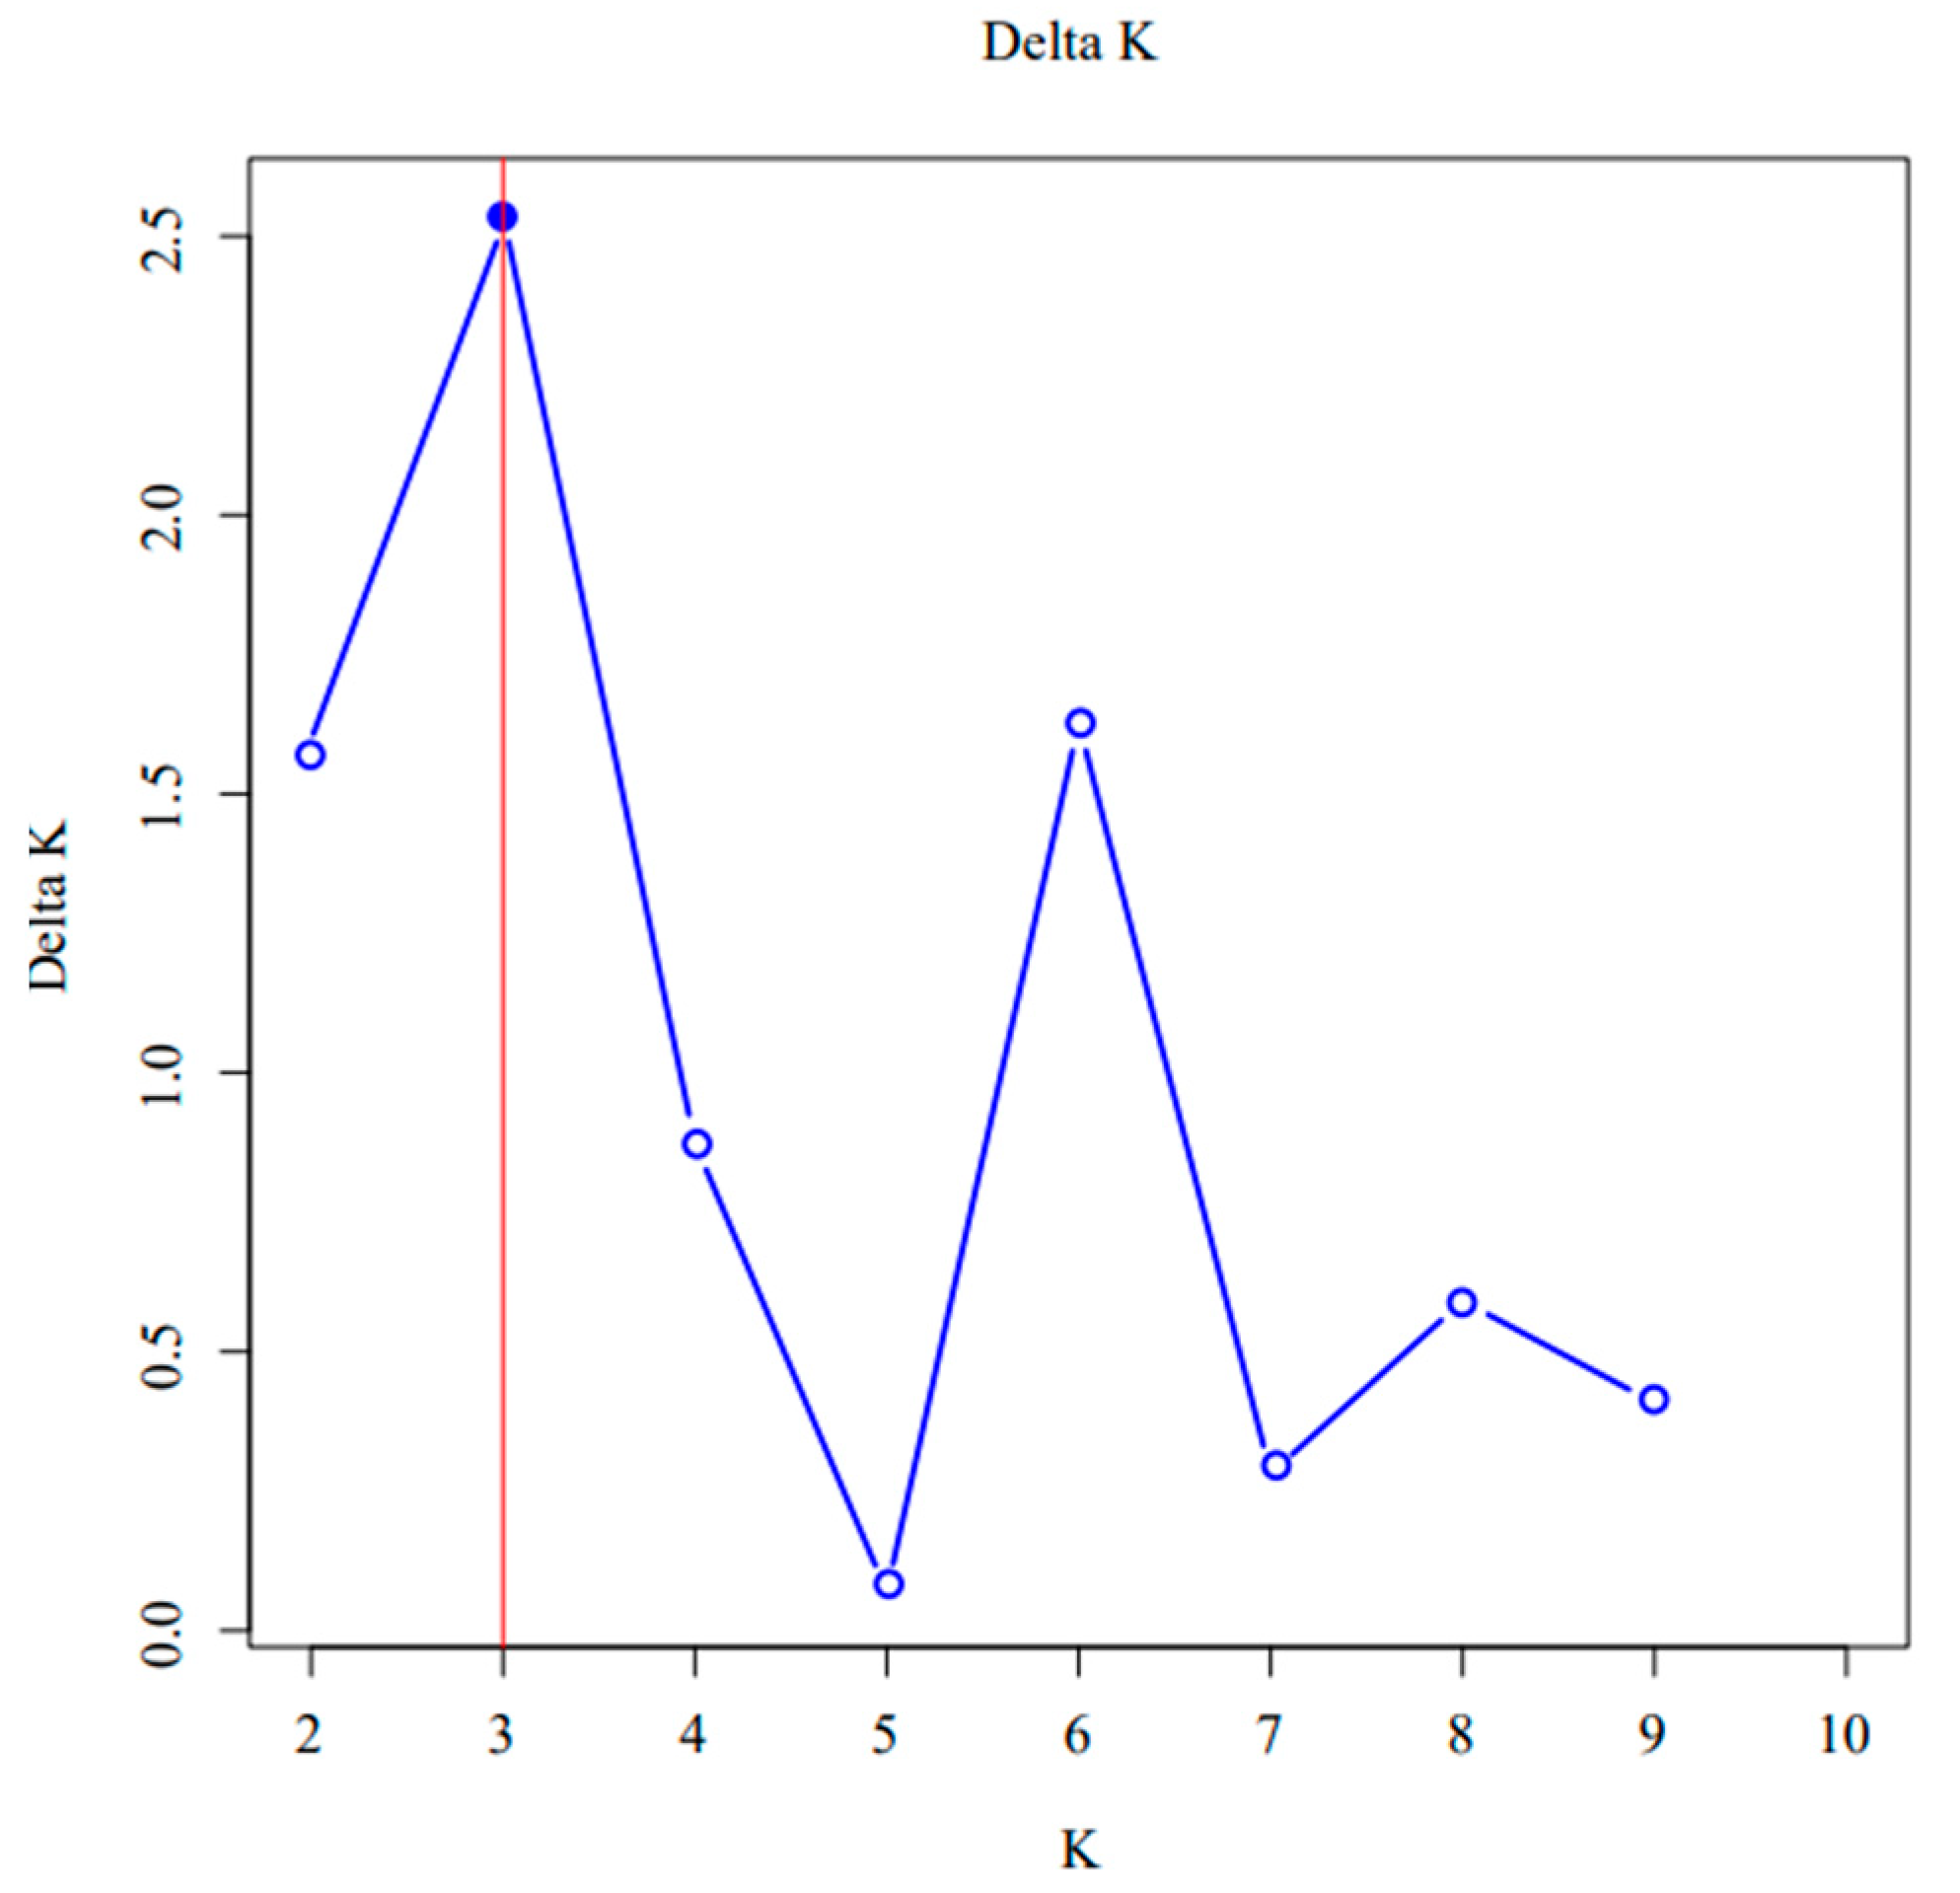
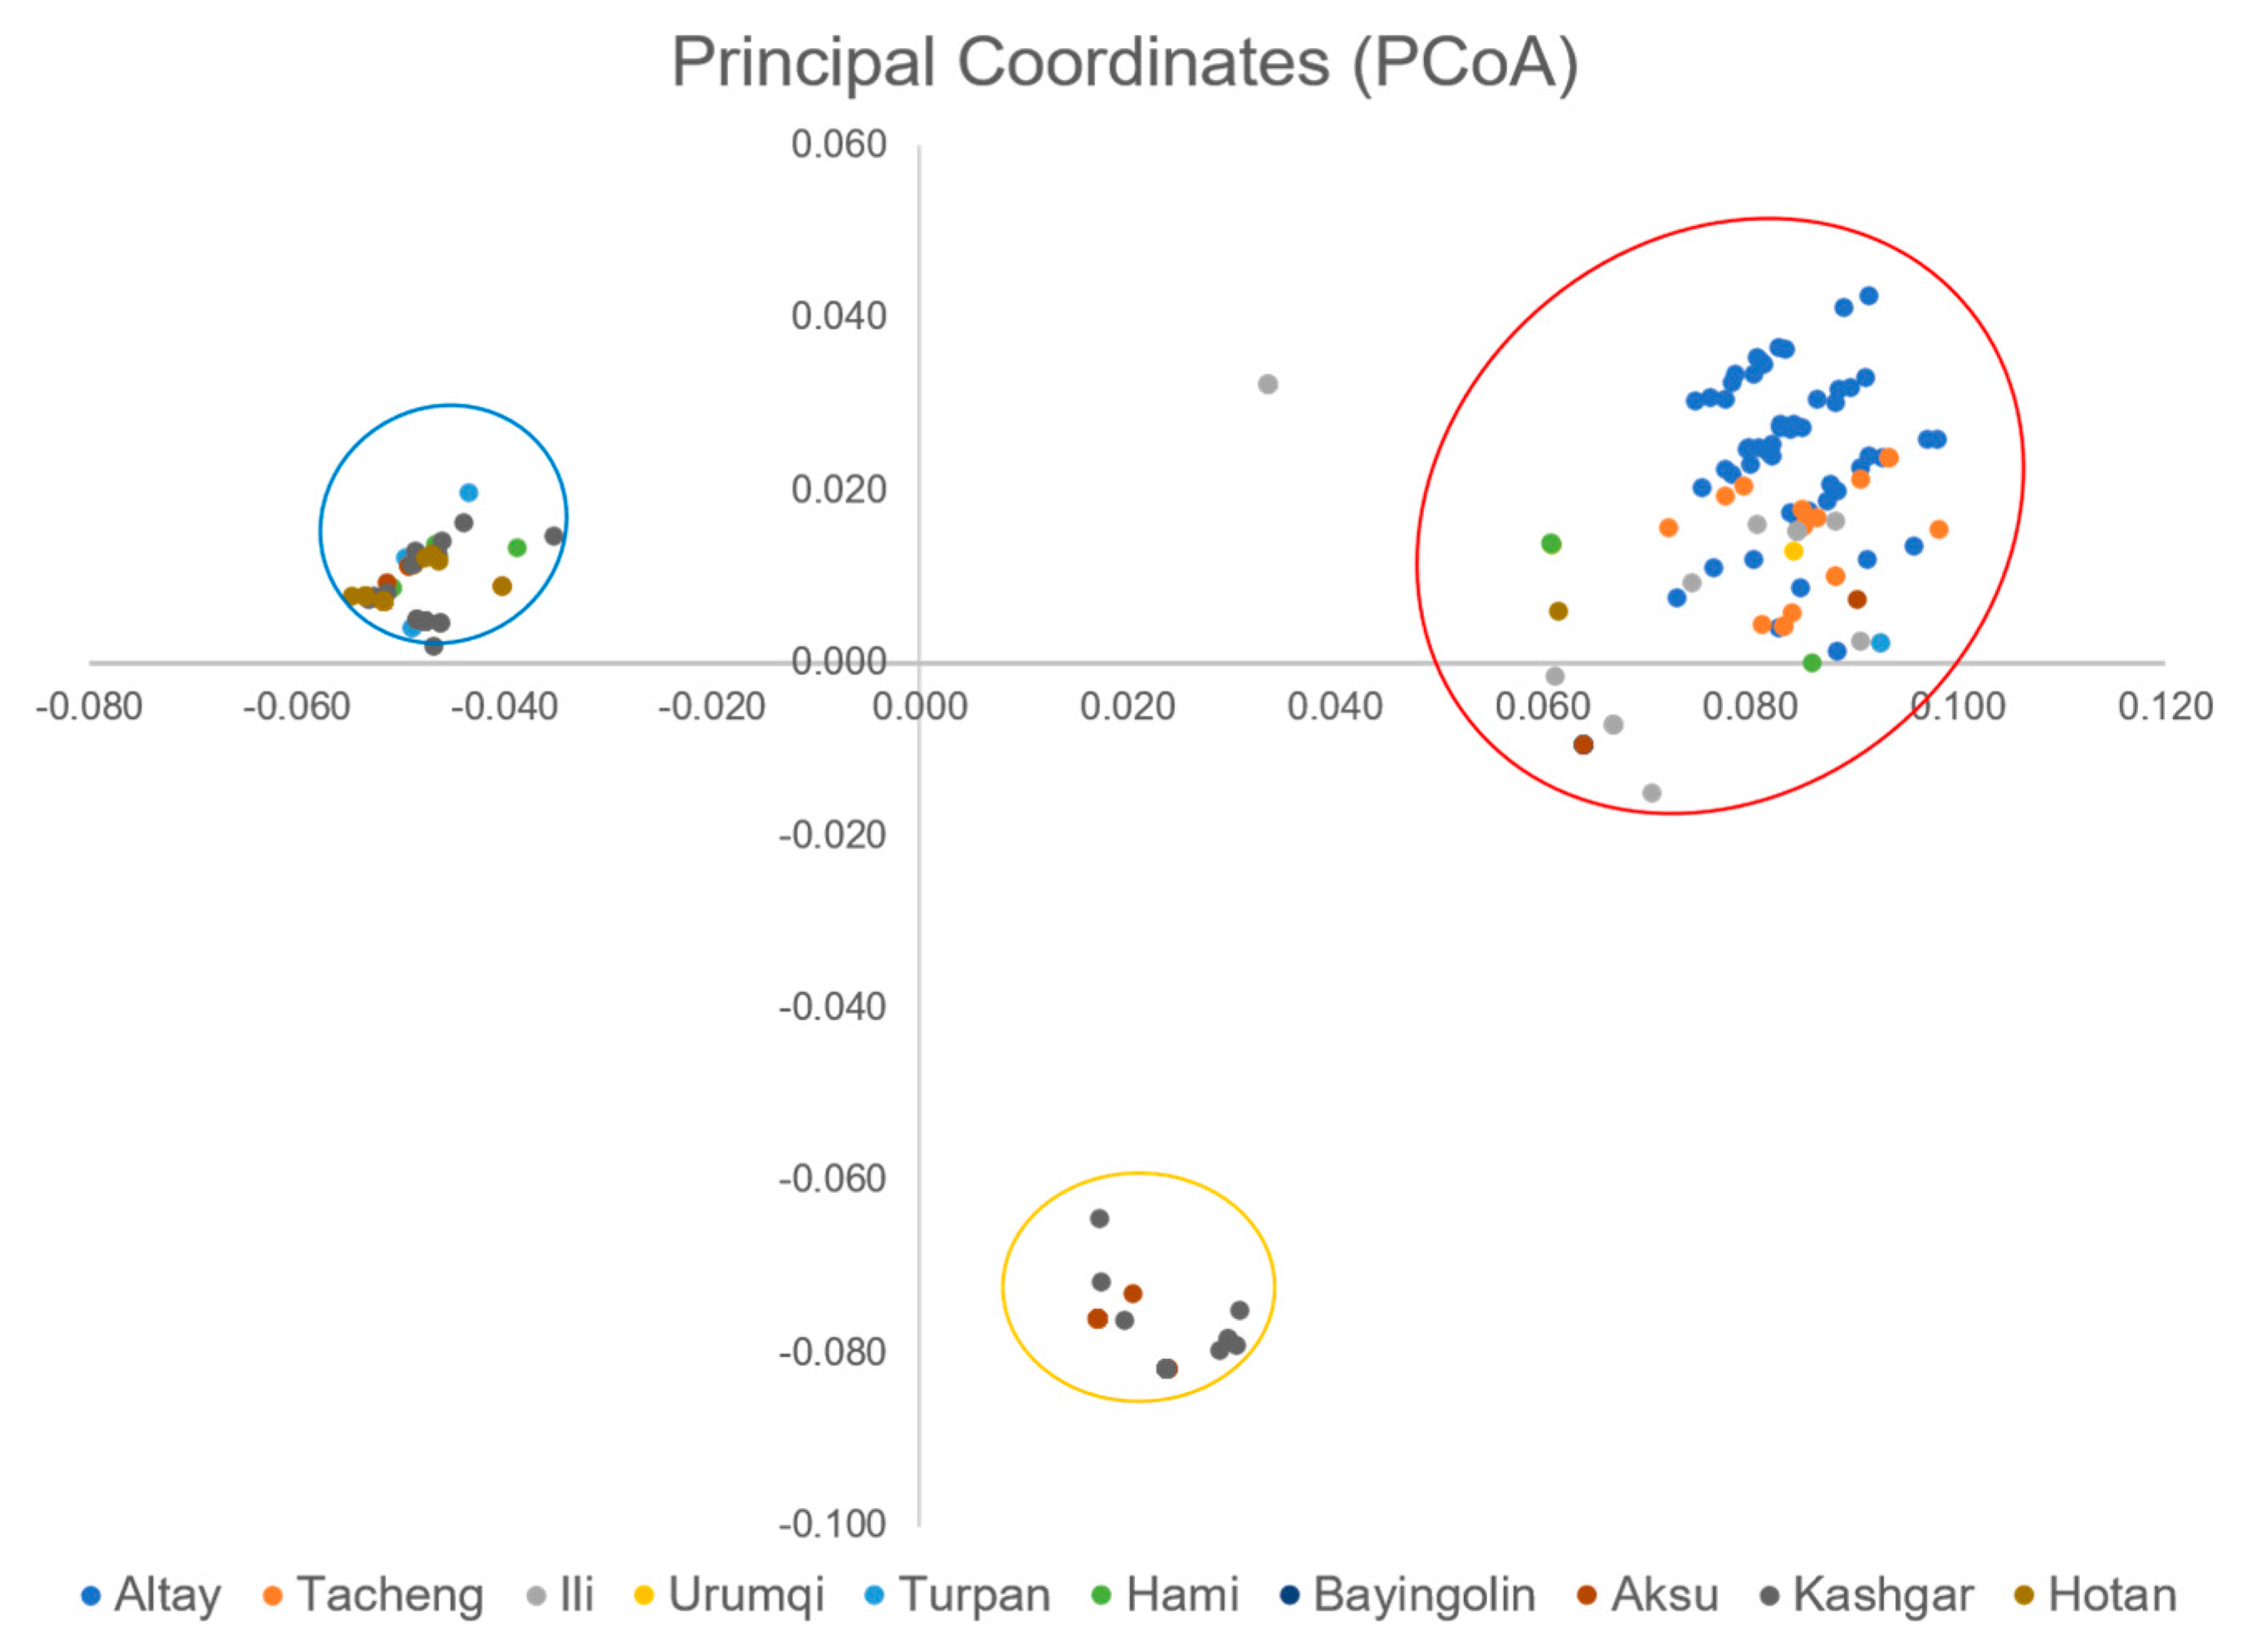
3.1.3. Genetic Clustering Analysis

Utilizing the STRUCTURE analysis, the calculation of the ΔK value (Figure 2) revealed the potential for the Salix alba population to be categorized into three primary genetic groups (K = 3). The northern border populations exhibited a predominant presence within group 1 and group 2, while the southern border populations were predominantly concentrated in group 3 (Figure 3), aligning with the observed trend of genetic distance and geographical isolation.
Principal coordinate analysis (PCoA) revealed that (Figure 4) the genetic structure of Salix alba in Xinjiang exhibited significant spatial heterogeneity, with the northern border populations (e.g., Altay, Tacheng, and Ili) were tightly clustered in the PC1 direction, showing high genetic uniformity, while the southern and eastern border populations (e.g., Kashgar, Hotan, and Hami) were more dispersed in the PC2 direction, reflecting greater genetic differentiation, which may be related to the geographical isolation and extreme arid climate of the region.

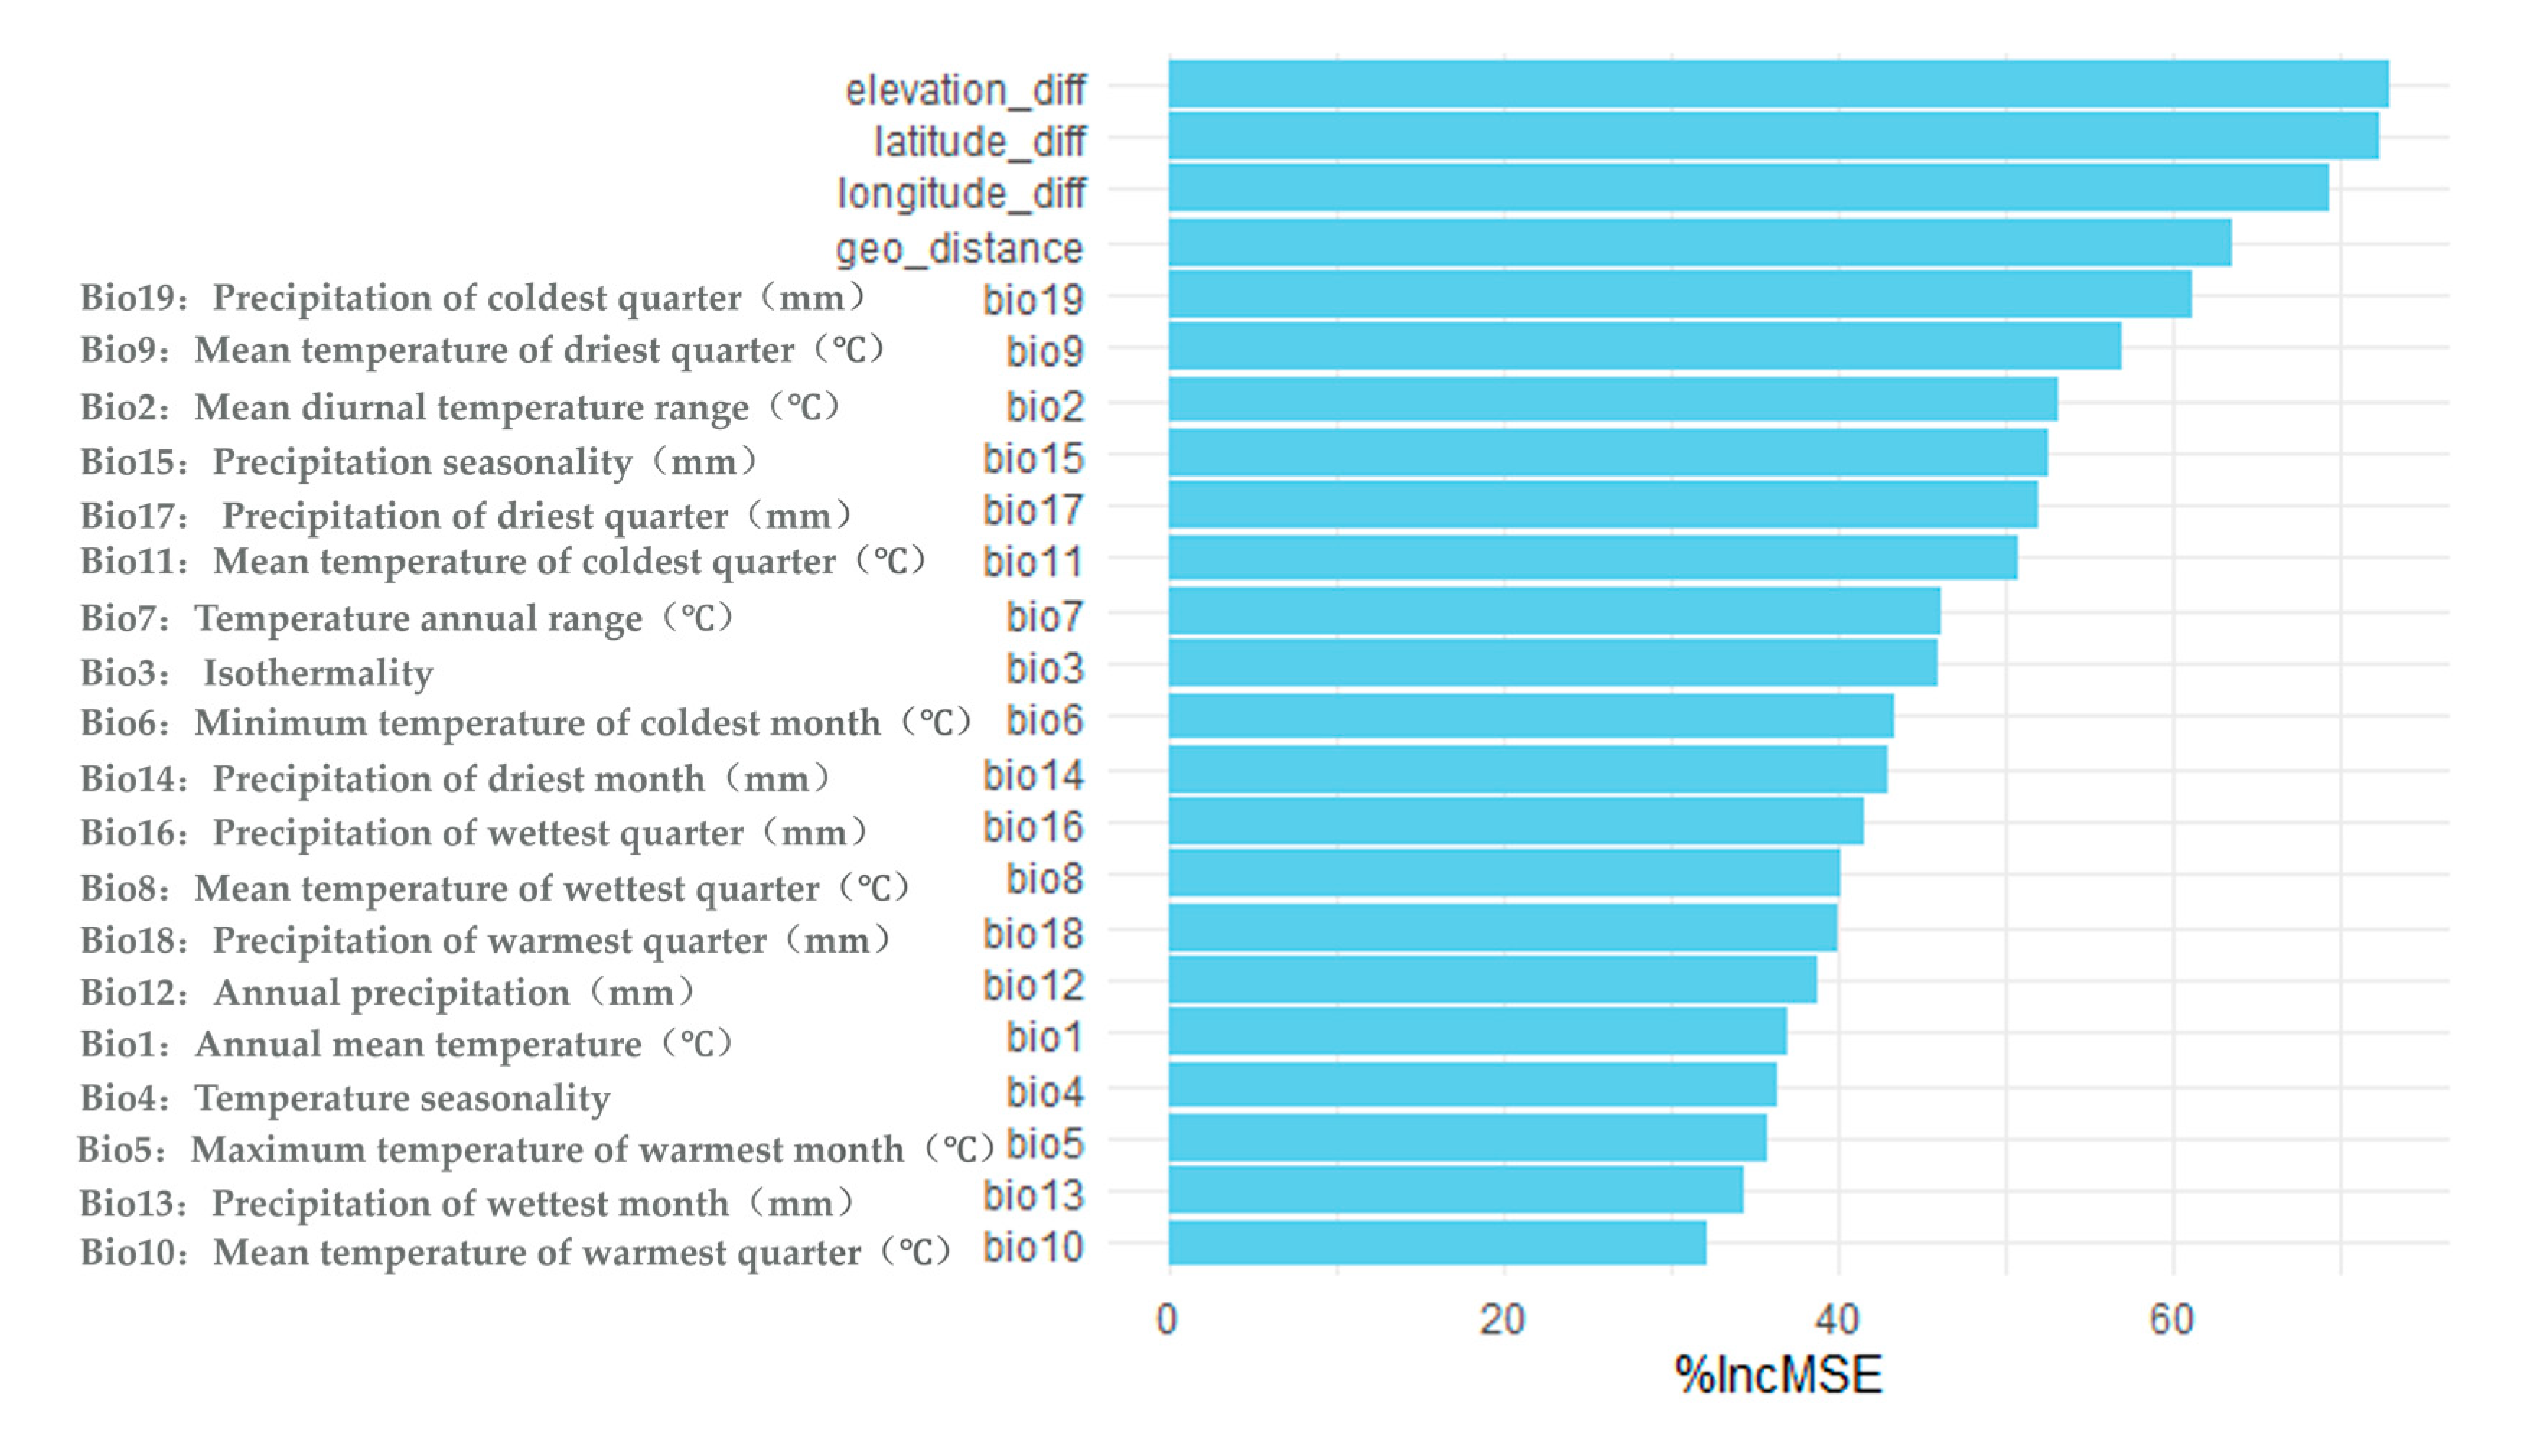
3.2. Results of Genetic Diversity Driver Analysis

The random forest model demonstrated (Figure 5) that geographic factors (latitudinal difference %IncMSE = 24.6, geographic distance %IncMSE = 18.9) explained a significantly higher proportion of genetic variation in Salix alba than climatic factors, indicating that geographic isolation and ecological gradient were the underlying drivers of genetic differentiation. However, among the climatic factors, the importance of cold-season precipitation difference (Bio19, %IncMSE = 15.7), the mean temperature of the driest season (Bio9, %IncMSE = 12.4), and the diurnal temperature difference (Bio2, %IncMSE = 10.2) was found to be comparable to that of certain geographic factors (e.g., elevation difference, %IncMSE = 8.3), thereby indicating that temperature fluctuation and extreme drought stress may exert indirect effects on genetic structure through synergistic mechanisms.

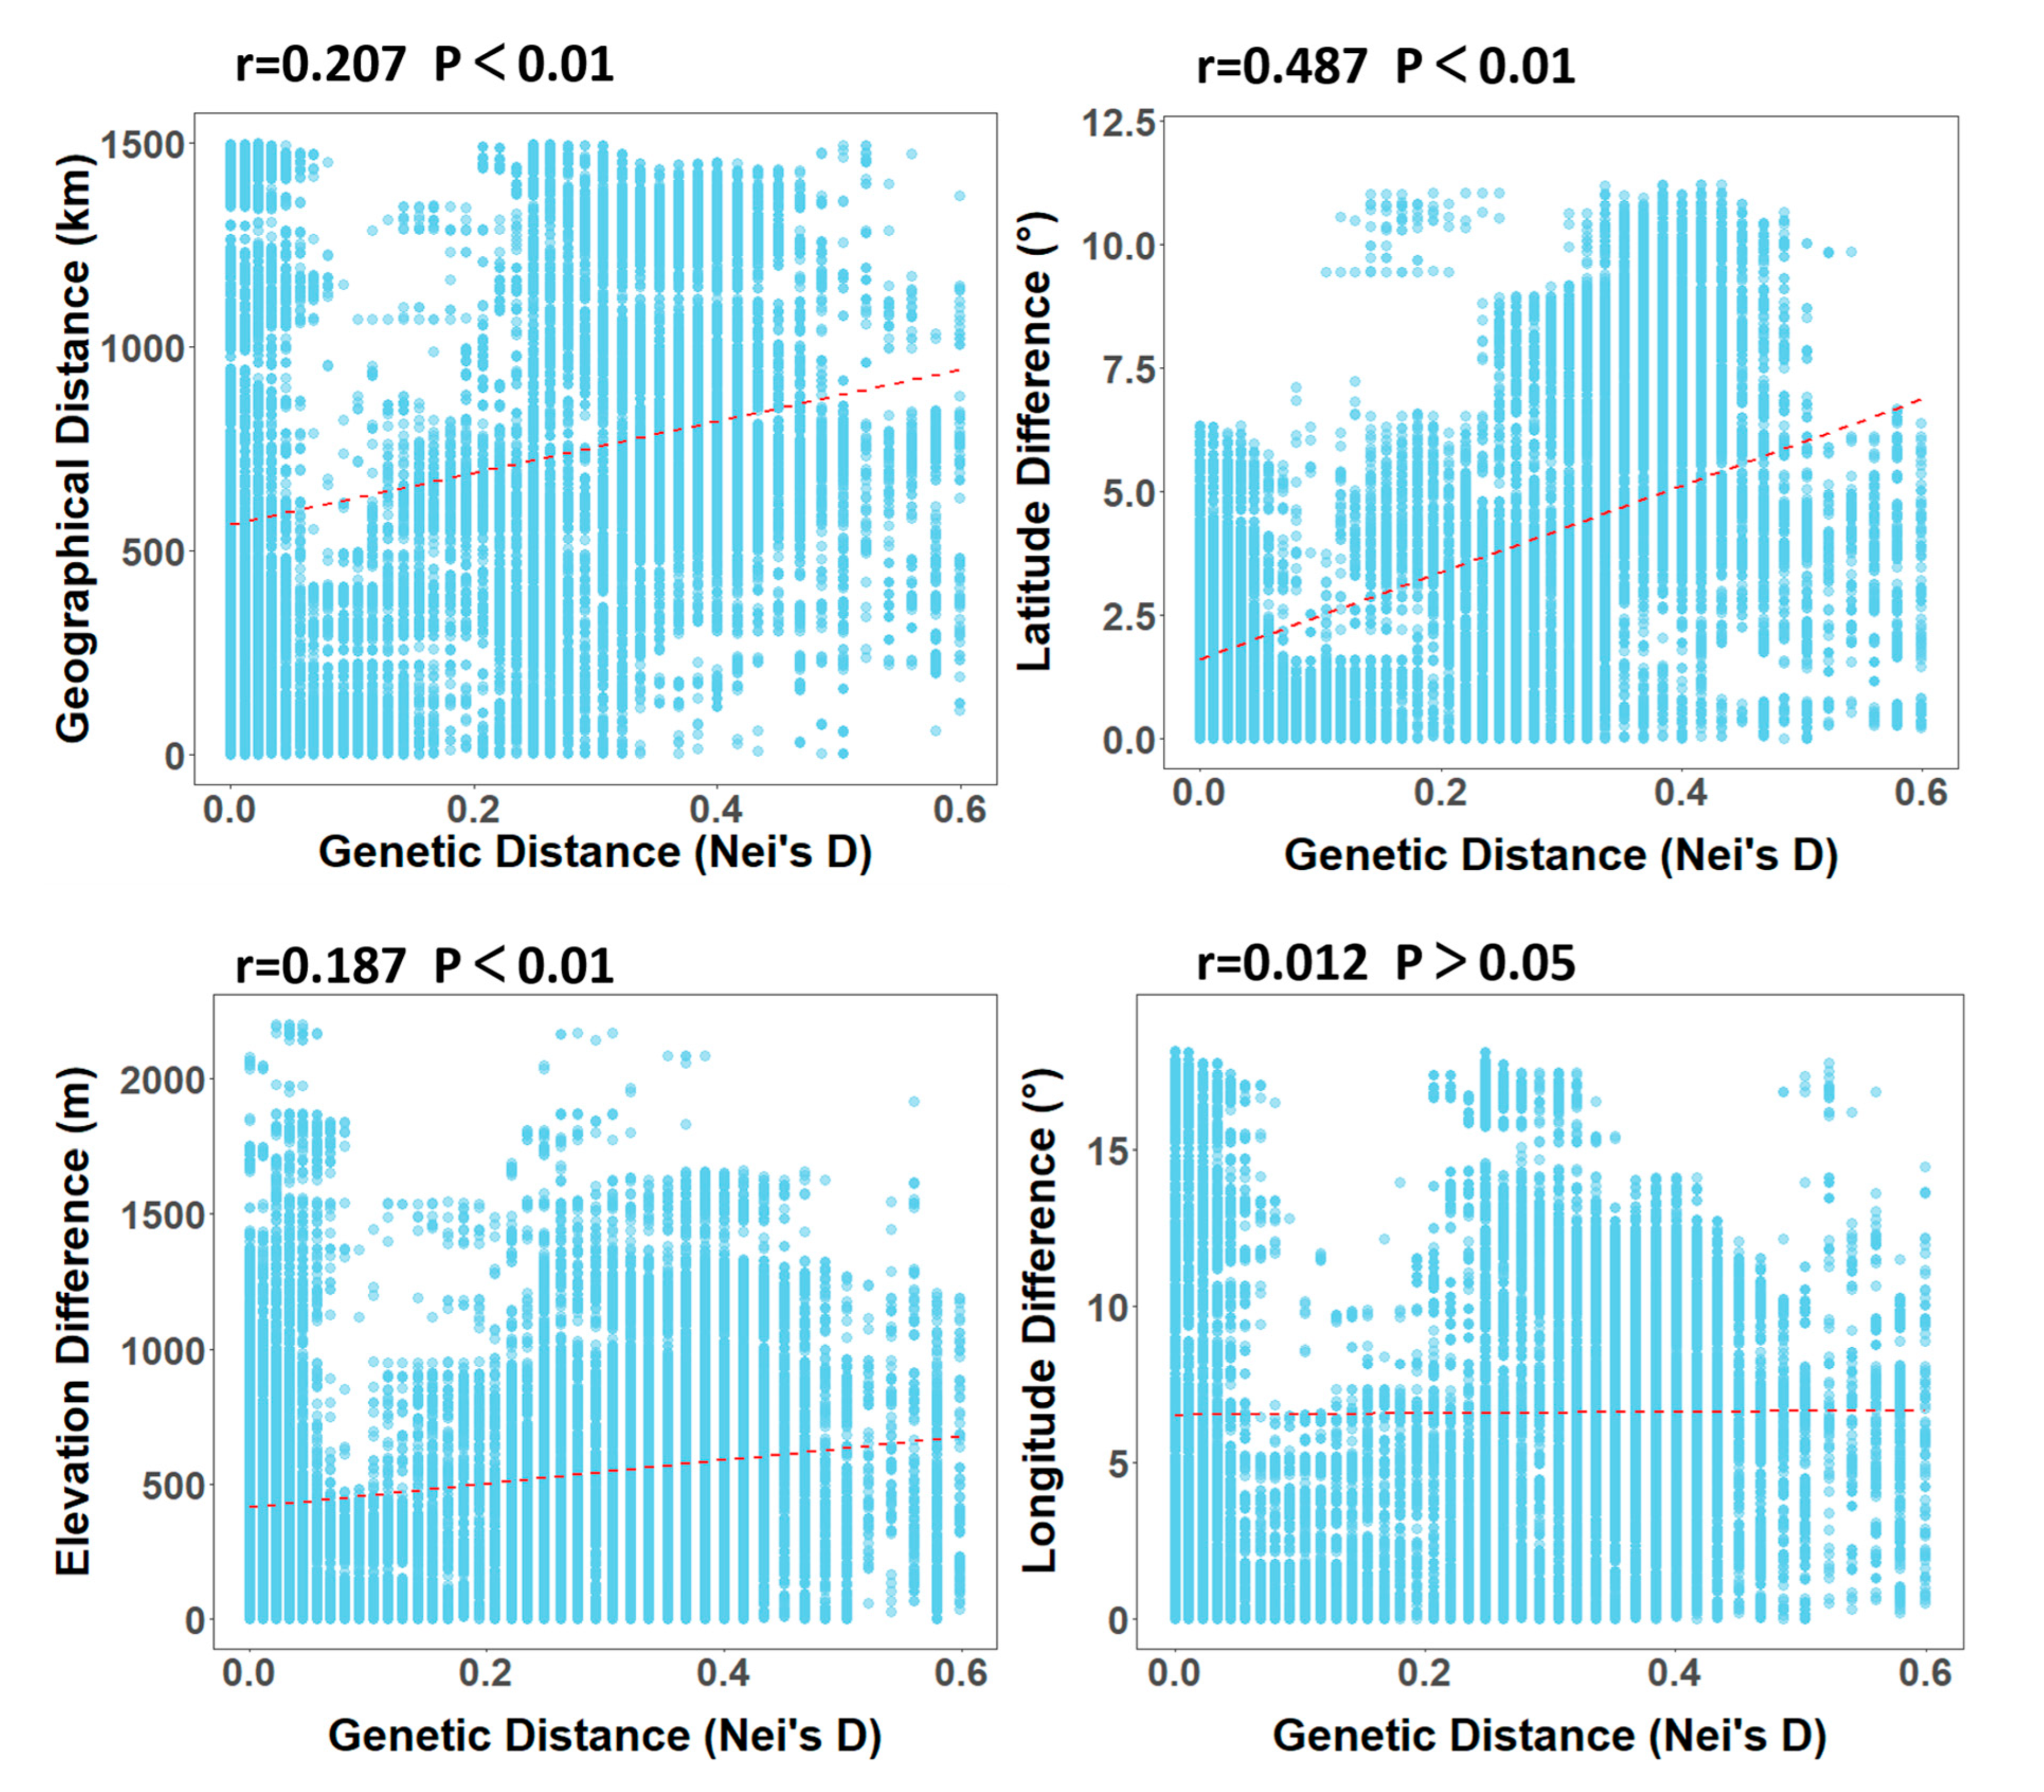
3.2.1. Analysis of Geographical Factors

The correlation between genetic distance and geographic factors demonstrated (Figure 6) that latitudinal variations (r = 0.487, p < 0.01) emerged as the predominant geographic drivers of genetic differentiation, with the latitudinal gradient extending from the northern to the southern section of the border (44° N to 37° N) and the synergistic decline in temperature (Bio1) and precipitation (Bio12) exhibiting a direct association with population genetic disparities. The ‘distance-isolation’ model was further supported by the isolation effect of geographic distance (r = 0.207, p < 0.01). For instance, the genetic distance between the Altai and Tacheng populations (geographic distance < 200 km) (GD = 0.0155) was significantly lower than that between the Altai and South Xinjiang populations (GD > 0.15). Elevation differences (r = 0.187, p < 0.01) were found to be associated with local topography (e.g., elevation gradient > 1000 m on the northern slopes of the Tianshan Mountains), whereas longitude differences remained largely unaffected (r = 0.0116).

3.2.2. Climate Factor Analyses

Mantel’s test indicated significant heterogeneity in the driving effect of climatic factors on genetic distance (Figure 7). The core climatic drivers of genetic differentiation were identified as coldest quarterly precipitation (Bio19, r = 0.621, p < 0.01) and driest quarterly precipitation (Bio17, r = 0.588, p < 0.01), suggesting that genetic differences of Salix alba in the arid zone were primarily influenced by precipitation dynamics (cold season moisture recharge versus extreme drought threshold). The significant positive correlation of the coldest seasonal mean temperature (Bio11, r = 0.402, p < 0.05) further indicated the influence of winter climate on genetic exchange among populations. The significant positive correlation of the precipitation seasonality coefficient (Bio15, r = 0.384, p < 0.01) reflected that the uneven seasonal distribution of precipitation (e.g., concentrated rainfall in summer and drought in winter) imposed some limitations on genetic distances and exacerbated population differentiation. Furthermore, the correlation between the mean diurnal temperature difference (Bio2, r = 0.334, p < 0.01) and the mean temperature of the driest season (Bio9, r = 0.314, p < 0.01) suggests that temperature stress also indirectly affects genetic diversity.

4. Discussion

4.1. Characteristics of Salix alba Genetic Diversity in the Arid Zone

Despite the SSR primers employed in this study having been developed based on temperate populations [23], highly polymorphic loci (e.g., SB24, PIC = 0.810) were still effective in capturing inter-population divergence in arid zones (Gst = 0.957). However, the reduced polymorphism of certain primers (e.g., SB984, PIC = 0.054) may be indicative of loci being filtered by drought selection pressures, such as the directional selection of adaptive loci (e.g., drought-related genes), resulting in the loss of alleles at neutral microsatellite loci. As neutral molecular markers, SSRs, whose polymorphisms reflect genetic variation mainly originating from random mutations and genetic drift [30], may not be effective in characterizing the diversity of functional loci (e.g., drought-resistant genes) associated with drought adaptation. Furthermore, primer design based on non-arid environment populations with less evolutionarily conserved target loci in extreme arid zones may further limit the resolution of adaptive genetic structure, which can be explored in multiple directions in the future.
Spatial patterns of genetic diversity and structure can indeed reveal imprints of population change [31], and the genetic diversity of Salix alba populations in the arid zone of Xinjiang showed significant spatial heterogeneity, with clear genetic structure detected by Bayesian clustering analyses (K = 3), suggesting that Salix alba in Xinjiang is divided into three major genetic clusters, which is highly compatible with the geomorphological pattern of the mountain ranges in Xinjiang. Generally, more heterogeneous genetic structures usually produce stronger genomic barriers to gene flow [32], and changes such as population expansion, contraction, or migration can alter the spatial relationships between populations, thereby affecting patterns of gene flow [33].
Populations in the southern and northern border regions have different geographic connectivity and large differences in geographic distance between populations. The Northern Xinjiang region has a humid climate, and most of the hydrological connectivity is good, which promotes cross-population dispersal of alleles, e.g., high gene flow is maintained between Altay and Tacheng. In contrast, the southern Xinjiang region has more geographic distance between populations and habitat independence (e.g., spaced Taklamakan Desert), which synergistically shaped the lower genetic pattern in the region. In both types of populations in the Spanish alpine, genetic diversity was found to be lower in populations in long-term isolation than in populations with continuous exchange of habitats [34]. The genetic similarity of populations in the transition zone is maintained in the upper Tarim River oasis (Aksu) by facilitating seed dispersal through seasonal flooding (GD = 0.004); a similar mechanism is found in European riparian willow populations [4]. However, this buffering effect is not observed in hyperarid zones, and the highest genetic differentiation is recorded in the Turpan Basin due to the absence of hydrological corridors and the near-stagnation of gene flow.
Habitat independence and geographic isolation combine to limit genetic exchange between populations. There are also similar phenomena that are widespread among subalpine species in the Pacific Northwest; it has been found that mountain ranges spanning the arid zone are blocking fir (Abies spp.) populations, resulting in genetic disarticulation, and that low-elevation desert corridors exacerbate genetic differentiation in Pinus spp. by blocking seed dispersal [35,36]. The greater the altitudinal variation in Salix alba populations in arid areas, the greater the genetic distances will be, again implying that local topography, such as mountain ranges and rivers, can indirectly affect genetic distances through microhabitat heterogeneity. Larger geographic distance intervals usually result in higher levels of genetic differentiation. But a certain amount of geographic connectivity can significantly mitigate genetic segregation. Northern Xinjiang Altai River valley populations maintained high gene flow and significant genetic consistency due to continuous riparian habitats. This result is consistent with gene flow between habitat changes in Himantoglossum hircinum L., where smaller habitats limit animal pollen dispersal as well as seed dispersal [31], which in turn limits gene flow between populations and leads to population differentiation, whereas small intra-population intervals without dispersal barriers are associated with higher gene flow [37]. These cases also provide evidence that the coupling of habitat discontinuity and geographic isolation is a common pattern of plant genetic diversity loss.

4.2. Study on the Driving Factors Affecting Genetic Diversity

In this study, we analyzed the complexity of genetic differentiation of Salix alba in arid zones through multi-dimensional analysis involving the synergistic effects of geographic isolation, climate change, and the interaction of the two. Firstly, the random forest model showed that geographic factors laid the basic framework for variance explanation, and the matrix correlation analysis of single factors confirmed the importance of geographic isolation as the basic driver of differentiation [38]. Latitudinal differences represent a pivotal geographic factor. The latitudinal gradient extending from the northern to the southern border (44° N to 37° N) and the synergistic decrease in heat (Bio1) and precipitation (Bio12) have been directly associated with genetic differences. This association is analogous to the changes in the genetic diversity of alpine plant populations, which decline with decreasing latitude in the northern hemisphere [39]. There are positive prospects for species to maintain genetic diversity and adaptive potential through range shifts associated with climate change [31].
In addition, the significant effect of geographic distance (r = 0.207) supports the ‘distance-isolation’ model [40]. Differences in horizontal distances > 800 km between populations in the northern and southern regions further amplify population genetic differentiation due to geographic isolation [41], pointing to the fact that the ability of Salix alba to exchange genes in arid zones is limited by wide-area geographic barriers. This is matched by the results of a study of Yunnan pine (Pinus yunnanensis Franch. var.) populations in a fragile habitat in southwestern China, influenced by several geographic factors such as mountain ranges and rivers, which, together with local environmental adaptations, have shaped the differences in pollen distribution patterns, leading to differential changes in genetic diversity [42]. Salix alba is a predominantly wind-borne pollinator, but the effects of wind on gene flow and genetic differentiation are independent of geographic distance. Although wind travel time is correlated with distance, wind flow rates remain highly variable after controlling for distance, which in turn affects Salix alba dispersal and results in differences in genetic diversity [43].
Climate plays an important role in shaping the genetic diversity of plant populations [44], with 95% of Salix albas developing roots, branches, and leaves in the spring [2]. In arid zone Salix alba populations, climatic factors maintain population genetic diversity through reinforcement of genetic differentiation with local adaptive screening [45].
Cold season precipitation, as a critical water recharge period in arid regions (winter snowmelt and spring runoff), directly affects Salix alba growth, slowing population expansion limitation, root development, and reproductive success in the following year. Lack of cold-season precipitation (Bio19 < 10 mm) in the southern border may lead to increased seedling mortality, forcing populations to rely on clonal reproduction and thus reducing genetic diversity. The driest season precipitation (Bio17) suggests that the greater the dry season precipitation, the greater the genetic distance differences, a study that is identical to the phenomenon that genetic variation in trees in Alabama and Mississippi is positively correlated with high Bio17 [46]. Annual precipitation fluctuations further lead to changes in dispersal processes, reproduction, and affect genetic diversity [10,11] such as disruption of seed hydraulic dispersal pathways and increased habitat fragmentation.
It is important to note that, in addition to precipitation, temperature is also a significant driver of genetic diversity. The positive correlation between the coldest seasonal mean temperature and genetic distance suggests that low-temperature stress weakens inter-population gene flow by decreasing pollen viability [47] or by limiting pollinator activity. This finding contrasts with the conclusion drawn from European willow studies [48], where the impact of temperature was deemed less significant. The observed discrepancy can be attributed to the heightened effects of low-temperature stress on reproductive processes in the context of Xinjiang. Furthermore, the substantial shift in the driest seasonal mean temperature in the 15–20 °C range with genetic distance [46] indicates that high-temperature stress exacerbates genetic differentiation in extreme arid zones of southern Xinjiang by suppressing the efficiency of sexual reproduction and facilitating clonal dominance [18].
The combined effect of geographic and climatic factors on genetic differentiation is a subject of considerable interest. Furthermore, research conducted on hybrid willows has demonstrated that multiple stresses exert a more substantial impact on plant growth and survival in comparison to a single stress [49]. The divergence of populations between northern and southern borders is driven by both latitudinal differences and the spatial covariance of cool-season precipitation. Despite the overall dominance of geographic factors, the importance of climatic factors approaches that of latitudinal differences, suggesting that the two together constitute a key driver of genetic differentiation.
In this study, genetic diversity was mainly compared by administrative regions, but future studies can further refine the sampling design by combining more detailed ecological zoning (e.g., NDVI vegetation index) or climatic classification, so as to more accurately analyze the effects of habitat heterogeneity on genetic diversity. The whole genome sequencing technology can also be used to analyze the genes of Salix alba adaptation and expand the sampling range to other arid zones in Central Asia to assess the long-term impacts of climate change on genetic diversity across the region.

4.3. Recommendations for the Conservation of Salix alba in Arid Zones

Genetic diversity has been demonstrated to play a pivotal role in the maintenance of species adaptive potential and ecosystem function [1]. The ecological effects of genetic diversity are comparable to those of species diversity at the population, community and ecosystem levels. The present study reveals that the genetic diversity of Salix alba in Xinjiang shows significant spatial heterogeneity, and it is important to develop conservation strategies to safeguard its evolutionary potential and sustainable use.
As a core area of genetic diversity, the Ili Valley in Northern Xinjiang should be prioritized for inclusion in the conservation network. The Ili population has the highest genetic diversity among all studied populations (Ne = 1.37, h = 0.209, I = 0.309, Ht = 0.184), which contributes to its greater ability to adapt to new environments or selective pressures, i.e., better adapted to highly variable evolution as well as having the potential for long-term survival. Its continuous hydrological connectivity with intact riparian habitats supports high gene flow (Nm > 2) and is a natural refuge for maintaining the genetic resources of Salix alba in arid zones.
The results of genetic clustering (K = 3) revealed the population of the whole territory to be divided into three major management units: (1) the humid zone in the northern territory, with Yili as the core, focusing on protecting the existing river valley populations; (2) the extremely arid zone in the southern territory, where a combination of in situ protection (existing oasis populations) and translocation (introduction of high-diversity genotypes in the northern territory) is implemented; and (3) the transitional zone (e.g., Hami), where the monitoring of gene flow corridors is imperative to avert an escalation in habitat fragmentation. (4) Transition zones (e.g., Hami) must also monitor gene flow corridors to prevent increased habitat fragmentation. Furthermore, it is imperative to safeguard the northern border populations from inbreeding decline by promoting heterosis through the utilization of artificial assisted pollination techniques.
Wild populations of Salix alba contain unique drought- and salt-tolerant genetic traits [1], and its fast-growing characteristics and ornamental value [1] can help ecological restoration projects (e.g., construction of windbreak forests) and ornamental nursery seedling breeding, and provide high-quality germplasm for the synergistic development of the ecology and economy of arid zones. The plant can be used for ecological restoration projects (e.g., windbreak construction) and ornamental seedling breeding.

5. Conclusions

In this study, we analyzed the characteristics and driving mechanisms of Salix alba genetic diversity in the arid zone of Xinjiang based on SSR molecular marker technology. The results demonstrated that: (1) gene flow was active in the wet populations in northern Xinjiang, and genetic diversity was significantly higher than that in the extreme arid zone in southern Xinjiang; (2) geographic isolation led to the differentiation of populations into three independent genetic clusters. The whole Xinjiang, and inter-population genetic differentiation was dominant; (3) cold-season precipitation and fluctuations in annual precipitation were the core climatic drivers of genetic differentiation, and the latitudinal gradient and geographic distance further strengthened the effect of geographic isolation. This study systematically unveils the mechanism of plant genetic diversity maintenance in arid zones, proposes a more scientific and practical basis for the conservation and utilization of Salix alba in Xinjiang, and provides ideas for the study of species adaptation in arid zones.

Author Contributions

H.D. oversaw the overall research direction and manuscript revision, J.H. conducted all field sampling, analyzed the data, and drafted the manuscript. X.Y. processed and analyzed the sequencing data, T.L. conceived and designed the study. All authors have read and agreed to the published version of the manuscript.

Funding

This research was funded by the Corps Guided Science and Technology Program Project (2023ZD051), the National Natural Science Foundation of China (32460352), the Natural Science Foundation of Xinjiang Uygur Autonomous Region (2022D01F54).

Data Availability Statement

The data underlying the results presented in this paper are not publicly available at this time but may be obtained from the authors upon reasonable request.

Acknowledgments

I would like to express my sincere gratitude to the College of Life Sciences at Shihezi University for providing this valuable platform, as well as to the local forestry and grassland department for their support and assistance.

Conflicts of Interest

The authors declare that the research was conducted in the absence of any commercial or financial relationships that could be construed as a potential conflict of interest.

References

  1. Golubkina, N.; Plotnikova, U.; Amagova, Z.; Sheshnitsan, S. Peculiarities of Willow (Salix alba) Bark Mineral Composition. Trace Elem. Med. 2023, 24, 47–52. [Google Scholar] [CrossRef]
  2. Markus-Michalczyk, H.; Smith, Z.; Bouma, T.J. Floodplain Forest Foundation Species Salix alba L. Is Resilient to Seawater Pulses during Winter. Limnol. Rev. 2024, 24, 250–265. [Google Scholar] [CrossRef]
  3. Axmanová, I.; Chytrý, K.; Boublík, K.; Chytrý, M.; Dřevojan, P.; Ekrtová, E.; Fajmon, K.; Hájková, P.; Härtel, H.; Hejda, M.; et al. Catalogue of Expansive Plants of the Czech Republic. Preslia 2024, 96, 299–327. [Google Scholar] [CrossRef]
  4. Karrenberg, S.; Edwards, P.J.; Kollmann, J. The Life History of Salicaceae Living in the Active Zone of Floodplains. Freshw. Biol. 2002, 47, 733–748. [Google Scholar] [CrossRef]
  5. Meneghetti, S.; Barcaccia, G.; Paiero, P.; Lucchin, M. Genetic Characterization of Salix alba L. and Salix fragilis L. by Means of Different PCR-Derived Marker Systems. Plant Biosyst. 2007, 141, 283–291. [Google Scholar] [CrossRef]
  6. Stalažs, A. To Be or Not to Be Native: From the Discourse on the Official Status of Salix alba to the Recommendation to Strengthen the Protection of Marginal Populations in Latvia. J. Nat. Conserv. 2022, 67, 126158. [Google Scholar] [CrossRef]
  7. Du, W. An Excellent Shelterbelt Species: White Willow (Salix alba). Agric. For. Sci. Exp. 1978, 4, 19–20. [Google Scholar]
  8. Song, J.; Xue, Z.; Yang, B.; Liu, T.; Yuan, Y.; Xu, L.; Zhang, Z. Spatial Distribution Patterns and Influencing Factors of Dominant Species in Plain Valley Forests of the Irtysh River Basin. Forests 2024, 15, 1237. [Google Scholar] [CrossRef]
  9. Liu, X.L.; Zhang, Z.D.; Xue, Z.F.; Zeng, S.J.; Liu, T. Characteristics of Plant Diversity in the Haba River Valley Forest, a Tributary of the Irtysh River. J. Plant Resour. Environ. 2024, 33, 89–96. [Google Scholar]
  10. Sitzia, T.; Barcaccia, G.; Lucchin, M. Genetic Diversity and Stand Structure of Neighboring White Willow (Salix alba L.) Populations along Fragmented Riparian Corridors: A Case Study. Silvae Genet. 2018, 67, 79–88. [Google Scholar] [CrossRef]
  11. Tokdemir, Y.; Değirmenci, F.Ö.; Uluğ, A.; Acar, P.; Kaya, Z. Genetic Diversity of Salix caprea L. Populations in Fragmented Habitats of Northeastern Türkiye. Biologia 2024, 79, 2013–2023. [Google Scholar] [CrossRef]
  12. Hughes, A.R.; Inouye, B.D.; Johnson, M.T.J.; Underwood, N.; Vellend, M. Ecological Consequences of Genetic Diversity. Ecol. Lett. 2008, 11, 609–623. [Google Scholar] [CrossRef] [PubMed]
  13. Ørsted, M.; Hoffmann, A.A.; Sverrisdóttir, E.; Nielsen, K.L.; Kristensen, T.N. Genomic Variation Predicts Adaptive Evolutionary Responses Better than Population Bottleneck History. PLoS Genet. 2019, 15, e1008205. [Google Scholar] [CrossRef]
  14. Liu, H.; Zang, F.; Wu, Q.; Ma, Y.; Zheng, Y.; Zang, D. Genetic Diversity and Population Structure of the Endangered Plant Salix taishanensis Based on CDDP Markers. Glob. Ecol. Conserv. 2020, 24, e01242. [Google Scholar] [CrossRef]
  15. Gong, G.; Wang, Y.; Zhu, Z.; Wang, Y.; Hörandl, E.; Wang, X.; Xue, Z.; He, L. Evolutionary Population Dynamics and Conservation Strategies for Salix baileyi—A Species with Extremely Small Populations. Glob. Ecol. Conserv. 2025, 58, e03504. [Google Scholar] [CrossRef]
  16. Yuan, S.; Zeng, G.; Zhang, K.; Wu, M.; Zhang, D.; Harder, L.D.; Barrett, S.C.H. Diverse Mating Consequences of the Evolutionary Breakdown of the Sexual Polymorphism Heterostyly. Proc. Natl. Acad. Sci. USA 2023, 120, e2214492120. [Google Scholar] [CrossRef]
  17. Zhao, J.; Xu, L.; Xie, H.; Zhao, D.; Huang, M. RAPD Analysis of Genetic Diversity in Tamarix Populations from the Yellow River Delta. J. Nanjing For. Univ. 2008, 05, 56–60. [Google Scholar]
  18. Gross, N.; Maestre, F.T.; Liancourt, P.; Berdugo, M.; Martin, R.; Gozalo, B.; Ochoa, V.; Delgado-Baquerizo, M.; Maire, V.; Saiz, H.; et al. Unforeseen Plant Phenotypic Diversity in a Dry and Grazed World. Nature 2024, 632, 808–814. [Google Scholar] [CrossRef]
  19. Chen, Y.; Yan, W.; Wu, H.; Qu, Z. Genetic Diversity Analysis of Elymus sibiricus under Drought Stress. Grassl. Turf 2014, 34, 11–17+22. [Google Scholar] [CrossRef]
  20. Hao, L.; Zhang, L.; Zhang, G.; Wang, Y.; Han, S.; Bai, Y. Genetic Diversity and Population Structure Analysis of Salix psammophila. Acta Bot. Boreali-Occident. Sin. 2017, 37, 1507–1516. [Google Scholar]
  21. Zhang, R.; Gong, Y.; Tan, M. Spatiotemporal Variation and Regional Comparison of NDVI in Arid Central Asia. Res. Environ. Sci. 2025, 38, 90–100. [Google Scholar] [CrossRef]
  22. Zeng, J.; Zou, Y.; Bai, J.; Zheng, H. Preparation of Total DNA from “Recalcitrant Plant Taxa”. Acta Bot. Sin. 2002, 44, 694–697. [Google Scholar]
  23. Zhang, X. Genetic Diversity Analysis and Cutting Propagation of Wild Willows in Chifeng Region. Master’s Thesis, Inner Mongolia Agricultural University, Hohhot, China, 2015. [Google Scholar]
  24. Raja, R.; Singh, N.; Bhat, S. Assessment of Genetic Diversity among High Yielding Selected Salix Clones Using RAPD and SSR Markers. Genetika 2018, 50, 983–994. [Google Scholar] [CrossRef]
  25. King, R.A.; Harris, S.L.; Karp, A.; Barker, J.H.A. Characterisation and Inheritance of Nuclear Microsatellite Loci for Use in Population Studies of the Allotetraploid Salix alba–Salix fragilis Complex. Tree Genet. Genomes 2010, 6, 247–258. [Google Scholar] [CrossRef]
  26. Pritchard, J.K.; Stephens, M.; Donnelly, P. Inference of Population Structure Using Multilocus Genotype Data. Genetics 2000, 155, 945–959. [Google Scholar] [CrossRef]
  27. Malekmohammadi, L.; Sheidai, M.; Ghahremaninejad, F.; Danehkar, A.; Koohdar, F. Studies on Genetic Diversity, Gene Flow and Landscape Genetics in Avicennia marina: Spatial PCA, Random Forest, and Phylogeography Approaches. BMC Plant Biol. 2023, 23, 459. [Google Scholar] [CrossRef]
  28. Ellis, N.; Smith, S.J.; Pitcher, C.R. Gradient Forests: Calculating Importance Gradients on Physical Predictors. Ecology 2012, 93, 156–168. [Google Scholar] [CrossRef]
  29. Zhao, W.; Wang, X.; Li, L.; Li, J.; Yin, H.; Zhao, Y.; Chen, X. Evaluation of Environmental Factors Affecting the Genetic Diversity, Genetic Structure, and the Potential Distribution of Rhododendron aureum Georgi under Changing Climate. Ecol. Evol. 2021, 11, 12294–12306. [Google Scholar] [CrossRef]
  30. Amiteye, S. Basic Concepts and Methodologies of DNA Marker Systems in Plant Molecular Breeding. Heliyon 2021, 7, e08093. [Google Scholar] [CrossRef]
  31. Lander, T.A.; Klein, E.K.; Roig, A.; Oddou-Muratorio, S. Weak Founder Effects but Significant Spatial Genetic Imprint of Recent Contraction and Expansion of European Beech Populations. Heredity 2021, 126, 491–504. [Google Scholar] [CrossRef]
  32. Zwaenepoel, A.; Sachdeva, H.; Fraïsse, C. The Genetic Architecture of Polygenic Local Adaptation and Its Role in Shaping Barriers to Gene Flow. Genetics 2024, 228, iyae140. [Google Scholar] [CrossRef]
  33. Adams, N.E.; Bandivadekar, R.R.; Battey, C.J.; Clark, M.W.; Epperly, K.; Ruegg, K.; Tell, L.A.; Bay, R.A. Widespread Gene Flow Following Range Expansion in Anna’s Hummingbird. Mol. Ecol. 2023, 32, 3089–3101. [Google Scholar] [CrossRef] [PubMed]
  34. González-Díaz, P.; Gazol, A.; Valbuena-Carabaña, M.; Sangüesa-Barreda, G.; Moreno-Urbano, A.; Zavala, M.A.; Camarero, J.J. Remaking a Stand: Links between Genetic Diversity and Tree Growth in Expanding Mountain Pine Populations. For. Ecol. Manag. 2020, 472, 118244. [Google Scholar] [CrossRef]
  35. Adams, R.V.; Burg, T.M. Influence of Ecological and Geological Features on Rangewide Patterns of Genetic Structure in a Widespread Passerine. Heredity 2015, 114, 143–154. [Google Scholar] [CrossRef]
  36. Dias, E.F.; Moura, M.; Schaefer, H.; Silva, L. Geographical Distance and Barriers Explain Population Genetic Patterns in an Endangered Island Perennial. AoB Plants 2016, 8, plw072. [Google Scholar] [CrossRef]
  37. Pfeifer, M.; Jetschke, G. Influence of Geographical Isolation on Genetic Diversity of Himantoglossum hircinum (Orchidaceae). Folia Geobot. 2006, 41, 3–20. [Google Scholar] [CrossRef]
  38. Hindley, J.A.; Graham, B.A.; Pulgarin-R., P.C.; Burg, T.M. The Influence of Latitude, Geographic Distance, and Habitat Discontinuities on Genetic Variation in a High Latitude Montane Species. Sci. Rep. 2018, 8, 11846. [Google Scholar] [CrossRef]
  39. Hirao, A.S.; Watanabe, M.; Tsuyuzaki, S.; Shimono, A.; Li, X.; Masuzawa, T.; Wada, N. Genetic Diversity within Populations of an Arctic–Alpine Species Declines with Decreasing Latitude across the Northern Hemisphere. J. Biogeogr. 2017, 44, 2740–2751. [Google Scholar] [CrossRef]
  40. Bohonak, A.J. IBD (Isolation by Distance): A Program for Analyses of Isolation by Distance. J. Hered. 2002, 93, 153–154. [Google Scholar] [CrossRef]
  41. Westram, A.M.; Stankowski, S.; Surendranadh, P.; Barton, N. What Is Reproductive Isolation? J. Evol. Biol. 2022, 35, 1143–1164. [Google Scholar] [CrossRef]
  42. Liao, J.; Chen, S.; Liu, P.; Fontaneto, D.; Han, B. Environmental Selection and Gene Flow Jointly Determine the Population Genetic Diversity and Structure of Diaphanosoma dubium along a Watershed Elevation. Glob. Ecol. Conserv. 2024, 49, e02773. [Google Scholar] [CrossRef]
  43. Kling, M.M.; Ackerly, D.D. Global Wind Patterns Shape Genetic Differentiation, Asymmetric Gene Flow, and Genetic Diversity in Trees. Proc. Natl. Acad. Sci. USA 2021, 118, e2017317118. [Google Scholar] [CrossRef] [PubMed]
  44. Tan, J.; Wan, J.; Luo, F.; Yu, F. Relationships between Genetic Diversity of Vascular Plant Species and Climate Factors. J. Resour. Ecol. 2018, 9, 663–672. [Google Scholar] [CrossRef]
  45. Pauls, S.U.; Nowak, C.; Bálint, M.; Pfenninger, M. The Impact of Global Climate Change on Genetic Diversity within Populations and Species. Mol. Ecol. 2013, 22, 925–946. [Google Scholar] [CrossRef]
  46. Lu, M.; Krutovsky, K.V.; Loopstra, C.A. Predicting Adaptive Genetic Variation of Loblolly Pine (Pinus taeda L.) Populations under Projected Future Climates Based on Multivariate Models. J. Hered. 2019, 110, 857–865. [Google Scholar] [CrossRef]
  47. Ramírez-Aliaga, P.; Foyo-Moreno, I.; Cariñanos, P. Effects of Environmental Stress on the Pollen Viability of Ornamental Tree-Species in the City of Granada (South-Eastern Spain). Forests 2022, 13, 2131. [Google Scholar] [CrossRef]
  48. Myklestad, Å.; Birks, H.J.B. A Numerical Analysis of the Distribution Patterns of Salix L. Species in Europe. J. Biogeogr. 1993, 20, 1–32. [Google Scholar] [CrossRef]
  49. Chen, Z.; Gao, H.; Wu, H.; Xue, X.; Ren, J. Comparative Transcriptome Analysis Reveals the Molecular Mechanism of Salt Combined with Flooding Tolerance in Hybrid Willow (Salix matsudana × alba). Forests 2023, 14, 1858. [Google Scholar] [CrossRef]
Figure 1. Study area overview and Salix alba sampling map. Note: Description of abbreviations for study sites can be found in Table 1.
Forests 16 00725 g001
Figure 2. Maximum ΔK values indicate that K = 3 is the most likely number of subpopulations for the Salix alba assemblage analyzed.
Forests 16 00725 g002
Figure 3. Probability of assigning 320 Salix alba individuals to three genetic clusters using Bayesian clustering results obtained by STRUCTURE. Note: Colors represent distinct genetic clusters (Cluster 1: blue, Cluster 2: purple, Cluster 3:orange) and numbers 1–20 indicate the posterior probability values (×100) for each individual.
Forests 16 00725 g003
Figure 4. Principal coordinate analysis (PCoA) of 320 individuals from 10 Salix alba populations. Note: See Table 1 for a description of stock abbreviations.
Forests 16 00725 g004
Figure 5. Random forest model. Note: elevation-diff: elevation difference, latitude-diff: latitude difference, longitude-diff: longitude difference, geo-distance: differences in geographical distance.
Forests 16 00725 g005
Figure 6. Analysis of trends in genetic diversity by geographic factors.
Forests 16 00725 g006
Figure 7. Trend analysis of climate factors on genetic diversity. Note: Bio19: Precipitation of coldest quarter (mm), Bio17: Precipitation of driest quarter (mm), Bio11: Mean temperature of coldest quarter (°C), Bio15: Precipitation seasonality (mm), Bio2: Mean diurnal temperature range (°C), Bio9: Mean temperature of driest quarter (°C).
Forests 16 00725 g007
Table 1. Sample collection information of wild Salix alba population.
Group NumberPopulationNumber of PopulationsSample Size
1Altay653
2Tacheng316
3Ili618
4Urumqi23
5Turpan111
6Hami246
7Bayingolin317
8Aksu763
9Kashgar873
10Hotan220
Table 2. Genetic diversity index from SSR loci analysis in Salix alba populations.
Name of PrimersN SizeNaNehIPIC
SB114832021.51270.30610.45930.6759
SB117232021.20170.12840.21960.7787
SB118532021.2490.1560.26130.5762
SB2432021.41170.23330.35540.8102
SB28832021.32710.21580.34670.8103
SB3832021.22920.14990.24570.6993
SB43032021.31840.19250.30510.8002
SB56532021.31910.20320.33180.7418
SB80032021.48310.29270.4540.7587
SB98432021.02380.02310.06130.05456
Note: N Size is the number of individuals in the sample, Na is the number of alleles, Ne is the number of effective alleles, h is the gene diversity index, I is the Shannon diversity index, and PIC is the polymorphic informativeness.
Table 3. Genetic diversity index of primers.
Name of PrimersForward PrimerReverse Primer
SB1148TAGGATGTTTCTGAGGCTTTCAGACTTGCTAGAGACTTGGCC
SB1172AGGACATTCATAACACACACACTGAAGCCATCTTCTCAAGGA
SB1185TGAGGTCATGGTTGAGTTATGATGGTGCCTGCAATCTTTAAC
SB24ACTTCAATCTCTCTGTATTCTCTATTTATGGGTTGGTCGATC
SB288AGGCTTCACTGTCTCCTCTAGTCATCACAGCATCTTATCAGG
SB38CCACTTGAGGAGTGTAAGGATCTTAAATGTAAAACTGAATCT
SB430CACCCTCATAACAAAAATGGCCAAATCAGAAAAGAAGTTAAC
SB565GAAAATATAATGCCCAGGAAGACAGAACACAGCGACATGAAC
SB800TAATGGAGTTCACAGTCCTCCATACAGAGCCCATTTCATCAC
SB984ACAATCACACTTCGCATATCAGGATGGAAAGATTCAAGGATT
Note: The final primer sequences used are all referenced from Zhang, 2015 [23].
Table 4. Diversity indicators in Salix alba for different geographic sites in Xinjiang, China, obtained by ten SSR loci analysis.
AreasNNaNehIHtGstNm
Altay531.48071.14420.09180.14980.08510.15962.6322
Tacheng161.25431.13570.0820.12540.08190.13563.1866
Ili181.56561.37060.20950.30880.18410.51190.4767
Urumqi31.3661.29280.16260.2330.12210.40330.7398
Turpan111.56741.1310.10240.18310.19880.95690.0225
Hami461.55991.05020.0450.09470.0880.11293.9306
Bayingolin171.28241.20050.11730.17110.13320.750.1667
Aksu631.63971.17170.10720.17440.11440.45180.6066
Kashgar731.44661.1780.1080.16560.11860.48020.5413
Hotan201.32971.04840.03940.07620.04930.55770.3956
Note: N is the number of individuals in the sample, Na is the number of alleles, Ne is the number of effective alleles, h is the gene diversity index, I is the Shannon diversity index, Ht is the total genetic diversity, Gst is the genetic differentiation index, and Nm is the gene flow index.
Table 5. Genetic distance and genetic similarity coefficient.
PopAltayTachengIliUrumqiTurpanHamiBayingolinAksuKashgarHotan
Altay 0.98460.94250.94610.84360.82840.88370.86050.84460.8099
Tacheng0.0155 0.93830.94650.83650.82250.88640.85960.84460.808
Ili0.05920.0637 0.97520.86230.84020.89190.87410.85620.8238
Urumqi0.05540.05490.0251 0.86060.83790.88790.86810.84970.8188
Turpan0.170.17850.14820.1501 0.99270.96810.97870.97170.9838
Hami0.18820.19540.17410.17680.0074 0.97690.98260.97670.9946
Bayingolin0.12370.12060.11440.11890.03240.0234 0.98160.97480.9715
Aksu0.15030.15130.13450.14140.02150.01760.0186 0.99590.9739
Kashgar0.16890.16890.15520.16290.02870.02350.02560.0041 0.9684
Hotan0.21090.21310.19380.19990.01630.00540.0290.02640.0321
Note: The lower left corner of the table is the genetic distance, the upper right corner is the genetic similarity coefficient.
Disclaimer/Publisher’s Note: The statements, opinions and data contained in all publications are solely those of the individual author(s) and contributor(s) and not of MDPI and/or the editor(s). MDPI and/or the editor(s) disclaim responsibility for any injury to people or property resulting from any ideas, methods, instructions or products referred to in the content.

