Abstract
In order to clarify the change characteristics of soil organic carbon and its components in sandy land after restoration of different artificial vegetation measures, this study took 4 common artificial planting measures in Hulunbuir Sandy Land as the research object and took mobile sandy land as the control (CK). The results show the following: (1) The soil organic carbon content of the treatment measures was as follows: arbor-irrigation-grass (22.96 g·kg−1) > single arbor (12.68 g·kg−1) > single shrub (11.17 g·kg−1) > single herb (8.89 g·kg−1) > CK (1.14 g·kg−1). The soil organic carbon showed an increasing trend, and the change was significant. (2) The contents of POC (Particulate Organic Carbon), MBC (Microbial Organic Carbon), DOC (Soluble Organic Carbon) and EOC () in soil were significantly increased by planting treatment measures, and the contents of each component in the combination mode of tree, shrub and grassland were the highest, which were increased by 1541.32%, 302.44%, 340% and 204.88% compared with CK. (3) There Please check that intended meaning has been retained. was a significant positive correlation between SOC and its components, and the correlation coefficients were 0.93, 0.91, 0.93, and 0.93, respectively. TC, TN and TP are all important influencing factors of POC. The correlation coefficient between DOC and MBC, MBC and EOC reached 0.96. (4) The carbon sequestration effect of the combination of trees, shrubs, and grassland is good, and the vegetation growth is good, which is conducive to the accumulation of organic carbon in the surface soil. It is suggested that the combination of treess, shrubs, and grassland should be adopted in the process of sandy land management.
1. Introduction
Desertification, caused by the aggravation of global climate change and the expansion of human livestock activities, has become an increasingly serious problem and has gradually become the focus of global attention [1]. Land desertification causes a series of serious ecological problems, such as soil erosion, a serious decline in land productivity, and environmental degradation [2,3]. Establishment of artificial vegetation can significantly sequester organic carbon and is an effective measure to combat land desertification [4]. The Hulunbuir Sandy Land ecological zone is fragile, and certain disturbances will affect the accumulation of organic carbon and exacerbate regional desertification. Soil organic carbon (SOC) plays a key role in regulating soil fertility and function, affects plant productivity [5,6], and is of great significance in evaluating the effectiveness of different modes of vegetation restoration [7,8]. There are certain gaps in species selection, hydrothermal conditions, biomass, and other aspects of different vegetation restoration models, and there are also significant gaps in their carbon sequestration capacity [9]. The establishment of artificial vegetation patterns has a contributing effect on organic carbon content and stability [10]. Relevant studies showed that the carbon sequestration amount and carbon sequestration rate of soil increased significantly after artificial intervention to restore vegetation, and the selection of artificial vegetation type had the most significant effect on the carbon sequestration amount and carbon sequestration rate of soil [11].
Mineral-bound organic carbon (MOC), particulate organic carbon (POC), etc., although accounting for a relatively small proportion of organic carbon, are more sensitive in their performance in response to different types of vegetation patterns [12,13]. Soil organic carbon includes active organic carbon and steady-state organic carbon, and active organic carbon is more active in the soil carbon pool, which is easily affected by different kinds of vegetation patterns, and can be used as an important indicator of changes in the organic carbon pool [14]. The soil’s active organic carbon pool often includes components such as microbial carbon (MBC), particulate carbon (POC), soluble carbon (DOC), and easily oxidizable carbon (EOC), which are the most sensitive indicators of soil health and environmental change [15], and it is an important way to promote the stabilization of the organic carbon pool and to achieve the goal of “double carbon”. Domestic scholars have studied the organic carbon fractions of different communities in several regions, and some concluded that the soil organic matter carbon content varies greatly among different vegetation types, and that fine roots and apoplastic matter play a key role in the accumulation of soil organic carbon pools [16,17,18]. Xi Pan et al. concluded by analyzing the content of organic carbon fractions of typical vegetation communities in Yancheng beach wetlands that the organic carbon fractions of different vegetation types have certain differences, and the organic carbon content of each vegetation community showed a decreasing trend with the increase soil depth. Therefore, it is particularly important to investigate the differences in soil organic carbon and its components in the surface layer of the soil in the management areas of different artificial vegetation patterns to regulate the soil nutrient balance. Chen Wen et al. [19] compared the common vegetation in the Mao Wusu Sandland, and the carbon sequestration capacity of 0–40 cm soil was Artemisia spp. < grassland < camphor pine. However, Jiang Lina et al. [20] concluded that the organic carbon content of grassland was higher than that of trees and shrubs in the same area. The study and exploration of the carbon sequestration capacity of different types of vegetation patterns still need to be deepened. In addition, there are differences in the effects of vegetation management patterns on the carbon content of different soil layers. Related literaTure [21] found that the organic carbon content of artificially planted acacia samples in the 0–20 cm soil layer was 1.6 times that of the control, but the change in the deep soil layer was not significant. The increase organic carbon in the surface soil layer was greater than that in the deep layer and other similar conclusions [22]. All of them confirmed that the establishment of a vegetation management mode had a greater impact on the carbon content of the soil surface layer.
The Hulunbuir Sandy Land adopts a variety of vegetation restoration modes to combat land desertification and increase the soil’s organic carbon pool [23]. In the context of China’s dual-carbon target and the construction of the Three North Project, it is important to explore the influence of artificial vegetation patterns on soil organic carbon pools. Based on this, this paper selects four kinds of sandlands governed by artificial vegetation restoration measures in the Hulunbuir Sandy Land, namely, arbor–irrigation–grass (camphor pine + poplar firewood + goatgrass), single arbor (camphor pine), single shrub (poplar firewood), and single herb (goatgrass), and takes the flowing sand land without any treatment as the control, to compare and study the content of soil organic carbon and its fractions in the topsoil (0–5 cm) with different vegetation management measures and screen the soil organic carbon and its fractions suitable for the region. We compared the differences in soil organic carbon and its component contents in different vegetation management measures in the surface soil (0–5 cm) and screened the vegetation management measures with the best carbon sequestration effect suitable for the region, to provide a Scientific basis for the method of sandy land vegetation restoration.
2. Materials and Methods
2.1. Overview of the Study Area
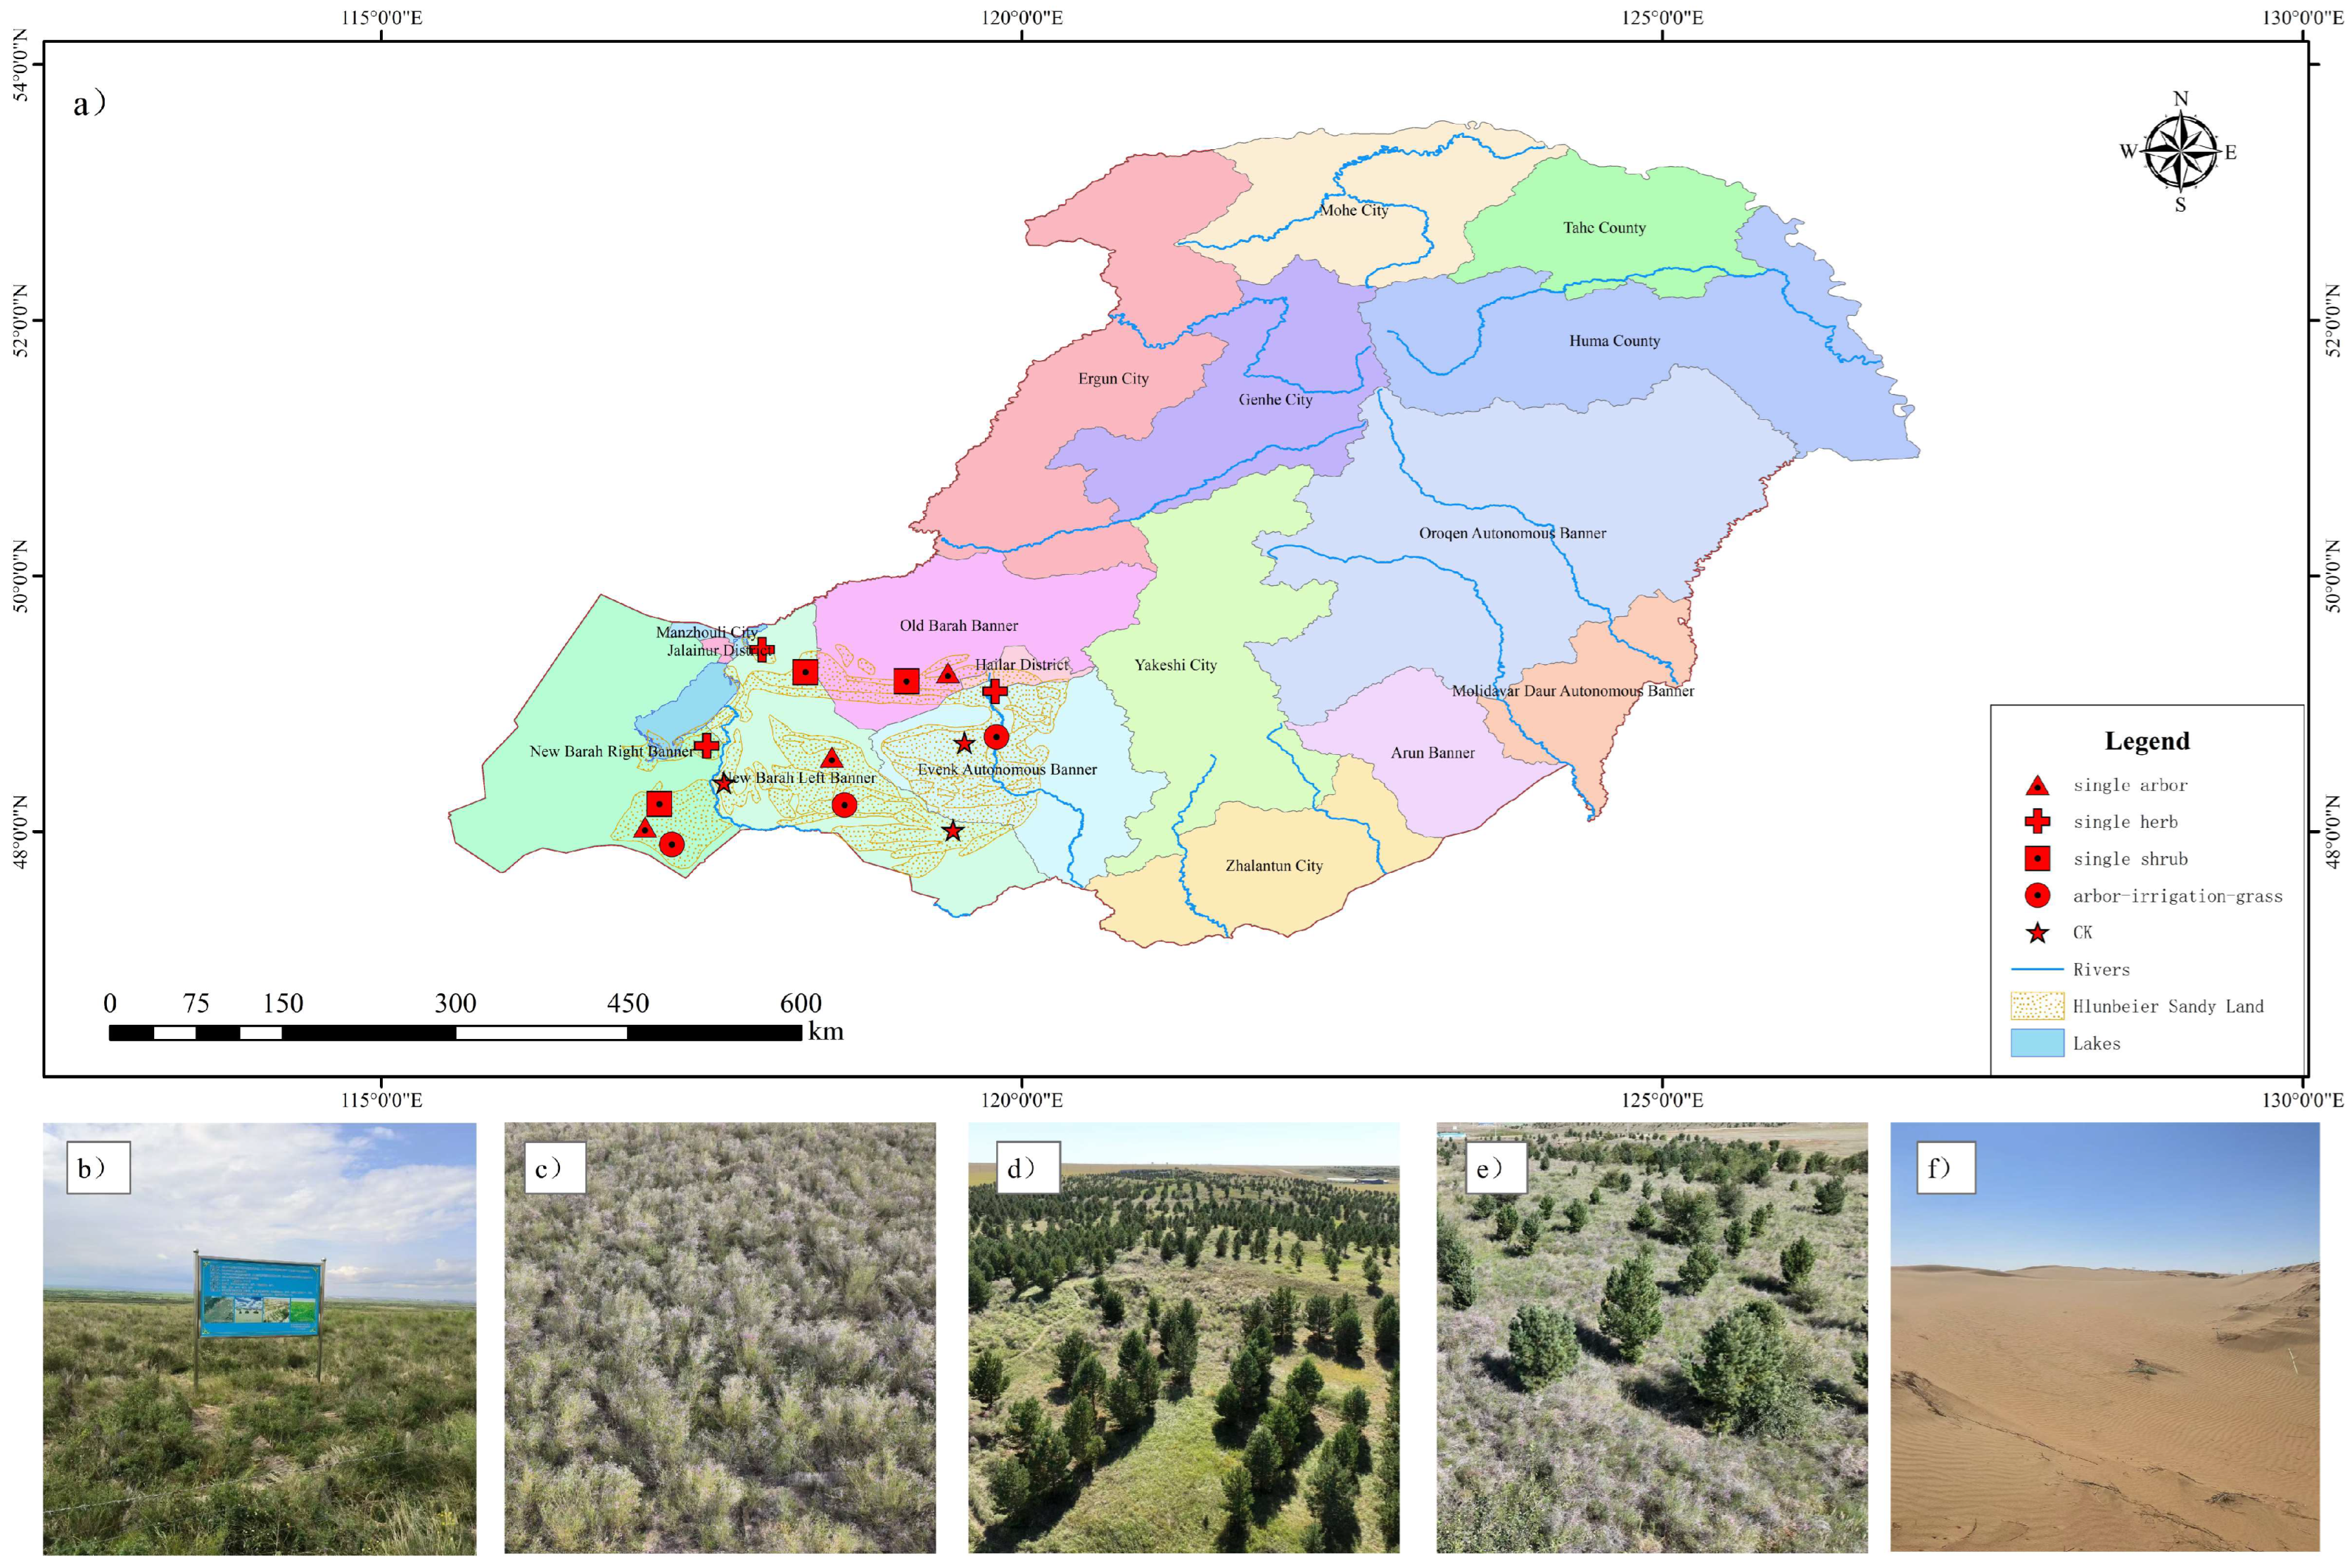
The general map of the study area is shown as follows Figure 1. The study area is located in the Hulunbuir Sandy Land (116°12′1°10′ E, 46°20′~49°50′ N), which is in northeastern Inner Mongolia, with a sandy area of nearly 10,000 km2. It is characterized by the transition between semi-humid and semi-arid, with an average annual precipitation of 280~400 mm, annual evapotranspiration of 1400~1900 mm concentrated in summer and autumn, and a relatively low annual temperature of 0~2.5 °C. The non-zonal soil in the study area is Aeolian sandy soil, mainly distributed in the sand belt and its periphery on the sandy plains, and the fixed wind sandy soil contains black sandy soil with a high content of organic matter, and the sand content in the soil is larger, generally medium and fine sand. The main types of vegetation restoration are camphor pine (Pinus sylvestris var. mongolica Litv.), poplar faggot (Hedysarum fruticosum), lemon mallow (Caragana korshinskii), goatgrass (Leymus chinensis), ice plant (Agropyron cristatum), Artemisia desertorum, Salsola collina, and so on. As one of the important ecological function protection zones and sensitive forest and grass transition zones in the Hulunbeier area, the long-term irrational development and utilization by human beings have led to serious land sanding and vegetation degradation in Hulunbeier. In this study, four kinds of artificial vegetation restoration measures were selected in the northern edge of the Hulunbuir Sandy Land: tree-shrub-grass composite, single tree, single shrub, single herb, and control sample plots, each of which was three pieces, totaling 15 pieces of sample plots. The selected sample plots are of similar elevation and years of treatment.
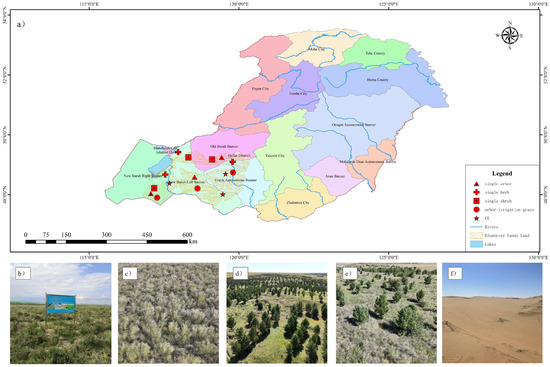
Figure 1.
Summary map of the study area. Note: The base map is produced using the standard map of the Inner Mongolia Autonomous Region Department of Natural Resources, with the review number of Meng S(2023)027 and no modification of the base map boundary. (a) is the map of the Hulunbeier administrative division; (b) is the map of the goat grass sample site; (c) is the map of the poplar firewood sample site; (d) is the map of the camphor pine forest sample site; (e) is the map of the camphor pine + poplar firewood + goat grass sample site; and f is the map of the actual photo of the flowing sandy land. (f) stands for Moving Sand (CK).
2.2. Research Methods
2.2.1. Test Sample Collection
In July 2023, four artificial vegetation patterns with similar elevation, growth conditions, and recovery years (5 years) were selected in the Hulunbuir Sandy Land: arbor–irrigation–grass (camphor pine + poplar firewood + goat grass), single arbor (camphor pine), single shrub (poplar firewood), and single herb (goat grass). Among them, herbs and Yangchai were sown by seeds, and Zhangsong was planted by seedlings. Soil samples were collected, and vegetation surveys were conducted separately, using mobile sandy areas as a control. A total of 3 sample plots were selected in each type of area, totaling 15 sample plots. The five-point method was used to sample the soil of each sample site and seal it in a plastic bag, which was brought back to the laboratory for the determination of organic carbon and its component contents. Three sample plots were selected on each vegetation restoration type and flowing sandy land, each sample plot was 20 × 20 m, three 1 × 1 m sample plots were randomly set for herbs, and three 5 × 5 m sample plots were randomly set for shrubs and trees, and the plant species, cover, density, height, and other indexes in the sample plots were investigated. The basic information and survey results of the sample plots are shown in Table 1.

Table 1.
Quadrat basic information table.
2.2.2. Sample Determination
The following instructions are for the determination of the soil organic carbon content: weigh soil samples to 30 + 0.01~0.99 mg and add concentrated phosphoric acid to the surface of the soil samples while completely wet (85%) phosphoric acid diluted 5 times); try to dry as much as possible after the treatment, otherwise the sample cell will easily to boil and splash out. After treatment, soil samples can be directly instrumented (shimadzu toc-v cph) (Shimadzu, Tokyo, Japan) to determine the soil organic carbon content. Particulate organic carbon (POC) was determined by the wet sieving method [24]; microbial organic carbon (MBC) was determined by the chloroform fumigation K2MnO4 extraction method [25]; soluble organic carbon (DOC) was determined by the leaching method [26]; easily oxidizable organic carbon (EOC) was determined by the K2MnO4 oxidation method–colorimetric method [27]. Soil total carbon (TC) was determined by the potassium dichromate oxidation–external heating method [28]; soil total nitrogen (TN) was determined by the Kjeldahl method [28]; and soil total phosphorus (TP) was determined by the perchloric acid–sulfuric acid method [28].
2.2.3. Calculation of Indicators
Soil organic carbon sequestration effect (SOCSE) was calculated by Equation (1) [29].
where SOCm,n and SOC0,n are the soil organic carbon content (g/kg) of the mth vegetation restoration type and the nth soil layer of the control, respectively.
2.2.4. Symbol List
Table 2 is a comparison table of the meanings of various abbreviations in this paper
Table 2.
Symbol abbreviation table.
2.2.5. Data Processing
The experimental data were analyzed and plotted using Microsoft Excel 2022 (2022, Microsoft, Redmond, WA, USA) and Origin 2021 (2021, OriginLab, Northampton, MA, USA) software, and the effects of soil organic carbon sequestration and the contents of each component were analyzed by one-way analysis of variance (one-way ANOVA) and Duncan’s method for ANOVA and multiple comparisons. The effect of soil organic carbon sequestration and the content of each component were analyzed by ANOVA and the Duncan method; Pearson correlation analysis was used to analyze the correlation between soil physical properties and organic carbon components. When p < 0.05, the results of the statistical analysis were considered to be significantly different; when p < 0.01, the results of the statistical analysis were considered to be extremely significantly different. The principal component analysis (PCA) and graphing of organic carbon and its components with plant growth indicators were completed using Origin 2021 software.
3. Results and Analysis
3.1. Differences in Surface Soil Organic Carbon Content of Different Artificial Vegetation Patterns
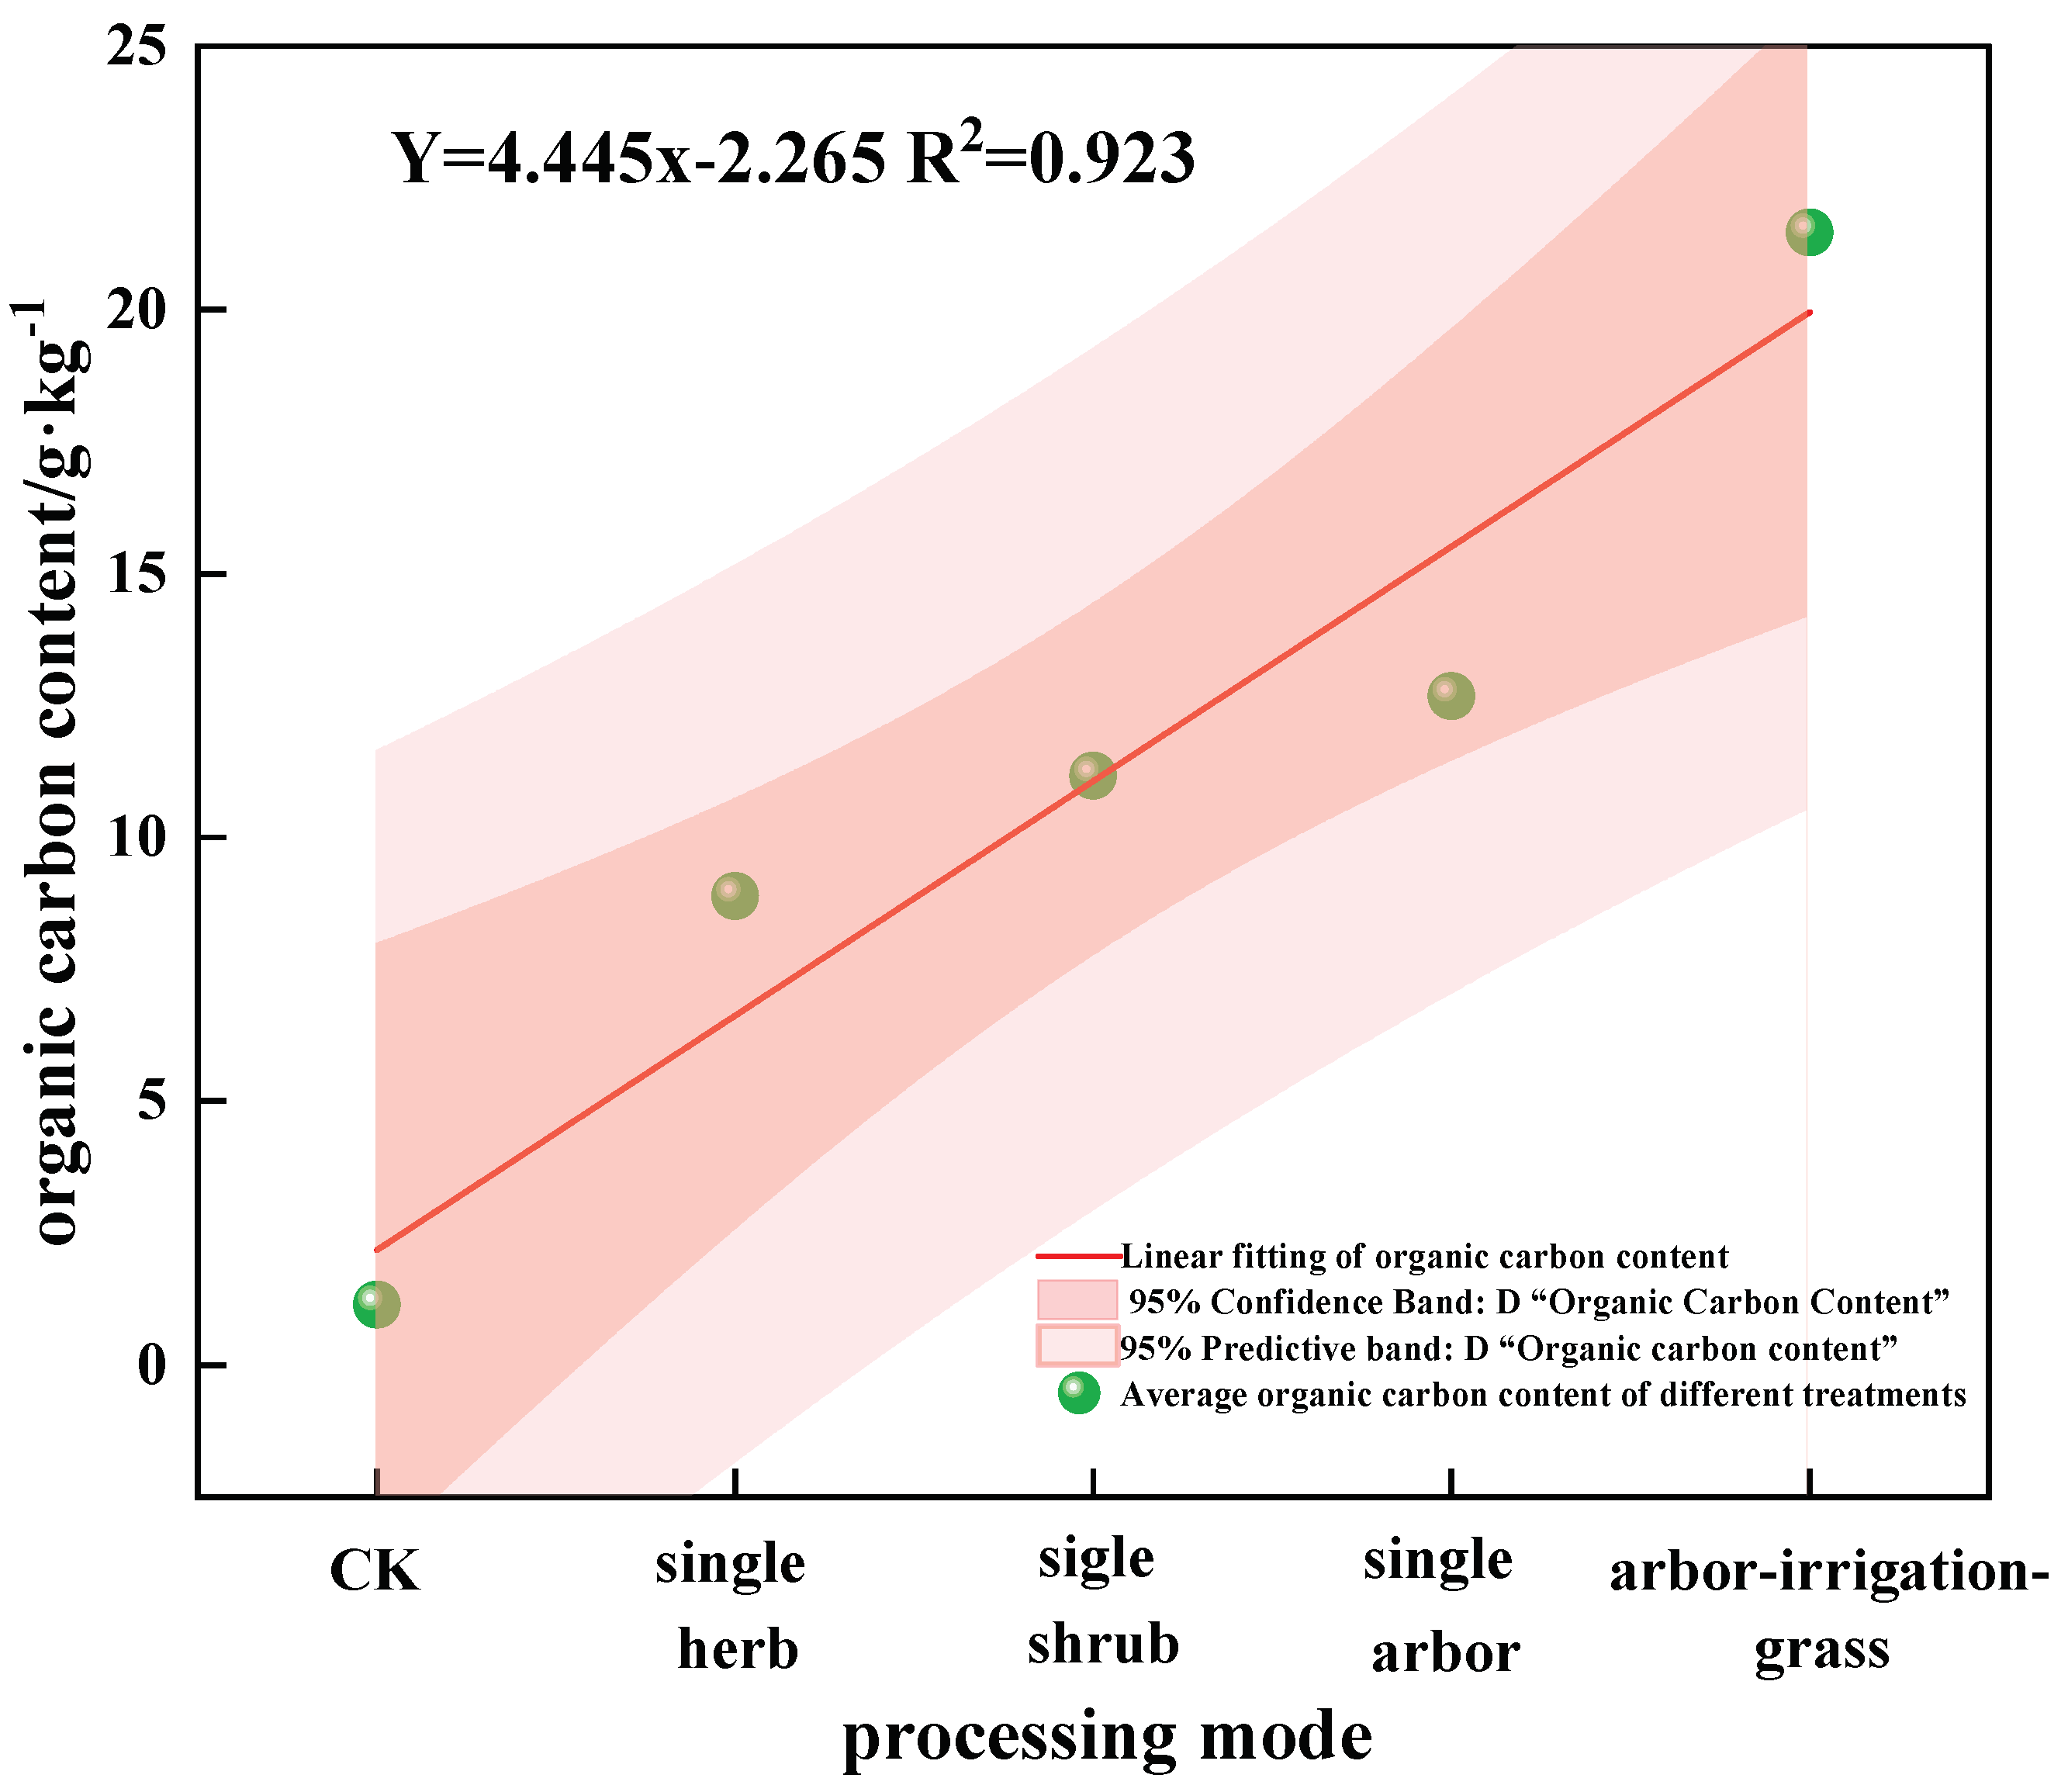
There were significant differences in soil organic carbon (SOC) content in the 0–5 cm surface layer of the four planted vegetation patterns, which were mainly shown as arbor–irrigation–grass (22.96 g.kg−1) > single arbor (12.68 g.kg−1) > single shrub (11.17 g.kg−1) > single herb (8.89 g.kg−1) > CK (1.14 g.kg−1). The organic carbon content of the arbor–irrigation–grass pattern was significantly higher than that of CK, which was 19.14 times higher than that of CK; there was no significant difference between the organic carbon content of monocultured trees, monocultured shrubs, and monocultured herbs plants, which were 10.22, 8.80, and 6.80 times higher than that of CK, respectively. The establishment of artificial vegetation was favorable to the accumulation of organic carbon, and different vegetation patterns had different effects on the organic carbon content, and the arbor–irrigation–grass pattern had the most obvious effect on the production and accumulation of soil organic carbon (Figure 2). Mainly due to the thicker layer of dead leaves and more complex root system in the arbor–irrigation–grass mode, the input of soil organic carbon increased continuously under the joint influence of the two [30,31]; the arbor–irrigation–grass mode is rich in plant species and high in microorganisms, which greatly promotes the decomposition and mineralization of soil organic matter, so the organic carbon content of the arbor–irrigation–grass combination mode was higher than that of the other modes.
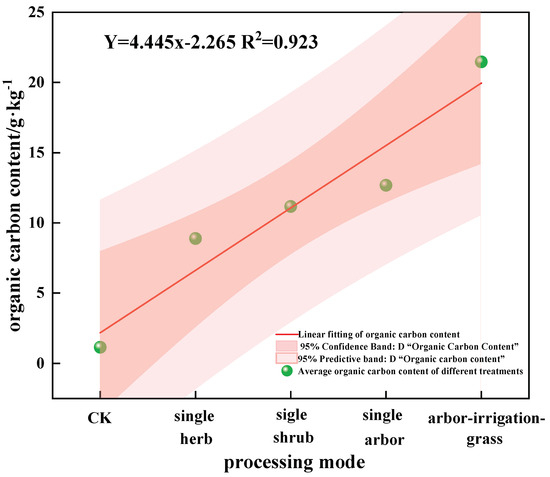
Figure 2.
Soil organic carbon content of different vegetation models.
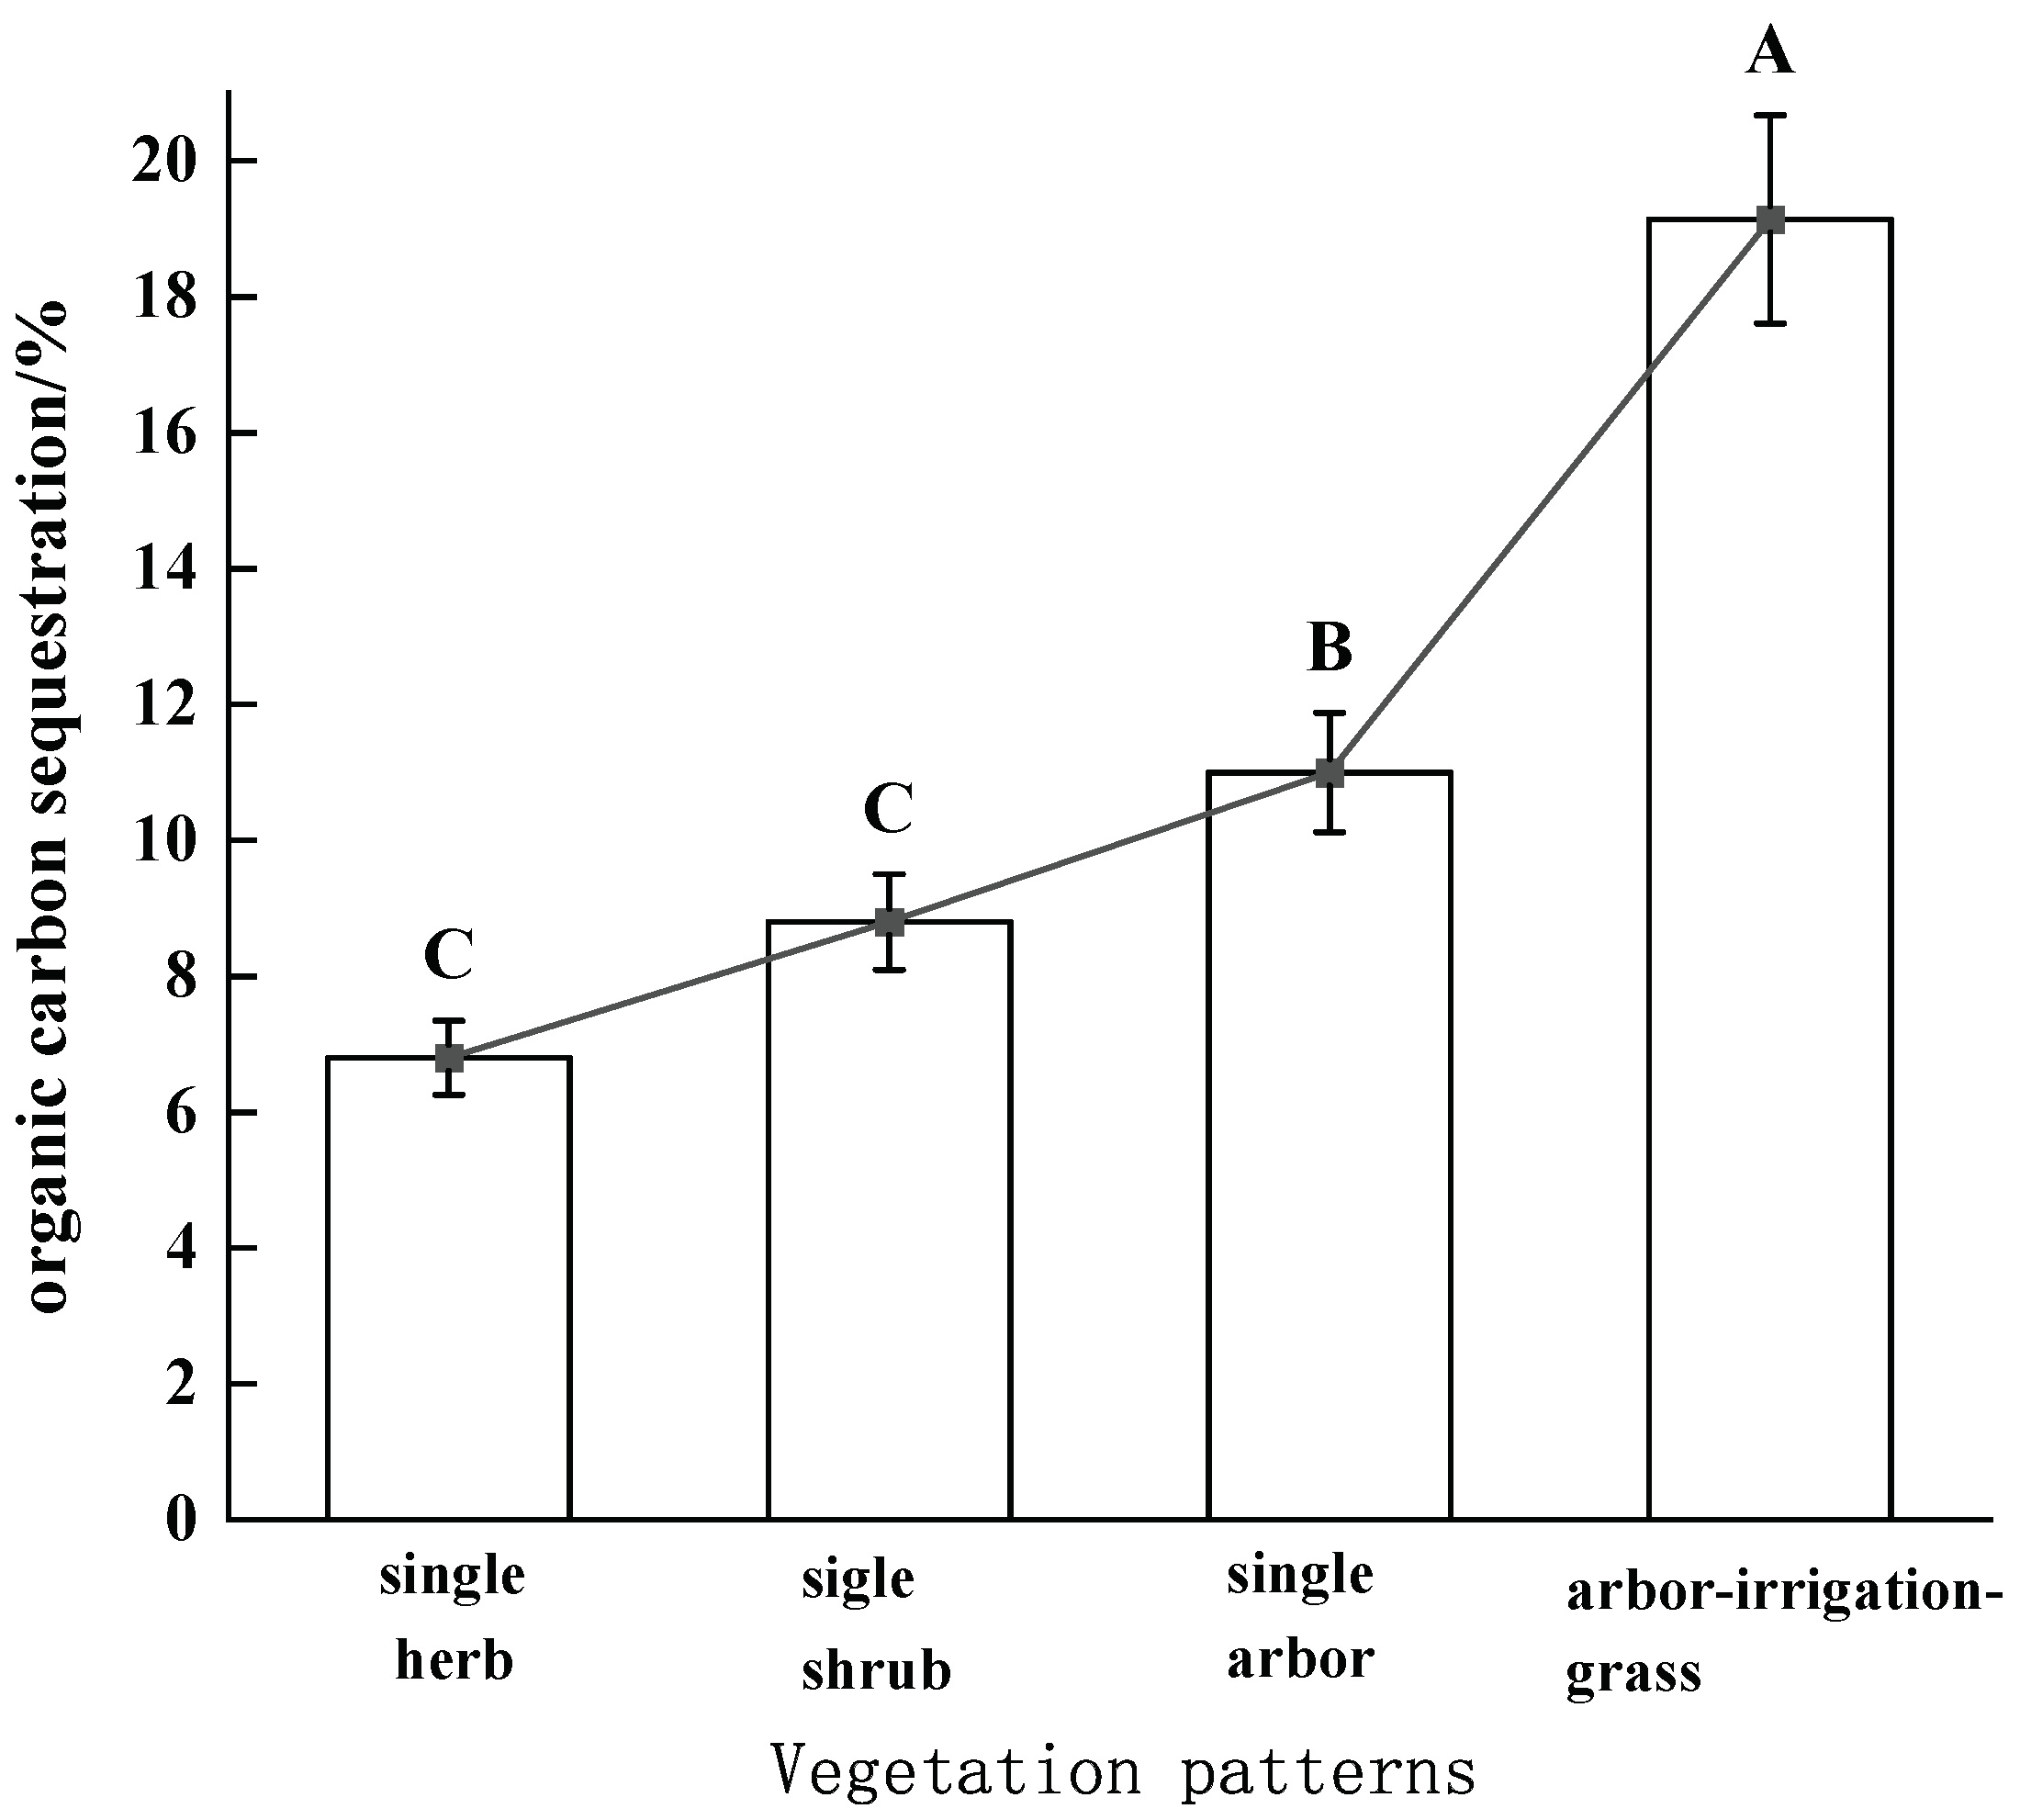
Soil organic carbon sequestration and soil organic carbon content had similar trends (Figure 3). Within the 0–5 cm soil layer, the soil organic carbon sequestration of the arbor–irrigation–grass model was the largest at 19.14%, with a more significant difference from the other models; the soil organic carbon sequestration of the single arbor soil was the next largest at 11%; and the organic carbon sequestration of the single-shrub and single-herb model was the smallest, at 8.8% and 6.8%, respectively. The difference in soil organic carbon sequestration between the combined arbor–irrigation–grass model and the other models was large, followed by arbor, and the difference in soil organic carbon sequestration between shrub and herb was not significant.

Figure 3.
Soil organic carbon sequestration effect of different vegetation models. Note: different capital letters indicate significant differences between different land types (p ≤ 0.05).
3.2. Differences in Surface Soil Organic Carbon Fractions in Different Artificial Vegetation Patterns
3.2.1. Differences in Soil Particulate Organic Carbon
Soil particulate organic carbon usually consists of semi-decomposed or undecomposed animal and plant residues, which is an important parameter of soil active organic carbon and is of great significance to improve the soil organic carbon pool. The content of soil particulate organic carbon varied from 3.51 mg.kg−1 to 57.6 mg.kg−1 with large fluctuations (Figure 4). The establishment of artificial vegetation greatly increased the content of particulate organic carbon in the topsoil layer, and the particulate organic carbon content of the arbor–irrigation–grass model was 57.6 mg.kg−1, with the highest increase of 1541.03% compared with that of CK. The content of particulate organic carbon in soil was different in different vegetation patterns. The particulate organic carbon content of a single herb was 8.33 mg.kg−1, which was 137.32% higher than that of CK; the particulate organic carbon content of a single shrub was 13.21 mg.kg−1, which was 276.35% higher than that of CK; and the particulate organic carbon content of a single arbor was 24.78 mg.kg−1, which was 605.98% higher than that of CK. This indicates that the establishment of artificial vegetation can effectively improve the soil particulate carbon content and the effect of the arbor–irrigation–grass mode is more significant.
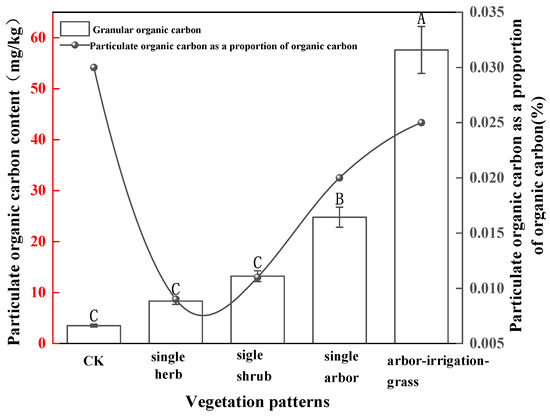
Figure 4.
Effects of different vegetation patterns on soil particulate organic carbon content. Note: different capital letters indicate significant differences between different vegetation types (p ≤ 0.05).
The ratio of soil particulate organic carbon (POC) to total soil organic carbon (SOC) is called the partition ratio of soil particulate organic carbon (POC/SOC), which can reflect more accurately the effect of different artificial vegetation patterns on soil carbon behavior and indicate the activity of soil particulate organic carbon (POC) fraction in soil organic carbon. The curves showed that POC/SOC floated between 0.009% and 0.03%, and the ratio of this component was higher in the flowing sandy land. The POC/SOC value (0.025%) of the arbor–irrigation–grass model was 25%, 127.27%, and 177.78% higher than that of the other mono-vegetation models, respectively. It indicated that the activity of soil particulate organic carbon was higher in mobile sandy land; although, the total amount of particulate organic carbon was lower, and the activity of soil particulate organic carbon in the combination of arbor–irrigation–grass mode was higher than that in the mono-vegetation mode.
3.2.2. Differences in Soil Microbial Organic Carbon
Soil microbial organic carbon characterizes the soil microbial population and is an important active source in the process of soil nutrient transformation. The content of soil microbial organic carbon varied between 50.47 mg.kg−1 and 203.11 mg.kg−1 and fluctuated greatly (Figure 5). Compared with the mobile sandy land, the soil microbial organic carbon content increased significantly after the establishment of artificial vegetation, and the microbial organic carbon content of the arbor–irrigation–grass model was 203.11 mg.kg−1, with the highest increase of 302.44% compared with that of CK. The microbial organic carbon content of the soil was different in different vegetation modes; the microbial organic carbon content of a single herb was 142.33 mg.kg−1, which was 182.01% higher than that of CK; the microbial organic carbon content of a single shrub was 158.08 mg.kg−1, which was 213.22% higher than that of CK; and the microbial organic carbon content of single arbor was 187.02 mg.kg−1, which was 270.22% higher than that of CK This indicates that the establishment of artificial vegetation can effectively improve the soil microbial organic carbon content, and the arbor–irrigation–grass model is more effective, followed by a single arbor.
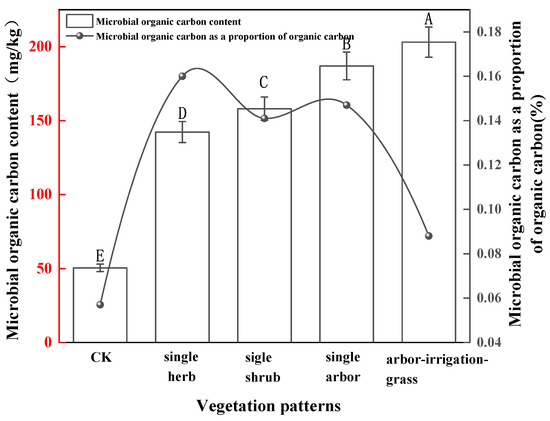
Figure 5.
Effects of different vegetation patterns on soil microbial organic carbon content. Note: different capital letters indicate significant differences between different land types (p ≤ 0.05).
The ratio of soil microbial organic carbon (MBC) to total soil organic carbon (SOC) represented the effectiveness of organic carbon, and MBC/SOC fluctuated from 0.057% to
0.16%, with the smallest ratio in the mobile sandy land, and the other four treatment modes increased by 180.7%, 147.37%, 157.89%, and 54.39% compared with that in the mobile sandy land, respectively. The highest ratio was 0.16% for a single herb, followed by 0.141% and 0.147% for a single shrub and a single arbor and 0.088% for the arbor–irrigation–grass combination. Although the soil organic carbon and soil microbial organic carbon contents were highest in the arbor–irrigation–grass combination model, the organic carbon turnover rate was lower.
3.2.3. Differences in Soil-Soluble Organic Carbon
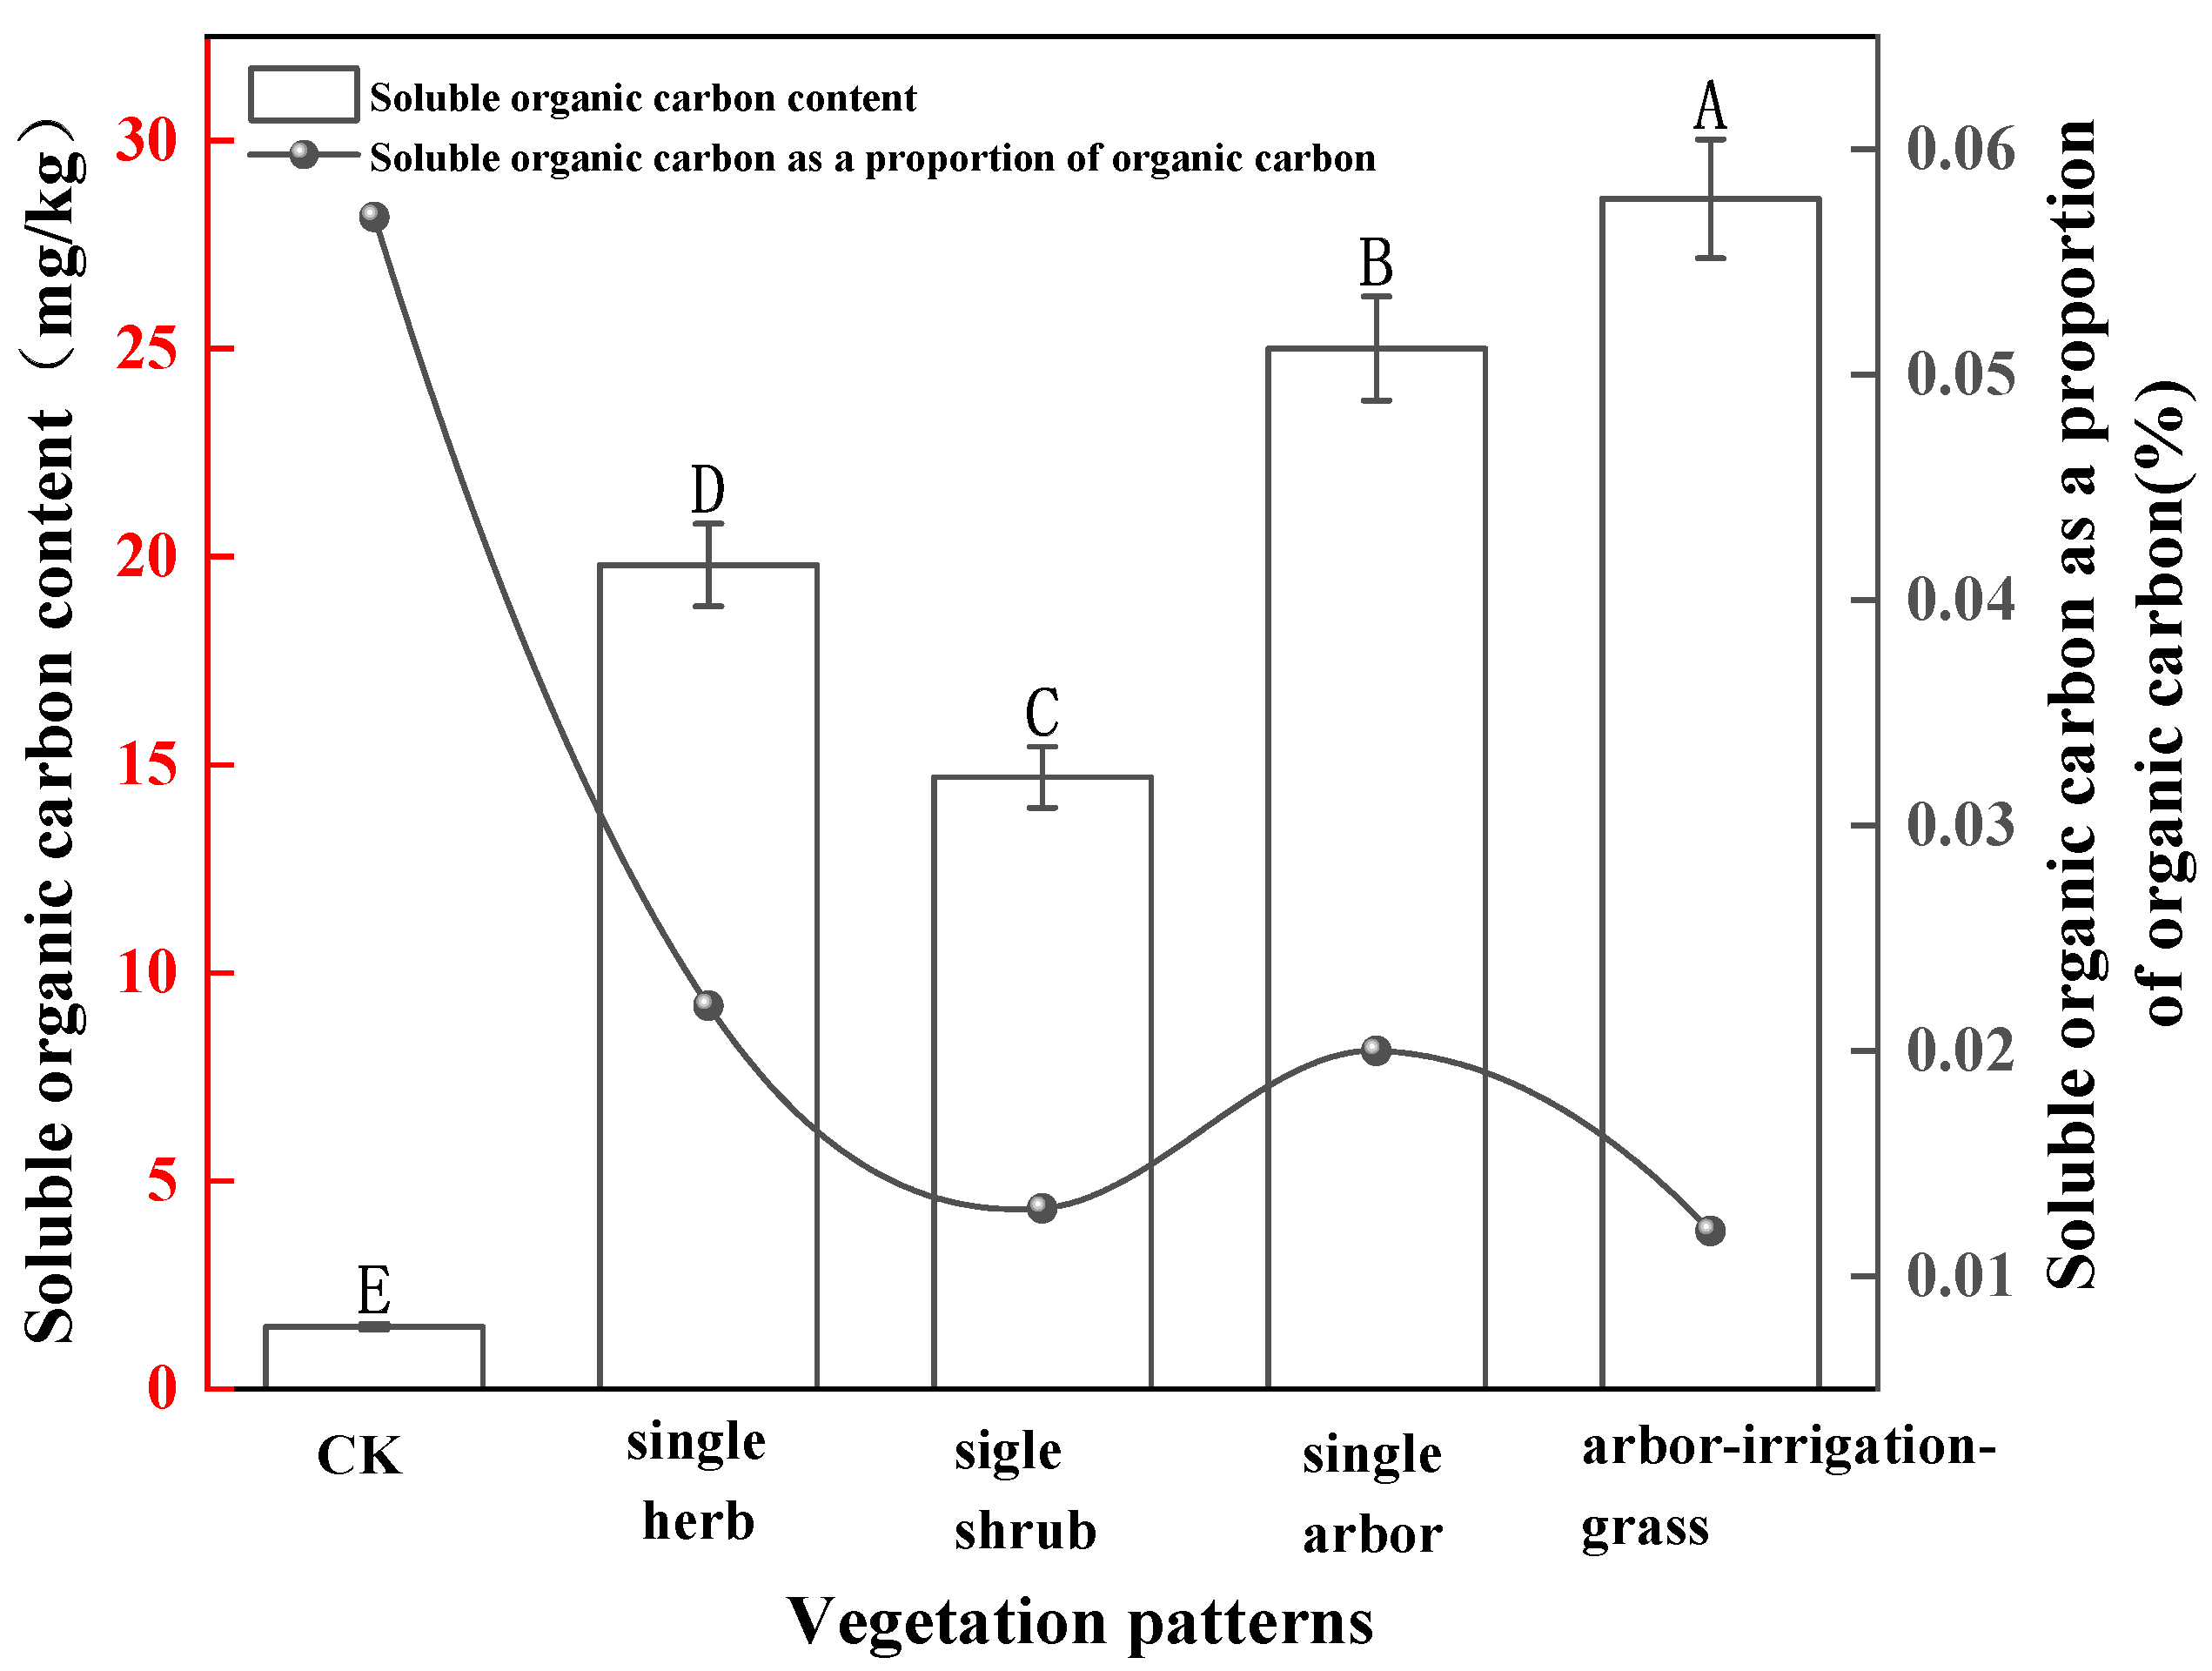
Soil-soluble organic carbon accounted for a small proportion of soil organic carbon content and was the most active part of it. The content of soil-soluble organic carbon varied and fluctuated between 6.5 mg.kg−1 and 28.6 mg.kg−1 (Figure 6). Compared with the mobile sandy land, the soil’s soluble organic carbon content increased significantly after the establishment of artificial vegetation, and the soluble organic carbon content of the arbor–irrigation–grass model was 28.6 mg.kg−1, with the highest increase of 340% compared with that of CK. The content of soluble organic carbon in the soil was different in different vegetation modes. The soluble organic carbon content of a single herb was 19.8 mg.kg−1, which was 204.62% higher than that of CK; the soluble organic carbon content of a single shrub was 14.7 mg.kg−1, which was 126.15% higher than that of CK; and the soluble organic carbon content of single arbor was 25 mg.kg−1, which was 284.62% higher than that of CK. This indicates that the establishment of artificial vegetation can effectively improve the soil’s soluble organic carbon content, and the arbor–irrigation–grass model is more effective, followed by the single arbor.

Figure 6.
Effects of different vegetation patterns on soil-soluble organic carbon content. Note: different capital letters indicate significant differences between different land types (p ≤ 0.05).
The ratio of soil soluble organic carbon (SOC) to total soil organic carbon (TOC) represented the activity of soil microorganisms, and DOC/SOC fluctuated from 0.012% to 0.057%, with the ratio of this component being higher in the flowing sandy land. The DOC/SOC of each vegetation pattern showed single herb (0.022%) > single arbor (0.020%) > single shrub (0.013%) ≈ arbor–irrigation–grass (0.012%). The total soluble organic carbon (SOC) was less but more active in the flowing sand; the soil SOC activity of the single herb model was higher than that of the other vegetation models.
3.2.4. Differences in Soil Easily Oxidized Organic Carbon
Soil oxidizable organic carbon (EOC) is an influencing factor of the soil biochemical transformation process, which is closely related to soil fertility, soil nutrients, and crop growth, and can better reflect the changes in soil quality, nutrient cycling, and transformation rate. The content of soil easily oxidized organic carbon varied between 4.1 mg.kg−1 and 12.5 mg.kg−1 with small fluctuations (Figure 7). Compared with the mobile sandy land, the content of soil oxidizable organic carbon increased significantly after the establishment of artificial vegetation, and the content of oxidizable organic carbon in the arbor–irrigation–grass mode was 12.5 mg.kg−1, which was the highest increase of 204.88% compared with that of CK. The content of soil oxidizable organic carbon was different in different vegetation patterns. The content of oxidizable organic carbon of a single herb was 7.2 mg.kg−1, which was 75.61% higher than that of CK; the content of oxidizable organic carbon of a single shrub was 10.6 mg.kg−1, which was 158.54% higher than that of CK; the content of oxidizable organic carbon of single arbor was 10.8 mg.kg−1, which was 163.41% higher than that of CK. This indicates that the establishment of artificial vegetation can effectively increase the content of soil oxidizable organic carbon, and the arbor–irrigation–grass model is more effective, followed by single arbor and single shrub.
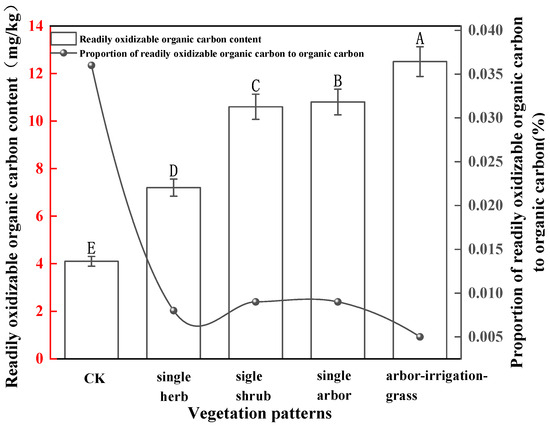
Figure 7.
Effects of different vegetation patterns on soil easily oxidized organic carbon content. Note: different capital letters indicate significant differences between different land types (p ≤ 0.05).
The EOC/SOC fluctuated from 0.005% to 0.036%, and this component was significantly higher than that of other vegetation modes in the mobile sandy land. The EOC/SOC of each vegetation pattern showed that single arbor (0.009%) = single shrub (0.009%) ≈ single herb (0.008%) > arbor–irrigation–grass (0.005%). The total amount of readily oxidizable organic carbon was less but more active in the flowing sand; the ratios did not differ much among the vegetation restoration models.
3.3. Effects of Soil Physical and Chemical Properties on Organic Carbon and Its Components
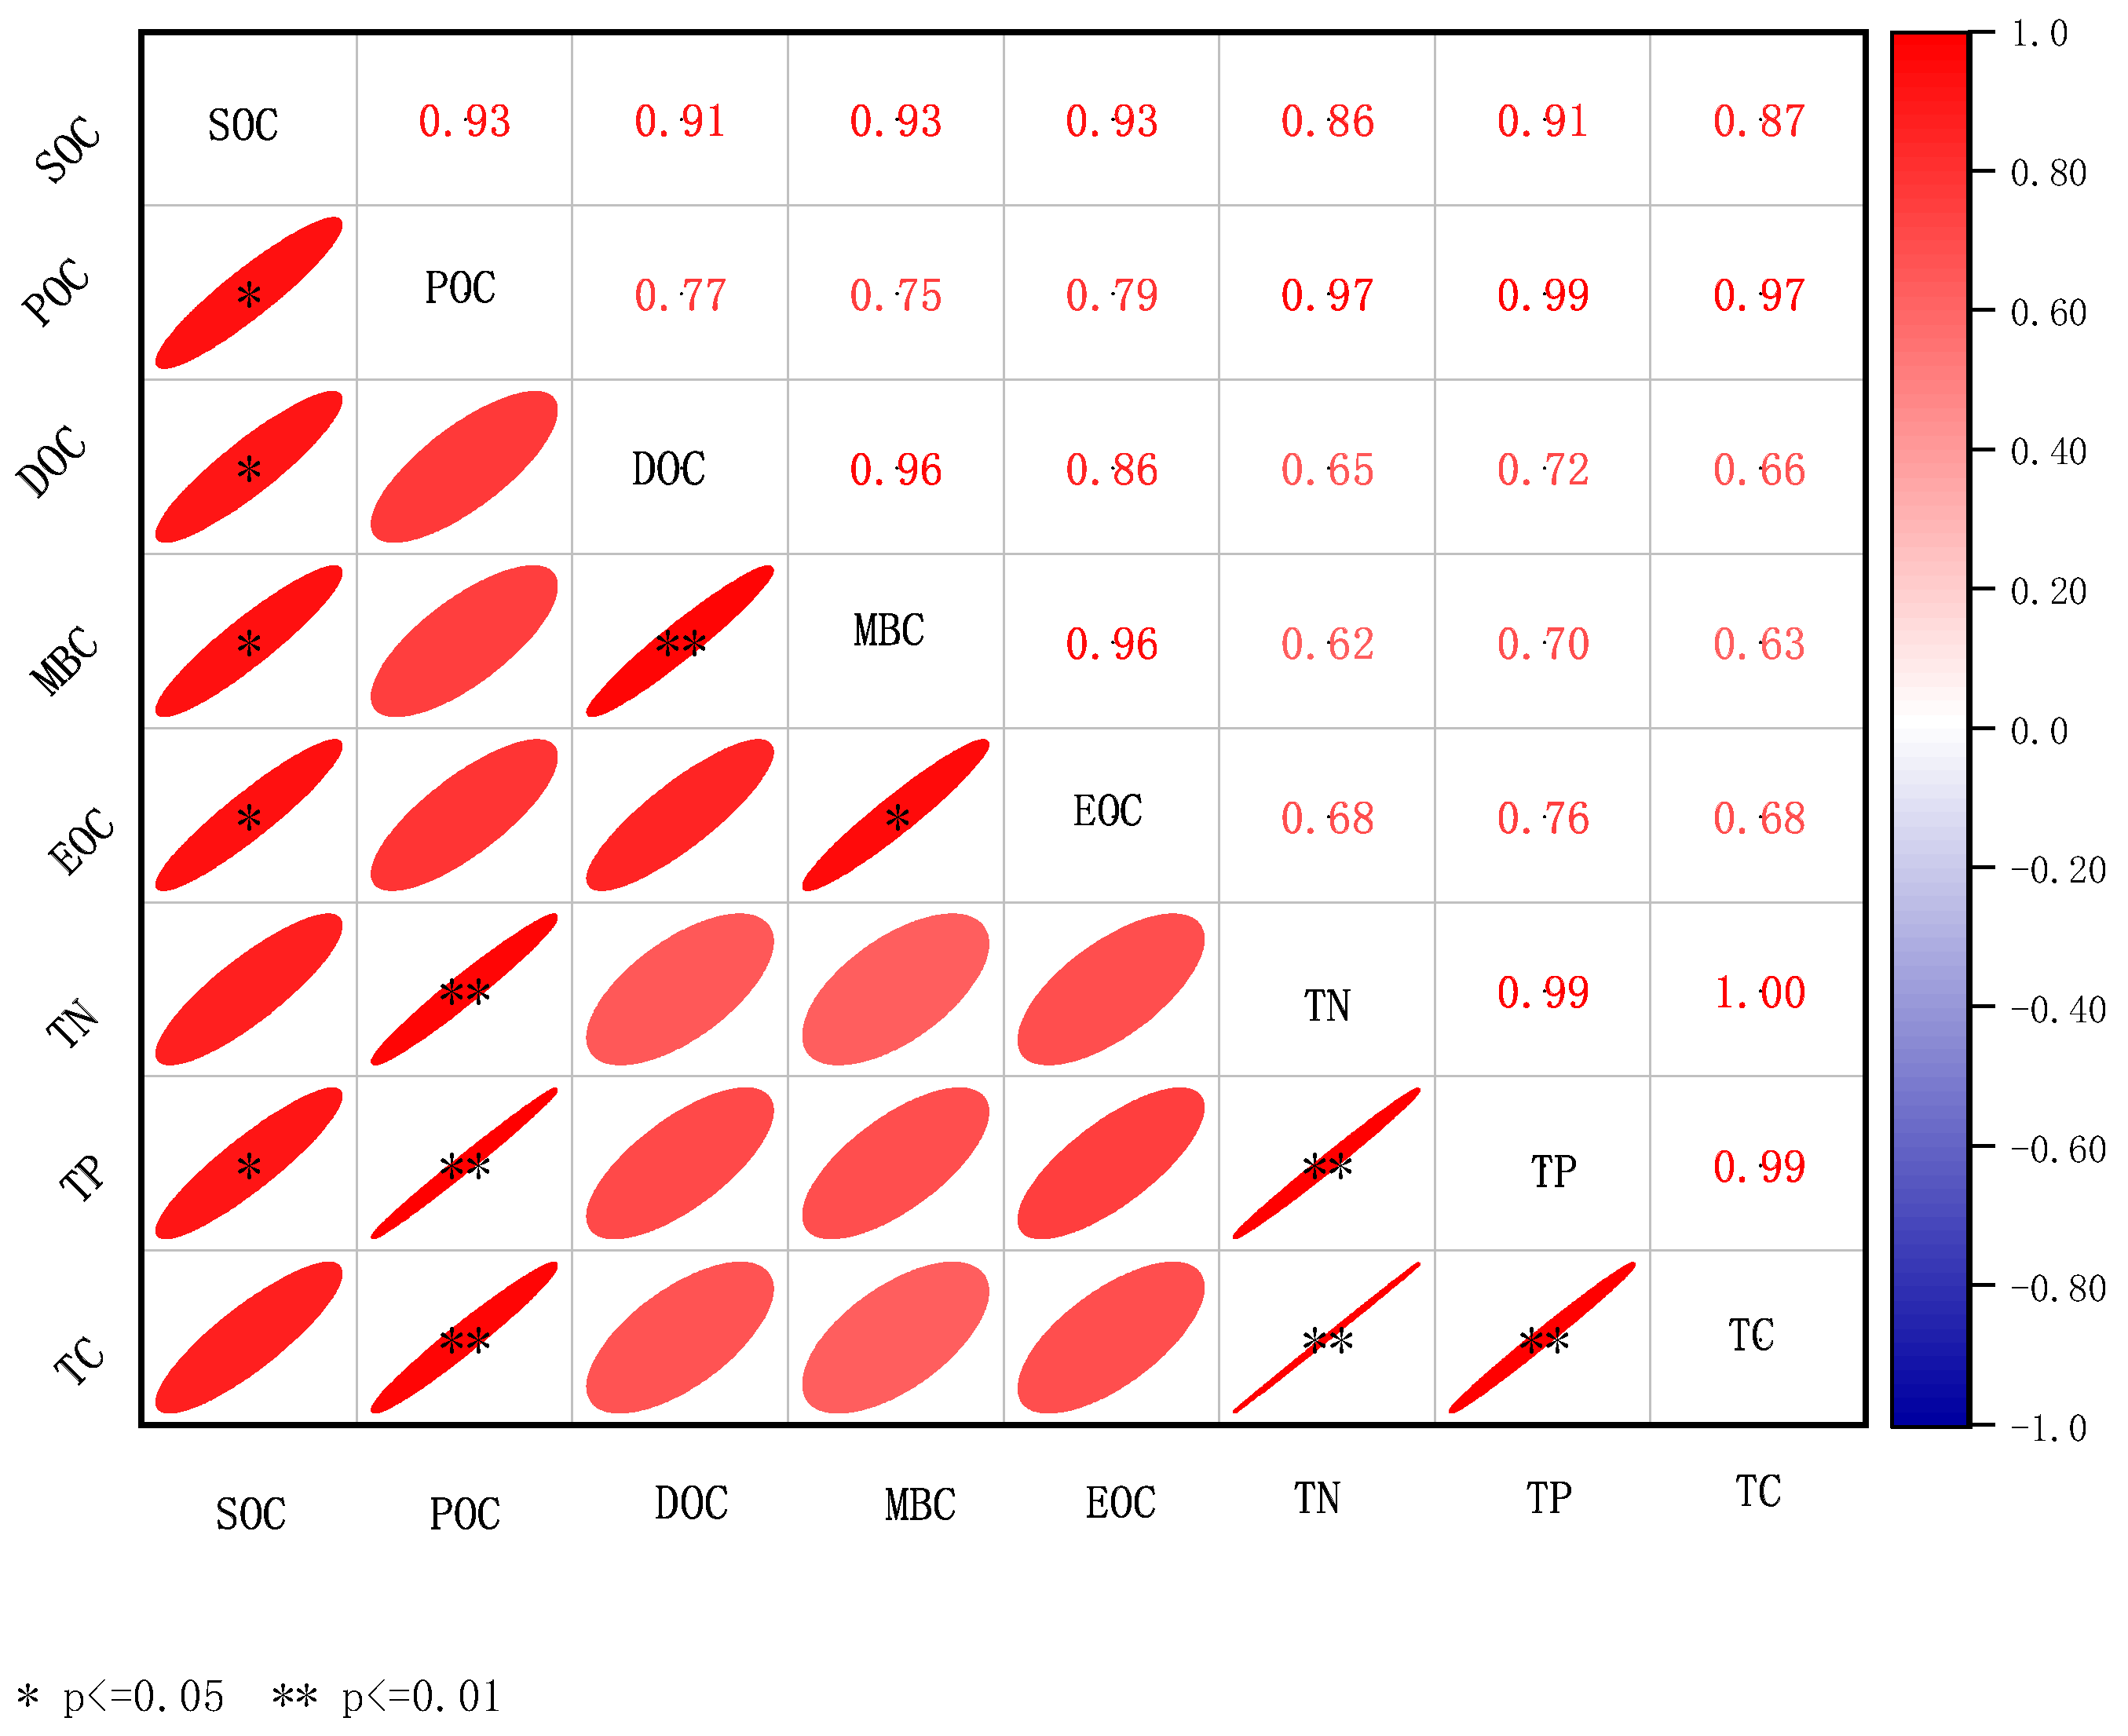
The correlation of each component is shown in Figure 8.The pattern of change between SOC and its components (POC, DOC, MBC, and EOC) was the same, showing a significant positive correlation, with correlation coefficients of 0.93, 0.91, 0.93, 0.93, and 0.93 (p ≤ 0.05), respectively; there was a significant positive correlation between SOC and TP, with correlation coefficients of 0.91 (p ≤ 0.05), which indicated that TP had a greater influence on SOC. POC was positively correlated with TN, TP, and TC, and the correlation coefficients were 0.97, 0.99, and 0.97, respectively (p ≤ 0.01), indicating that TC, TN, and TP were all influencing factors of POC. DOC showed a highly significant positive correlation with MBC, with a correlation coefficient of 0.96 (p ≤ 0.01). MBC showed a significant positive correlation with EOC, with a correlation coefficient of 0.96 (there was a highly significant positive correlation between TN and TC and TP, with correlation coefficients of 1.00 and 0.99 (p ≤ 0.01), respectively, and a highly significant positive correlation between TC and TP, with correlation coefficients of 0.99 (p ≤ 0.01), respectively).
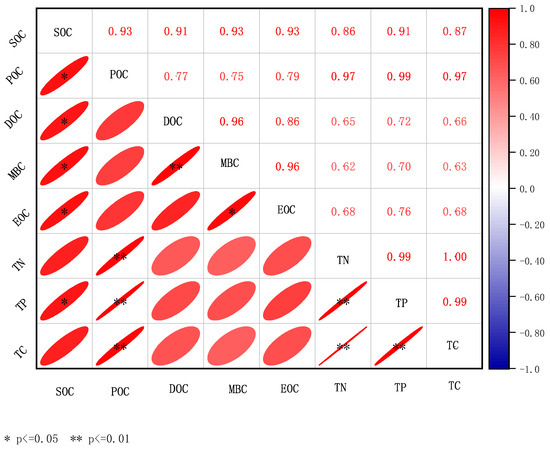
Figure 8.
Heat map of correlation between soil nutrients and organic carbon and its components.
4. Discussion
4.1. Effects of Different Artificial Vegetation Patterns on Surface Soil Organic Carbon Content
There is a significant correlation between vegetation restoration in sandy areas and the improvement of soil carbon sequestration capacity [32], and vegetation restoration plays an important role in determining the stock and distribution pattern of soil organic carbon [33]. The total organic carbon content of the four vegetation patterns showed that the arbor–irrigation–grass combination > single arbor > single shrub > single herb > CK. This is consistent with the results of Jiang Shengxiu [34], the organic carbon content showed a decreasing trend with the succession of vegetation from arbor–irrigation–grass combination to separate forest arbor, shrub, herb, and untreated area. However, the results obtained by Zhang Wenhe [35] in Kashgar City were contradictory, in which grassland had the highest organic carbon content, trees the next highest, and shrubs the worst in his results. Soil organic carbon content is influenced by the type of aboveground community, with the more complex the community type, the higher the soil organic carbon content. Trees usually have a higher potential for organic carbon accumulation, mainly due to a thicker layer of dead leaves and a more complex root system, which decomposes more slowly and is conducive to stabilizing humus formation, and also promotes the survival of soil microorganisms [36]. The root system of herbaceous plants is more shallow and less dense, and the apoptotic material is easy to be decomposed, so the replenishment of surface soil carbon is not timely and is less, followed by shrubs. This is consistent with the results obtained by Wang Defu and Zhang Zhiyong [37,38]. The soil carbon content of different vegetation restoration types was higher than that of mobile sandy land, and the fluctuation of carbon stock was larger among the types, which may be since the decomposition of plant litter in the soil surface layer greatly replenished the soil carbon pool, which had a significant effect on the surface soil carbon [39].
4.2. Effects of Different Artificial Vegetation Patterns on Surface Soil Organic Carbon Fractions
Artificially established vegetation significantly increased soil microbial organic carbon, soluble organic carbon, particulate organic carbon, and easily oxidized organic carbon content. Among the four vegetation types, herbaceous vegetation had the highest mean values of MBC/SOC and DOC/SOC in the surface soil, which coincided with the results of Xu Shiqi [40] and Zhang Xia [41]. The activity of soil organic carbon pools in herbaceous vegetation increased and accelerated the turnover rate of SOC compared with single-arbor and arbor–irrigation–grass vegetation. The bare soil of mobile sandy land resulted in the lack of physical protection of soil organic carbon fractions, which were vulnerable to microbial stress and loss. However, the presence of withered sediments and the formation of agglomerates in the management area physically protected the soil’s organic carbon components, effectively avoiding microbial contact and degradation. The reason for the high content of soil organic carbon fractions in the arbor–irrigation–grass model may be related to the diversity of plant species in the understory, the distribution of the root systems of different plant species, and the type and amount of apoplastic material. As the arbor–irrigation–grass vegetation pattern is more stable, it provides a suitable environment for the accumulation of soil organic carbon fractions and promotes their production and accumulation. Meanwhile, due to the different effects of vegetation types on different organic carbon fractions, there are some differences in the degree of response of different soil organic carbon fractions to vegetation patterns. The proportion of each soil organic carbon component to the total organic carbon was lower after the artificial establishment of vegetation, probably because the growth rate of soil organic carbon component content was lower than the growth rate of total organic carbon after the artificial establishment of vegetation, and the proportion of some soil organic carbon components to the total was smaller. The total organic carbon content was stable and in the accumulation stage.
4.3. Soil Organic Carbon Impact Factors of Different Artificial Vegetation
Wang Guobing et al. [42] showed that there were highly significant correlations between MBC and DOC, MC, DOC, and LOC. In this study, we found that the correlations between organic carbon and each component were high, and the pattern of change was the same. The correlations between POC and TC, TN, and TP were the most significant, with 0.97, 0.99, and 0.97, respectively, which indicated that they interacted closely with each other.
It has also been concluded in the same study that in various soil organic carbon correlates significantly with all carbon, all phosphorus, and all nitrogen; the correlation with all phosphorus is the highest, and the correlation with all nitrogen is the least. Other scholars have also come to a similar conclusion that the elements TN and TP are essential for plant growth and development [42], easily absorbed by plants, have a direct effect on plant growth and change the plant apoplastic [43]. So, organic carbon shows a high correlation with them. Cao Xiaoyu [44] and Zhang et al. [45] also reached similar conclusions in the research process. Some related studies pointed out that different vegetation species led to differences in soil physicochemical properties, which in turn affected the species and number of microbial communities and soil enzyme activities and affected the decomposition of organic matter and the release of carbon from soil respiration, thus leading to differences in soil organic carbon content and its fractions, which is in line with the conclusions of this paper. The POC also showed significant correlation with the TP, which indicated that the POC content was, to a large extent, restricted by SOC. The relationship between POC and TP is similar to that between SOC and other physicochemical properties.
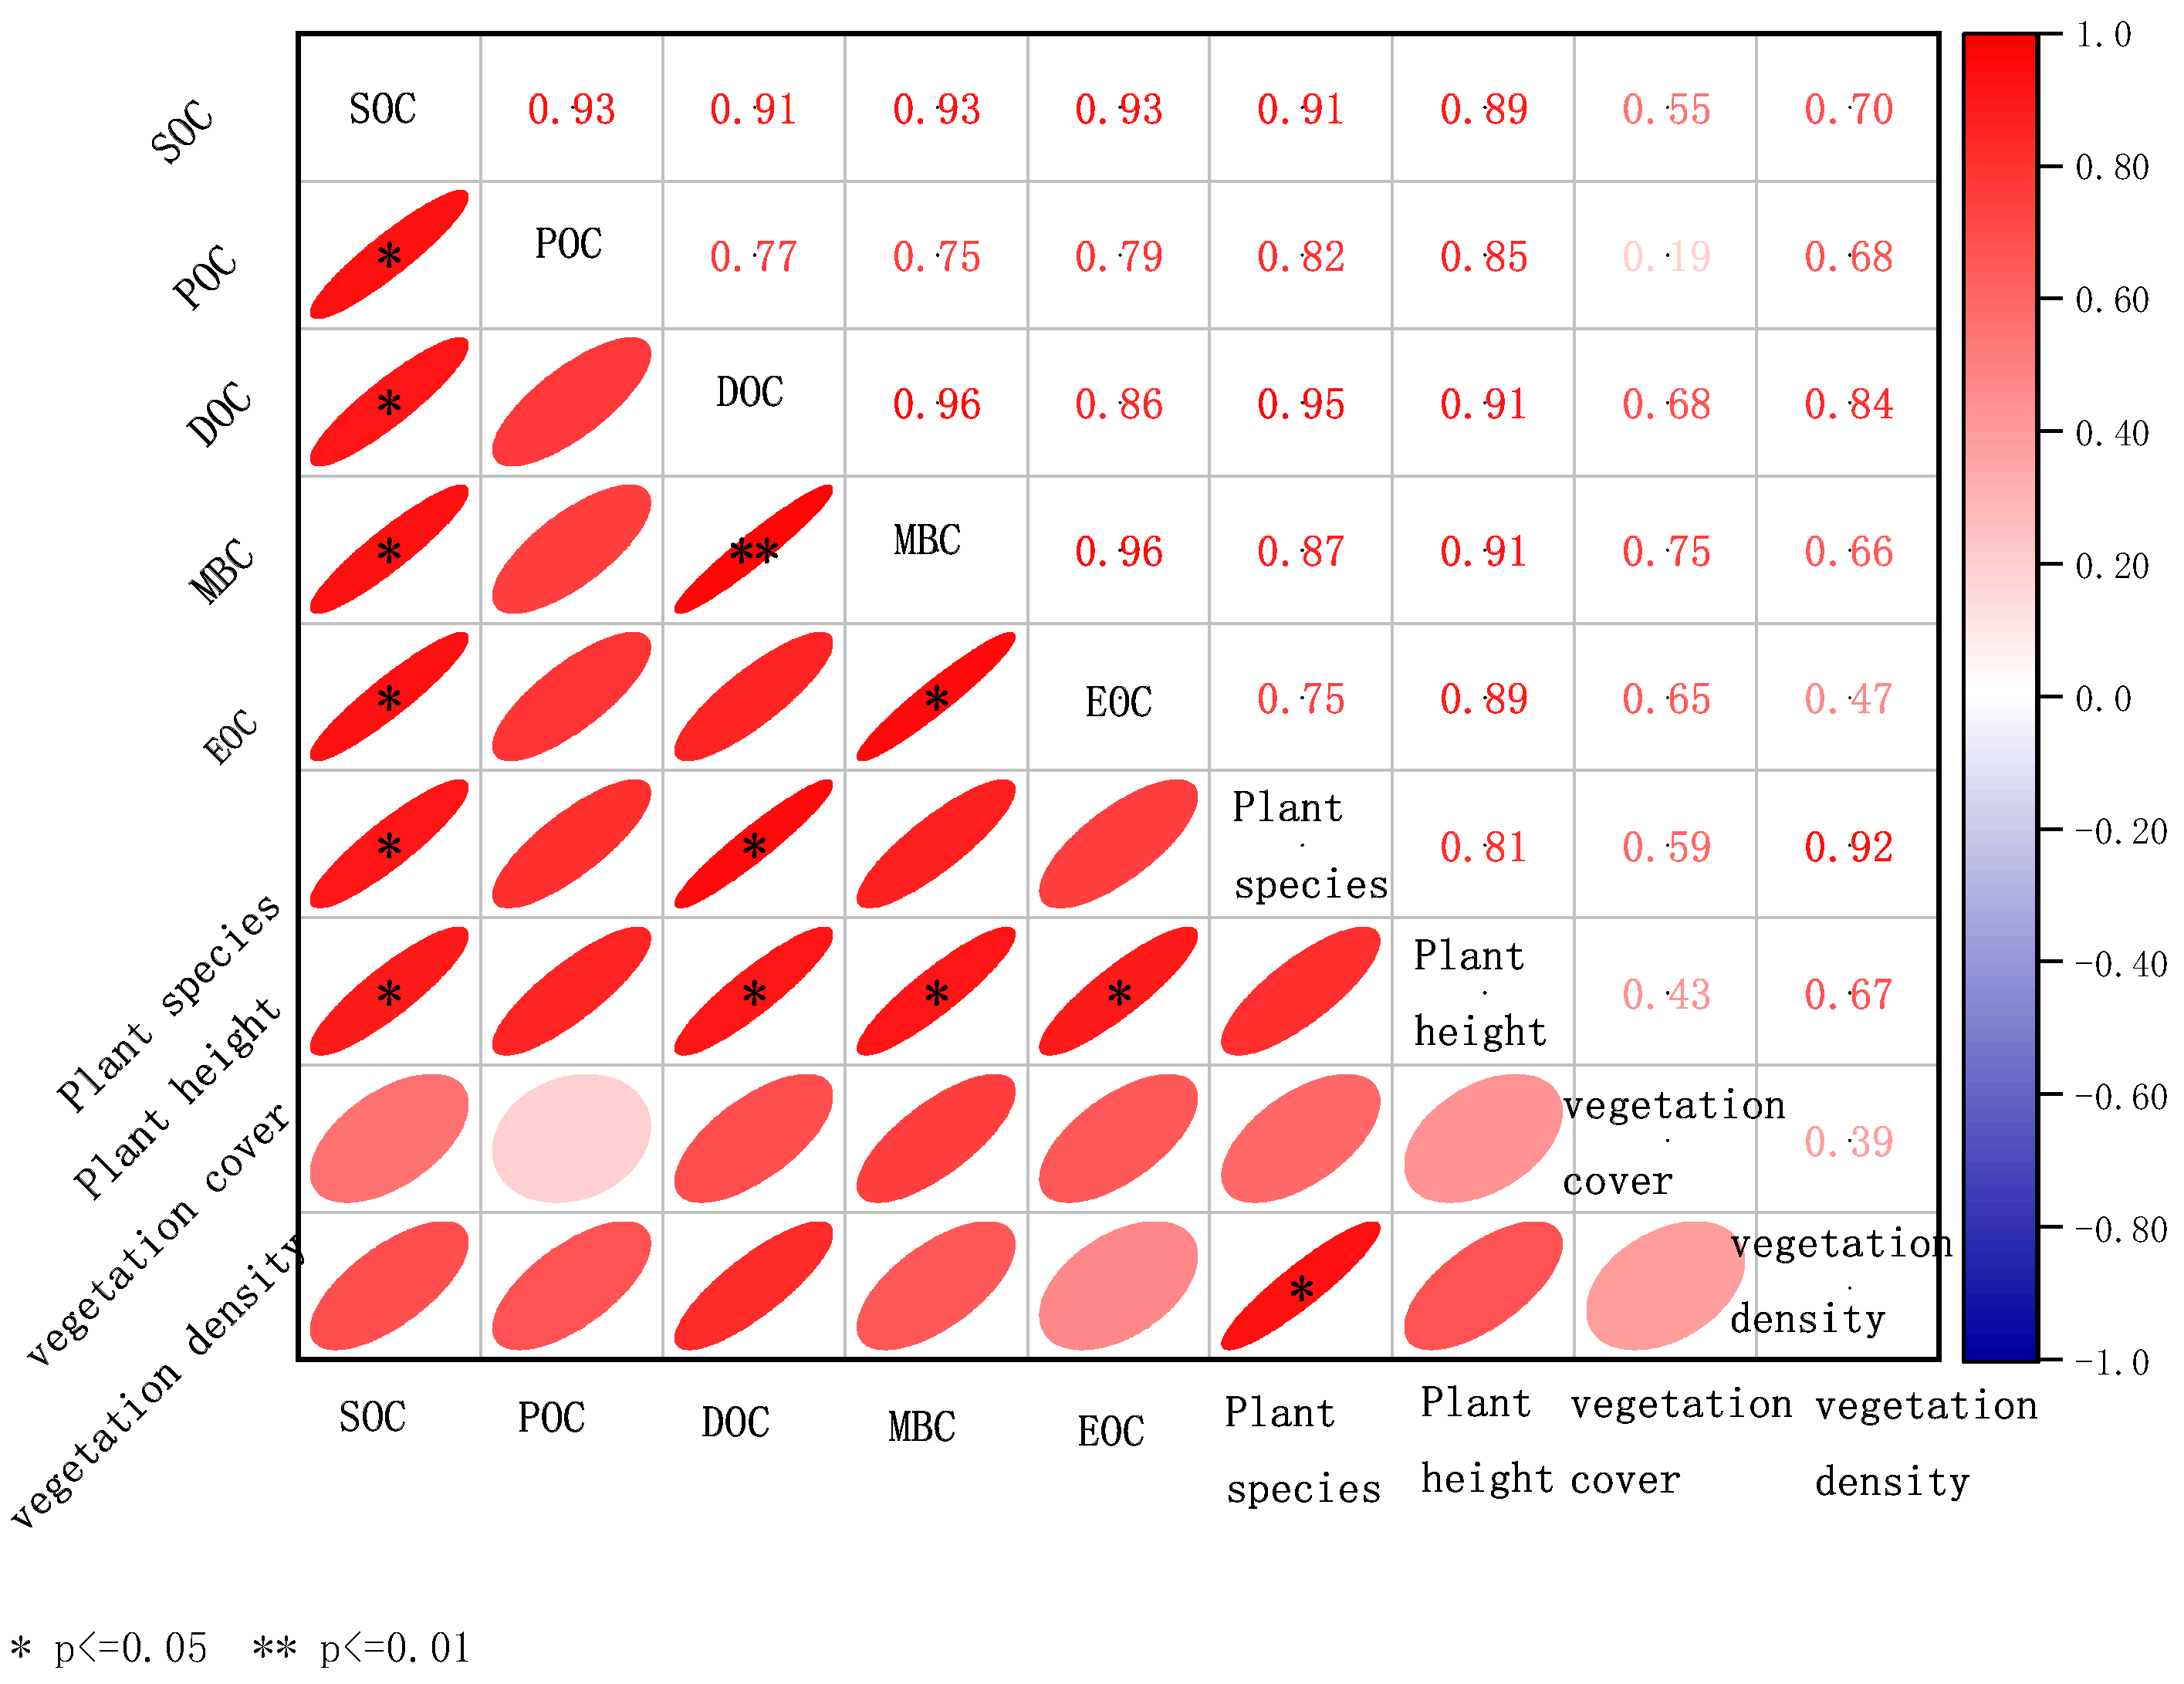
The correlation of each component is shown in Figure 9.The number of plant species was significantly correlated with organic carbon and soluble organic carbon (p ≤ 0.05), with correlation coefficients of 0.91 and 0.95, respectively; the correlation between the height of plants and organic carbon, soluble organic carbon, microbial organic carbon, and easily oxidized organic carbon was more significant (p ≤ 0.05), with correlation coefficients of 0.89, 0.91, 0.91, and 0.89, respectively; the correlation between the vegetation cover and the vegetation density and the organic carbon and its components was not significant. Organic carbon and its components were not closely related.
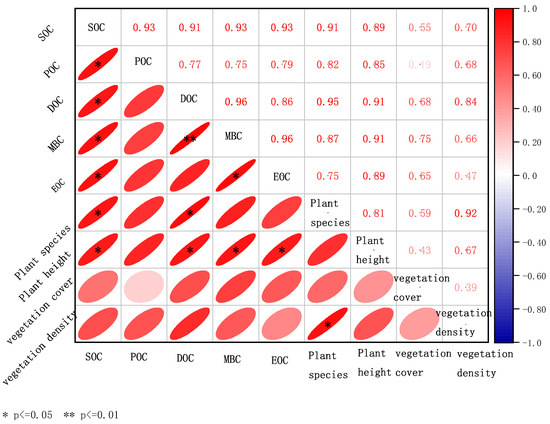
Figure 9.
Heat map of correlation between organic carbon and its fractions and plant growth indicators.
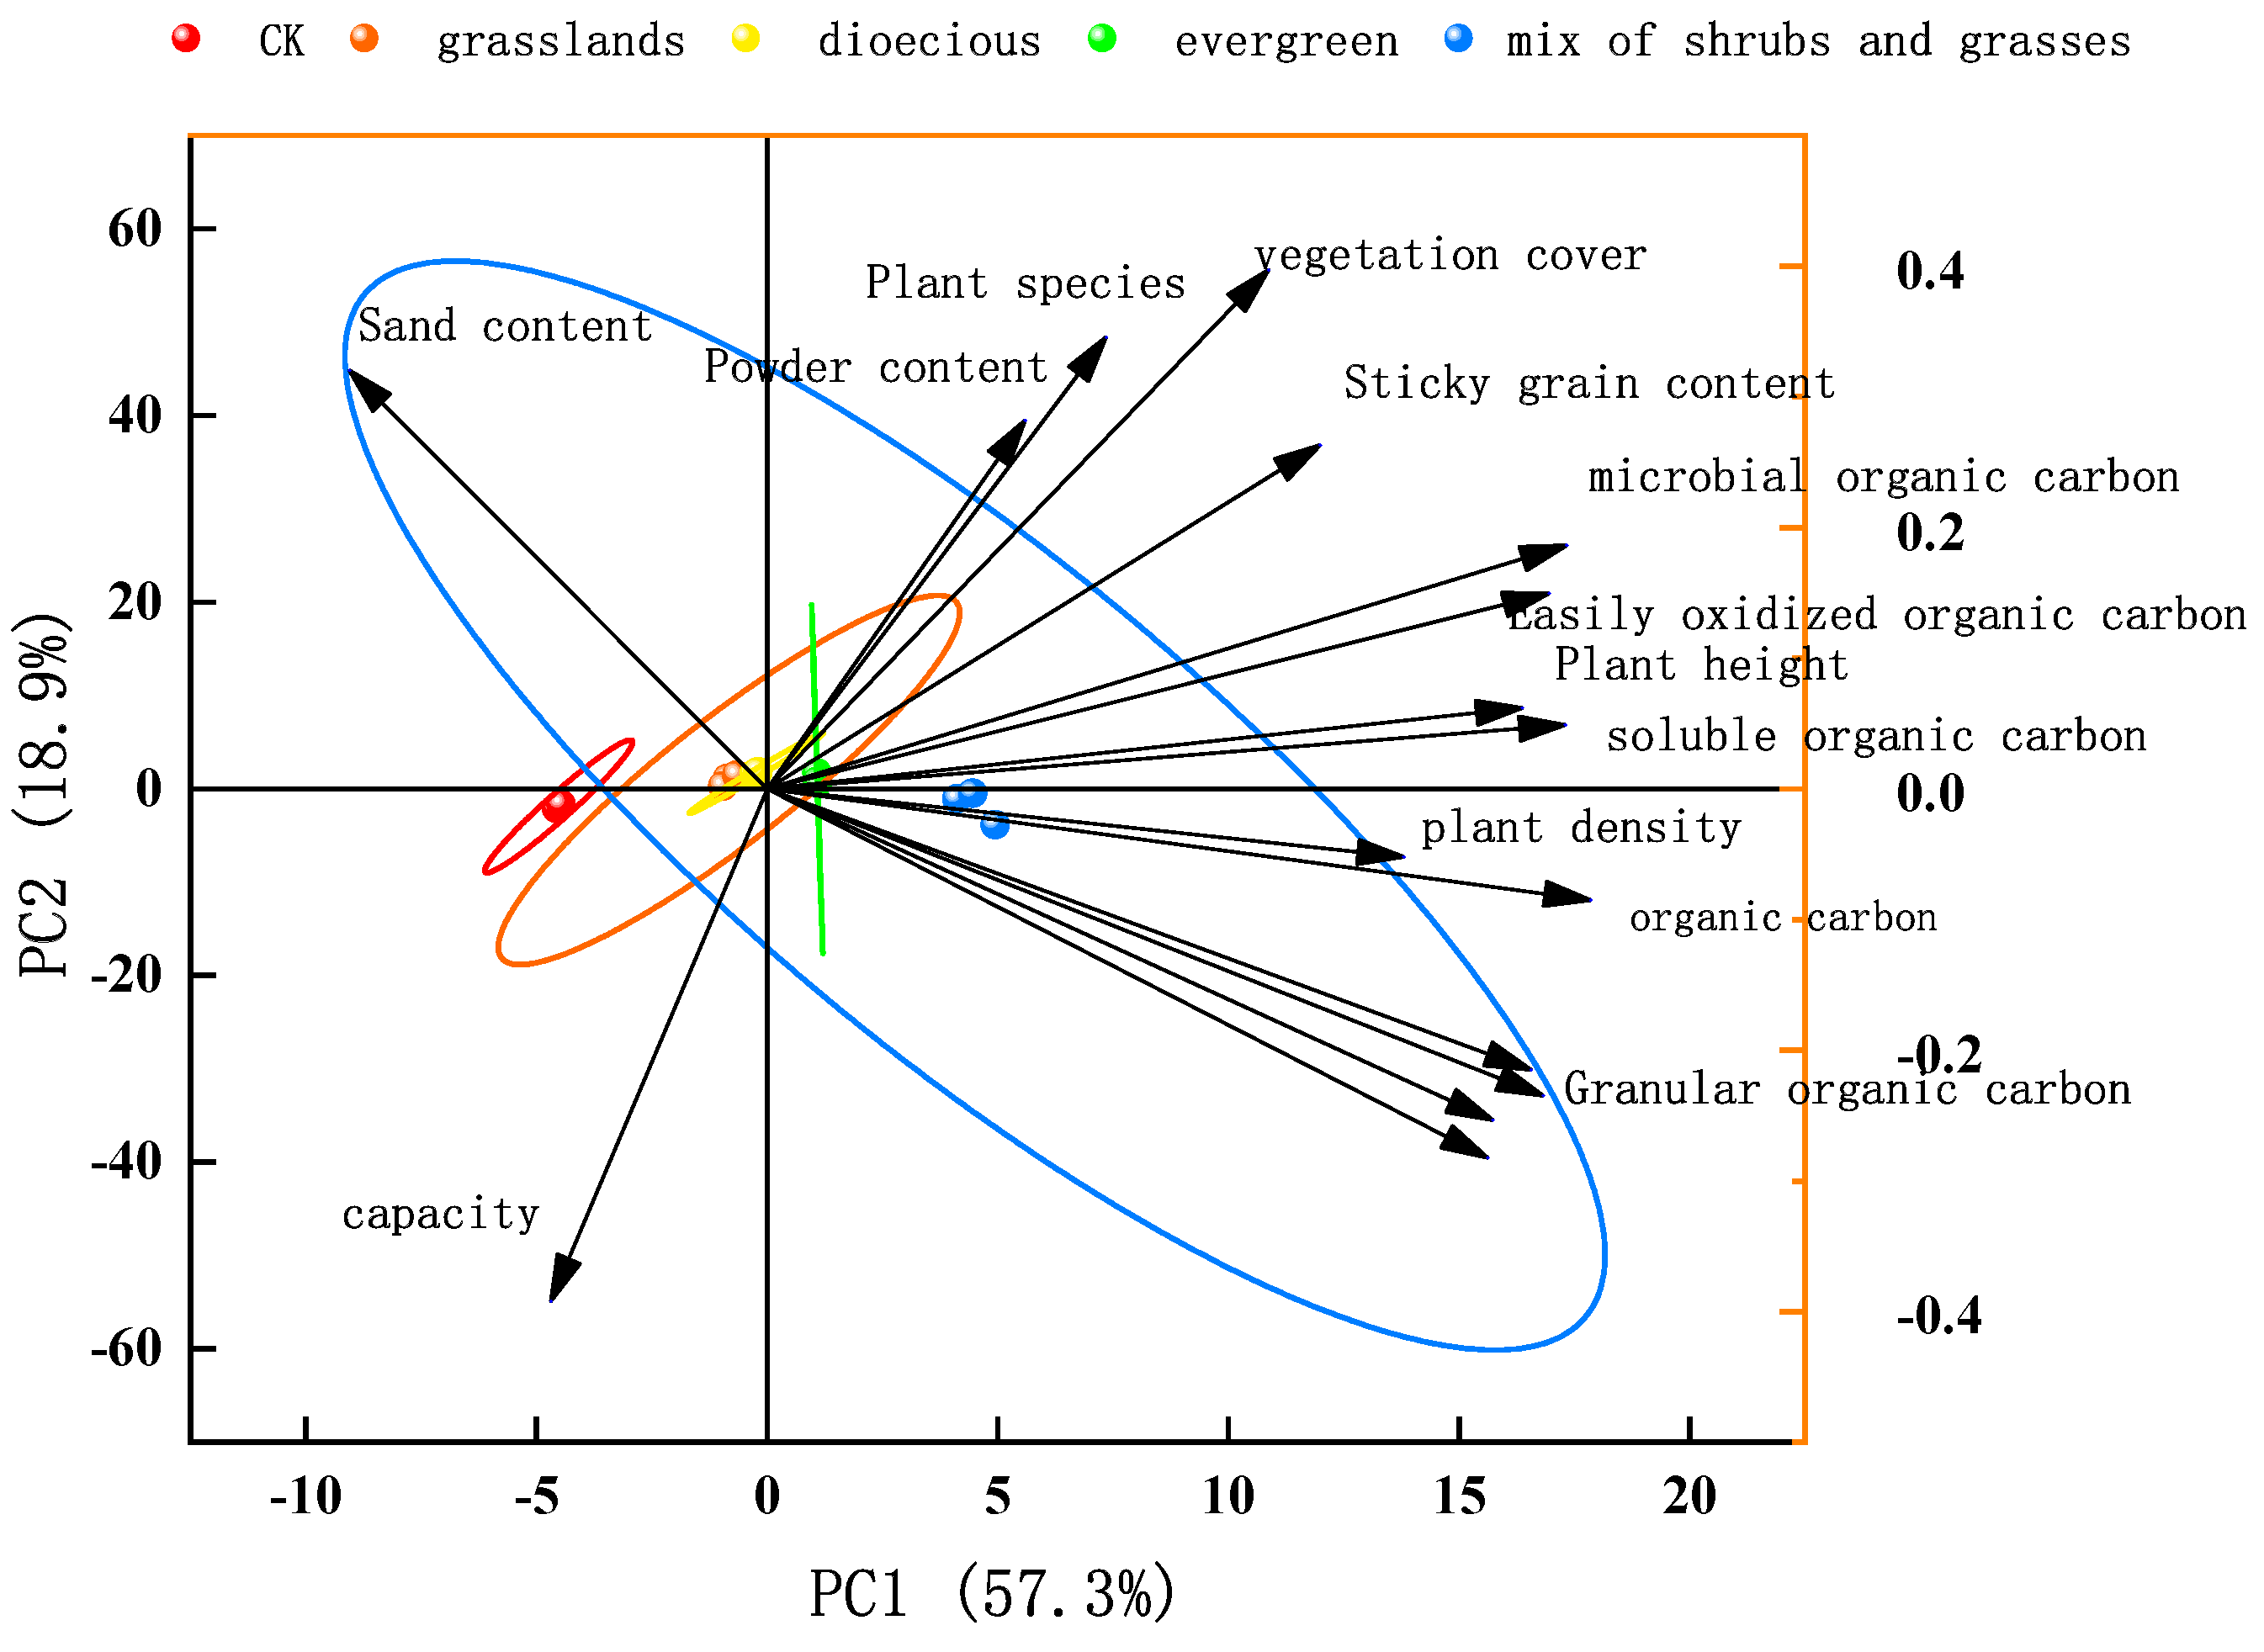
The relationships among the principal components are shown as follows Figure 10. The contribution rate of PC1’s was 57.3% and that of PC2’s principal component was 18.9%, and the cumulative contribution rate of the two principal components reached 76.2%, which indicated that this study was representative. The contents of organic carbon and its components were all at an acute angle with the vegetation growth indicators, and the positive correlation between them was high. The organic carbon components and their contents have a great influence on the vegetation growth indexes in the region, and controlling their contents is beneficial to the recovery and reconstruction of the local vegetation.
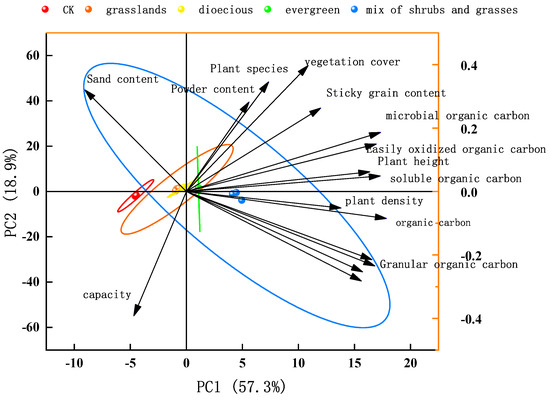
Figure 10.
Principal component analysis of organic carbon and its components with plant growth indicators.
In conclusion, the significant increase in soil organic carbon and its components in the Hulunbeier sandy area after artificial vegetation measures indicates that the implementation of vegetation measures in the degraded area is conducive to the restoration of organic carbon, which will enhance the ecosystem service function and weaken the impact of global warming to a certain extent. However, it should be noted that the relative sequestration capacity of soil-stabilized carbon and SOC did not increase in a short period, so the carbon pool is relatively unstable. Since the plant restoration period selected in this paper is relatively short (6 years), the stability and sequestration capacity of the soil carbon pool should be evaluated in terms of the selection of plant species and the long time scale after the artificial vegetation measures in this area. Attention should be paid to the matching of different plant species in the vegetation construction work, and the mechanism of different vegetation patterns affecting the deep soil organic carbon needs to be studied in depth.
5. Conclusions
This paper takes the Hulunbuir Sandy Land as the research area and four artificial vegetation modes as the research object to study the content characteristics of soil organic carbon and each component under different vegetation modes, which is of great significance in guiding the selection of vegetation restoration modes in this area. The main conclusions are as follows:
(1) The soil organic carbon contents of the four vegetation patterns were higher than that of CK, and the differences between the patterns were obvious, mainly as follows: arbor–irrigation–grass (22.96 g.kg−1) > single arbor (12.68 g.kg−1) > single shrub (11.17 g.kg−1) > single herb (8.89 g.kg−1) > CK (1.14 g.kg−1). The combined arbor–irrigation–grass pattern had the most significant effect on soil organic carbon production and accumulation, which increased by 1914.04% compared with CK. Organic carbon sequestration was consistent with the change in organic carbon content, and the soil organic carbon sequestration was the largest in the combined pattern of arbor–irrigation–grass. This indicates that the combination of arbor–irrigation–grass mode is more favorable to the accumulation of organic carbon, which is conducive to the improvement of soil quality and carbon sequestration capacity;
(2) Artificially established vegetation significantly increased the contents of soil microbial organic carbon, soluble organic carbon, particulate organic carbon, and easily oxidized organic carbon, and the contents of each component of arbor–irrigation–grass were the highest at 57.6 mg.kg−1, 203.11 mg.kg−1, 28.6 mg.kg−1, and 12.5 mg.kg−1, respectively, but they accounted for a relatively low proportion of the total organic carbon;
(3) The pattern of change between SOC and its components was the same, showing a significant positive correlation, with correlation coefficients of 0.93, 0.91, 0.93, and 0.93, respectively. TC, TN, and TP were the influencing factors of POC. There was a significant correlation and coefficients of 0.96 and 0.96, respectively, between DOC and MBC and between MBC and EOC.
In this paper, the organic carbon and component contents of surface soil under four artificial vegetation modes in the Hulunbuir Sandy Land were investigated to a certain extent, which is of great significance to optimize the vegetation restoration measures and protect the ecology of the Hulunbuir Sandy Land. It was found that the combination of the arbor–irrigation–grass model can effectively sequester carbon, and the vegetation grows well, which can promote the accumulation of surface soil organic carbon. To realize China’s dual-carbon goal and win the battle of sand control and prevention, plant species can be reasonably matched in the protection and restoration of the Hulunbuir Sandy Land, and the arbor–irrigation–grass restoration mode can be adopted.
Author Contributions
Conceptualization, L.Y. (Limin Yuan) and Z.M.; methodology, X.D.; software, Y.L. (Yue Liu); validation, Y.Z.; formal analysis, Y.Z.; investigation, Y.L. (Yue Liu); resources, L.Y. (Limin Yuan) and X.D.; data curation, Y.L. (Yue Liu); writing—original draft preparation, Y.L. (Yue Liu); writing—review and editing, L.Y. (Limin Yuan) and X.D. and Z.M.; visualization, Y.L. (Yue Liu); supervision, Z.M.; project administration, L.Y. (Limin Yuan); funding acquisition, X.D. and L.Y. (Limin Yuan). All authors have read and agreed to the published version of the manuscript.
Funding
Science and Technology Program of Inner Mongolia Autonomous Region (2022YFDZ0055).
Data Availability Statement
The data presented in this study are available on request from the author. The data are not publicly available due to privacy restrictions.
Acknowledgments
The authors gratefully acknowledge the valuable assistance provided by Bao ZhiXin, Zhang Ezhen, and Zhu Lei.
Conflicts of Interest
The authors declare no conflicts of interest.
References
- Lu, Q.; Lei, J.Q.; Li, X.S.; Yang, Y.L.; Wang, F. China’s Combating Desertification: National Solutions and Global. Paradigm. Bull. Chin. Acad. Sci. J. 2020, 35, 656–664. [Google Scholar]
- Tang, L.C.X.; Yang, J.; Zhu, Q.L. Study on Environmental Problems and Countermeasures of Land Desertification in China. Heilongjiang Environ. J. 2022, 35, 97–99. [Google Scholar]
- Wang, S.H.; Wang, Y.W.; Wang, Y.S.; Wang, Y.J.; Chen, A.H.; Wang, S.F. An analysis of the causes, hazards and management countermeasures of land desertification. China Society for Sand Control and Sand Industry. In Proceedings of the 2018 Annual Academic Conference of China Society for Sand Control and Sand Industry, Qinghai, China, 10 August 2018. [Google Scholar]
- Deng, L.; Liu, Y.L.; Li, J.W.; Shangguan, Z.P. Effect of Vegetation Restoration on Soil Carbon Sequestration: Dynamics and Its Driving Mechanisms. J. Soil Water Conserv. J. 2023, 37, 1–10. [Google Scholar]
- Hu, Q.Y.; Liu, T.Q.; Ding, H.N.; Li, C.; Yu, M.; Liu, J.; Cao, C. The effects of straw returning and nitrogen fertilizer application on soil labile organic carbon fractions and carbon pool management index in a rice-wheat rotation system. Pedobiol. Sci. 2023, 101, 150913. [Google Scholar] [CrossRef]
- Guo, W.F.; Chen, Y.M.; Gao, F.; Wang, J.L. Traits of seven medicinal plants in Taihang Mountains and their responses to soil factors. J. Environ. Eng. J. 2024, 14, 612–621. [Google Scholar]
- Sun, T.; Feng, X.M.; Gao, X.H.; Deng, A.X.; Zhang, C.Y.; Song, Z.W.; Zhang, W.J. Effects of Diversified Cropping on the Soil Aggregate Composition and Organic Carbon and Total Nitrogen Content. Sci. Agric. Sin. J. 2023, 56, 2929–2940. [Google Scholar]
- Zhang, X.F.; Zheng, S.M.; Xia, Y.H.; Hu, Y.J.; Su, Y.R.; Chen, X.B. Responses of Soil Organic Carbon Fractions to Land Use Types in Hilly Red Soil Regions, China. Environ. Sci. J. 2020, 41, 1466–1473. [Google Scholar]
- Zhang, S.L.; Sheng, M.Y.; Wang, L.J.; He, X.X.; Luo, N.N. Effects of long-term vegetation restorations on soil organic carbon fractions in the karst rocky desertification ecosystem, Southwest China. Acta Ecol. Sin. J. 2023, 43, 8476. [Google Scholar]
- Yang, M.; Zhang, L.M.; Wu, Y.N.; Yuan, D.M.; Yu, L.F. Changes of Carbon Content in Litter During Plant Community Restoration in Maolan National Nature Reserve. J. Mt. Agric. Biol. J. 2022, 41, 28. [Google Scholar]
- Zhao, F.Z. Regulation Mechanism of Carbon Sequestration by C: N:P Stoichiometry in Soil Under Conversion of Cropland to Forest in Loess Hilly Region; Northwest Agriculture and Forestry University: Yangling, China, 2015; Volume 78. [Google Scholar]
- Sun, Z.C.; Qin, W.L.; Wang, X.; Zhang, Y.; Li, G.; Wang, Z. Effects of manure on topsoil and subsoil organic carbon depend on irrigation regimes in a 9-year wheat-maize rotation. Soil Tillage Res. 2021, 205, 104790. [Google Scholar] [CrossRef]
- Wu, H.Q.; Du, S.Y.; Zhang, Y.L.; An, J.; Zou, H.; Yu, N. Effects of irrigation and nitrogen fertilization on greenhouse soil organic nitrogen fractions and soil-soluble nitrogen pools. Agric. Water Manag. 2019, 216, 415–424. [Google Scholar] [CrossRef]
- Hao, H.B.; Xu, W.X.; Hou, Z.A. Effects of coupled water and nitrogen on soil organic carbon fractions and enzymes in a drip-irrigated cotton field. J. Plant Nutr. Fertil. 2023, 29, 860–875. [Google Scholar]
- Yang, H.; Peng, X.Y.; Yang, S.Q.; Zhang, Y.B.; Zhao, C.; Huang, Y. Effects of land use types on soil organic carbon and soil labile organic carbon in karst-faulted basin of southern Yunnan. Acta Ecol. Sin. 2022, 42, 7105–7117. [Google Scholar]
- Yang, L.X.; Pan, J.J. Progress in the Study of Measurements of Soil Active Organic Carbon Pool. Chin. J. Soil Sci. 2004, 35, 502–506. [Google Scholar]
- Xu, G.P.; Li, Y.Q.; Shen, Y.Y.; Zhang, D.N.; Sun, Y.J.; Zhang, Z.F.; Zhou, L.W.; Duan, C.Y. Soil Organic Carbon Distribution and Components in Different Plant Communities Along a Water Table Gradient in the Huixian Karst Wetland in Guilin. Environ. Sci. 2019, 40, 1491–1503. [Google Scholar]
- Lao, H.B.; Liu, F.; Liu, Y.S.; He, T.B.; Su, Y.G. Variation of Forest Soil Organic Carbon in Karst Rocky Desertification Area. Sci. Silvae Sin. 2009, 45, 24–28. [Google Scholar]
- Chen, W.; Yang, J.J.; Yuan, Y.; Zhang, H.; Han, P.F. Effects of artificial sand-fixing vegetation on soil nutrients in Mu Us Sandy Land. Arid Zone Res. 2020, 37, 1447–1456. [Google Scholar]
- Jiang, L.J.; Ma, J.; Liu, J.K.; Wang, S.; Zhao, J.; Bai, J. Spatial Distribution of Soil Physicochemical Properties Under Different Vegetation Restoration Measures in Mu Us Sand Land. Bull. Soil Water Conserv. 2022, 42, 1–7. [Google Scholar]
- Dong, L.; Li, J.; Liu, Y. Forcstation delivers significantly more olfactive results in soil C and Nscqucstrations than natural succession on badly degraded arcas: Evidence from thc CentralLoess Plateau case. Catena 2022, 208, 105734. [Google Scholar] [CrossRef]
- Wang, Z.Q.; Du, L.L.; Zhao, M.; Guo, S.L. Differences in soil organic carbon and total nitrogen and their impact factors under different restoration patterns in the Loess Plateau. Chin. J. Appl. Ecol. 2016, 27, 716–722. [Google Scholar]
- Xi, P.; Dong, Q.; Zhang, Y.N.; Li, X.; Xia, W.W.; Xu, C.; Liu, M.S. Distribution characteristics of active components in soil organic carbon across typical plant communities in Yancheng coastal wetlands. Chin. J. Appl. Ecol. 2020, 39, 3623–3632. [Google Scholar]
- Cambardella, C.A.; Eliot, E.T. Particulate soil organic matter changes across a grassland cultivation sequence. Soil Sci. Soc. Am. J. 1992, 56, 777–783. [Google Scholar] [CrossRef]
- Li, L.J.; Han, X.Z. Changes of soil properties and carbon fractions after long-term application of organic amendments in Mollisols. Catena 2016, 143, 140–144. [Google Scholar] [CrossRef]
- Xie, F.; Han, X.R.; Yang, J.F.; Zhan, X.M.; Tang, L. The Effect on the Contents of SMBC and WSOC under Long-term Fertilization on Brown Soil. Agric. Sci. Technol. Equip. 2008, 10–13. [Google Scholar]
- Lefroy, R.D.B.; Blair, G.J.; Strong, W.M. Changes in soil organic matter with cropping as measured by organic carbon fractions and 13C natural isotope abundance. Plant Soil 1993, 155–156, 399–402. [Google Scholar] [CrossRef]
- Bao, S. Soil Agrochemical Analysis, 3rd ed.; China Agricultural Press: Beijing, China, 2000. [Google Scholar]
- Ding, Y.G.; Yang, J.; Song, B.Y.; Hugejiletu, Z.L. Effect of different vegetation types on soil organic carbon in Mu Us desert. Acta Prataculturae Sin. 2012, 21, 18–25. [Google Scholar]
- Wang, D.; Geng, Z.C.; She, D.; He, W.X.; Hou, L. Soil organic carbon storage and vertical distribution of carbon and nitrogen across different forest types in the Qinling Mountains. Acta Ecol. Sin. 2015, 35, 5421–5429. [Google Scholar]
- Feng, Q.; Yang, L.; Wang, J.; Shi, X.Y.; Wang, Y.F. Response of soil moisture and soil organic carbon to vegetation restoration in deep soil profiles in Loess Hilly Region. Acta Ecol. Sin. 2019, 39, 6598–6609. [Google Scholar]
- Li, B.B.; Li, P.P.; Yang, X.; Xiao, H.; Xu, M.; Liu, G. Land-use conversion changes deep soil organic carbon stock in the Chinese Loess Plateau. Land Degrad. Dev. 2020, 32, 505–517. [Google Scholar] [CrossRef]
- Li, F.; Li, J.; Long, J.; Liao, H.K.; Liu, L.F.; Zhang, W.J. Effect of vegetation types on soil organic carbon and nitrogen in typical karst mountainous area. Chin. J. Appl. Ecol. 2015, 34, 3374–3381. [Google Scholar]
- Jiang, S.X.; Zhao, P.; Zhang, J.N.; Li, D.L.; Liu, Z.X. Characteristics and Influencing Factors of Soil Organic Carbon in Typical Vegetation in the Qilian Mountains. For. Grassl. Resour. Res. 2024, 1–7. [Google Scholar] [CrossRef]
- Zhang, W.H.; Zha, X.H.; Yi, H.Y. Changes of Soil Organic Carbon Content under Different Vegetation Types. Hubei Agric. 2015, 54, 2594–2598. [Google Scholar]
- Liang, X.Y.; Xin, B.Z.; Liu, S.B.; Shen, H.Y. The Coupling Interaction of Soil Organic Carbon and Soil Water of Vegetation Restoration in Bashang Area of Hebei. J. Soil Water Conserv. 2022, 36, 206–212. [Google Scholar]
- Wang, D.F.; Dong, L.B.; Li, A.; Yu, Z.J.; Deng, L. Soil Organic Carbon and Moisture Effects of Different Vegetation Restoration Types in the Mu Us Sandy Land. J. Soil Water Conserv. 2024, 38, 101–110+120. [Google Scholar]
- Zhang, Z.Y.; Wang, Y.; Ai, N.; Liu, G.Q.; Liu, C.H. Distribution characteristics of soil organic carbon and its influencing factors in different vegetation types in the loess region of northern Shaanxi Province, northwestern China. J. Beijing For. Univ. 2020, 42, 56–63. [Google Scholar]
- Yu, R.; Wang, Q.C.; Zhu, P.; Liu, Q.; Wang, H.; Sun, C.Y. Effect of Long-term Fertilization on Aggregate and Fractions of Organic Carbon in Black Soil. Chin. J. Soil Sci. 2013, 44, 594–600. [Google Scholar]
- Xu, S. Characteristics of Soil Organic Carbon Pool Composition and Sources under Different Vegetation Types in Hongliulin Coal Mine; Northwest Agriculture and Forestry University: Yangling, China, 2024. [Google Scholar]
- Zhang, X. Effects of Different Farmland Management Practices on Soil Organic Carbon Pools and Stabilization Mechanisms in the Weibei Dry Loess Plateau; Northwest Agriculture and Forestry University: Yangling, China, 2022. [Google Scholar]
- Wang, G.B.; Zhao, X.L.; Wang, M.H.; Ruan, H.H.; Xu, C.B.; Xu, Y.M. Effects of land use change on soil readily oxidizable carbon in a coastal area of northern Jiangsu Province, East China. Chin. J. Appl. Ecol. 2013, 24, 921–926. [Google Scholar]
- Hu, Y.S.; Yao, X.Y.; Liu, Y.H. N and P stoichiometric traits of plant and soil in different forest succession stages in Changbai Mountains. Chin. J. Appl. Ecol. 2014, 25, 632–638. [Google Scholar]
- Cao, X.Y.; Li, J.P.; Zhang, C.C.; Fang, X.N.; Xie, X.Y. Variation of Contents of Organic Carbon and Physic-chemical Properties of Soil and Path Analysis for Their Relations in Different Age-group Chinese Fir Plantations. J. Soil Water Conserv. 2014, 28, 200–205. [Google Scholar]
- Zhang, Z.T.; Wang, J.M.; Li, B. Determining the influence factors of soil organic carbon stock in opencast coal-mine dumps based on complex network theory. Catena 2019, 173, 433–444. [Google Scholar] [CrossRef]


Disclaimer/Publisher’s Note: The statements, opinions and data contained in all publications are solely those of the individual author(s) and contributor(s) and not of MDPI and/or the editor(s). MDPI and/or the editor(s) disclaim responsibility for any injury to people or property resulting from any ideas, methods, instructions or products referred to in the content. |
© 2025 by the authors. Licensee MDPI, Basel, Switzerland. This article is an open access article distributed under the terms and conditions of the Creative Commons Attribution (CC BY) license (https://creativecommons.org/licenses/by/4.0/).