3.2. Models for Biomass Estimation
Through the analysis of data, height (
vis-à-vis length), plus d
0.1m were disregarded as a predictor variable since its inclusion provided little improvement of the model, furthermore, the accurate measurement of tree height in the field is difficult for the practitioner. Furthermore, this study concentrated on only one clonal variety on one site. Values for the dbh of sampled trees ranged between 18.0 and 89.0 mm. ANOVA conducted within the linear regression has shown that dbh can be considered a highly significant predictor (see
Table 3) of above ground dry tree weight [
9,
11,
12,
45], as well as for all tree fractions: stem [
10,
44,
45,
50], branches [
9,
10,
50], bark [
21,
34,
35] leaves [
9,
26,
44,
50,
51], and buds [
33]. The utilization of the measurement of dbh is additionally a practical, convenient and widely practiced methodology, thus allowing the comparison of results between studies.
Residual analysis of log transformed data showed that the residuals were normally distributed and uncorrelated, indicating that the assumption of linearity and homoscedasticity were met. This implies that the sample trees were indeed selected independently of each other. Furthermore results of the Durbin-Watson test suggested that residual values were indeed independent and thus there was no autocorrelation within the dataset.
Table 3.
Estimated allometric parameters (applicable for Equation 3) and statistical output data for total above ground leafless biomass and individual tree compartments against dbh (df = 1,28).
Table 3.
Estimated allometric parameters (applicable for Equation 3) and statistical output data for total above ground leafless biomass and individual tree compartments against dbh (df = 1,28).
| Compartment | Model | a2 | b | R2adj | Se | p |
|---|
| Above ground leafless biomass | 1 | −0.238 | 2.207 | 0.992 | 0.09 | <0.001 |
| Stem | 2 | −0.056 | 2.095 | 0.990 | 0.09 | <0.001 |
| Branch | 3 | −4.261 | 2.804 | 0.980 | 0.18 | <0.001 |
| Bud | 4 | −3.903 | 2.156 | 0.985 | 0.12 | <0.001 |
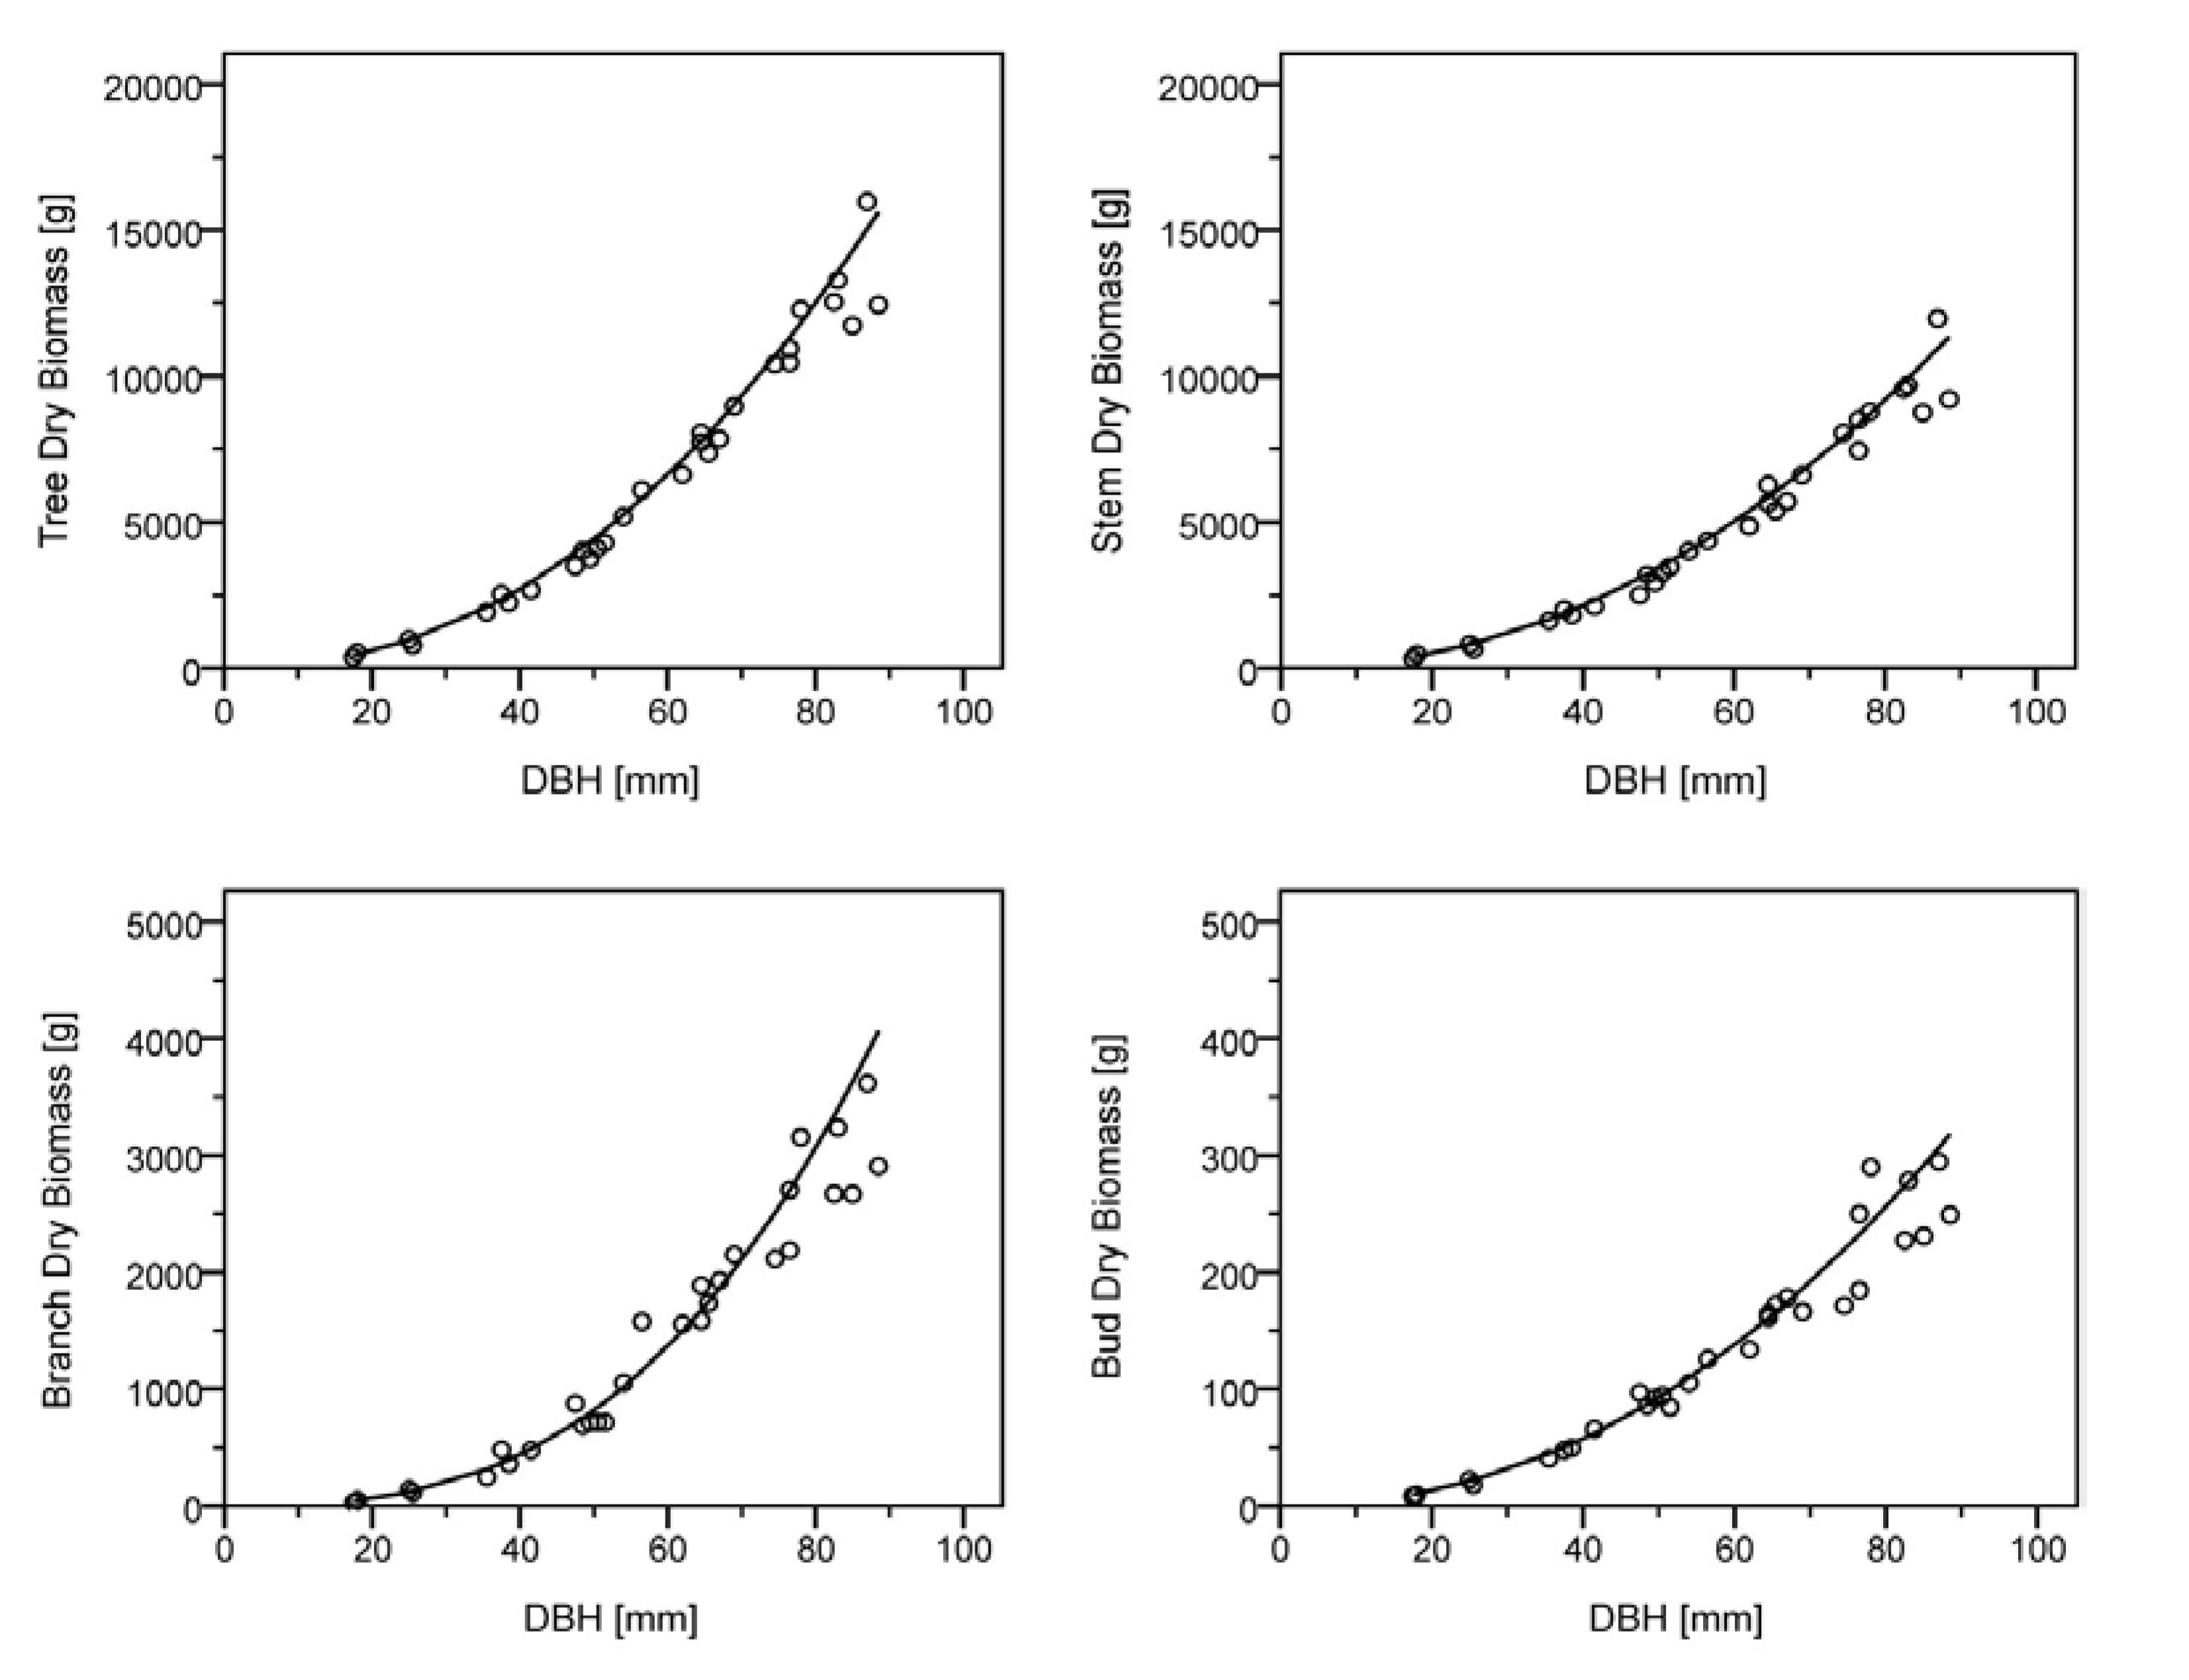
Figure 2.
Biomass model for leafless above ground biomass (top left) and constituent tree parts, stem (top right), branch (bottom left), and bud (bottom right). Parameters of the model applicable to Equation 3 are shown in
Table 3.
Figure 2.
Biomass model for leafless above ground biomass (top left) and constituent tree parts, stem (top right), branch (bottom left), and bud (bottom right). Parameters of the model applicable to Equation 3 are shown in
Table 3.
A high correlation for the total above ground leafless biomass and all constituent tree parts can be observed denoted by an exceptionally high value for
R2adj. Furthermore, the regression coefficients derived through the retransformation (Equation 3) of the simple linear regression are given in
Table 3 and plotted within
Figure 2 for total above ground leafless biomass and component parts. It must be noted that such regression coefficients are limited to site and species, although it is possible with caution [
49] to apply such allometric parameters to other locations that utilize the same species and clone.
3.3. Biomass Production
Calculated values for dry woody biomass separated by diameter class for both stem and branch compartments are given in
Table 4. The division of all stem and branch compartments by tree into 1 cm diameter classes provided the opportunity to analyze compartmental allocation within detail.
Table 4.
Calculated dry weights for stem and branch sections by diameter class.
Table 4.
Calculated dry weights for stem and branch sections by diameter class.
| dbh | n | Diametric class of segments (g) |
|---|
| (cm) | 0–1 | 1–2 | 2–3 | 3–4 | 4–5 | 5–6 | 6–7 | 7–8 | 8–9 | 9–10 | 10–11 | 11–12 |
|---|
| Stem | | | | | | | | | | | |
| 0–1 | 0 | | | | | | | | | | | | |
| 1–2 | 2 | 20.5 | 211.2 | 189.7 | 5.0 | | | | | | | | |
| 2–3 | 2 | 14.8 | 112.4 | 239.3 | 395.5 | 16.7 | | | | | | | |
| 3–4 | 3 | 13.8 | 95.9 | 352.7 | 572.7 | 453.4 | 442.8 | | | | | | |
| 4–5 | 3 | 15.3 | 123.4 | 296.2 | 516.7 | 624.4 | 779.7 | 408.2 | 19.6 | | | | |
| 5–6 | 5 | 16.3 | 137.9 | 291.7 | 433.5 | 878.3 | 823.0 | 922.3 | 311.6 | 14.6 | | | |
| 6–7 | 6 | 14.4 | 147.2 | 211.0 | 579.3 | 676.4 | 1200.6 | 999.9 | 1265.8 | 944.9 | 80.2 | | |
| 7–8 | 4 | 14.6 | 189.2 | 183.2 | 614.6 | 823.1 | 821.4 | 1679.1 | 997.7 | 1953.2 | 1082.5 | 355.4 | |
| 8–9 | 5 | 9.7 | 154.9 | 431.1 | 344.3 | 824.9 | 937.4 | 1635.5 | 1369.3 | 1548.7 | 1669.3 | 1193.5 | 348.3 |
| Branch | | | | | | | | | | | |
| 0–1 | 0 | | | | | | | | | | | | |
| 1–2 | 2 | 36.6 | 2.4 | | | | | | | | | | |
| 2–3 | 2 | 124.7 | 7.0 | | | | | | | | | | |
| 3–4 | 3 | 280.5 | 100.2 | | | | | | | | | | |
| 4–5 | 3 | 518.4 | 195.5 | 3.4 | | | | | | | | | |
| 5–6 | 5 | 617.9 | 380.6 | 9.5 | | | | | | | | | |
| 6–7 | 6 | 968.1 | 886.1 | 51.1 | | | | | | | | | |
| 7–8 | 4 | 1250.7 | 1307.2 | 122.1 | | | | | | | | | |
| 8–9 | 5 | 1350.7 | 1620.8 | 215.1 | | | | | | | | | |
Over the entire three-year rotation, whole tree above ground woody biomass production attained over 35 odt ha
−1 equivalent to 11.7 odt ha
−1 year
−1 (oven dried tonnes per hectare and year). This compares favorably with suggested production figures [
2] and other studies utilizing SRC poplar, such as that reported as 9.4–9.8 odt ha
−1 year
−1 for the second rotation of the same clonal variety [
52].
Table 5 shows the mean dry weight on a single tree basis used as a basis for the calculation of stand level yields (also displayed).
Strong correlations can be seen between dry branch weight and dbh. Branches represented 22.2% of total dry above ground woody biomass within the sample set which is equivalent to 2.60 odt ha
−1 year
−1 (
Table 5). The quantification of branch biomass is an important factor when considering total above ground leafless biomass in the context of whole tree harvesting, since the amount of branches can influence the quantity but more importantly the quality of the final product.
Buds constituted a mean value of 2.0% of total above ground leafless dry biomass within the 30 sample trees. It should be noted that, irrespective of dbh, the relative proportion of buds remains relatively constant within the sampled trees. This is expected to be a genetically controlled trait and may differ between clonal varieties, and further research is required to quantify this assumption. It stands to reason that tree buds are packed with carbohydrates and contain a large nutrient load, given that they are used as a fraction of biomass feedstock principally with the removal of whole trees at harvest, the inclusion of bud biomass within a fuelstock can only increase the calorific value of the fuel.
Table 5.
Average biomass distribution after three years at tree and stand level (based on a mean dbhof 57.4 mm and a height of 724.3 cm).
Table 5.
Average biomass distribution after three years at tree and stand level (based on a mean dbhof 57.4 mm and a height of 724.3 cm).
| Compartment | Mean Dry Weight (kg) | Total Stand Biomass (odt ha−1 year−1) |
|---|
| Above ground leafless biomass | 7.02 | 11.70 |
| Stem | 5.32 (75.8% *) | 8.87 |
| Branch | 1.56 (22.2% *) | 2.60 |
| Bud | 0.14 (2.0% *) | 0.24 |
3.4. Bark Proportion
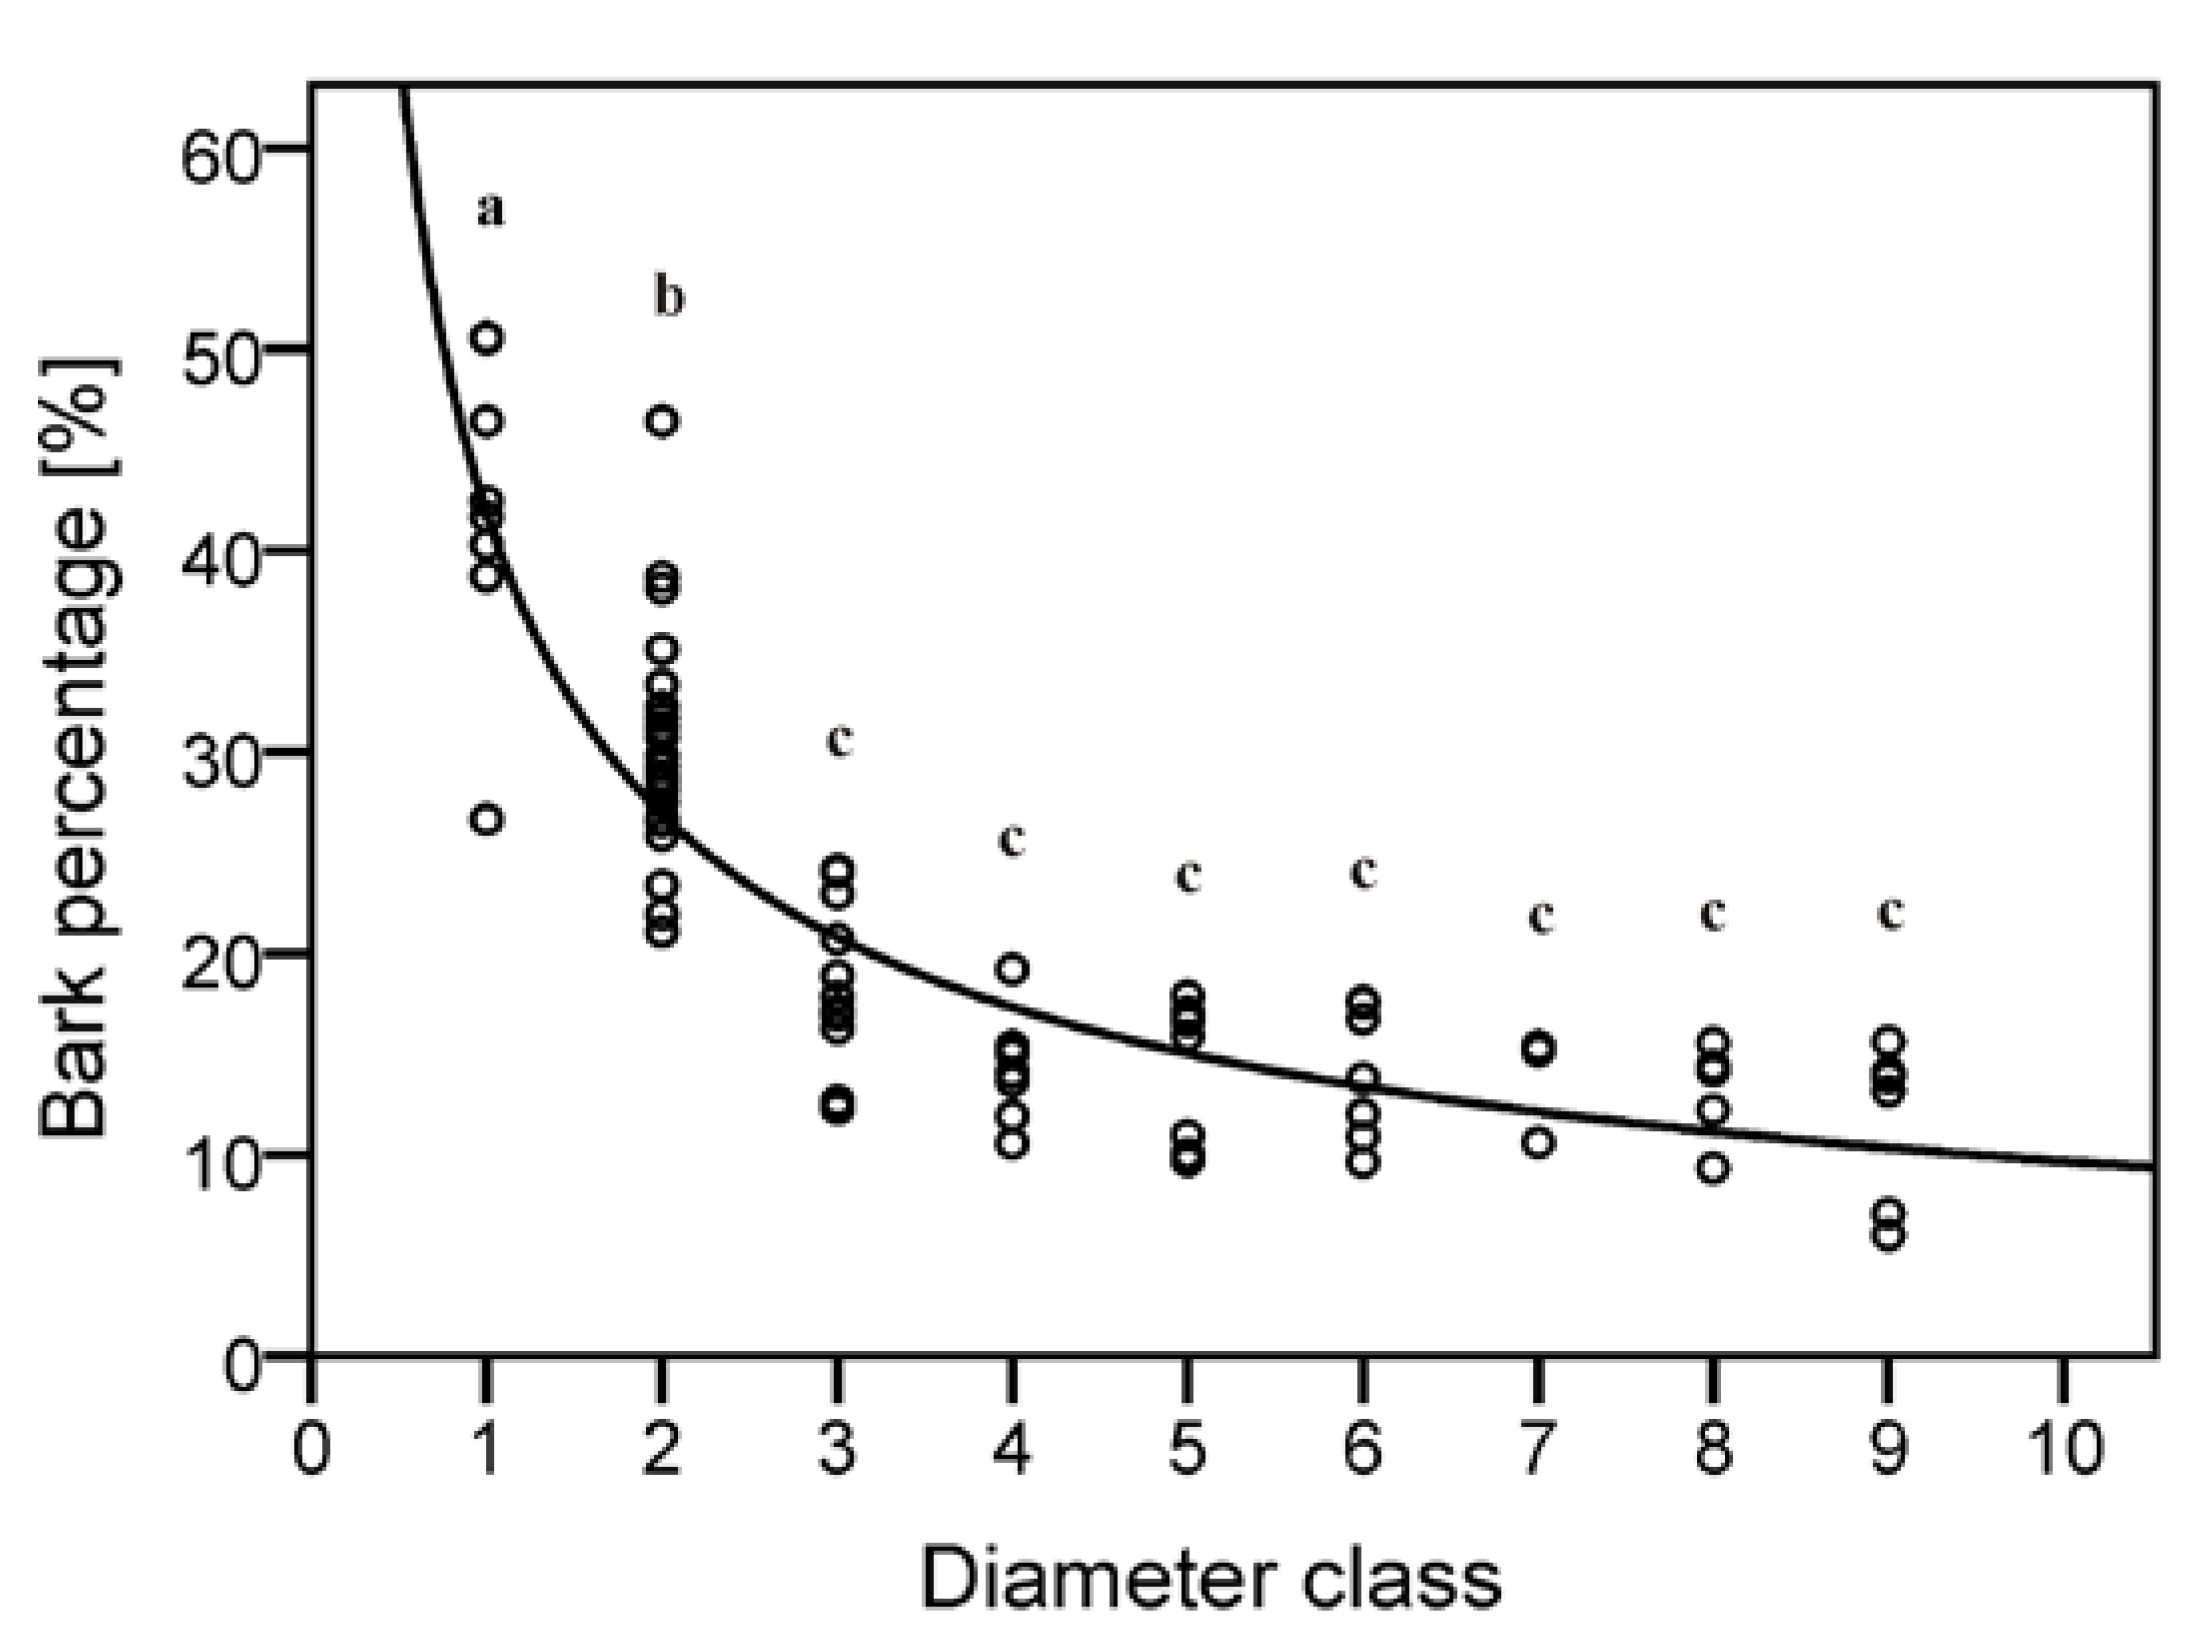
Empirical values derived from stem sample sections per diametric class range from 42.5% (diameter 0–1 cm) bark content per stem disc to 11.6% (diameter 8–9 cm). Such values can be observed to decrease as diametric class increases given a greater ratio of wood to bark. It should be noted that there was insufficient data to statistically analyze diameter classes 10 and above, although these classes were present within the sampled trees (
Table 4). Analysis through the use of ANOVA and a
post hoc Tukey’s HSD test outlines distinct groups where values are significantly similar as shown in
Figure 3.
Figure 3.
Biomass model for dry bark biomass by diameter class.Parameters of the model applicable to Equation 3 are shown in
Table 7. Mean values with the same letter are not significantly different (Tukey HSD, significance level
p < 0.05,
p-values: a = 1.0, b = 1.0, c = 0.2).
Figure 3.
Biomass model for dry bark biomass by diameter class.Parameters of the model applicable to Equation 3 are shown in
Table 7. Mean values with the same letter are not significantly different (Tukey HSD, significance level
p < 0.05,
p-values: a = 1.0, b = 1.0, c = 0.2).
The results gained through this investigation concur with previous research, which suggests that above diameters of 4 cm within the stem fraction, bark content is relatively constant [
34]. Furthermore, it can now be suggested that this also includes marginally smaller diameters of 2 cm to 3 cm encompassing both stem and branch portions as shown in
Figure 3.
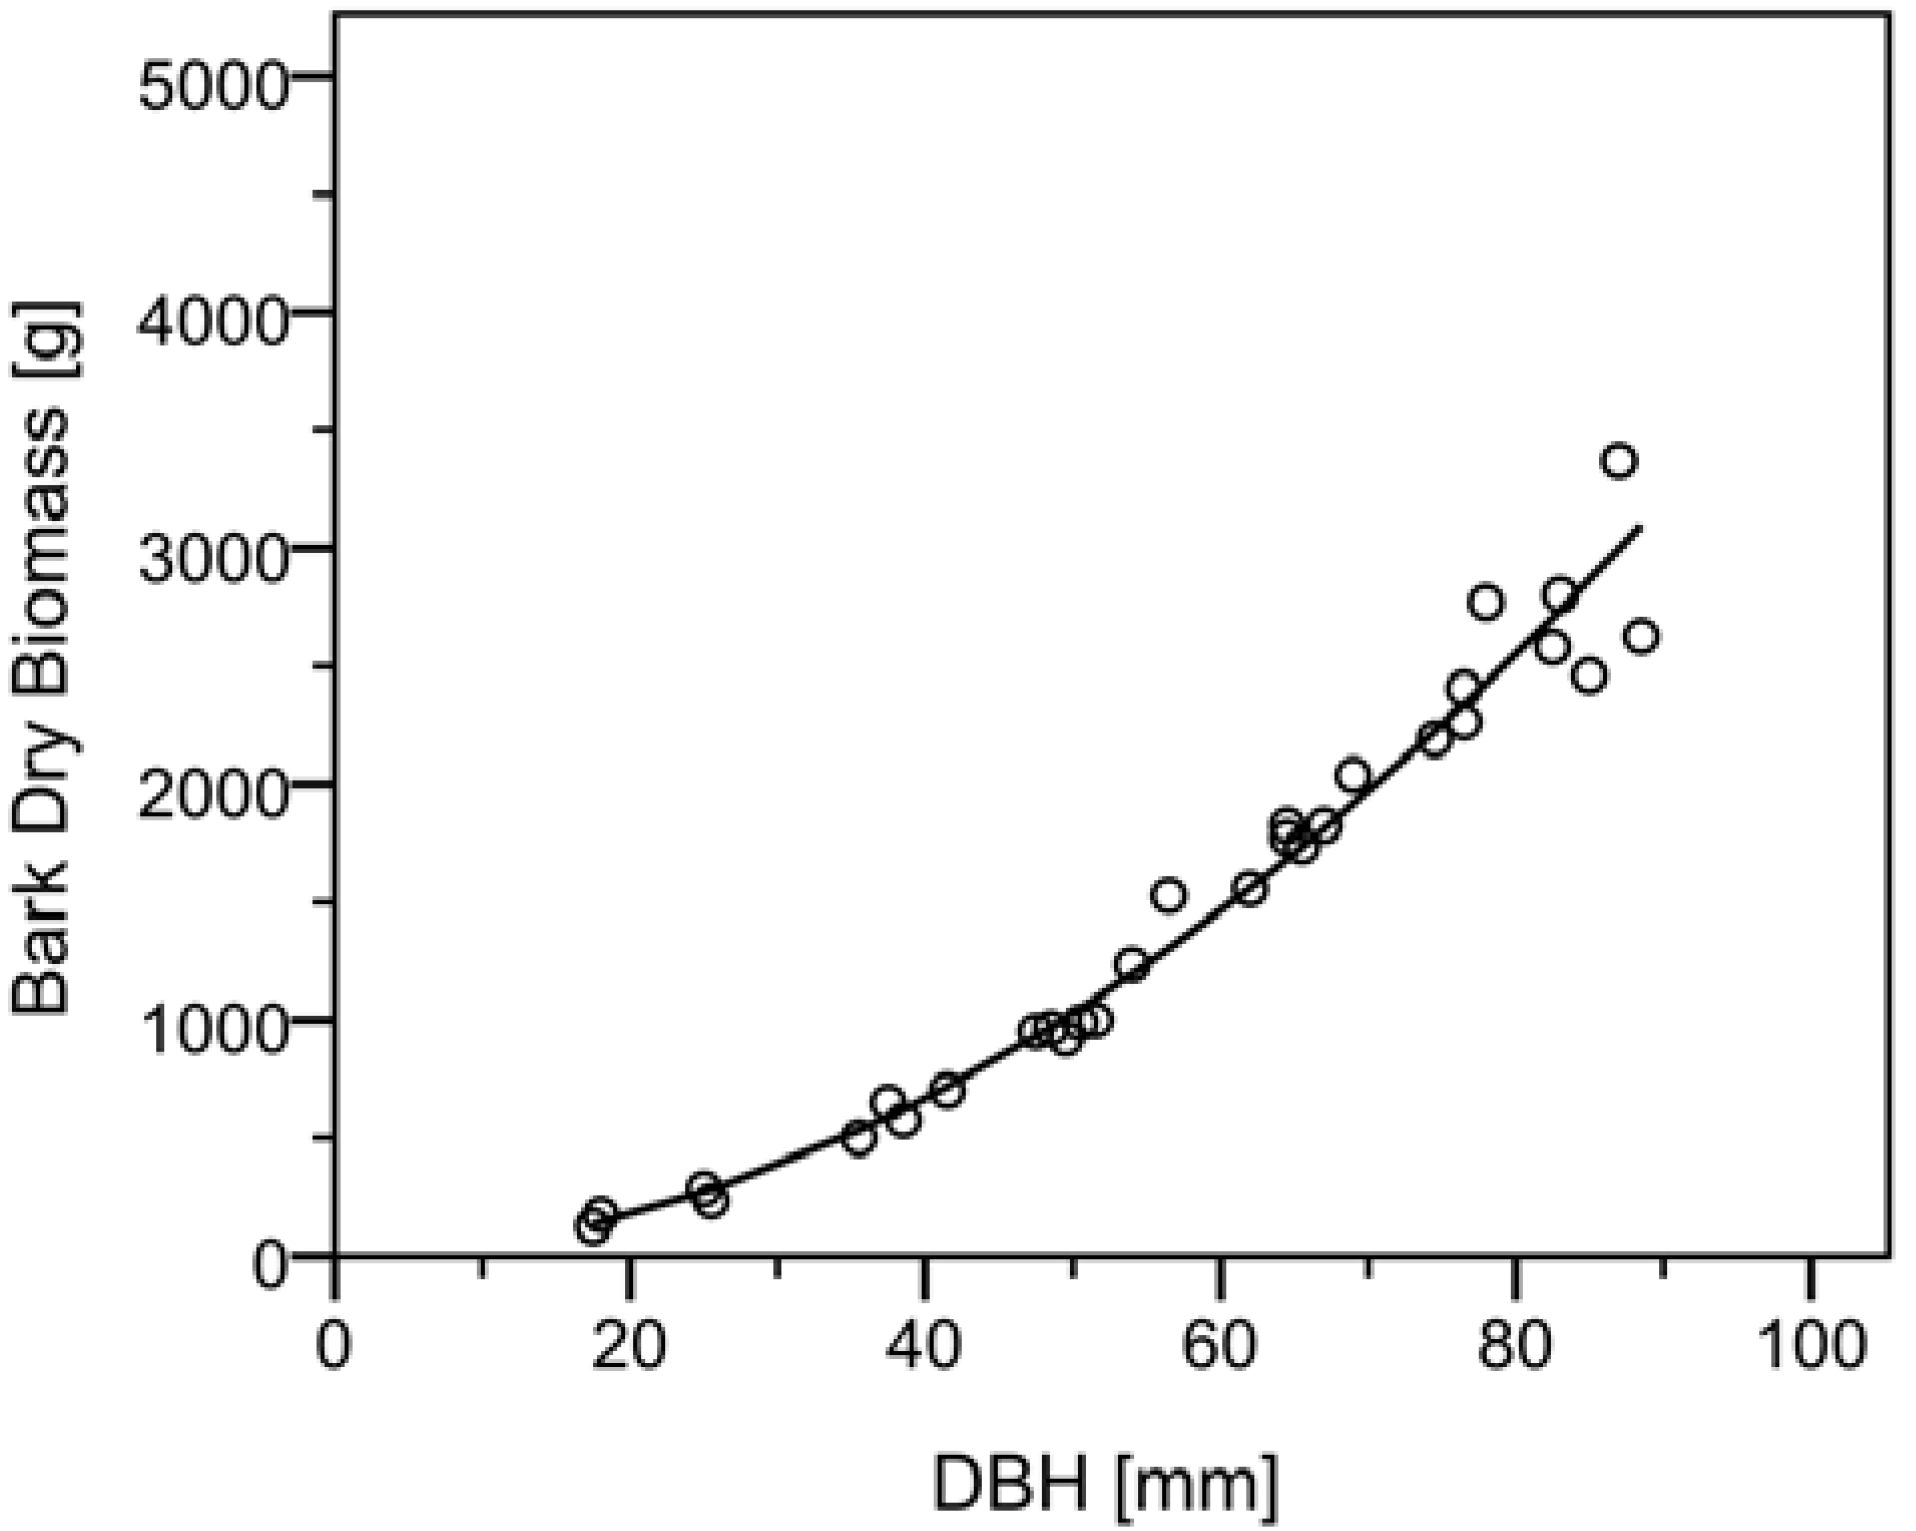
As a result of plotting diameter class against percentage of dry bark within sampled stem sections (itself showing a high correlation between variables as can be seen in
Table 6) percentage dry bark per diametric class could be calculated. This was carried out utilising log transformed linear regression methods and subsequently a retransformation with the inclusion of the correction factor using the function given in Equation 3 utilizing S
e. This in turn was used to compute estimated absolute mean values for dry bark weight per diametric class and consequently an estimate of individual above ground dry bark biomass content. Values derived from the model are comparable to that of the sampled stem discs, a larger figure is given for the smallest diameter class due to the extrapolation of values by the model towards smaller stem diameters. A further graphical output of values with a regression line derived from the retransformed Equation 3 was produced for above ground dry bark biomass against dbh as shown in
Figure 4.
Table 6.
Estimated allometric parameters for dry bark percentage by diametric class (df = 1,74) and above ground dry bark biomass (df = 1,28).
Table 6.
Estimated allometric parameters for dry bark percentage by diametric class (df = 1,74) and above ground dry bark biomass (df = 1,28).
| Compartment | Model | a2 | b | R2adj | Se | p |
|---|
| Bark % (by Diameter Class) | 5 | 3.734 | −0.636 | 0.737 | 0.25 | <0.001 |
| Bark (Above Ground Biomass) * | 6 | −0.609 | 1.929 | 0.989 | 0.09 | <0.001 |
Figure 4.
Biomass model for total above ground dry bark biomass.Parameters of the model applicable to Equation 3 are shown in
Table 7.
Figure 4.
Biomass model for total above ground dry bark biomass.Parameters of the model applicable to Equation 3 are shown in
Table 7.
Regression analysis suggests that dbh is also an excellent predictor variable for the estimation of dry bark weight. Detail of the derived estimated allometric parameters from the retransformed equation can also be seen in
Table 6. It should be noted that the residuals from the regression analysis fulfilled the assumptions of linearity and normality while displaying no autocorrelation or heteroscedasticity.
Mean dry stem bark proportion for the total biomass of the three-year-old poplar on the study site constituted 16.8% of above ground leafless biomass corresponding to a biomass production yield of 1.93 odt ha
−1 year
−1. The reporting figure correlates with that reported by others [
23], that bark percentage ranged from 18% to 27% for one and two-year-old plants derived from cuttings while in older trees (eight and twelve years) bark proportion ranges from 10% to 15%. This value can be further related to a study where values of 20% to 40% were reported for younger growing stock at one year old [
53]. Given that bark proportion under similar growth conditions in SRC stands is closely proportional to tree age and thus stem diameter [
54], younger growing stock will be expected to contain smaller diameter classes. Within such classes the bark proportion will be higher, as is demonstrated in
Figure 3, where values of approximately 20% to 40% were found in stem sections of less than 3 cm. Intuitively, individuals with larger dbh measurements will contain more diameter classes with increased biomass weights both within stem and branch compartments. Using this information, it is further possible to calculate biomass production per diameter class on a stand level, thus inferring important components such as bark proportion.
3.5. Nutrient Content of Biomass
In
Table 7 the elemental contents of the different compartments derived from a pilot study are shown in comparison to some values from the literature. Values gained for the stem fraction (wood and bark inclusive) are comparable with the same species of the same age as given in the literature [
22]. As expected, the bark and buds have higher elemental contents than the wood. Bark content can also be linked to the branchiness of a particular genetic variety when given a higher frequency of smaller diameter tree parts. To reduce the amount of removed nutrients a high proportion of wood is therefore desirable. Given that young shoots have high bark proportions, and thus high nutrient values, the age of the shoots at harvest will also play a large part in the total removal of nutrients from the site. Recommendations against whole tree harvesting and for extended rotations have been made [
16], however these suggestions conflict with the core aims of SRC culture.
Table 7.
Estimated elemental content in above ground biomass of selected poplar species.
Table 7.
Estimated elemental content in above ground biomass of selected poplar species.
| Species | Age (year) | N (kg odt−1) | P (kg odt−1) | K (kg odt−1) | Mg (kg odt−1) | Ca (kg odt−1) | Reference |
|---|
| PT × PT | 5 | 3.2 | 0.9 | 3.7 | 0.4 | 3.5 | [55] |
| PT × PT | 4 | 6.5 | 1.0 | 3.9 | 0.6 | 4.4 | [55] |
| PT × PT | 5 | 4.7 | 1.0 | 3.9 | 0.4 | 2.8 | [55] |
| PN × PM | 1 | 6.76 | 1.08 | 4.29 | 0.44 | 5.33 | [18] |
| PN × PM (bark) | 3 | 9.70 | 0.88 | 6.53 | 0.95 | 10.83 | [22] |
| PN × PM (bark) | 3 | 10.44 | 0.90 | 5.26 | 0.68 | 8.60 | [22] |
| PN × PM (stem) | 3 | 4.22 | 0.59 | 2.00 | 0.33 | 5.72 | [22] |
| PN × PM (stem) | 3 | 4.23 | 0.56 | 1.76 | 0.32 | 5.47 | [22] |
| PM × PT (stem) | 3 | 3.84 | 0.84 | 2.22 | 0.54 | 6.01 | This study |
| PM × PT (wood) | 3 | 1.97 | 0.53 | 1.14 | 0.32 | 1.96 | This study |
| PM × PT (bark) | 3 | 7.46 | 1.24 | 5.07 | 1.04 | 16.90 | This study |
| PM × PT (bud) | 3 | 8.81 | 1.64 | 4.22 | 1.41 | 4.21 | This study |
Table 8 provides detail towards the estimated nutrient content held within the above ground woody biomass of the study clone on a per hectare and year basis. Across a three-year rotation it can be estimated that values of 106, 24, 65, 16, and 160 kg ha
−1 of nitrogen, phosphorus, potassium, magnesium, and calcium respectively could have been sequestered within above ground leafless biomass. The removal of such quantities of each nutrient at harvest will have a cumulative negative effect on soil nutrient availability and lead to an increased need for fertilization to maintain site productivity.
Table 8.
Estimated elemental content in above ground biomass of a three-year-old poplar clone “Hybride 275” on a per hectare basis with an average yield of 11.7 odt ha−1 year−1.
Table 8.
Estimated elemental content in above ground biomass of a three-year-old poplar clone “Hybride 275” on a per hectare basis with an average yield of 11.7 odt ha−1 year−1.
| Compartment | N (kg ha−1 year−1) | P (kg ha−1 year−1) | K (kg ha−1 year−1) | Mg (kg ha−1 year−1) | Ca (kg ha−1 year−1) |
|---|
| Wood | 18.8 | 5.0 | 10.9 | 3.1 | 18.7 |
| Bark | 14.4 | 2.4 | 9.8 | 2.0 | 32.6 |
| Bud | 2.1 | 0.4 | 1.0 | 0.3 | 1.0 |
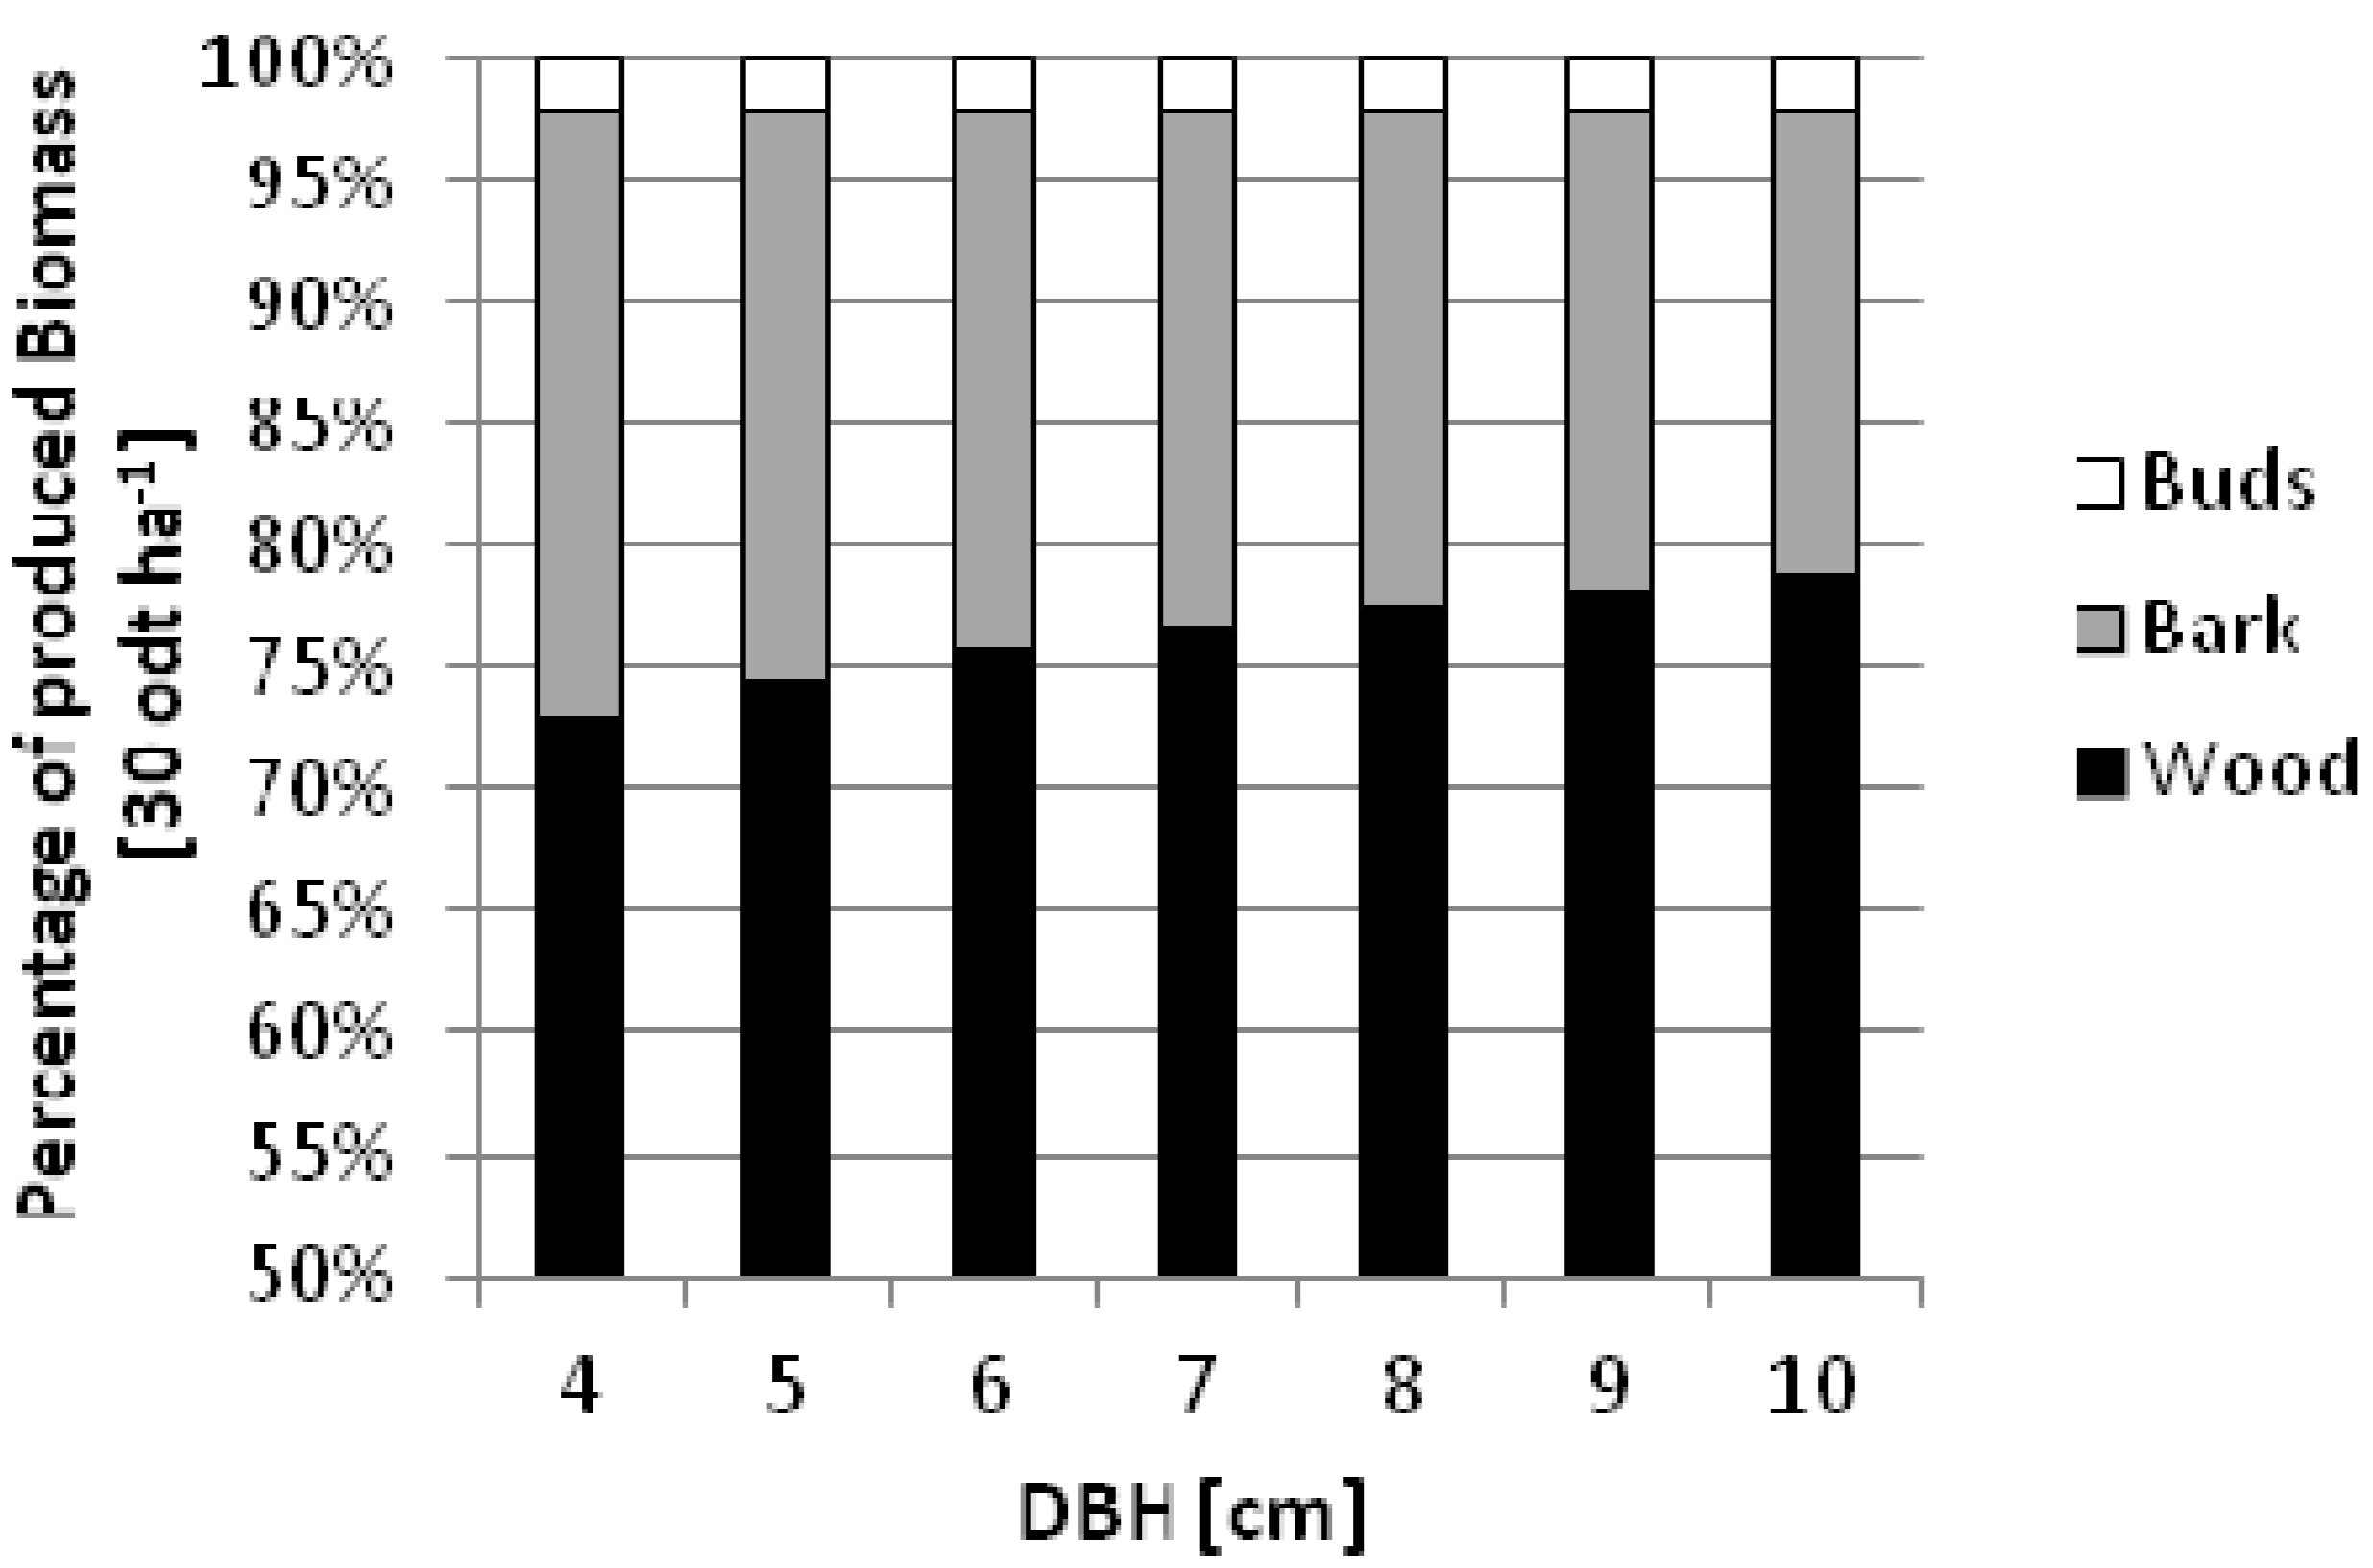
Using the models developed in this study, the amount of wood, bark, and buds are estimated as an illustration. It can be presupposed that biomass production can amount to 30 odt ha
−1 within a three-year rotation. Such an example is produced assuming different diameters for the three-year-old trees thus influencing the numbers of trees per hectare.
Figure 5 demonstrates the decrease in bark proportion with increasing diameter (dbh). Assuming similar growth conditions and clonal variety to that employed within this study, trees with a diameter of 4 cm would require a density of 11,143 trees ha
−1 or for trees with a diameter of 10 cm a density of 1,461 trees ha
−1 would be necessary to produce the prescribed 30 odt ha
−1 of biomass within a three-year rotation. Comparing these two cases, the bark content would decrease from 25% to 19% of the total biomass. This equates to 7.46 odt ha
−1 and 5.72 odt ha
−1 correspondingly. As a consequence of this scenario, a higher quality product is ensured while providing a longer rotation both factors contributing to a reduction in the potential for nutrient removal from site.
Figure 5.
Percentage of biomass compartments assuming a three-year rotation with 30 odt ha−1 of biomass for seven different scenarios with increasing target dbh from 4 to 10 cm.
Figure 5.
Percentage of biomass compartments assuming a three-year rotation with 30 odt ha−1 of biomass for seven different scenarios with increasing target dbh from 4 to 10 cm.


