Article

De Novo Transcriptomic Analysis and Development of EST–SSRs for Styrax japonicus

College of Landscape Architecture and Forestry, Qingdao Agricultural University, Qingdao, 266109, China
*
Author to whom correspondence should be addressed.
Forests 2018, 9(12), 748; https://doi.org/10.3390/f9120748
Submission received: 12 October 2018 / Revised: 24 November 2018 / Accepted: 29 November 2018 / Published: 30 November 2018
(This article belongs to the Section Forest Ecophysiology and Biology)

Abstract

:
Styrax japonicus sieb. et Zucc. is widely distributed in China with ornamental and medicinal values. However, the transcriptome of S. japonicus has not yet been reported. In this study, we carried out the first transcriptome analysis of S. japonicus and developed a set of expressed sequence tag–simple sequence repeats (EST–SSRs). We obtained 338,570,222 clean reads in total, of which the mean GC content was 41.58%. In total, 136,071 unigenes were obtained having an average length of 611 bp and 71,226 unigenes were favorably annotated in the database. In total, we identified 55,977 potential EST–SSRs from 38,611 unigenes, of which there was 1 SSR per 6.73 kb. The di-nucleotide repeats (40.40%) were the most identified SSRs. One set of 60 primer pairs was randomly selected, and the amplified products in S. japonicus were validated; 28 primer pairs successfully produced clear amplicons. A total of 21 (35%) polymorphic genic SSR markers were identified between two populations. In total, 15 alleles were detected and the average number was 6. The average of observed heterozygosity and expected heterozygosity was 0.614 and 0.552, respectively. The polymorphism information content (PIC) value fluctuated between 0.074 and 0.855, with a mean value of 0.504, which was also the middle level. This study provides useful information for diversity studies and resource assessments of S. japonicus.

1. Introduction

Styrax japonicus Sieb. et Zucc. (Japanese snowbell) is a deciduous tree species with white bell-shaped flowers that is widely distributed in eastern Asia and China [1], with high ornamental and medicinal values. Owing to increasing urban greening, more attention is being devoted to S. japonicus due to its ornamental value. Despite its importance, limited basic bioinformatics data on S. japonicus are accessible. Previous studies on this species mainly focused on seed germination [2,3] and tissue culture [4]. However, little has been reported about the bioinformatics information.
A variety of molecular markers have been developed and largely applied for genetic diversity analysis, DNA fingerprinting, cultivar identification, molecular-assisted breeding, genetic linkage mapping, and quantitative trait loci mapping [5,6]. Simple sequence repeats (SSRs) are usually significantly polymorphic and informative, and abundantly spread across the genome in various plants [7]. SSRs possess abundant information and have high reproducibility, locus specificity, ease of scoring, high intraspecific polymorphism, and multiallelic and good genome coverage [8]. SSR markers have been broadly used in genetic structure and genetic diversity evaluations [9], and based on their source, such markers are split into two categories: EST–SSRs (expressed-sequence-tag SSRs), determined from transcribed RNA sequences, and g–SSRs (genomic SSRs), determined from arbitrary genomic sequences [10]. In contrast to genomic SSRs, EST–SSRs have more interspecific transferability, are easy to identify, and they are more evolutionarily conserved, controlling a certain phenotype [11]. EST–SSRs markers have been developed and applied to various plants [12,13].
Next-generation sequencing (NGS) platforms have been used widely for obtaining high-throughput genomic data, of which de novo transcriptome sequencing has become an especially rapid and sophisticated technology [8,14]. High-throughput NGS is an accurate technology that is low cost, efficient, and reliable, and it is a powerful tool. Consequently, it can be applied to discover and develop molecular markers for non-model species [15,16]. Furthermore, transcriptome sequencing can be applied for the detection of functional genes, analyzing differential gene expression analysis, and transcriptome profiling [17,18]. NGS technologies make great contributions to the fields of conservation genetics and evolution by generating an enormous amount of large-scale data at whole-genome and whole-transcriptome levels.
Before NGS, SSR technology was difficult to use due to it being time consuming, having a high cost, and being labor intensive. Furthermore, it is economically costly to identify SSR motifs [19]. There is only a limited number of available molecular markers for S. japonicus [1], and polymorphic SSR markers in S. japonicus development have not been reported. These issues have been a constraint for S. japonicus genetic studies. With the ongoing creation of next-generation sequencing platforms, RNA-Seq has slowly superseded gene chip platforms [20], and RNA-Seq has been used to develop SSR markers for Sorbus pohuashanensis (Hance) Hedl. [21], Trifolium pretense L. [22], Psophocarpus tetragonolobus Linn. [23], Cyamopsis tetragonoloba Linn. [24], Rhododendron rex Levl. [25], and Quercus austrocochinchinensis Hjelmq. [26]. Thus, the development of several SSR markers based on RNA-Seq for breeding strategies is urgently needed. In this study, we first develop and validate a set of genic SSR markers for S. japonicus through an Illumina sequencing platform, which can provide more information for assessing the genetics and extending the capacity of plant breeding approaches in this particular species.

2. Materials and Methods

2.1. Plant Materials

For transcriptomic analysis, nine S. japonicus plants with vigorous growth were collected from the National Forest Genetic Resources Platform (NFGR) of Qingdao Agriculture University. Fresh and healthy flowers were gathered from 9 plants and quickly frozen in liquid nitrogen.

2.2. DNA and RNA Isolation

Total genomic DNAs were extracted according to Wiland–Szymańska [27]. The total RNA was isolated following Ghawana [28]. To check DNA quality and quantity, 1% agarose gels and an Eppendorf BioSpectrometer (Eppendorf, Saxony, Germany) were used separately. The quantity and quality of extracted RNA and DNA were assessed through agarose gel electrophoresis. For cDNA library preparation, the amount of RNA used exceeded 25 ng.

2.3. cDNA Library Construction and Sequencing

To construct the cDNA library, we used the methodology from the Biomarker Technologies Corporation (Beijing, China) according to the company’s directions. The following steps were conducted according to the Illumina workflow protocol: First- and second-strand cDNA synthesis, cDNA purification, end repair, adaptor ligation, size selection library enrichment, and purification. The cDNA quality assessment and quantification were performed using a Qubit Fluorometer (Thermo Fisher Scientific, Waltham, MA, America) and a Qseq100 DNA Analyzer (Bioptic Inc., Taiwan, China). cDNA libraries sequencing was performed on the Illumina HiSeq™ 2000 platform (Shanghai Biotechnology Corp., Shanghai, China).

2.4. Sequence Assembly and Annotation

The raw data were filtered by eliminating the adaptors, reads with low overall quality (quality score less than 20), and reads with an uncertain identity base. Unigenes were then de novo assembled using trinity [29]. Various public databases were used to align the unigenes for annotation, including NCBI Nr, Swissport, KOG, KEGG, and Pfam (E-value ≤ 1.0 × 10⁻⁵) to obtain the highest sequence similarity annotation and classification information [25]. According to the molecular function, biological process, and cellular component ontologies, Blast2GO was used to obtain GO annotation categories [30]. Furthermore, the KOG database was used to categorize and analyze all of the unigenes for predicting their possible functions. Finally, we used the KEGG Automatic Annotation Server to annotate ESTs into KEGG pathways [31].

2.5. Identification of EST–SSR Loci and Primer Design

Analysis of potential SSRs was conducted using MISA software (1.0 Version) [21]. For the SSRs, the following was selected, ten for the mono- nucleotides, five for di-nucleotides, four for tri-nucleotides, three for tetra-, penta-, and hexa-nucleotides. SSR primers were designed using Batch Primer 3 software (http://probes.pw.usda.gov/cgi-bin/batchprimer3/batchprimer3.cgi). The primer lengths were typically 20 bp (18 to 22 bp), and the annealing temperature was between 55 °C and 60 °C. The Polymerase Chain Reaction (PCR) product size was 100 to 300 bp. The optimum content of GC was approximately 50%, ranging from 40% to 60%. Based on the sequences containing SSRs and the metabolic pathway genes, one set of 60 primer pairs was selected. Primer synthesis was conducted at the Sangon Biotech Company (Shanghai, China).

2.6. Validation and Application of SSR Markers

To verify the polymorphism of EST–SSRs, a total of 40 individuals from two populations (Qingdao 20 and Weihai 20) were selected. We extracted DNA from 40 leaf samples according to the CTAB method [32]. PCR reactions were performed in the next steps: 5 min of 94 °C pre-denaturation, 45 s of 35 cycles of 94 °C, 45 s of annealing at an optimal temperature ranging from 55 °C to 60 °C, a 45-s extension at 72 °C, then a last 10-min extension at 72 °C. Each of the PCR products were confirmed using 6% polyacrylamide gel electrophoresis [33]. The amount of alleles and Wright’s F statistics parameters (Fst), observed heterozygosity (Ho), and expected heterozygosity (He) were quantified by POPGENE 1.32 [34], polymorphism information content (PIC) values were obtained by PIC_CALC software [35].

3. Results

3.1. Sequencing and De Novo Assembly

In total, 364,794,740 paired-end raw reads were produced by Illumina next-generation sequencing for S. japonicus. After data filtering, we obtained 338,570,222 clean reads, of which the GC content was 41.58%. The total nucleotide number of the clean reads was 49,540,935,462 nt, with a mean Q20 and Q30 higher than 98.01% and 94.67%, respectively (Table 1). The total number of unigenes was 136,071, and their total length was 83,181,839 bp. The mean length was 611 bp, and the value of N50 was 846 bp (Table 1). Among the 136,071 unigenes, 91,282 (67.08%) ranged in length from 200 to 499 bp, 24,231 (17.81%) from 500 to 999 bp, 8949 (6.58%) from 1000 to 1499 bp, 5302 (3.90%) from 1500 to 1999 bp, and 6307 (4.63%) had a length greater than or equal to 2000 bp (Figure 1).

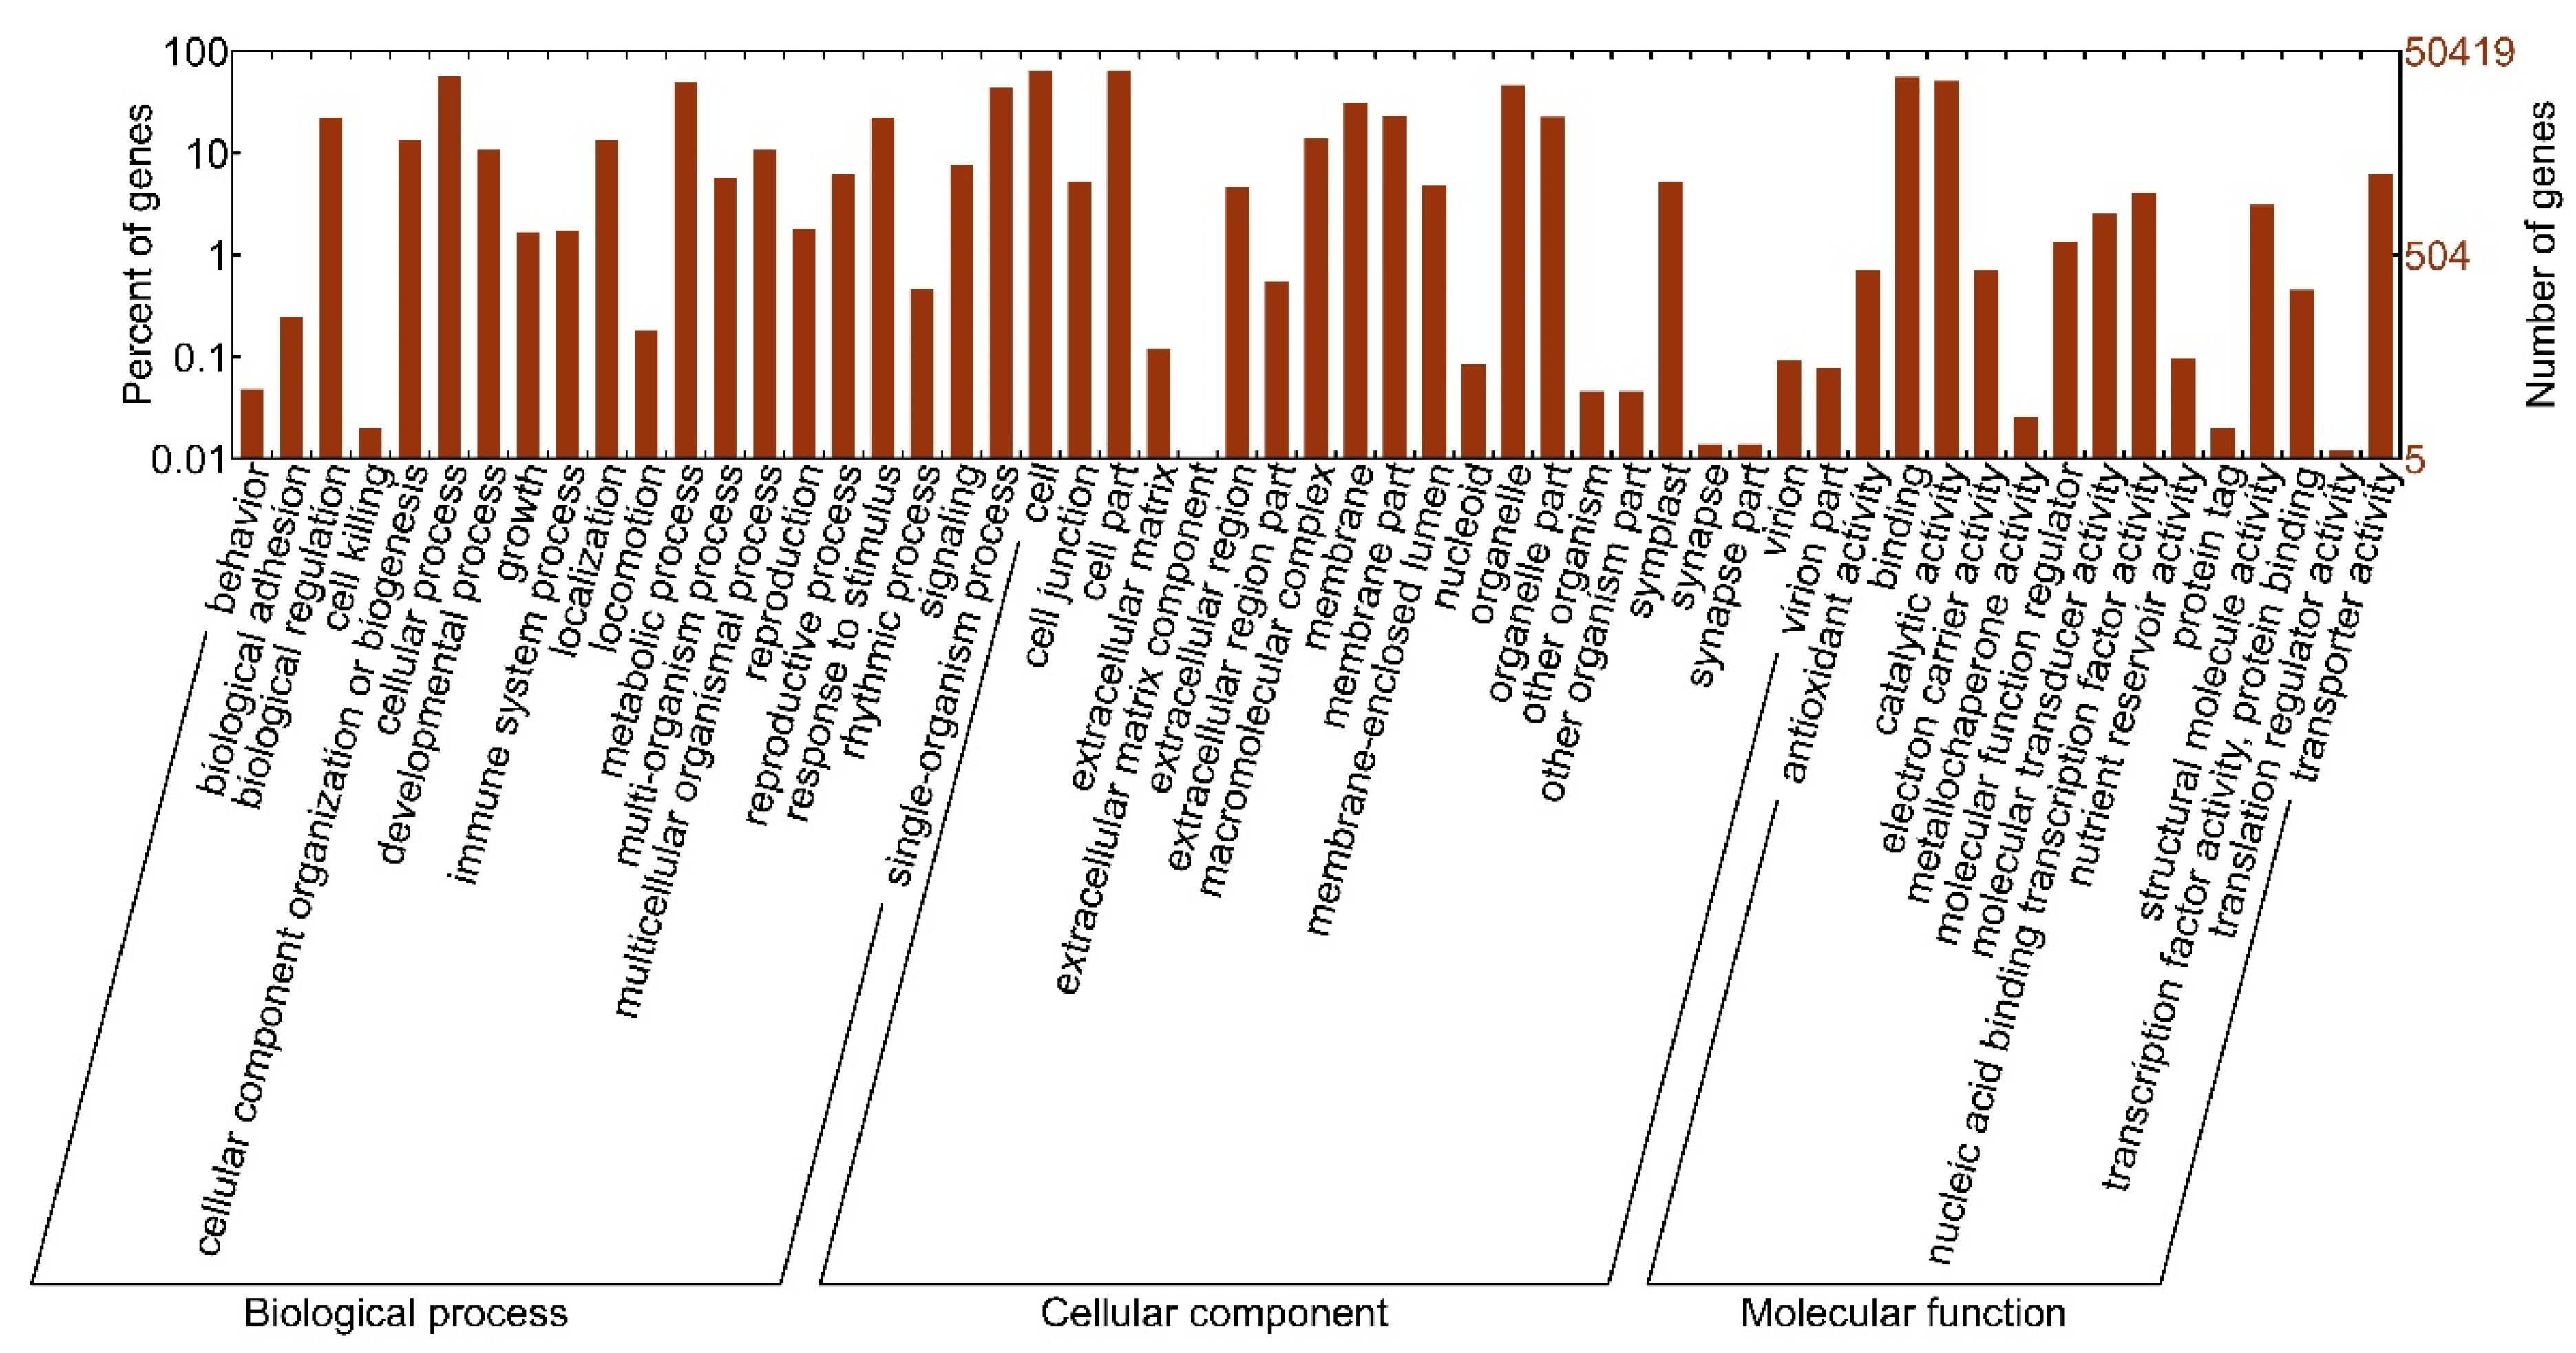
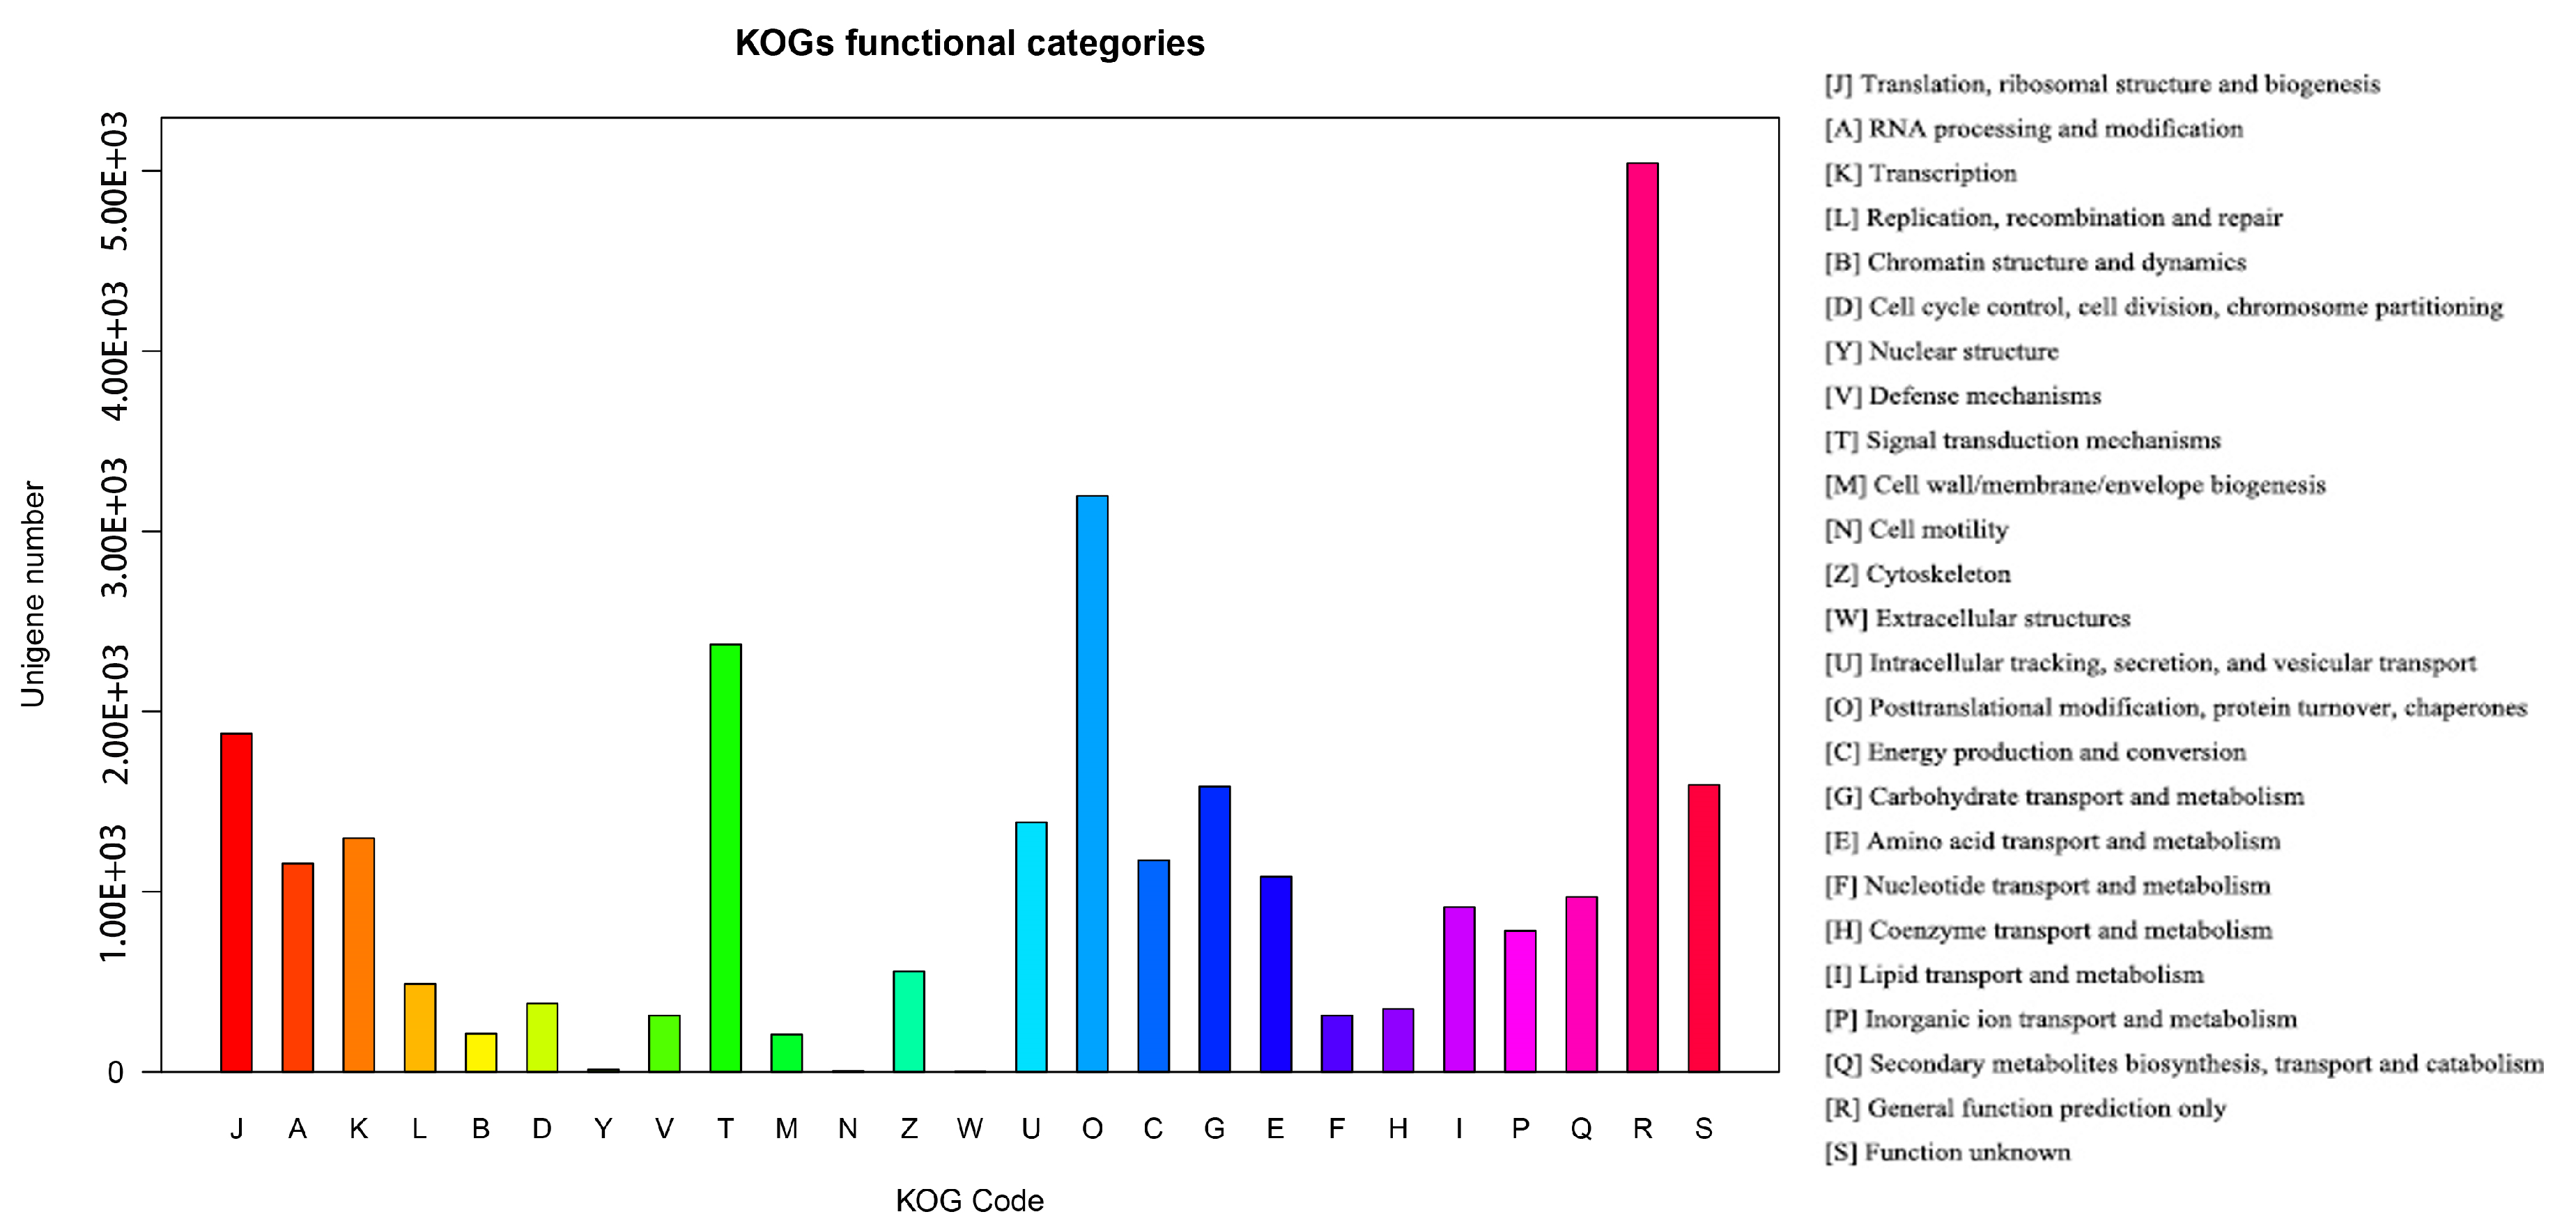
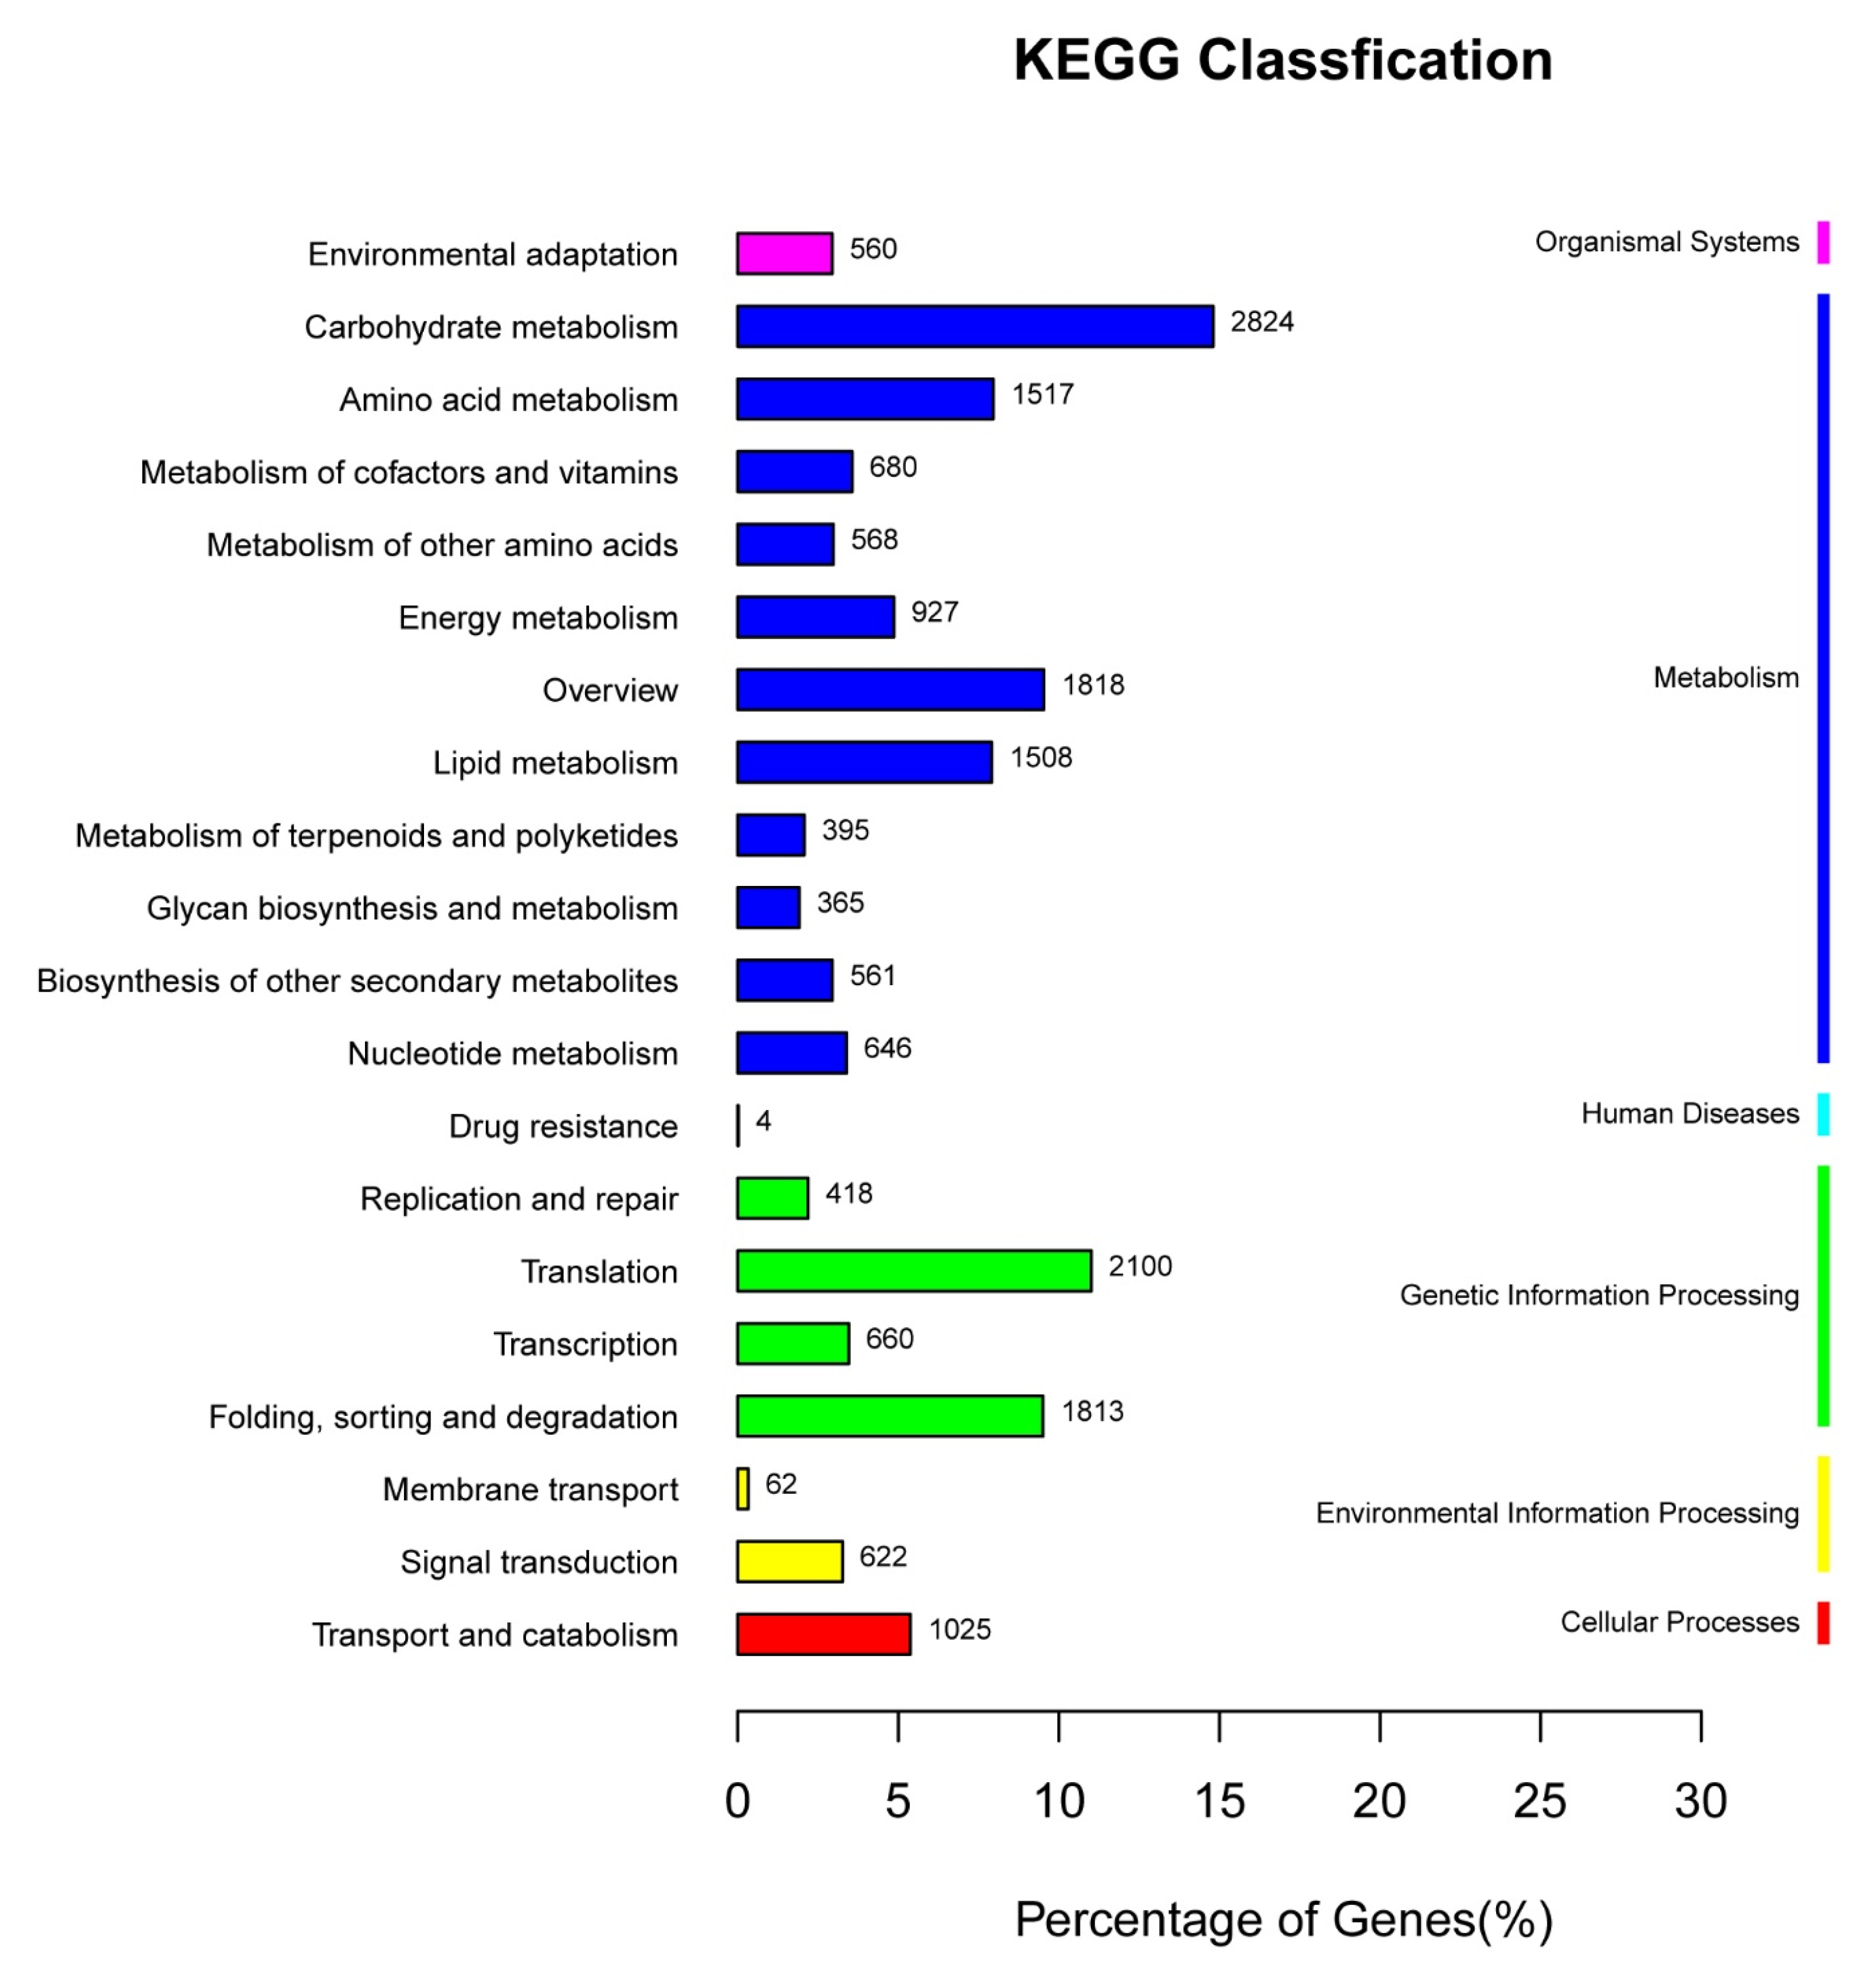
3.2. Functional Annotation of Unigenes

Multiple databases, including Nr, SwissPort, GO, KOG, KEGG, TrEMBL and Pfam, were used to obtain the corresponding annotation information from the final unigene set (Table S1). In total 71,226 unigenes were favorably annotated in the database. A total of 64,752 (47.6%) unigenes aligned to the Nr database, and nearly 35,860 unigenes (55.38%) of the sequences revealing greater than 80% similarity (Figure S1).
From the species statistics, we found that 11,355 (17.54%) unigenes were annotated to Vitis vinifera L. 3506 (5.41%) unigenes were annotated to Coffea canephora Pierre ex Froehn. and 3185 (4.92%) unigenes were annotated to Nelumbo nucifera Gaertn. Fruct. et Semin. However, 34,211 (52.83%) unigenes were annotated to other species (Figure S1 and Table S2).
A total of 50,419 unigenes were annotated to GO annotations, and these terms involved three primary biological aspects: Biological processes, cellular components, and molecular functions. In the cellular component classification, unigenes in the cell (9.34%, 31,862) formed the largest group, followed by cell parts (9.30%, 31,741) and organelles (6.85%, 23,374). In the biological process category, unigenes participating in cellular processes (8.31%, 28,363) formed the largest group, followed by metabolic processes (7.25%, 24,730) and single-organism processes (6.53%, 22,279). In the molecular function group, unigenes that took part in binding (8.15%, 27,825) formed the largest group, followed by catalytic activity (7.50%, 25,601) and transporter activity (0.92%, 3155) (Figure 2 and Table S3).
In total, 27,266 unique sequences were placed within 25 function KOG categories. Among these categorizations, the largest group of unigenes was assigned to general function prediction only (5043, 18.50%), followed by posttranslational modification, protein turnover, chaperones (3197, 11.73%), and signal transduction mechanisms (2373, 8.70%), Extracellular structures formed the smallest group, with only (2, 0.01%) unigenes. The proportions of the other classifications ranged from 4 to 1877 (Figure 3 and Table S4).
In total, 19,073 unigenes were assigned to six categories, including 128 KEGG pathways. Of the total number of unigenes involved the pathway and across the six categories, metabolism (11,809, 61.91%) was the largest category, followed by genetic information processing (4991, 26.17%), cellular processes (1025, 5.37%), environmental information processing (684, 3.59%), organismal systems (560, 2.94%), and human diseases (4, 0.02%) (Figure 4 and Table S5).

3.3. Frequency and Distribution of SSRs

In total, we identified 55,977 potential EST–SSRs from 38,611 unigenes (including 14,447 mono-nucleotides). A total of 11,652 unigenes contained at least two EST–SSR loci, and 8121 were compound microsatellites (Table 1). Among these 38,611 unigenes, one SSR site was found per 6.73 kb (55,977 SSRs within 83.18 Mb) and the frequency of SSRs was 41.14%. The SSR tandem repeat lengths differed from 10 to 228 bp, and a 15 bp length occurred most frequently (12,896, 26.95%). The most identified SSRs (excluding mono-nucleotides) were di-nucleotide repeats (17,193, 40.40%), followed by tri-nucleotide (11,260, 27.11%) and tetra-nucleotide (7273, 17.64%) repeats, and the other SSR types accounted for 13.86% in total. Among the SSR tandem repeats, the most common were three tandem repeats (10,439, 25.14%), followed by five tandem repeats (9739, 23.45%), and four tandem repeats (9060, 21.82%); six and seven tandem repeats accounted for (3872, 9.32%) and (2227, 5.36%), respectively, whereas the remainder of the tandem repeats amounted to fewer than 15% (Table 2).
AG/CT present the highest frequency among the di-nucleotide repeats (10,930, 26.32%), followed by AT/AT (4412, 10.62%), AC/GT (1802, 4.34%), and CG/CG (49, 0.12%). AAG/CTT was the most frequently observed in tri-nucleotide repeats (2690, 6.48%), followed by ACC/GGT (1783, 4.29%), AGG/CCT (1530, 3.68%), ATC/ATG (1092, 2.63%), AGC/CTG (1008, 2.43%), CCG/CGG (865, 2.08%), AAT/ATT (850, 2.05%), AAC/GTT (732,1.76%), ACG/CGT (397, 0.96%), and ACT/AGT (313, 0.75%). The above-mentioned repeat motifs accounted for 68.51% (Table S6).

3.4. Development and Validation of Novel EST–SSRs

Based on the sequences containing SSRs and the metabolic pathway genes, one set of 60 primer pairs was randomly selected, and the amplified products in S. japonicus were validated. Among the selected 60 primer pairs, 28 primer pairs successfully produced clear amplicons. Using four S. japonicus individuals from two populations as PCR models, the outcomes reveal that 21 of the 28 primer pairs were polymorphic, which containing six di-, six tri-, four tetra-, three penta-, one hexa and one compound motifs, while the other nine primer pairs were monomorphic.
We conducted an extra validation for 40 individuals from two populations to confirm the 21 polymorphic genic SSRs developed. Fifteen alleles were noted, the amount of alleles ranged from 2 to 15, with an average six. The PIC value fluctuated between 0.074 and 0.855, and the mean value was 0.504. Observed heterozygosity varied from 0.025 to 1.000, and the average was 0.614. The anticipated heterozygosity was from 0.074 to 0.882, with an average of 0.550; the Fst values were from 0.004 to 0.173, with a mean of 0.046. (Table 3).

4. Discussion

4.1. Characterization of the S. japonicus Transcriptome

Recently, NGS has been widely applied in many non-model plants [26]. In the evaluation of genetic diversity, cultivar DNA fingerprinting, genome organization, and marker-assisted breeding, and in genome-wide association studies [36,37], SSR markers have been widely used. Transcriptome sequencing is successful in developing SSRs in many organisms [10]. S. japonicus is widely distributed in China, with ornamental and medicinal value. However, as a valuable species, the transcriptome of S. japonicus has not been reported. Therefore, the lack of available genetic information has limited the exploitation of this plant. In the present evaluation, the transcriptome of S. japonicus was initially documented by utilizing Illumina sequencing technology. A total of 364,794,740 paired-end raw reads were obtained, and 338,570,222 clean reads were generated with a 98.01% Q20 level and the “N” base was 0.01%, guaranteeing the quality of sequencing. Previous studies on Elymus sibiricus Linn. [8] and R. rex [25] with comparable Q20 level and the “N” base have confirmed the high quality of the sequencing. The unigenes numbers assembled were less than those of R. rex (164,242) [25] but more than those of Juglans cathayensis Dode. (116,814) [38], Jatropha curcas L. (115,611) [39], and Salix psammophila C. Wang et Ch. Y. Yang. (71,458) [40]. The average unigene length was shorter than that of Quercus kerrii Hu. (719 bp) [26], Pinus bungeana Zucc. ex Endl. (922 bp) [41], and R. latoucheae Franch. (709 bp) [42] but longer than that of Myrica rubra Sieb. (531 bp) [43] and Camellia sinensis O. Ktze. (380 bp) [44]. Overall, the result of the present evaluation will contribute to the genetic improvement of S. japonicus.
The final unigene set was used for comparison with the NCBI database. The annotated sequence information can be effective for investigating genetic differentiation of S. japonicus in the future. In our study, a total of 71,226 unigenes were successfully annotated in the database. The species-based annotated unigenes showed that S. japonicus is closely related to V. vinifera, C. canephora, and N. nucifera, which obviously does not get supported by taxonomic studies. This contradiction is most likely be caused by the fact that there is no report on the transcriptome of the Styracaceae family, and 34,211 (52.83%) genes were annotated to other species. Therefore, it is most likely that in the future the most related species of Styrax japonicus will change, with more species of Styracaceae being annotated in the NCBI. There is less research on the bioinformatics information of the Styracaceae family, and 34,211 (52.83%) unigenes were annotated to other species. Of the three GO classifications, the greatest were cellular processes and cell and binding activity. This result is consistent with that for Hevea brasiliensis Muell. and Litchi chinensis Sonn. [45,46]. With respect to the KOG category, the general function prediction was the largest category, which is consistent with a previous study [47]. According to the KEGG pathway database, 18,355 (13.50%) unigenes significantly matched and were put into six categories, such as 128 KEGG pathways. The annotation information provides sufficient transcriptomic data and also increases our understanding of the active metabolic processes in S. japonicus.

4.2. SSR Markers in the Transcriptome of S. japonicus

It is common knowledge that SSR markers have been broadly utilized for genetic structure and analysis [48,49]. Nevertheless, their use depends on the creation of SSR marker primers [50]. EST–SSRs can be utilized to acquire data on gene expression directly since they are tightly linked to functional genes. Numerous EST sequences have been determined from transcriptome information [14]. Transcriptome sequences can be used to create EST–SSR markers to facilitate research into genetic diversity and marker-assisted selection. A total of 55,977 possible EST–SSRs were determined (including 14,447 mono-nucleotides) in the present study, with di-nucleotide repeats the most noted SSRs, similar to previous studies [43,51,52]. The frequency of AG/CT was the highest in the di-nucleotide repeats and the CG/CG motif was the least abundant, which might be related to the methylation of cytosine [42]. The frequency of AAG/CTT was the greatest in the tri-nucleotide repeats. This finding is consistent with previous studies, which also indicated that the AAG motif might be more important in dicotyledonous plants [53,54]. The average of one SSR site was found per 6.73 kb, which is similar to that observed for E. sibiricus (1/6.59 kb) [8], lower than Neolitsea sericea Koidz. (1/3.8 kb) and R. latoucheae [13,42], and higher than Paeonia suffruticosa Andr. (1/9.24 kb) [55]. The frequency of SSRs mainly depends on the mining tool used, database size, the genome structure, and the species differences [56].

4.3. Validation of EST-SSR Markers

In this study, 60 primer pairs were created, with 28 primer pairs effectively producing clear amplicons. The 21 (35%) polymorphic genic SSR markers were identified among two populations (Table S7). This rate is less than those documented for R. rex (63%) [25] and P. suffruticosa (39.90%) [55] but higher than J. mandshurica Maxim. (30.8%) [57] and E. sibiricus (22.4%) [8]. Moreover, 32 primer pairs failed to produce amplification, which may be caused by the large introns, and chimeric primers [58]. This study revealed a relatively high polymorphism level, which can be applied in future genetic research on S. japonicus.
We detected 15 alleles among 40 S. japonicus individuals based on the 21 EST–SSR markers. Allele numbers varied from 2 to 15, and the average was 6. The average of observed heterozygosity and expected heterozygosity was 0.614 and 0.552, respectively. The PIC value is usually used to evaluate the level of genetic information [55]. Our results showed that the PIC value fluctuates from 0.074 and 0.855, and the mean value was 0.504, which is also the middle level. The created EST–SSR markers are therefore an efficient instrument for performing genetic analysis within the broad range of S. japonicus populations.

5. Conclusions

In this study, we first analyzed the transcriptome of S. japonicus using Illumina sequencing technology and we also determined and created several EST–SSRs. In total, we acquired 136,071 unigenes from S. japonicus with an average length of 611 bp. 71,226 unigenes were annotated in the Nr (47.6%), Swiss-Prot (26.6%), Pfam (33.4%), TrEMBL (47.1%), GO (37.1%), KOG (33.7%), and KEGG (13.5%) databases. The total number of potential EST–SSRs identified was 55,977 based on the unigene sequence. We randomly selected 60 primers and these were used for evaluation of the polymorphism, and 21 primers showed high polymorphism in two populations. These results not only provide more information for assessing the genetic research, but also for extending the capacity of plant breeding approaches in S. japonicus.

Supplementary Materials

The following are available online at https://www.mdpi.com/1999-4907/9/12/748/s1, Figure S1: NR distribution of the results of the comparison of S. japonicus, Table S1: Functional annotation of the S. japonicus transcriptome, Table S2: Distribution of the BLASTX against the nr database for each unigene, Table S3: GO term assignment for the S. japonicus transcriptome (Level 2), Table S4: KOG annotation of S. japonicus unigenes, Table S5: KEGG pathways involved in the S. japonicus transcriptome, Table S6: The EST-SSRs for Styrax japonicus. Table S7: SSR primers for Styrax japonicus. The dataset is available from the NCBI Short Read Archive (SRA) with accession number SRR7888585-7888593.

Author Contributions

K.W. and C.Z. conceived and designed the experiments; W.L. performed the experiments, conducted the data analysis and wrote the manuscript; Q.H.L. revised the manuscript; X.J. contributed the plant material; and Q.C.L. analyzed the data.

Funding

This research was funded by the Forestry Science & Technology Innovation Project of Shangdong Province (LYCX01-2018-05); “Collection and Protection of Featured, Rare and Endangered Forest Tree Germplasm Resources (2016LZGC038).”

Acknowledgments

We thank the National Forest Genetic Resources Platform (NFGRP) for providing the Styrax japonicus resources. We would like to thank LetPub (www.letpub.com) for providing linguistic assistance during the preparation of this manuscript.

Conflicts of Interest

The authors declare that they do not have any conflicts of interest.

References

  1. Wang, X.Y.; Yu, S.; Liu, M.; Yang, Q.S.; Chen, X.Y. Twenty-three microsatellite loci for Styrax confusus and Styrax japonicus (Styracaceae). Conserv. Genet. Resour. 2009, 2, 51–54. [Google Scholar] [CrossRef]
  2. Wang, L.; Wang, K.L.; Liu, Q.C.; Liu, Q.H. Effects of gibberellin and lamination treatment on seed germination of Styrax japonicus. Acta. Agric. Jiangxi. 2010, 22, 77–79. [Google Scholar]
  3. Horimoto, T.; Koshioka, M.; Kubota, S.; Mander, L.N.; Hirai, N.; Ishida, N.; Suh, J.K.; Lee, A.K.; Roh, M.S. Effect of warm and cold stratification on 1 H-NMR profiles, endogenous gibberellins and abscisic acid in Styrax japonicus seeds. Hortic. Environ. Biote. 2011, 52, 233. [Google Scholar] [CrossRef]
  4. Shim, K.K.; Ha, Y.M. Mass propagation of Korean Native Styrax japonicus through axillary bud culture. J. Korean Soc. Hortic. Sci. 1997, 38, 575–580. [Google Scholar]
  5. Ismail, N.A.; Rafii, M.Y.; Mahmud, T.M.; Hanafi, M.M.; Miah, G. Molecular markers: A potential resource for ginger genetic diversity studies. Mol. Biol. Rep. 2016, 43, 1347–1358. [Google Scholar] [CrossRef] [PubMed]
  6. Chang, Y.; Oh, E.U.; Min, S.L.; Kim, H.B.; Moon, D.G.; Song, K.J. Construction of a genetic linkage map based on RAPD, AFLP, and SSR markers for tea plant (Camellia sinensis). Euphytica 2017, 213, 190. [Google Scholar] [CrossRef]
  7. Phumichai, C.; Phumichai, T.; Wongkaew, A. Novel chloroplast microsatellite (cpSSR) markers for genetic diversity assessment of cultivated and wild Hevea Rubber. Plant Mol. Biol. Rep. 2015, 33, 1–13. [Google Scholar] [CrossRef]
  8. Zhou, Q.; Luo, D.; Ma, L.; Xie, W.; Wang, Y.; Wang, Y.; Liu, Z. Development and cross-species transferability of EST-SSR markers in Siberian wildrye (Elymus sibiricus L.) using Illumina sequencing. Sci. Rep. 2016, 6, 20549. [Google Scholar] [CrossRef] [PubMed]
  9. Yoichi, W.; Sakaguchi, S.; Ueno, S.; Tomaru, N.; Uehara, K. Development and characterization of EST-SSR markers for the genus Rhododendron section Brachycalyx (Ericaceae). Plant Spec. Biol. 2017, 32, 455–459. [Google Scholar] [CrossRef]
  10. Zheng, X.; Cheng, P.; Ying, D.; You, Y.; Yang, C.; Hu, Z. Development of microsatellite markers by transcriptome sequencing in two species of Amorphophallus (Araceae). BMC Genom. 2013, 14, 490. [Google Scholar] [CrossRef] [PubMed]
  11. Najafzadeh, R.; Arzani, K.; Bouzari, N.; Saei, A. Genetic variation and identification of promising sour cherries inferred from microsatellite markers. Russ. J. Genet. 2016, 52, 64–73. [Google Scholar] [CrossRef]
  12. Liu, Y.C.; Liu, S.; Liu, D.C.; Wei, Y.X.; Liu, C.; Yang, Y.M.; Tao, C.G.; Liu, W.S. Exploiting EST databases for the development and characterization of EST-SSR markers in blueberry (Vaccinium) and their cross-species transferability in Vaccinium spp. Sci. Hortic. 2014, 176, 319–329. [Google Scholar] [CrossRef]
  13. Chen, L.Y.; Cao, Y.N.; Yuan, N.; Nakamura, K.; Wang, G.M.; Qiu, Y.X. Characterization of transcriptome and development of novel EST-SSR makers based on next-generation sequencing technology in Neolitsea sericea (Lauraceae) endemic to East Asian land-bridge islands. Mol. Breed. 2015, 35, 187. [Google Scholar] [CrossRef]
  14. Taheri, S.; Abdullah, T.L.; Jain, S.M.; Sahebi, M.; Azizi, P. TILLING, high-resolution melting (HRM), and next-generation sequencing (NGS) techniques in plant mutation breeding. Mol. Breed. 2017, 37, 40. [Google Scholar] [CrossRef]
  15. Ekblom, R.; Galindo, J. Applications of next generation sequencing in molecular ecology of non-model organisms. Heredity 2011, 107, 1–15. [Google Scholar] [CrossRef] [PubMed]
  16. Duan, X.; Wang, K.; Su, S.; Tian, R.; Li, Y.; Chen, M. De novo transcriptome analysis and microsatellite marker development for population genetic study of a serious insect pest, Rhopalosiphum padi (L.) (Hemiptera: Aphididae). PLoS ONE 2017, 12, e0172513. [Google Scholar] [CrossRef] [PubMed]
  17. Severin, A.J.S.; Woody, J.L.; Bolon, Y.T.; Joseph, B.; Diers, B.W.; Farmer, A.D.; Muehlbauer, G.J.; Nelson, R.T.; Grant, D.; Specht, J.E.; et al. RNA-Seq Atlas of Glycine max: A guide to the soybean transcriptome. BMC Plant Biol. 2010, 10, 160. [Google Scholar] [CrossRef] [PubMed]
  18. Zenoni, S.; Delledonne, M. Characterization of transcriptional complexity during berry development in Vitis vinifera using RNA-Seq. Plant Physiol. 2010, 152, 1787–1795. [Google Scholar] [CrossRef] [PubMed]
  19. Squirrell, J.; Hollingsworth, P.M.; Woodhead, M.; Russell, J.; Lowe, A.J.; Gibby, M.; Powell, W. How much effort is required to isolate nuclear microsatellites from plants? Mol. Ecol. 2003, 12, 1339–1348. [Google Scholar] [CrossRef] [PubMed]
  20. Peter, A.C.; Yavuz, A.; Thygesen, H.H.; Erno, V.; Vossen, R.H.A.M.; De, M.R.X.; Boer, J.M.; Van, O.G.J.B.; Den, D.J.T. Deep sequencing-based expression analysis shows major advances in robustness, resolution and inter-lab portability over five microarray platforms. Nucleic Acids Res. 2008, 36, e141. [Google Scholar]
  21. Liu, C.; Dou, Y.; Guan, X.; Fu, Q.; Zhang, Z.; Hu, Z.; Zheng, J.; Lu, Y.; Li, W. De novo transcriptomic analysis and development of EST-SSRs for Sorbus pohuashanensis (Hance) Hedl. PLoS ONE 2017, 12, e0179219. [Google Scholar] [CrossRef] [PubMed]
  22. Kovi, M.R.; Amdahl, H.; Alsheikh, M.; Rognli, O.A. De novo and reference transcriptome assembly of transcripts expressed during flowering provide insight into seed setting in tetraploid red clover. Sci. Rep. 2017, 7, 44383. [Google Scholar] [CrossRef] [PubMed] [Green Version]
  23. Vatanparast, M.; Shetty, P.; Chopra, R.; Doyle, J.J.; Sathyanarayana, N.; Egan, A.N. Transcriptome sequencing and marker development in winged bean (Psophocarpus tetragonolobus; Leguminosae). Sci. Rep. 2016, 6, 29070. [Google Scholar] [CrossRef] [PubMed]
  24. Tanwar, U.K.; Pruthi, V.; Randhawa, G.S. RNA-Seq of Guar (Cyamopsis tetragonoloba, L. Taub.) Leaves: De novo transcriptome assembly, functional annotation and development of genomic resources. Front Plant Sci. 2017, 8, 91. [Google Scholar] [CrossRef] [PubMed]
  25. Zhang, Y.; Zhang, X.; Wang, Y.H.; Shen, S.K. De dovo assembly of transcriptome and development of novel EST-SSR markers in Rhododendron rex through Illumina sequencing. Front Plant Sci. 2017, 8, 1664. [Google Scholar] [CrossRef] [PubMed]
  26. An, M.; Deng, M.; Zheng, S.S.; Song, Y.G. De novo transcriptome assembly and development of SSR markers of oaks Quercus austrocochinchinensis and Q. kerrii (Fagaceae). Tree Gene Genomes. 2016, 12, 103. [Google Scholar] [CrossRef]
  27. Li, J.; Wang, S.; Jing, Y.; Ling, W. A modified CTAB protocol for plant DNA extraction. Chin. Bull. Bot. 2013, 48, 72–78. [Google Scholar]
  28. Ghawana, S.; Paul, A.; Kumar, H.; Kumar, A.; Singh, H.; Bhardwaj, P.K.; Rani, A.; Singh, R.S.; Raizada, J.; Singh, K. An RNA isolation system for plant tissues rich in secondary metabolites. BMC Res. Notes 2011, 4, 85. [Google Scholar] [CrossRef] [PubMed]
  29. Grabherr, M.G.; Haas, B.J.; Yassour, M.; Levin, J.Z.; Thompson, D.A.; Amit, I.; Adiconis, X.; Fan, L.; Raychowdhury, R.; Zeng, Q. Full-length transcriptome assembly from RNA-Seq data without a reference genome. Nat. Biotechnol. 2011, 29, 644. [Google Scholar] [CrossRef] [PubMed]
  30. Conesa, A.; Götz, S.; Garcíagómez, J.M.; Terol, J.; Talón, M.; Robles, M. Blast2GO: A universal tool for annotation, visualization and analysis in functional genomics research. Bioinformatics 2005, 21, 3674–3676. [Google Scholar] [CrossRef] [PubMed]
  31. Moriya, Y.; Itoh, M.; Okuda, S.; Yoshizawa, A.C.; Kanehisa, M. KAAS: An automatic genome annotation and pathway reconstruction server. Nucleic Acids Res. 2007, 35, 182–185. [Google Scholar] [CrossRef] [PubMed]
  32. Doyle, J. DNA protocols for plants-CTAB total DNA isolation. Mol. Tech. Taxon. 1991, 283–293. [Google Scholar] [CrossRef]
  33. Liu, W.; Li, R.; Ayalew, H.; Xia, Y.; Bai, G.; Yan, G.; Siddique, K.H.; Guo, P. Development of a simple and effective silver staining protocol for detection of DNA fragments. Electrophoresis 2017, 38, 1175. [Google Scholar] [CrossRef] [PubMed]
  34. Krawczak, M.; Nikolaus, S.; Von, E.H.; Croucher, P.J.P.; El, M.N.E.; Schreiber, S. PopGen: Population-based recruitment of patients and controls for the analysis of complex genotype-phenotype relationships. Commun. Genet. 2006, 9, 55–61. [Google Scholar] [CrossRef] [PubMed]
  35. Nagy, S.; Poczai, P.; Cernák, I.; Gorji, A.M.; Hegedűs, G.; Taller, J. PICcalc: An online program to calculate polymorphic information content for molecular genetic studies. Biochem. Genet. 2012, 50, 670–672. [Google Scholar] [CrossRef] [PubMed]
  36. Zargar, S.M.; Raatz, B.; Sonah, H.; MuslimaNazir; Bhat, J.A.; Dar, Z.A.; Agrawal, G.K.; Rakwal, R. Recent advances in molecular marker techniques: Insight into QTL mapping, GWAS and genomic selection in plants. J. Crop Sci. Biotechnol. 2015, 18, 293–308. [Google Scholar] [CrossRef]
  37. Carneiro, V.M.L.; Luciane, S.; Lima, D.A.; Freitas, M.C.D. Microsatellite markers: What they mean and why they are so useful. Genet. Mol. Biol. 2016, 39, 312–328. [Google Scholar]
  38. Dang, M.; Liu, Z.X.; Chen, X.; Zhang, T.; Zhou, H.J.; Hu, Y.H.; Zhao, P. Identification, development, and application of 12 polymorphic EST-SSR markers for an endemic Chinese walnut (Juglans cathayensis L.) using next-generation sequencing technology. Biochem. Syst. Ecol. 2015, 60, 74–80. [Google Scholar] [CrossRef]
  39. Tian, W.; Paudel, D.; Vendrame, W.; Wang, J. Enriching genomic resources and marker development from transcript sequences of Jatropha curcas for Microgravity Studies. Int. J. Genomics 2017, 1, 8614160. [Google Scholar]
  40. Jia, H.; Yang, H.; Sun, P.; Li, J.; Zhang, J.; Guo, Y.; Han, X.; Zhang, G.; Lu, M.; Hu, J. De novo transcriptome assembly, development of EST-SSR markers and population genetic analyses for the desert biomass willow, Salix psammophila. Sci. Rep. 2016, 6, 39591. [Google Scholar] [CrossRef] [PubMed]
  41. Cai, Q.; Li, B.; Lin, F.; Huang, P.; Guo, W.; Zheng, Y. De novo sequencing and assembly analysis of transcriptome in Pinus bungeana Zucc. ex Endl. Forests. 2018, 9, 156. [Google Scholar] [CrossRef]
  42. Xing, W.; Liao, J.; Cai, M.; Xia, Q.; Liu, Y.; Zeng, W.; Jin, X. De novo assembly of transcriptome from Rhododendron latoucheae Franch. using Illumina sequencing and development of new EST-SSR markers for genetic diversity analysis in Rhododendron. Tree Genet. Genomes 2017, 13, 53. [Google Scholar] [CrossRef]
  43. Feng, C.; Chen, M.; Xu, C.J.; Bai, L.; Yin, X.R.; Li, X.; Allan, A.C.; Ferguson, I.B.; Chen, K.S. Transcriptomic analysis of Chinese bayberry (Myrica rubra) fruit development and ripening using RNA-Seq. BMC Genom. 2012, 13, 19. [Google Scholar] [CrossRef] [PubMed]
  44. Wu, H.; Chen, D.; Li, J.; Yu, B.; Qiao, X.; Huang, H.; He, Y. De novo characterization of leaf transcriptome using 454 sequencing and development of est-ssr markers in Tea (Camellia sinensis). Plant Mol. Biol. Rep. 2013, 31, 524–538. [Google Scholar] [CrossRef]
  45. Li, C.; Wang, Y.; Huang, X.; Li, J.; Wang, H.; Li, J. De novo assembly and characterization of fruit transcriptome in Litchi chinensis Sonn and analysis of differentially regulated genes in fruit in response to shading. BMC Genom. 2013, 14, 552. [Google Scholar] [CrossRef] [PubMed]
  46. Li, D.; Deng, Z.; Qin, B.; Liu, X.; Men, Z. De novo assembly and characterization of bark transcriptome using Illumina sequencing and development of EST-SSR markers in rubber tree (Hevea brasiliensis Muell. Arg.). BMC Genom. 2012, 13, 192. [Google Scholar] [CrossRef] [PubMed]
  47. Chen, H.; Wang, L.; Wang, S.; Liu, C.; Blair, M.W.; Cheng, X. Transcriptome sequencing of mung bean (Vigna radiate L.) genes and the identification of EST-SSR markers. PLoS ONE 2015, 10, e0120273. [Google Scholar] [CrossRef] [PubMed]
  48. Liu, S.; Feuerstein, U.; Luesink, W.; Schulze, S.; Asp, T.; Studer, B.; Becker, H.C.; Dehmer, K.J. DArT, SNP, and SSR analyses of genetic diversity in Lolium perenne L. using bulk sampling. BMC Genet. 2018, 19, 10. [Google Scholar] [CrossRef] [PubMed]
  49. Pinto, M.V.; Poornima, H.S.; Sivaprasad, V.; Naik, V.G. A new set of mulberry-specific SSR markers for application in cultivar identification and DUS testing. J. Genet. 2018, 97, 1–7. [Google Scholar] [CrossRef]
  50. Marconi, T.G.; Costa, E.A.; Miranda, H.R.; Mancini, M.C.; Cardoso-Silva, C.B.; Oliveira, K.M. Functional markers for gene mapping and genetic diversity studies in sugarcane. BMC Res. Notes 2011, 4, 264. [Google Scholar] [CrossRef] [PubMed] [Green Version]
  51. Yan, L.P.; Liu, C.L.; Wu, D.J.; Li, L.; Shu, J.; Sun, C.; Xia, Y.; Zhao, L.J. De novo transcriptome analysis of Fraxinus velutina using Illumina platform and development of EST-SSR markers. Biol. Plantarum. 2016, 61, 210–218. [Google Scholar] [CrossRef]
  52. Jia, X.; Deng, Y.; Sun, X.; Liang, L.; Su, J. De novo assembly of the transcriptome of Neottopteris nidus using Illumina paired-end sequencing and development of EST-SSR markers. Mol. Breed. 2016, 36, 94. [Google Scholar] [CrossRef]
  53. Morgante, M.; Hanafey, M.; Powell, W. Microsatellites are preferentially associated with nonrepetitive DNA in plant genomes. Nat. Genet. 2002, 30, 194–200. [Google Scholar] [CrossRef] [PubMed]
  54. Cavagnaro, P.F.; Senalik, D.A.; Yang, L.; Simon, P.W.; Harkins, T.T.; Kodira, C.D.; Huang, S.; Weng, Y. Genome-wide characterization of simple sequence repeats in cucumber (Cucumis sativus L.). BMC Genom. 2010, 11, 569. [Google Scholar] [CrossRef] [PubMed]
  55. Wu, J.; Cai, C.; Cheng, F.; Cui, H.; Zhou, H. Characterisation and development of EST-SSR markers in tree peony using transcriptome sequences. Mol. Breed. 2014, 34, 1853–1866. [Google Scholar] [CrossRef]
  56. Biswas, M.K.; Chai, L.; Mayer, C.; Xu, Q.; Guo, W.; Deng, X. Exploiting BAC-end sequences for the mining, characterization and utility of new short sequences repeat (SSR) markers in Citrus. Mol. Biol. Rep. 2012, 39, 5373–5386. [Google Scholar] [CrossRef] [PubMed]
  57. Hu, Z.; Zhang, T.; Gao, X.X.; Wang, Y.; Zhang, Q.; Zhou, H.J. De novo assembly and characterization of the leaf, bud, and fruit transcriptome from the vulnerable tree Juglans mandshurica for the development of 20 new microsatellite markers using Illumina sequencing. Mol. Genet. Genom. 2016, 291, 849–862. [Google Scholar] [CrossRef] [PubMed]
  58. Varshney, R.K.; Graner, A.; Sorrells, M.E. Genic microsatellite markers in plants: Features and applications. Trends Biotechnol. 2005, 23, 48–55. [Google Scholar] [CrossRef] [PubMed]
Figure 1. Length distribution of unigenes. Horizontal and vertical axes show the size and number of unigens, respectively. What is counted is the number of the unigenes with the length of over 200 bp. The statistics of unigenes equal to or more than 2000 bp are classified as a group. The number of unigenes with different length ranges is indicated by columns with different colors.
Forests 09 00748 g001
Figure 2. Gene Ontology (GO) annotations of Styrax japonicus unigenes. The left y-axis indicates the percentage of a specific category of genes in each main category. The right y-axis represents the amount of unigenes in a category.
Forests 09 00748 g002
Figure 3. KOG functional classification of Styrax japonicus unigenes. The y-axis indicates the amount of unigenes in a specific functional cluster. The x-axis shows function class.
Forests 09 00748 g003
Figure 4. KEGG metabolic pathway of Styrax japonicus. The y-axis indicates the KEGG pathway, and the x-axis is the ratio of the number of unigenes.
Forests 09 00748 g004
Table 1. Summary of transcriptome sequencing and assembly in Styrax japonicus.
CategoryItemsNumber
Raw readsTotal raw reads364,794,740
Clean readsTotal clean reads338,570,222
Total clean nucleotide (nt)49,540,935,462
Q20 percentage (average)98.01%
Q30 percentage (average)94.67%
GC percentage (average)41.58%
UnigenesTotal sequence number136,071
Total sequence Length83,181,839
Largest (bp)10,742
Smallest (bp)224
Average (bp)611
N50 (bp)846
EST–SSRsSequences examined136,071
Size of examined sequences (bp)83,181,839
Identified SSRs55,977
SSR-containing sequences38,611
Sequences containing more than one SSR11,652
SSRs present in compound formation8121
Table 2. Distribution of the different expressed sequence tag–simple sequence repeats (EST–SSRs) of Styrax japonicus.
RepeatsDi-Tri-Tetra-Penta-Hexa-TotalPercentage (%)
3 59782170229110,43925.14
4 70729743906249,06021.82
57064225626291669,73923.45
62826909806513,8729.32
71747438114272,2275.36
8148630883121,8174.38
91076514 91,1402.75
10824634 38942.15
11687441 37351.77
1245332 14861.17
1313031 11620.39
1413991 1490.36
1514712 1590.38
161026 1080.26
17937 1000.24
18873 900.22
19687 750.18
20553 580.14
21413 440.11
22312 330.08
23161 170.04
≥241213 21260.30
Total17,19311,26073232664309041,530
Percentage (%)41.4027.1117.646.417.44
Table 3. Characteristics of the 21 novel EST –SSR markers in Styrax japonicus.
PrimerForward Primer (5′–3′)Reverse Primer (5′–3′)Tm (°C)SSRsAlleles NumberHoHePICFstr
Sty-3GGATCGATCCCAATGGCGTATCCTTAGCTCCATCAAGTGCA59.091(GTTTG) 570.8000.6250.5820.0230.143
Sty-7ACAAGCCATGAGCCGATGAATGTTGTCCTTTGTTAATTCCCCT58.19(AGC) 430.3250.3080.2820.0490.333
Sty-16CTCTCCACCCCAATTGCCATCCAAGCTTGCCAAATCCACC60.037(CCG) 870.4750.4640.4410.0370.143
Sty-20GGGTTGTATAAGGGTTGCCAGACGGTGGTACTTCACAGTGT59.932(AT) 1070.6920.7670.7320.0190.143
Sty-39TTCATCGGCTCTTGGCTTGTCAGCGTCAAGTTGGTTTCGG60.041(GTG) 490.9500.8110.7760.0270.111
Sty-43GGACGCTCAAGGTCAACTCAAGGCTGCCATATCTAGGGGT59.805(TCGGT) 350.8750.6030.5230.0050.200
Sty-44CCTTCCCCACAACCCACTACATGCTTCCTCATTGTGCAGC59.184(TC) 12120.9390.8820.8550.0390.083
Sty-47GGGTTGGCCACCTTGATCTTTCAGAGGCTCCAATACGTAGC59.318(TC) 11 (TA) 8141.0000.8730.8480.0730.071
Sty-49TCACCAGTTCGCGTGTTAGTGCATGGGGTTTCTTGCGAAG60.109(TCAT) 360.8460.7250.6780.0270.167
Sty-55TGTTGCTTGAAAGTGCGGTCGTGTGGACACATCACCGGAT60.036(AATA) 480.2560.4910.4500.0430.125
Sty-57TCGGGATCTTTTAAGTTTTGGAGCGAATCCGTTTGGTTGCCGAG59.832(AAAT) 330.0250.0740.0710.0300.333
Sty-58TCCTTGTGCACTCAGTCCACTGTAGCACACGGTCCTGTTC59.967(GGTTC) 320.0770.2660.2260.1200.500
Sty-59TGCTTCAAAATGCATTGCCAGGATCCACAGTTGCATCAGC59.263(GAAT) 330.9000.5530.4420.0120.333
Sty-61ACTTGGCTAGAGAGGGGGAGAGGTGAGTGAGAATTGGGCG60.036(CGC) 420.5500.4040.3190.1540.500
Sty-66CGGTGTTGAGAGGAGTCGTCCCAGCATCTCCTCCTTCCAG59.531(AGT) 540.3160.4130.3740.0410.250
Sty-69CCACTCGAGCCAACCAACATAGACGAGACTGAGTGGAGTT57.72(TC) 520.4000.3240.2690.0040.500
Sty-72GTGACAGAGGGGAGCACTTCCCGCCCAATGTAGTGAAGGT60.035(GTAGGA) 350.9500.5740.4740.0040.200
Sty-77AAGAGAGGAACAGTGGCAGCTCGTGTCTACCTCCAACAAAGT59.303(AG) 1150.4500.7040.6360.0260.200
Sty-86GCAATCGAGAGGGAGTGAGGCGGTTGGCCAGTTTCTTTGG59.968(AG) 520.3750.3090.2580.1730.500
Sty-87GGGCTGGGTCAGAATGTGAACGACAACAGTTGCCACCTTG59.971(GTT) 550.7250.5650.5170.0170.200
Sty-88GTCGAATTCCGCAAGCCATCGGTTCACCGTGATTCACCGA60.32(AT) 6150.9750.8540.8250.0460.067
Mean 59.6042 60.6140.5520.5040.0460.243
min 57.72 20.0250.0740.0710.0040.067
max 60.32 151.0000.8820.8550.1730.500

