Abstract
Clinical studies indicate that patients infected with SARS-CoV-2 develop hyperinflammation, which correlates with increased mortality. The SARS-CoV-2/COVID-19-dependent inflammation is thought to occur via increased cytokine production and hyperactivity of RAGE in several cell types, a phenomenon observed for other disorders and diseases. Metabolic reprogramming has been shown to contribute to inflammation and is considered a hallmark of cancer, neurodegenerative diseases, and viral infections. Malfunctioning glycolysis, which normally aims to convert glucose into pyruvate, leads to the accumulation of advanced glycation end products (AGEs). Being aberrantly generated, AGEs then bind to their receptor, RAGE, and activate several pro-inflammatory genes, such as IL-1b and IL-6, thus, increasing hypoxia and inducing senescence. Using the lung epithelial cell (BEAS-2B) line, we demonstrated that SARS-CoV-2 proteins reprogram the cellular metabolism and increase pyruvate kinase muscle isoform 2 (PKM2). This deregulation promotes the accumulation of AGEs and senescence induction. We showed the ability of the PKM2 stabilizer, Tepp-46, to reverse the observed glycolysis changes/alterations and restore this essential metabolic process.
Keywords:
glycolysis; inflammation; metabolic reprogramming; mitochondria; RAGE; SARS-CoV-2; Tepp-46 1. Introduction
COVID-19 is a disease caused by SARS-CoV-2 infection claiming the lives of more than 6 million across the globe since late 2019/early 2020 [1]. Despite the efforts to prevent this infection and treat the disease, an increasing number of studies have reported a variety of post-COVID-19 sequelae (known as long COVID), wherein chronic inflammation is one of the prevalent, persistent symptoms (Figure 1) [2]. Although it is known that SARS-CoV-2 reprograms the metabolism in several cell types causing chronic inflammation [3,4], the molecular and cellular mechanisms of this metabolic reprogramming are not fully understood.
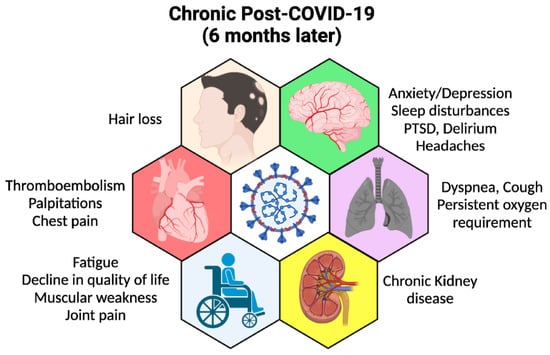
Figure 1.
Long COVID-19 or post-acute sequelae. Schematic representation of persistent symptoms post-acute COVID-19. The figure was created using the BioRender.com website accessed on 15 March 2022.
Metabolic Reprogramming is a phenomenon observed in cancer, viral infection, and neurodegenerative diseases [5,6,7,8,9], which results in the rewiring of the cellular metabolism to support the increasing energy demand. Cancer cells and viruses use this mechanism to synthesize free nucleotides and amino acids necessary for their assembly and replication [10,11].
During normal glycolysis, glucose is metabolized into pyruvate, transferred into the mitochondria, where it is catabolized in the tricarboxylic acid cycle (TCA) and fuels oxidative phosphorylation to generate large amounts of ATP [12]. Viruses and tumors can alter cellular metabolism and increase pyruvate conversion into lactate in the presence of oxygen, a phenomenon commonly referred to as the Warburg effect [13]. In addition, metabolic reprogramming can lead to the oxidation of glucose-6P into fructose-1,6P to be used in the pentose phosphate pathway. This pathway can generate nucleotides to be used in viral genome replication [14]. Metabolic reprogramming can also result in increased fructose-1,6P conversion into glyceraldehyde-3P and increased dihydroxyacetone (DHAP), which then accumulates and promotes the formation of advanced glycation end-products (AGEs), which are toxic to the cell [15].
One process that has been shown to contribute to metabolic reprogramming is the last step of glycolysis where phosphoenolpyruvate (PEP) is converted into pyruvate. The conversion of PEP to pyruvate is controlled by pyruvate kinase muscle isoform (PKM) [16]. PKM has two distinct isoforms, 1 or 2, where PKM1 has constitutively active enzymatic activity and PKM2 enzymatic activity is allosterically controlled [17]. PKM2 is enzymatically active in the tetrameric form; however, it is inactive while it exists as a monomer and dimer. The phosphorylation of PKM2 on the tyrosine residue 105 (Tyr105) inhibits tetramer formation of PKM2, causing the enzymatic activity to cease [18]. Inactivation of PMK2 creates a roadblock in glycolysis through the decreased conversion of PEP into pyruvate [19]. The accumulation of glycolytic intermediates can lead to the accumulation of AGEs [20]. Excessive AGEs can bind and thus activate the receptor of advanced glycation end products (RAGE) [21].
Named for the ability to bind AGEs, RAGE belongs to the pro-inflammatory pattern recognition receptors (PRRs) that are relevant to many types of inflammatory diseases [22]. RAGE is expressed in vascular cells, immune cells, neuronal cells, cardiomyocytes, adipocytes, glomerular epithelial cells, podocytes, and lung epithelial cells [23]. In addition to AGEs, several other ligands can bind to RAGE, including S100 proteins, high mobility group box1 (HMGB1), lysophosphatidic acid (LPA), amyloid-beta (Aβ), islet amyloid polypeptide (IAPP), and macrophage 1-antigen (Mac-1) [24]. The binding of RAGE to its ligand activates mitogen-activated protein kinase (MAPK) and NF-κB and induces the production of various pro-inflammatory cytokines (e.g., IL-6) [25]. RAGE exists in two forms, membrane-bound RAGE (mRAGE) and soluble RAGE (sRAGE). mRAGE is composed of three domains (extracellular, hydrophobic transmembrane, and cytoplasmic), while sRAGE contains only the extracellular domain [26]. sRAGE, found in plasma, can bind to secreted AGEs and acts as a decoy for mRAGE resulting in decreased mRAGE signaling and ultimately clearance of AGEs [27,28].
Increased AGE accumulation can lead to an overwhelming of sRAGE capability and results in reduced AGE sequestration. This sRAGE exhaustion causes more AGEs to bind to mRAGE resulting in increased pro-inflammatory cytokine production [29]. Excessive inflammation is detrimental, especially for patients who suffer from underlying conditions, such as diabetes, arthritis, and Chronic Obstructive Pulmonary Disease (COPD) [30]. sRAGE plasma levels have been identified as a possible prognosticator for SARS-CoV-2 mortality [31]. Therefore, examination of the functional connection between acute inflammation and the AGE/RAGE pathway-dependent metabolic reprogramming represents a significant and clinically relevant task.
Here, using BEAS-2B cells transfected with SARS-CoV-2 plasmids, we showed the ability of SARS-CoV-2 proteins to induce the AGE/RAGE pathway, providing a molecular basis for the persistence of long COVID-19 sequelae that manifest as chronic inflammation rendering the AGE/RAGE pathway as a possible therapeutic target against SARS-CoV-2 mortality.
2. Materials and Methods
2.1. SARS-CoV-2 Plasmids
pLVX-EF1alpha-eGFP-2XStrep-IRES-Puro
pLVX-EF1alpha-IRES-Puro
pLVX-EF1alpha-nCoV2019-E-2xStrep-IRES-Puro
pLVX-EF1alpha-nCoV2019-M-2xStrep-IRES-Puro
pLVX-EF1alpha-nCoV2019-N-2xStrep-IRES-Puro
pLVX-EF1alpha-nCoV2019-nsp1-2xStrep-IRES-Puro
pLVX-EF1alpha-nCoV2019-nsp2-2xStrep-IRES-Puro
pLVX-EF1alpha-nCoV2019-nsp4-2xStrep-IRES-Puro
pLVX-EF1alpha-nCoV2019-nsp5-2xStrep-IRES-Puro
pLVX-EF1alpha-nCoV2019-nsp7-2xStrep-IRES-Puro
pLVX-EF1alpha-nCoV2019-nsp8-2xStrep-IRES-Puro
pLVX-EF1alpha-nCoV2019-nsp9-2xStrep-IRES-Puro
pLVX-EF1alpha-nCoV2019-nsp10-2xStrep-IRES-Puro
pLVX-EF1alpha-nCoV2019-nsp11-2xStrep-IRES-Puro
pLVX-EF1alpha-nCoV2019-nsp12-2xStrep-IRES-Puro
pLVX-EF1alpha-nCoV2019-nsp13-2xStrep-IRES-Puro
pLVX-EF1alpha-nCoV2019-nsp15-2xStrep-IRES-Puro
pLVX-EF1alpha-nCoV2019-orf3a-2xStrep-IRES-Puro
pLVX-EF1alpha-nCoV2019-orf6-2xStrep-IRES-Puro
pLVX-EF1alpha-nCoV2019-orf7a-2xStrep-IRES-Puro
pLVX-EF1alpha-nCoV2019-orf8-2xStrep-IRES-Puro
pLVX-EF1alpha-nCoV2019-orf9b-2xStrep-IRES-Puro
pLVX-EF1alpha-nCoV2019-orf10-2xStrep-IRES-Puro
pLVX-EF1alpha-IRES-Puro_2xStrep-nCoV2019-nsp14
pLVX-EF1alpha-IRES-Puro_2xStrep-nCoV2019-orf3b
pLVX-EF1alpha-IRES-Puro_2xStrep-nCoV2019-orf7b
pLVX-EF1alpha-IRES-Puro_2xStrep-nCoV2019-orf9c
pGBW-m4134157 (nsp6 plasmid) was a gift from Ginkgo Bioworks & Benjie Chen (Addgene plasmid # 152062; http://n2t.net/addgene:152062 accessed on 21 July 2020; RRID:Addgene_152062). All other plasmids were a gift from the Nevan Krogan Lab, UCSF, San Francisco, CA, USA.
2.2. Cell Culture and Transfection
Lungs cells (BEAS-2B) were maintained at 37 °C in Dulbecco’s modified Eagle’s medium (DMEM) (Cellgro, Manassas, VA, USA) with 2% fetal bovine serum (FBS), 100 units/mL of penicillin, 100 μg/mL of streptomycin. The cells were transfected with 1 μg of the empty vector or the SARS-CoV-2-expression plasmids (described above) [32] using Lipofectamine 3000 (Invitrogen, Carlsbad, CA, USA) as recommended by the manufacturer. Briefly, 0.75 µL of Lipofectamine 3000 Reagent was diluted into 25 µL of Opti-MEM medium and 1 µg of plasmids were diluted into 50 µL of Opti-MEM medium with 10 µL of P3000 Reagent added. The diluted DNA was then added to the diluted Lipofectamine 3000 Reagent and allowed to incubate for 15 min at room temperature. After incubation, the mixture was then added to the cells.
2.3. Chemical Reagents
Tepp-46 (ML-265) is a selective pyruvate kinase M2 (PKM2) tetramer stabilizer [33]. Transfected BEAS-2B cells were treated with 10 nM of Tepp-46 (purchased from VWR, Radnor, PA, USA) for four hours before downstream assays and measurements were conducted.
2.4. Western Blot Assay
Proteins were extracted from cell pellets using a radioimmunoprecipitation assay (RIPA) lysis buffer (25 mM Tris-HCl pH 7.6, 150 mM NaCl, 1% Triton x-100, 0.1% SDS, and 1x protease inhibitor cocktail). Estimation of protein concentrations was performed using bicinchoninic acid (BCA) assay (Thermo Fisher Scientific, Waltham, MA, USA). Protein samples are prepared in Laemmli buffer, and Western blot was performed using 20 μg of protein per well using polyacrylamide gels. The gels were then transferred to nitrocellulose membranes, rinsed for 10 min 3 times for 10 min each time, and blocked in 10% milk for 20 min. Primary antibodies were diluted in 5% milk and allowed to incubate at 4 °C overnight. The next day, the membrane was rinsed again in TBST for 10 min 3 times and secondary antibodies were added, diluted in 5% milk, for 1 h. Imaging was performed using a Thermo Fisher iBright imaging system. Antibodies and concentrations used are as follows: PKM2 (1/1000; D78A4), PTBP1 (1/1000; 12582-1-Ap), NF-κB-p65 (1/1000; C-20; sc-372), secondary anti-mouse (1/5000; 71045-3), secondary anti-rabbit (1/10000; AP187P) [Sigma-Aldrich, St. Louis, MO, USA], and H3 (0.5 μg/mL; A01502) [GenScript, Piscataway, NJ, USA]. ImageJ was used to determine the densitometry ratios of the bands. Western blot loading was normalized to the loading control, H3.
2.5. RNA Extraction
Global RNA was extracted using the Absolutely RNA Miniprep kit (Agilent Technologies, Santa Clara, CA, USA, 400800). The purity and concentration of extracted RNA were determined using a NanoDrop 2000 spectrophotometer (Thermo Scientific, Waltham, MA, USA).
2.6. qPCR Assay
cDNA was synthesized from isolated RNA using SuperScript IV VILO cDNA Master Mix with ezDNase (Invitrogen, Waltham, MA, USA, 11766050). Briefly, for each reaction, 4 µL of SuperScript IV VILO master mix was mixed with 2.5 µg of RNA and then diluted with water to reach 20 µL. The samples were then incubated for 10 min at 25 °C, then 10 min at 50 °C, and finally for 5 min at 85 °C. The following primers (purchased from IDT) were used: HIF-1α: (F) 5′-gaacgtcgaaaagaaaagtctcg-3′; (R) 5′-ccttatcaagatgcg aactcaca-3′. PTBP1: (F) 5′-aatgacaagagccgtgactac-3′; (R) 5′-ggaaccagctcctgcatac-3′. PKM1: (F) 5′-cgagcctcaagtcactccac-3′; (R) 5′-acgacgtcaccccggtattagc-3′. PKM2: (F) 5′-attatttgagga actccgccgcct-3′; (R) 5′-attccgggtcacagcaatgatgg-3′. IL-1β: (F) 5′-tacctgtcctgcgtgttgaa-3′; (R) 5′-tctttgggtaatttttgggatct-3′. IL8: (F) 5′-agacagcagagcacacaagc-3′; (R) 5′-atggttccttccggtggt-3′. RAGE: (F) 5′-gggcagtagtaggtgctcaa-3′; (R) 5′-tccggcctgtgttcagtttc-3′. GAPDH: (F) 5′-caaggctgagaacgggaag-3′; (R) 5′-tgaagacgccagtggactc-3′. qPCR was performed using FastStart Universal SYBR Green (Roche, Basel, Switzerland, 04913914001), and all reactions were performed according to the manufacturer’s instructions. Briefly, 25 µL of FastStart Universal SYBR Green Master mix was mixed with 300 nM of both forward and reverse primers and water to bring reaction to 45 µL, then 50 ng (5 µL) of cDNA was added. The reaction was performed on a ThermoFisher thermal cycler. The relative quantitation of mRNA was performed using the comparative ∆∆Ct method. The results were then compared to those of the control group and endogenous control, GAPDH.
2.7. Seahorse Mito Stress Test
After transfection with SARS-CoV-2 plasmids, changes in oxygen consumption were analyzed using the XFe96 Seahorse Analyzer (Agilent Technologies, Santa Clara, CA, USA). BEAS-2B cells were split onto an XFe96-well microplate and were cultured overnight. On the day of the experiment, the growth medium was replaced with an XF assay medium containing DMEM supplemented with 10 mM glucose, 4 mM l-glutamine, and 2 mM sodium pyruvate. The cells were then placed in an incubator set at 37 °C without CO2. Extracellular acidification rate (ECAR) and oxygen consumption rate (OCR) measurements were made following the manufacturer’s recommendations and took place at basal conditions and in response to 1 μM Oligomycin, 1.5 μM FCCP, and 1 μM rotenone/1 μM antimycin A [34].
2.8. Pyruvate Assay
Pyruvate production was conducted using a fluorometric Pyruvate Assay Kit (Cayman Chemical, Ann Arbor, MI, USA, C789C04). BEAS-2B cells were transfected with SARS-CoV-2 plasmids as above and treated with Tepp-46 for 8 h. After 8 h, the cells were collected, and the assay was carried out according to the manufacturer’s protocol. Briefly, cell pellets were collected and rinsed in 1 mL of PBS and centrifuged at 10,000× g for 5 min, and the supernatant was removed from the cell pellet. Then, 0.5 mL of 0.25 M MPA was added to the cell pellet, vortexed for 30 s, and placed on ice for 5 min. After 5 min, the samples were centrifuged at 10,000× g for 5 min, and the supernatant was removed. To the supernatant, 25 µL of potassium carbonate was added. The samples were then centrifuged again at 10,000× g for 5 min, and then the supernatant was diluted 1:2 with Assay Buffer. Then, 20 µL of the samples were added to a 96-well plate along with 50 µL of Assay Buffer, 50 µL of Cofactor Mixture, and 10 µL of Fluorometric Detector. The reaction was then initiated by adding 20 µL of Enzyme Mixture to each well and allowed to incubate for 20 min at room temperature. The plate was read on a plate reader using an excitation wavelength between 530 and 540 nm and an emission wavelength between 585 and 595 nm. Pyruvate results were normalized to each sample’s cell count. Pyruvate concentration was calculated by comparison to the standard curve and using the formula pyruvate (µM) = [(CF-y-intercept)/slope] × 2 × sample dilution.
2.9. Human Advanced Glycation End-Products (AGEs) ELISA
Advanced glycation end-product (AGE) concentrations were determined using the Immunotag Human AGEs ELISA kit (G biosciences, St. Louis, MO, USA, cat# IT1931). The ELISA is reactive to human AGE including Nε-Carboxy-methyl-lysine (CML) and Nε-carboxy-ethyl-lysine (CEL). The ELISA assay was performed according to the manufacturer’s protocol. Briefly, BEAS-2B cells were transfected with SARS-CoV-2 plasmids and treated with or without Tepp-46 for 8 h. The cells were then collected and centrifuged (800× g) for 5 min. The supernatant was then removed, and 100 μL of RIPA buffer with added protease inhibitors was then added to the cell pellet and rotated at 4 °C for an hour. The ELISA plate was prepared following the manufacturer’s protocol. The samples were diluted at 1:5 using the provided Sample Dilution buffer. The diluted samples were added to the ELISA plate and incubated at 37 °C for 90 min. After incubation, the provided biotin detection antibody was added to the plate. The plate was then incubated again for 60 min at 37 °C. After 60 min, the HRP-Streptavidin Conjugate was added to the plate and incubated again at 37 °C for 30 min. The provided TMB Substrate was then added to the plate and incubated in the dark at 37 °C for 15 min. After determining that the reaction achieved optimal levels by using the color of the standard curve wells, the Stop Solution was added to end the reaction. The plate was then read at 450 nm. Concentrations were derived using the standard curve, then the samples were normalized to dilution factor and cell count.
2.10. Cell Senescence Staining
Senescence was evaluated using a β-galactosidase cell staining kit (Cell Signaling, Danvers, MA, USA) as recommended by the manufacturer. Briefly, BEAS-2B cells were cultured in 3.5 cm dishes were rinsed, fixed with 1 × fixative solution for 15 min, and washed twice with PBS. β-galactosidase staining solution (930 μL 1 × staining solution with 10 μL supplement A, 10 μL supplement B, and 50 μL 20 mg/mL X-gal in DMF) was added, and the cells were incubated at 37 °C without CO2 overnight. Images were taken with a Nikon LED microscope the following day, as previously described [35]. Experiments were repeated two times.
2.11. Immunofluorescence Staining and Confocal Microscopy
BEAS-2B cells transfected with SARS-CoV-2 plasmids were plated on glass coverslips and allowed to grow overnight. The cells were then fixed in 4% formaldehyde in PBS solution for 20 min. The cells were then washed in PBS, and 0.2% Triton x100 was used to permeabilize the cells. Afterward, the cells were incubated with anti-GOLGA/GM130 antibody (1/350, Proteintech, Rosemont, IL, USA, 11308-1-AP) overnight at 4 °C. Cells were washed twice with 0.1% PBST and then incubated in Alex Fluor 488-conjugated AffiniPure Goat Anti-Rabbit IgG(H + L) for at least 1 h. Images of fluorescent staining were taken on a confocal microscope (Leica, Wetzlar, Germany). The fluorescence intensity of GOLGA/GM130 was determined by background subtraction and using a fixed threshold in ImageJ. The experiment was performed following the protocol previously described [36].
2.12. Statistical Analysis
All statistical analyses were performed using either one-way analysis of variance (ANOVA) or a Student’s t-test. Data are displayed as the mean with ±1 standard deviation (S.D.). Results were identified as statistically significant if p < 0.05 (marked in the figures as * p < 0.05; ** p < 0.01; *** p < 0.001; **** p < 0.0001 where needed). Data were plotted using GraphPad Prism version 7.0.
3. Results
3.1. SARS-CoV-2 Proteins Disrupt the OCR
First, we sought to determine if SARS-CoV-2 proteins spike, envelope (Env), or all SARS-CoV-2 proteins except the membrane protein (All), disrupt mitochondrial oxygen consumption. We measured the oxygen consumption rate (OCR) (Figure 2A) and the extracellular acidification rate (ECAR) (Figure 2B) using a Seahorse Mito Stress Test. The spike protein but not the envelope protein was able to disrupt the oxygen consumption rate when compared to the control BEAS-2B cells (Figure 2A). In addition, the combination of all the proteins also led to the disruption of mitochondrial-associated oxygen consumption (yellow line) (Figure 2A). Furthermore, the BEAS-2B cells expressing all the SARS-CoV-2 proteins, and the cells expressing the spike protein alone decreased the OCR associated with maximal respiration. The decrease in OCR is representative of decreased ability of cellular respiration through the electron transport chain and ultimately decreased oxidative phosphorylation. Decreases in OCR are indicative of mitochondrial damage and reduced substrate availability to enter the TCA cycle [37]. In addition, the cells transfected with the combination of all the SARS-CoV-2 proteins and the spike protein also result in a decrease in the spare respiration capacity, when compared to the control untreated cells (Figure 2C,D). The spare respiration capacity is the difference between the capacities at maximum respiration and basal respiration. The decrease in spare respiration capacity also further indicates the lack of substrates to enter the TCA cycle [38].
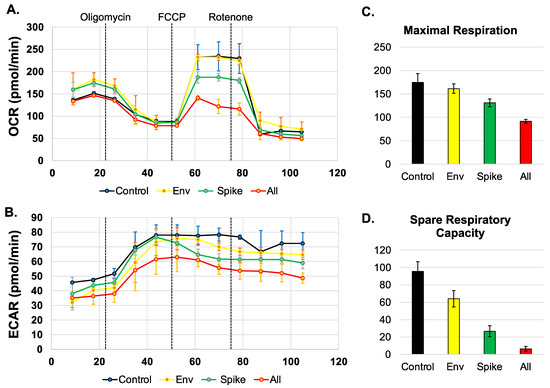
Figure 2.
SARS-CoV-2 proteins alter mitochondrial maximal respiration. (A,B). Measurement of oxygen consumption rate (OCR) and extracellular acidification rate (ECAR) in BEAS-2B cells untreated or transfected with SARS-CoV-2 proteins for 48 h using a Seahorse XFe96 analyzer and a Mito stress test kit from Seahorse. Oligomycin, FCCP, and rotenone/antimycin (arrows) were added at 23, 50, and 75 min, respectively. (C,D). Graphs displaying the maximal respiration and spare capacity measured (pmol/min).
3.2. SARS-CoV-2 Increases PKM2 over PKM1
Decreased OCR indicates altered glycolysis and reduced pyruvate production [39]. Based on our observations and the literature, many viruses can alter the glycolysis pathway at the last step of glycolysis [40]. The last step is the conversion of phosphoenolpyruvate (PEP) into pyruvate and is performed by the pyruvate kinase enzyme, which has four isoforms including kinase muscle isoforms 1 and 2 (PKM1 and PKM2). PKM1 and PKM2 are the dominant isoforms of PKM that are found in most tissues [41]. The polypyrimidine tract-binding protein 1 (PTBP1) is important for splicing PKM into the PKM2 isoform over PKM1 [42,43]. Therefore, using BEAS-2B cells which produce a combination of all the SARS-CoV-2 DNA except the membrane protein, we determined the expression levels of PTBP1 and PKM2 proteins through a Western blot assay using anti-PTBP1 and -PKM2 antibodies. The production of SARS-CoV-2 proteins led to an increase in the expression of PTBP1 and PKM2 proteins (Figure 3A,B). The SARS-CoV-2 Env protein failed to affect the mitochondrial oxygen consumption rate (Figure 2A); however, it did upregulate the expression of both PTBP1 and PKM2 proteins (Figure 3A,B).
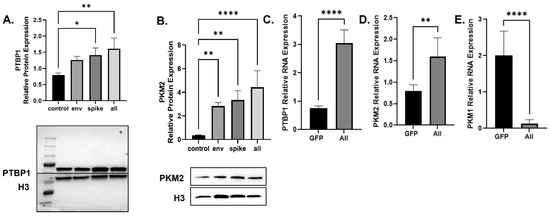
Figure 3.
Changes in Proteins Responsible for Metabolic Reprogramming. Expression of PTBP1 (A) and PKM2 (B) proteins isolated from untreated or BEAS-2B transfected as indicated. Quantification of the relative protein levels was determined from the band intensity using ImageJ software and normalized relative to the H3. PTBP (C), PKM1 (D), and PKM2 (E) mRNA expression was obtained by qPCR using BEAS-2B transfected with all SARS-CoV-2 plasmids except for the membrane. Bar graphs represent the means ± S.D. of at least two independent experiments. Data represent the mean ± S.D. Results were judged statistically significant by ANOVA (* p < 0.05; ** p < 0.01; **** p < 0.0001).
In addition, mRNA was extracted and subjected to qPCR to measure the expression levels of the indicated factors. As shown, transfection of the cells with SARS-CoV-2 plasmids led to increased mRNA expression of PTBP1 and PKM2 (Figure 3C,D). The SARS-CoV-2 proteins also decreased the expression of PKM1 mRNA (Figure 3E). The increase in PTBP1 and PKM2 due to the SARS-CoV-2 proteins indicates viral-associated metabolic reprogramming resulting in increased glycolysis that stalls at the final step resulting in reduced pyruvate production but increased glycolytic intermediates [44].
3.3. Tepp-46 Reverses the Effect of the SARS-CoV-2 Protein
The increase in PTBP1 and PKM2 due to the SARS-CoV-2 proteins indicates viral-associated metabolic reprogramming resulting in increased glycolysis that stalls at the final step resulting in reduced pyruvate production but increased glycolytic intermediates.
Since PKM2 enzymatic activity depends on what confirmation it is in, dimer or tetramer, depending on allosteric controls, we set out to determine if PKM2 confirmation plays a role in the metabolic reprogramming of BEAS cells due to SARS-CoV-2 proteins. To do this, we used a known pharmaceutical PKM2 tetramer stabilizer, Tepp-46. Hence, we measured the concentration of intercellular pyruvate in BEAS-2B cells producing SARS-CoV-2 proteins as indicated. As expected, the production of SARS-CoV-2 proteins led to decreased concentration of internal pyruvate (Figure 4A), indicating that the PEP conversion into pyruvate is altered due to the increased expression of PKM2. The decreased conversion of PEP into Pyruvate, and the increase in PKM2 expression, suggest that PKM2 is in the non-enzymatic dimer configuration and is causing increased glycolysis and the accumulation of glycolytic intermediates [44,45].
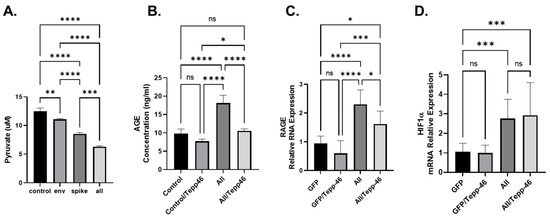
Figure 4.
(A). Concentration of intercellular pyruvate in BEAS-2B cells transfected with SARS-CoV-2 plasmids as indicated (Envelope (Env.), Spike, or All (all SARS-CoV-2 plasmids except for the membrane). (B). Cellular concentration of AGEs (ng/mL) was measured by ELISA using BEAS-2B transfected with all SARS-CoV-2 plasmids except for the membrane. (C,D). mRNA expression of RAGE and HIF-1α. mRNA measured by qPCR using BEAS-2B transfected with all SARS-CoV-2 plasmids except for the membrane. Results were judged statistically significant by ANOVA (ns = not significant; * p < 0.05; ** p < 0.01; *** p < 0.001; **** p < 0.0001).
We have previously shown in neurons that have undergone viral metabolic reprogramming due to HIV-1 gp120 that Tepp-46 can reverse the increased glycolysis and decrease the TCA cycle due to the increase in PKM2 dimers [45]. Furthermore, the decreased conversion of PEP into Pyruvate along with the increase in PKM2 expression suggests that PKM2 is in the non-enzymatic dimer configuration.
3.4. SARS-CoV-2 Viral Proteins Result in Increased Advanced Glycation End-Products (AGEs)
Recently, it has been shown that metabolic reprogramming due to viruses’ infection can result in increased glycolysis and decreased TCA cycle and increases the production of advanced glycation end-products (AGEs) [46]. AGES can be formed spontaneously from increased glycolytic intermediates and oxidative stress [47]. We have previously shown that the increase in AGEs can be attributed to the increase in PKM2 in neurons that have been exposed to HIV-1 viral protein gp120 [44]. To explore if SARS-CoV-2 proteins have a similar increase in AGEs, we transfected BEAS cells with the complete array of viral plasmids except for the membrane plasmid. In the cells transfected with the SARS-CoV-2 plasmids, we observed an increase in the concentration of AGEs, specifically Nε-Carboxy-methyl-lysine (CML) and Nε-carboxy-ethyl-lysine (CEL) (Figure 4B). CML and CEL both have previously been shown to bind to RAGE and induce inflammation and have been linked to many metabolic reprograming related diseases [48]. In the BEAS cells transfected with the combination of SARS-CoV-2 plasmids, we also show that the addition of Tepp-46 reverses AGEs accumulation, indicating that Tepp-46 favors the formation of the tetrameric form of PKM2 and reduces the glycolytic intermediates required to spontaneously produce AGEs resulting in reduced AGE accumulation (Figure 4B).
AGEs can bind to mRAGE and create a positive feedback loop resulting in increased RAGE transcription [48]. The forward feedback loop would result in increased RAGE production and would contribute to increased RAGE signaling resulting in compounded increased inflammation. To validate this, we first examined whether the addition of viral plasmids activates this pathway. BEAS-2B cells were transfected with SARS-CoV-2 plasmids for 48 h, then subjected to Western blot analysis. The transfection of BEAS-2B cells with the SARS-CoV-2 plasmids increases the expression level of RAGE RNA (Figure 4C). Treatment of the cells with Tepp-46 modestly reversed the effect of SARS-CoV-2 proteins on RAGE RNA (Figure 4C).
Finally, HIF-1a has been shown to increase PTBP1 expression and increase the splicing of PKM2 over PKM1 [45]. We observe that the SARS-CoV-2 proteins increase the expression of HIF-1a, and we also show that Tepp-46 fails to modify the expression levels of HIF-1a (Figure 4E). Since HIF-1a is upstream of PKM2 conformation and not affected by the enzymatic activity of PKM2, it makes sense that Tepp-46 did not affect these factors.
3.5. SARS-CoV-2 Proteins Induce Cytokines and Promote Cell Senescence
AGEs can bind to mRAGE, leading to the production of several pro-inflammatory cytokines [49]. The binding of RAGE to its ligand AGEs activates the NF-kB pathway leading to the activation of several pro-cytokines [50]. To validate this hypothesis, we first examined whether the addition of the viral proteins activates this pathway. BEAS-2B cells were transfected with several SARS-CoV-2 plasmids for 48 h, then subjected to Western blot analysis using an anti-p65 antibody (p65 is one of the five components that form the NF-κB). As shown in Figure 5A. the addition of SARS-CoV-2 proteins increases the expression levels of p65 in these cells compared to the untransfected control.
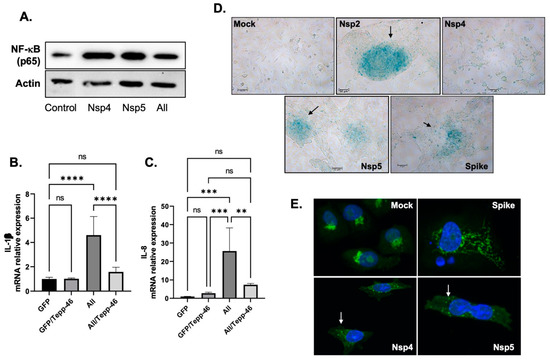
Figure 5.
Persistence of Inflammation. (A). Expression of p65 subunit of NF-kB proteins isolated from untreated or BEAS-2B transfected as indicated by Western blot analysis. (B,C). mRNA expression of IL-1β and IL-8 as obtained by qPCR using BEAS-2B transfected then treated with 10 nM of Tepp-46 as indicated. Results were judged statistically significant by ANOVA (ns = not significant; ** p < 0.01; *** p < 0.001; **** p < 0.0001). (D), Nsp2, Nsp4 (modest), Nsp5, and the Spike proteins promote senescence in BEAS-2B as obtained using β-gal assay compared to the Mock untransfected control. (E). The addition of Nsp4 and NNsp5 to BEAS-2B causes a strong Golgi apparatus fragmentation compared to the Mock or the spike alone.
Next, we measured the expression levels of IL-1β and IL-8 mRNA in BEAS-2B cells transfected for 44 h with SARS-CoV-2 plasmids in the presence and absence of Tepp-46. As shown in Figure 5B,C, expression levels of IL-1β and IL-8 increased in SARS-CoV-2-treated proteins and decreased with the addition of Tepp-46. These results confirm the hypothesis that SARS-CoV-2 depends on PKM2 to induce pro-inflammatory cytokines through the activation of RAGE and the accumulation of AGEs. Stabilizing PKM2 reverses this effect and lowers the inflammation.
We also sought to determine whether the induction of pro-inflammatory cytokines can promote cell senescence. BEAS-2B cells were transfected with SARS-CoV-2 proteins for 48 h, and then a beta-galactosidase assay was performed. Indeed, these proteins induce cell senescence, as displayed in Figure 5D.
Senescence is known to enhance the secretion of proteins that promote inflammation, and since it has been shown that the Golgi complex regulates this secretion [50], we examined the status of Golgi in these cells. Moreover, the structure of the Golgi complex is altered in senescent cells [50]. As shown in Figure 5E, the addition of SARS-CoV-2 proteins causes the fragmentation of the Golgi apparatus. These results gave the rationale to conclude that SARS-CoV-2/COVID-19 causes long-term sequelae, especially persistent inflammation through the activation of the AGE/RAGE pathway.
4. Discussion
Even after its clearance, SARS-CoV-2/COVID-19 sequelae persist for several months and could negatively affect the patients’ daily life (Figure 1). Seventy different systemic organ-specific disorders were identified to be associated with post-COVID-19 symptoms [51]. The mechanisms involved are not fully understood; however, most clinicians and researchers agree that inflammation is the number one reason for these long-term sequelae followed by the induction of hypoxia [52,53,54,55]. Both inflammation and hypoxia are the results of metabolic reprogramming (MR) caused by the virus and persist in patients, especially those with underlying diseases.
The molecular and cellular mechanisms leading to chronic inflammation remain unclear, and the cellular factor(s) implicated in the persistence of inflammation are also unknown. We hypothesize that SARS-CoV-2 mimics other viruses in reprogramming the metabolism resulting in chronic inflammation [55]. Several labs described that SARS-CoV-2 reprograms the metabolism to aid in viral replication [56,57,58].
We found that the virus changes the metabolism and induces pro-inflammatory cytokines through a pathway involving AGEs and the RAGE receptor. We also demonstrated that the viral proteins alter the glycolysis pathway resulting in increased glycolytic intermediates and decreased pyruvate. This phenomenon has a precedent where viruses use this pathway to replicate [46]. Studies showed that HCV deregulates the mitochondria, promotes HIF-1α, and activates the glycolysis pathway [59]. Additionally, cells infected with the human cytomegalovirus (CMV) showed increased glycolysis and disrupted TCA [60]. Similar events were observed in B-cells infected with EBV [61] or T-cells infected with HTLV-1 [62]. We demonstrated that HIV-1 gp120 protein causes comparative symptoms in neurons [44]. We also showed that metabolic reprogramming is composed of seven hallmarks, and any disruption of these hallmarks can lead to the accumulation of RAGEs and chronic inflammation; however, the role of RAGE remains understudied [46].
RAGE was described to be elevated in SARS-CoV-2-infected patients and to play a role in chronic infection associated with COVD-19 [63]. RAGE was also classified among the 40 markers pointing to damaged organs in SARS-CoV-2-infected patients [64]. We found that the addition of Tepp-46 reverses the effect of the viral proteins. These results confirm that the viral proteins deregulate the glycolysis pathway and result in the formation of the dimeric form of PKM2. Monomeric or dimeric PKM2 prevents the conversion of PEP into pyruvate and alters the TCA cycle. The persistence of these symptoms increases the inflammation and may cause cell death.
Hence, to escape death, the cells stop dividing and enter a passive state, senescence, where additional factors involved in inflammation are secreted. These factors are secreted either by the mitochondria and known as senescence-associated secreted phenotype (SASP) or through the activation of the AGEs/RAGE pathway. This causes the fragmentation of the Golgi apparatus because the Golgi regulates the secretion of SASP [50]. The data presented in Figure 5 confirmed this hypothesis.
Understanding the mechanisms leading to RAGEs’ activation and chronic inflammation (Figure 6) permit the identification of new therapies to prevent long-term COVID-19 sequelae [65]. The AGE/RAGE pathway presents a possible pharmaceutical target to reduce inflammation in general and mortality due to COVID-19.
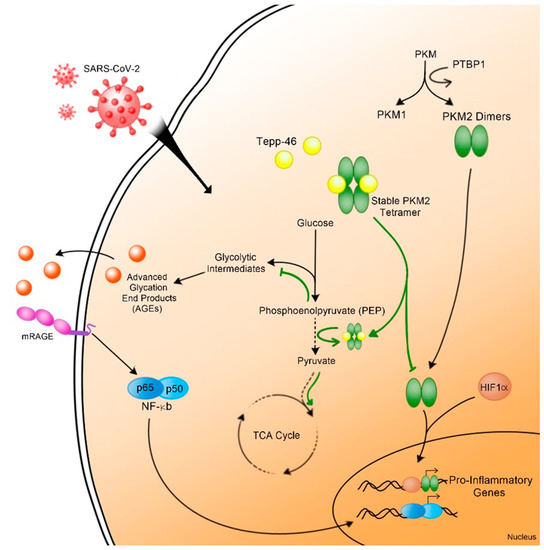
Figure 6.
Schematic representation of metabolic reprograming leading to RAGE signaling and inflammation pathways in post-acute COVID-19 (black arrows). PKM2 stabilizer, Tepp-46, reverses this metabolic reprogramming and inhibits RAGE signaling (green arrows).
Author Contributions
C.N.S.A. and M.S. designed and performed the studies and wrote the manuscript. L.J.G., M.H. and M.D.L. helped with the experiments. S.P.A. made the figures. N.S. provided reagents and helped edit the manuscript. B.E.S. directed/supervised, designed, and wrote the manuscript. All authors have read and agreed to the published version of the manuscript.
Funding
This work is supported by an NIH-NIA grant AG054411 and by previous NIH grants NS076402 and MH093331 awarded to BES. This work was also supported by the New Jersey Health Foundation (NJHF) grant PC13-21CV and the Osteopathic Heritage Foundation grant 67294, both awarded to NS.
Data Availability Statement
All processed data are included in this manuscript. Raw data, further information, or reagents contained within the manuscript are available upon request from the corresponding author, Bassel E Sawaya, sawaya@temple.edu.
Acknowledgments
The authors would like to thank the Lab of Walter Koch (Temple University) for the access to the Seahorse equipment.
Conflicts of Interest
The authors declare that the research was performed in absence of any financial relationships and has no potential conflict of interest.
References
- World Health Organization. Who Coronavirus (COVID-19) Dashboard; World Health Organization: Geneva, Switzerland, 2022; Available online: https://covid19.who.int/ (accessed on 30 March 2022).
- Mehandru, S.; Merad, M. Pathological sequelae of long-haul COVID. Nat. Immunol. 2022, 23, 194–202. [Google Scholar] [CrossRef] [PubMed]
- Xiao, N.; Nie, M.; Pang, H.; Wang, B.; Hu, J.; Meng, X.; Li, K.; Ran, X.; Long, Q.; Deng, H.; et al. Integrated cytokine and metabolite analysis reveals immunometabolic reprogramming in COVID-19 patients with therapeutic implications. Nat. Commun. 2021, 12, 1618. [Google Scholar] [CrossRef] [PubMed]
- Li, S.; Ma, F.; Yokota, T.; Garcia, G., Jr.; Palermo, A.; Wang, Y.; Farrell, C.; Wang, Y.-C.; Wu, R.; Zhou, Z.; et al. Metabolic reprogramming and epigenetic changes of vital organs in SARS-CoV-2–induced systemic toxicity. JCI Insight 2021, 6, e145027. [Google Scholar] [CrossRef]
- Han, R.; Liang, J.; Zhou, B. Glucose Metabolic Dysfunction in Neurodegenerative Diseases—New Mechanistic Insights and the Potential of Hypoxia as a Prospective Therapy Targeting Metabolic Reprogramming. Int. J. Mol. Sci. 2021, 22, 5887. [Google Scholar] [CrossRef] [PubMed]
- Chen, Y.; Ning, J.; Cao, W.; Wang, S.; Du, T.; Jiang, J.; Feng, X.; Zhang, B. Research Progress of TXNIP as a Tumor Suppressor Gene Participating in the Metabolic Reprogramming and Oxidative Stress of Cancer Cells in Various Cancers. Front. Oncol. 2020, 10, 568574. [Google Scholar] [CrossRef]
- Ganesh, G.V.; Mohanram, R.K. Metabolic reprogramming and immune regulation in viral diseases. Rev. Med. Virol. 2021, 32, e2268. [Google Scholar] [CrossRef]
- Cassina, P.; Miquel, E.; Martínez-Palma, L.; Cassina, A. Glial Metabolic Reprogramming in Amyotrophic Lateral Sclerosis. Neuroimmunomodulation 2021, 28, 204–212. [Google Scholar] [CrossRef] [PubMed]
- Lu, J.; Zhou, W.; Dou, F.; Wang, C.; Yu, Z. TRPV1 sustains microglial metabolic reprogramming in Alzheimer’s disease. EMBO Rep. 2021, 22, e52013. [Google Scholar] [CrossRef]
- Sun, L.; Zhang, H.; Gao, P. Metabolic reprogramming and epigenetic modifications on the path to cancer. Protein Cell 2021, 1–43. [Google Scholar] [CrossRef]
- Polcicova, K.; Badurova, L.; Tomaskova, J. Metabolic reprogramming as a feast for virus replication. Acta Virol. 2020, 64, 201–215. [Google Scholar] [CrossRef]
- Kubicka, A.; Matczak, K.; Łabieniec-Watała, M. More Than Meets the Eye Regarding Cancer Metabolism. Int. J. Mol. Sci. 2021, 22, 9507. [Google Scholar] [CrossRef] [PubMed]
- Vander Heiden, M.G.; Cantley, L.C.; Thompson, C.B. Understanding the Warburg Effect: The Metabolic Requirements of Cell Proliferation. Science 2009, 324, 1029–1033. [Google Scholar] [CrossRef] [PubMed]
- Bojkova, D.; Costa, R.; Bechtel, M.; Ciesek, R.; Michaelis, M.; Cinatl, J., Jr. Targeting pentose phosphate pathway for SARS-CoV-2 therapy. Metabolites 2021, 11, 699. [Google Scholar] [CrossRef] [PubMed]
- Chaplin, A.K.; Chernukhin, I.; Bechtold, U. Profiling of advanced glycation end products uncovers abiotic stress-specific target proteins in Arabidopsis. J. Exp. Bot. 2018, 70, 653–670. [Google Scholar] [CrossRef] [PubMed]
- Puckett, D.L.; Alquraishi, M.; Chowanadisai, W.; Bettaieb, A. The Role of PKM2 in Metabolic Reprogramming: Insights into the Regulatory Roles of Non-Coding RNAs. Int. J. Mol. Sci. 2021, 22, 1171. [Google Scholar] [CrossRef] [PubMed]
- Gupta, V.; Bamezai, R.N. Human pyruvate kinase M2: A multifunctional protein. Protein Sci. 2010, 19, 2031–2044. [Google Scholar] [CrossRef] [PubMed]
- Boschert, V.; Teusch, J.; Müller-Richter, U.D.A.; Brands, R.C.; Hartmann, S. PKM2 Modulation in Head and Neck Squamous Cell Carcinoma. Int. J. Mol. Sci. 2022, 23, 775. [Google Scholar] [CrossRef]
- Satyanarayana, G.; Turaga, R.C.; Sharma, M.; Wang, S.; Mishra, F.; Peng, G.; Deng, X.; Yang, J.; Liu, Z.-R. Pyruvate kinase M2 regulates fibrosis development and progression by controlling glycine auxotrophy in myofibroblasts. Theranostics 2021, 11, 9331–9341. [Google Scholar] [CrossRef]
- Yumnamcha, T.; Guerra, M.; Singh, L.P.; Ibrahim, A.S. Metabolic Dysregulation and Neurovascular Dysfunction in Diabetic Retinopathy. Antioxidants 2020, 9, 1244. [Google Scholar] [CrossRef]
- Monu; Agnihotri, P.; Biswas, S. AGE/Non-AGE Glycation: An Important Event in Rheumatoid Arthritis Pathophysiology. Inflammation 2021, 45, 477–496. [Google Scholar] [CrossRef]
- Kerkeni, M.; Gharbi, J. RAGE receptor: May be a potential inflammatory mediator for SARS-CoV-2 infection? Med. Hypotheses 2020, 144, 109950. [Google Scholar] [CrossRef] [PubMed]
- Riehl, A.; Németh, J.; Angel, P.; Hess, J. The receptor RAGE: Bridging inflammation and cancer. Cell Commun. Signal. 2009, 7, 12. [Google Scholar] [CrossRef] [PubMed]
- Ramasamy, R.; Shekhtman, A.; Schmidt, A.M. The multiple faces of RAGE—Opportunities for therapeutic intervention in aging and chronic disease. Expert Opin. Ther. Targets 2015, 20, 431–446. [Google Scholar] [CrossRef] [PubMed]
- Wu, Q.; Feng, Y.; Ouyang, Y.; Liang, Y.; Zhao, K.; Wang, Y.; Luo, Q.; Xiao, J.; Feng, N.; Zhou, M. Inhibition of advanced glycation endproducts formation by lotus seedpod oligomeric procyanidins through RAGE-MAPK signaling and NF-κB activation in high-AGEs-diet mice. Food Chem. Toxicol. 2021, 156, 112481. [Google Scholar] [CrossRef]
- Gopal, P.; Gosker, H.R.; Theije, C.C.; Eurlings, I.M.; Sell, D.R.; Monnier, V.M.; Reynaert, N.L. Effect of chronic hypoxia on RAGE and its soluble forms in lungs and plasma of mice. Biochim. Biophys. Acta 2015, 1852, 992–1000. [Google Scholar] [CrossRef] [PubMed][Green Version]
- Senatus, L.; MacLean, M.; Arivazhagan, L.; Egaña-Gorroño, L.; López-Díez, R.; Manigrasso, M.B.; Ruiz, H.H.; Vasquez, C.; Wilson, R.; Shekhtman, A.; et al. Inflammation Meets Metabolism: Roles for the Receptor for Advanced Glycation End Products Axis in Cardiovascular Disease. Immunometabolism 2021, 3, e210024. [Google Scholar] [CrossRef]
- Xu, L.; Wang, Y.-R.; Li, P.-C.; Feng, B. Advanced glycation end products increase lipids accumulation in macrophages through upregulation of receptor of advanced glycation end products: Increasing uptake, esterification and decreasing efflux of cholesterol. Lipids Health Dis. 2016, 15, 161. [Google Scholar] [CrossRef]
- Pratte, K.A.; Curtis, J.L.; Kechris, K.; Couper, D.; Cho, M.H.; Silverman, E.K.; DeMeo, D.L.; Sciurba, F.C.; Zhang, Y.; Ortega, V.E.; et al. Soluble receptor for advanced glycation end products (sRAGE) as a biomarker of COPD. Respir. Res. 2021, 22, 127. [Google Scholar] [CrossRef]
- Hughes, M.J.; McGettrick, H.M.; Sapey, E. Shared mechanisms of multimorbidity in COPD, atherosclerosis and type-2 diabetes: The neutrophil as a potential inflammatory target. Eur. Respir. Rev. 2020, 29, 190102. [Google Scholar] [CrossRef]
- Kehribar, D.Y.; Cihangiroglu, M.; Sehmen, E.; Avci, B.; Capraz, A.; Bilgin, A.Y.; Gunaydin, C.; Ozgen, M. The receptor for advanced glycation end product (RAGE) pathway in COVID-19. Biomarkers 2021, 26, 114–118. [Google Scholar] [CrossRef]
- Gordon, D.E.; Jang, G.M.; Bouhaddou, M.; Xu, J.; Obernier, K.; White, K.M.; O’Meara, M.J.; Rezelj, V.V.; Guo, J.Z.; Swaney, D.L.; et al. A SARS-CoV-2 protein interaction map reveals targets for drug repurposing. Nature 2020, 583, 459–468. [Google Scholar] [CrossRef] [PubMed]
- Zhang, A.; Yu, F.; Yu, W.; Ye, P.; Liu, P.; Gu, Y.; Chen, S.; Zhang, H. Pyruvate kinase M2 activation protects against the proliferation and migration of pulmonary artery smooth muscle cells. Cell Tissue Res. 2020, 382, 585–598. [Google Scholar] [CrossRef] [PubMed]
- Jennings, P.; Toma, C.; Gardner, I.; van de Water, B.; Forsby, A.; Leist, M. Development of a neurotoxicity assay that is tuned to detect mitochondrial toxicants. Arch. Toxicol. 2019, 93, 1585–1608. [Google Scholar] [CrossRef]
- Wang, Y.; Santerre, M.; Tempera, I.; Martin, K.; Mukerjee, R.; Sawaya, B.E. HIV-1 Vpr disrupts mitochondria axonal transport and accelerates neuronal aging. Neuropharmacology 2017, 117, 364–375. [Google Scholar] [CrossRef] [PubMed]
- Hansen, M.D.; Johnsen, I.B.; Stiberg, K.A.; Sherstova, T.; Wakita, T.; Richard, G.M.; Kandasamy, R.K.; Meurs, E.F.; Anthonsen, M.W. Hepatitis C virus triggers Golgi fragmentation and autophagy through the immunity-related GTPase M. Proc. Natl. Acad. Sci. USA 2017, 114, E3462–E3471. [Google Scholar] [CrossRef] [PubMed]
- Gu, X.; Ma, Y.; Liu, Y.; Wan, Q. Measurement of mitochondrial respiration in adherent cells by Seahorse XF96 Cell Mito Stress Test. STAR Protoc. 2020, 2, 100245. [Google Scholar] [CrossRef]
- Sansbury, B.E.; Jones, S.P.; Riggs, D.W.; Darley-Usmar, V.M.; Hill, B.G. Bioenergetic function in cardiovascular cells: The importance of the reserve capacity and its biological regulation. Chem. Biol. Interact. 2011, 191, 288–295. [Google Scholar] [CrossRef]
- Yetkin-Arik, B.; Vogels, I.M.C.; Nowak-Sliwinska, P.; Weiss, A.; Houtkooper, R.H.; Van Noorden, C.J.F.; Klaassen, I.; Schlingemann, R.O. The role of glycolysis and mitochondrial respiration in the formation and functioning of endothelial tip cells during angiogenesis. Sci. Rep. 2019, 9, 12608. [Google Scholar] [CrossRef]
- Thaker, S.K.; Ch’Ng, J.; Christofk, H.R. Viral hijacking of cellular metabolism. BMC Biol. 2019, 17, 59. [Google Scholar] [CrossRef]
- Choksi, A.; Parulekar, A.; Pant, R.; Shah, V.K.; Nimma, R.; Firmal, P.; Singh, S.; Kundu, G.C.; Shukla, S.; Chattopadhyay, S. Tumor suppressor SMAR1 regulates PKM alternative splicing by HDAC6-mediated deacetylation of PTBP1. Cancer Metab. 2021, 9, 16. [Google Scholar] [CrossRef]
- Chen, M.; Zhang, J.; Manley, J. Turning on a Fuel Switch of Cancer: hnRNP Proteins Regulate Alternative Splicing of Pyruvate Kinase mRNA. Cancer Res. 2010, 70, 8977–8980. [Google Scholar] [CrossRef]
- Taniguchi, K.; Uchiyama, K.; Akao, Y. PTBP1-targeting microRNAs regulate cancer-specific energy metabolism through the modulation of PKM1/M2 splicing. Cancer Sci. 2020, 112, 41–50. [Google Scholar] [CrossRef] [PubMed]
- Allen, C.N.; Arjona, S.P.; Santerre, M.; De Lucia, C.; Koch, W.J.; Sawaya, B.E. Metabolic Reprogramming in HIV-Associated Neurocognitive Disorders. Front. Cell. Neurosci. 2022, 16, 812887. [Google Scholar] [CrossRef] [PubMed]
- Williams, A.L.; Khadka, V.; Tang, M.; Avelar, A.; Schunke, K.; Menor, M.; Shohet, R.V. HIF1 mediates a switch in pyruvate kinase isoforms after myocardial infarction. Physiol. Genom. 2018, 50, 479–494. [Google Scholar] [CrossRef] [PubMed]
- Allen, C.N.S.; Arjona, S.P.; Santerre, M.; Sawaya, B.E. Hallmarks of Metabolic Reprogramming and Their Role in Viral Pathogenesis. Viruses 2022, 14, 602. [Google Scholar] [CrossRef] [PubMed]
- Lin, J.A.; Wu, C.H.; Lu, C.C.; Hsia, S.M.; Yen, G.C. Glycative stress from advanced glycation end products (AGEs) and dicarbonyls: An emerging biological factor in cancer onset and progression. Mol. Nutr. Food Res. 2016, 60, 1850–1864. [Google Scholar] [CrossRef] [PubMed]
- Xue, J.; Rai, V.; Frolov, S.; Singer, D.; Chabierski, S.; Xie, J.; Reverdatto, S.; Burz, D.S.; Schmidt, A.M.; Hoffman, R.; et al. Advanced glycation end product (AGE) recognition by the receptor for AGEs (RAGE). Structure 2011, 19, 722–732. [Google Scholar] [CrossRef]
- Holms, R.D. The COVID-19 Cell Signalling Problem: Spike, RAGE, PKC, p38, NFκB & IL-6 Hyper-Expression and the Human Ezrin Peptide, VIP, PKA-CREB Solution. Immuno 2022, 2, 260–282. [Google Scholar] [CrossRef]
- Cho, J.-H.; Saini, D.K.; Karunarathne, W.A.; Kalyanaraman, V.; Gautam, N. Alteration of Golgi structure in senescent cells and its regulation by a G protein γ subunit. Cell. Signal. 2011, 23, 785–793. [Google Scholar] [CrossRef]
- Ramos-Casals, M.; Brito-Zerón, P.; Mariette, X. Systemic and organ-specific immune-related manifestations of COVID-19. Nat. Rev. Rheumatol. 2021, 17, 315–332. [Google Scholar] [CrossRef]
- Tserel, L.; Jõgi, P.; Naaber, P.; Maslovskaja, J.; Häling, A.; Salumets, A.; Zusinaite, E.; Soeorg, H.; Lättekivi, F.; Ingerainen, D.; et al. Long-Term Elevated Inflammatory Protein Levels in Asymptomatic SARS-CoV-2 Infected Individuals. Front. Immunol. 2021, 12, 709759. [Google Scholar] [CrossRef] [PubMed]
- Michelen, M.; Manoharan, L.; Elkheir, N.; Cheng, V.; Dagens, A.; Hastie, C.; O’Hara, M.; Suett, J.; Dahmash, D.; Bugaeva, P.; et al. Characterising long COVID: A living systematic review. BMJ Glob. Health 2021, 6, e005427. [Google Scholar] [CrossRef] [PubMed]
- Montani, D.; Savale, L.; Noel, N.; Meyrignac, O.; Colle, R.; Gasnier, M.; Corruble, E.; Beurnier, A.; Jutant, E.-M.; Pham, T.; et al. Post-acute COVID-19 syndrome. Eur. Respir. Rev. 2022, 31, 210185. [Google Scholar] [CrossRef] [PubMed]
- Behzadi, F.; Ulloa, N.A.; Danckers, M. Multisystem inflammatory syndrome in adults: A case report and review of the literature. J. Med. Case Rep. 2022, 16, 102. [Google Scholar] [CrossRef] [PubMed]
- Borella, R.; De Biasi, S.; Paolini, A.; Boraldi, F.; Tartaro, D.L.; Mattioli, M.; Fidanza, L.; Neroni, A.; Caro-Maldonado, A.; Meschiari, M.; et al. Metabolic reprograming shapes neutrophil functions in severe COVID-19. Eur. J. Immunol. 2021, 52, 484–502. [Google Scholar] [CrossRef]
- Jia, H.; Liu, C.; Li, D.; Huang, Q.; Liu, D.; Zhang, Y.; Ye, C.; Zhou, D.; Wang, Y.; Tan, Y.; et al. Metabolomic analyses reveal new stage-specific features of COVID-19. Eur. Respir. J. 2021, 59, 2100284. [Google Scholar] [CrossRef]
- Mussap, M.; Fanos, V. Could metabolomics drive the fate of COVID-19 pandemic? A narrative review on lights and shadows. Clin. Chem. Lab. Med. 2021, 59, 1891–1905. [Google Scholar] [CrossRef]
- Ripoli, M.; D’Aprile, A.; Quarato, G.; Sarasin-Filipowicz, M.; Gouttenoire, J.; Scrima, R.; Cela, O.; Boffoli, D.; Heim, M.H.; Moradpour, D.; et al. Hepatitis C Virus-Linked Mitochondrial Dysfunction Promotes Hypoxia-Inducible Factor 1α-Mediated Glycolytic Adaptation. J. Virol. 2010, 84, 647–660. [Google Scholar] [CrossRef]
- Yu, Y.; Clippinger, A.J.; Alwine, J.C. Viral effects on metabolism: Changes in glucose and glutamine utilization during human cytomegalovirus infection. Trends Microbiol. 2011, 19, 360–367. [Google Scholar] [CrossRef]
- McFadden, K.; Hafez, A.Y.; Kishton, R.; Messinger, J.E.; Nikitin, P.A.; Rathmell, J.C.; Luftig, M.A. Metabolic stress is a barrier to Epstein–Barr virus-mediated B-cell immortalization. Proc. Natl. Acad. Sci. USA 2016, 113, E782–E790. [Google Scholar] [CrossRef]
- Kulkarni, A.; Mateus, M.; Thinnes, C.C.; McCullagh, J.; Schofield, C.J.; Taylor, G.P.; Bangham, C.R. Glucose Metabolism and Oxygen Availability Govern Reactivation of the Latent Human Retrovirus HTLV-1. Cell Chem. Biol. 2017, 24, 1377–1387.e3. [Google Scholar] [CrossRef] [PubMed]
- Passos, F.; Heimfarth, L.; Monteiro, B.S.; Corrêa, C.B.; de Moura, T.R.; Araújo, A.; Martins-Filho, P.R.; Quintans-Júnior, L.J.; Quintans, J. Oxidative stress and inflammatory markers in patients with COVID-19: Potential role of RAGE, HMGB1, GFAP and COX-2 in disease severity. Int. Immunopharmacol. 2022, 104, 108502. [Google Scholar] [CrossRef] [PubMed]
- Leisman, D.E.; Mehta, A.; Thompson, B.T.; Charland, N.C.; Gonye, A.; Gushterova, I.; Kays, K.R.; Khanna, H.K.; LaSalle, T.J.; Lavin-Parsons, K.M.; et al. Alveolar, Endothelial, and Organ Injury Marker Dynamics in Severe COVID-19. Am. J. Respir. Crit. Care Med. 2022, 205, 507–519. [Google Scholar] [CrossRef] [PubMed]
- Tleyjeh, I.M.; Saddik, B.; AlSwaidan, N.; AlAnazi, A.; Ramakrishnan, R.K.; Alhazmi, D.; Aloufi, A.; AlSumait, F.; Berbari, E.; Halwani, R. Prevalence and predictors of Post-Acute COVID-19 Syndrome (PACS) after hospital discharge: A cohort study with 4 months median follow-up. PLoS ONE 2021, 16, e0260568. [Google Scholar] [CrossRef] [PubMed]


Publisher’s Note: MDPI stays neutral with regard to jurisdictional claims in published maps and institutional affiliations. |
© 2022 by the authors. Licensee MDPI, Basel, Switzerland. This article is an open access article distributed under the terms and conditions of the Creative Commons Attribution (CC BY) license (https://creativecommons.org/licenses/by/4.0/).