
Higher-Order Structure of Adeno-Associated Virus Serotype 8 by Hydrogen/Deuterium Exchange Mass Spectrometry

 , , and
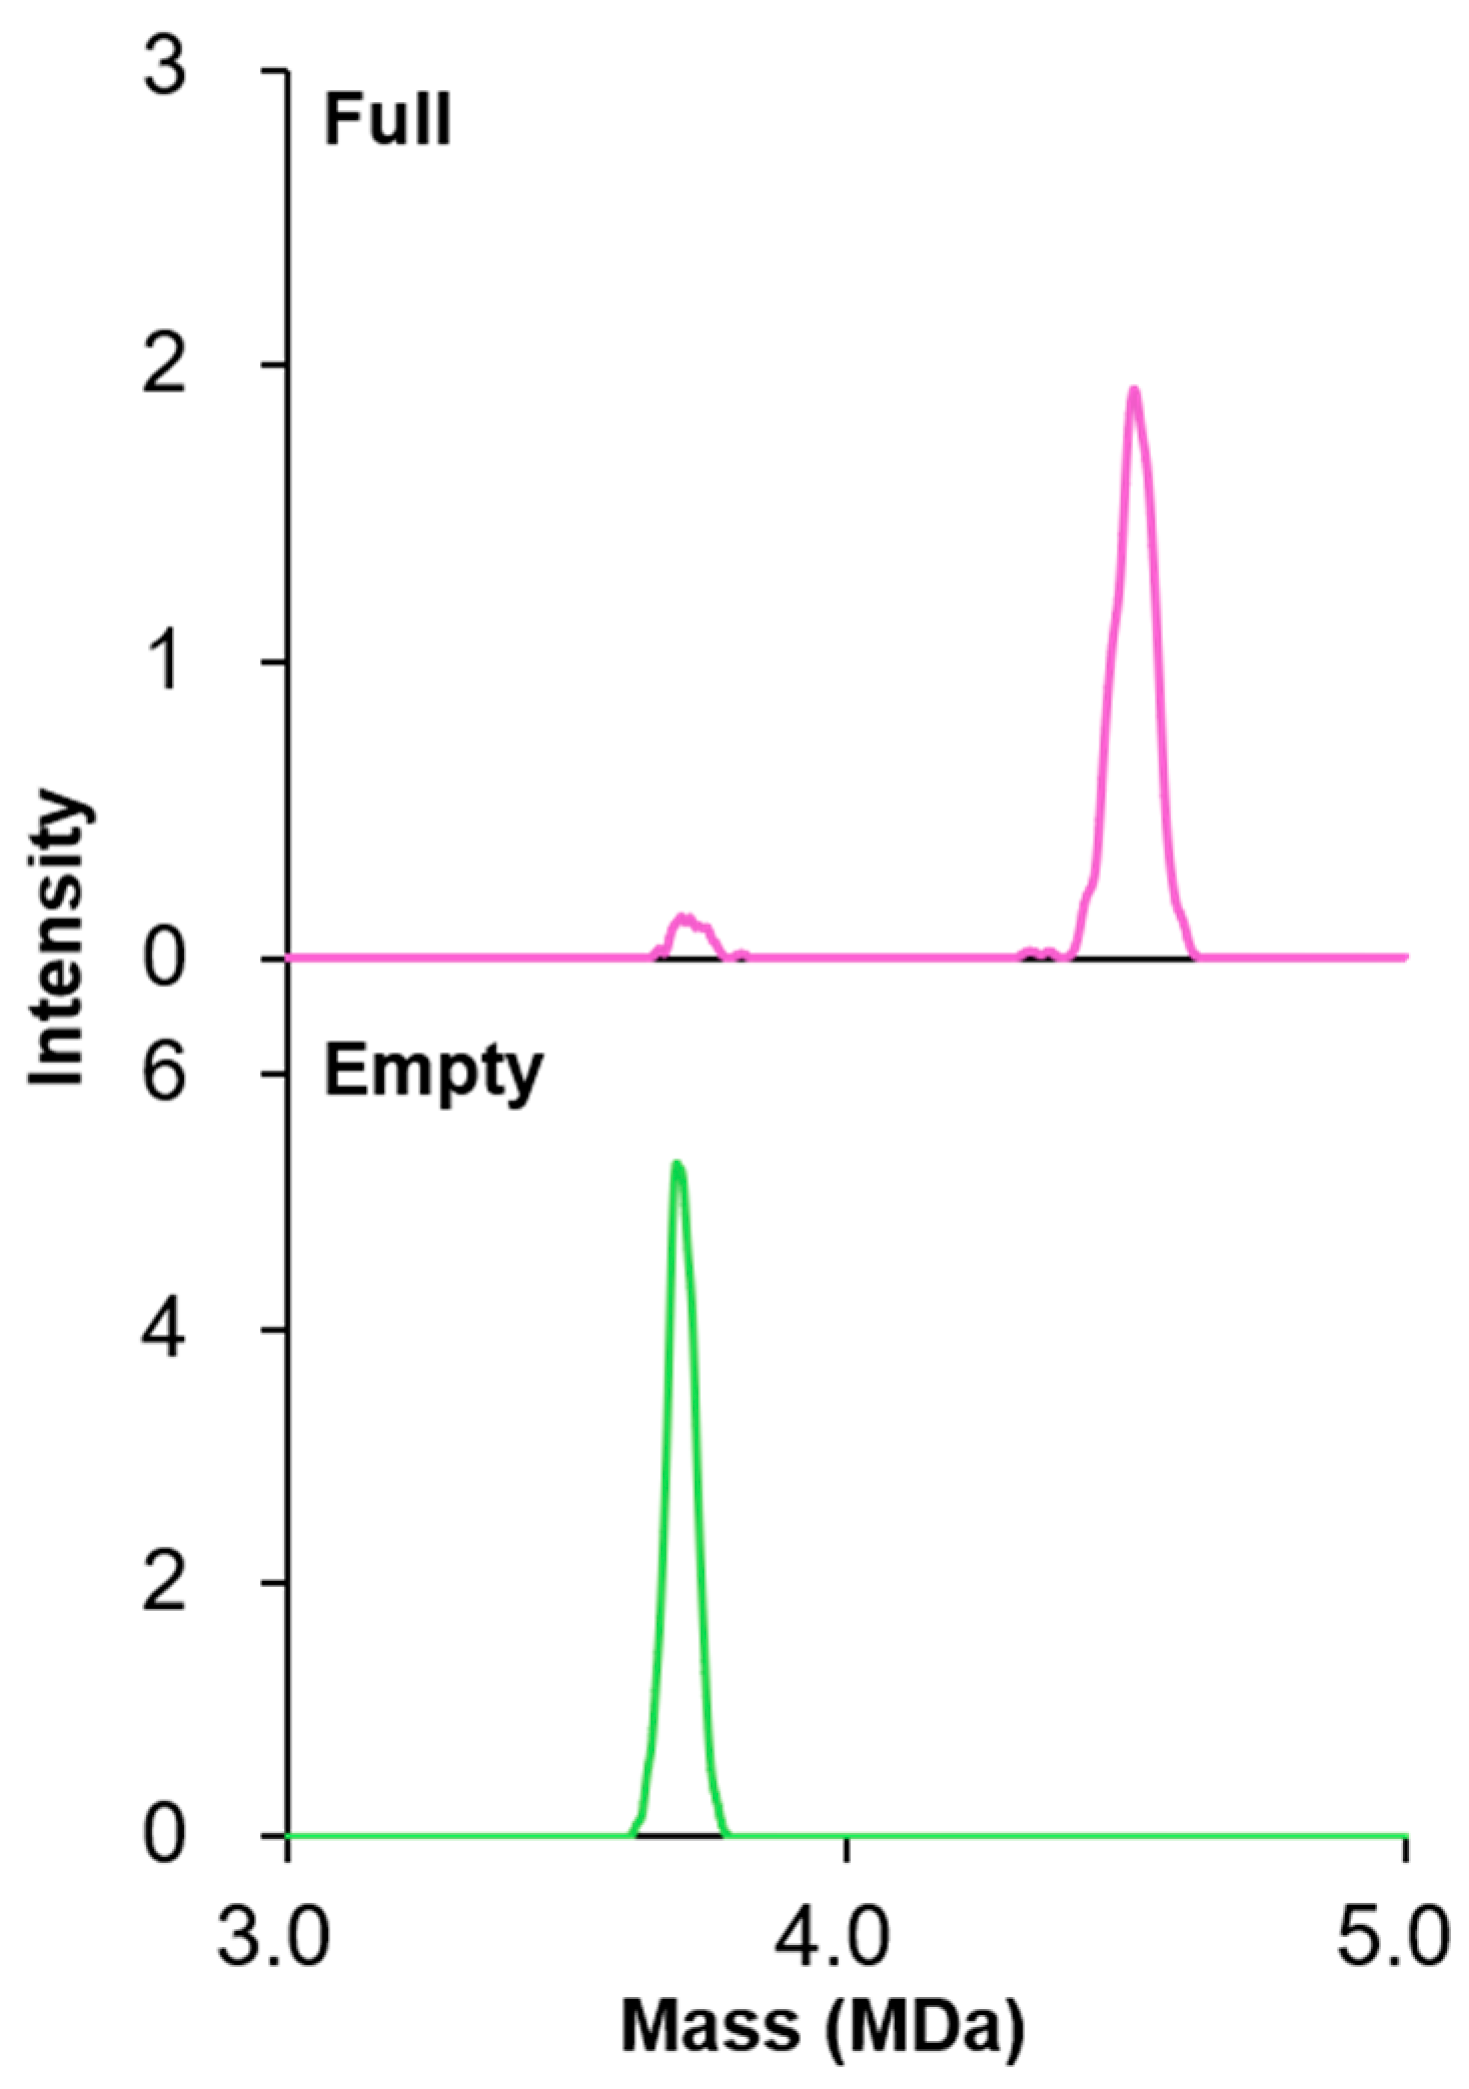
Abstract
:1. Introduction
2. Materials and Methods
2.1. rAAV Samples
2.2. Capillary Gel Electrophoresis (CGE) of ssDNA
2.3. Capillary Gel Electrophoresis (CGE) for the Capsid Protein
2.4. Characterization of Full and Empty Particles
2.5. HDX-MS Measurements
2.6. HDX-MS Data Analysis
3. Results and Discussion
3.1. rAAV Sample Characterization
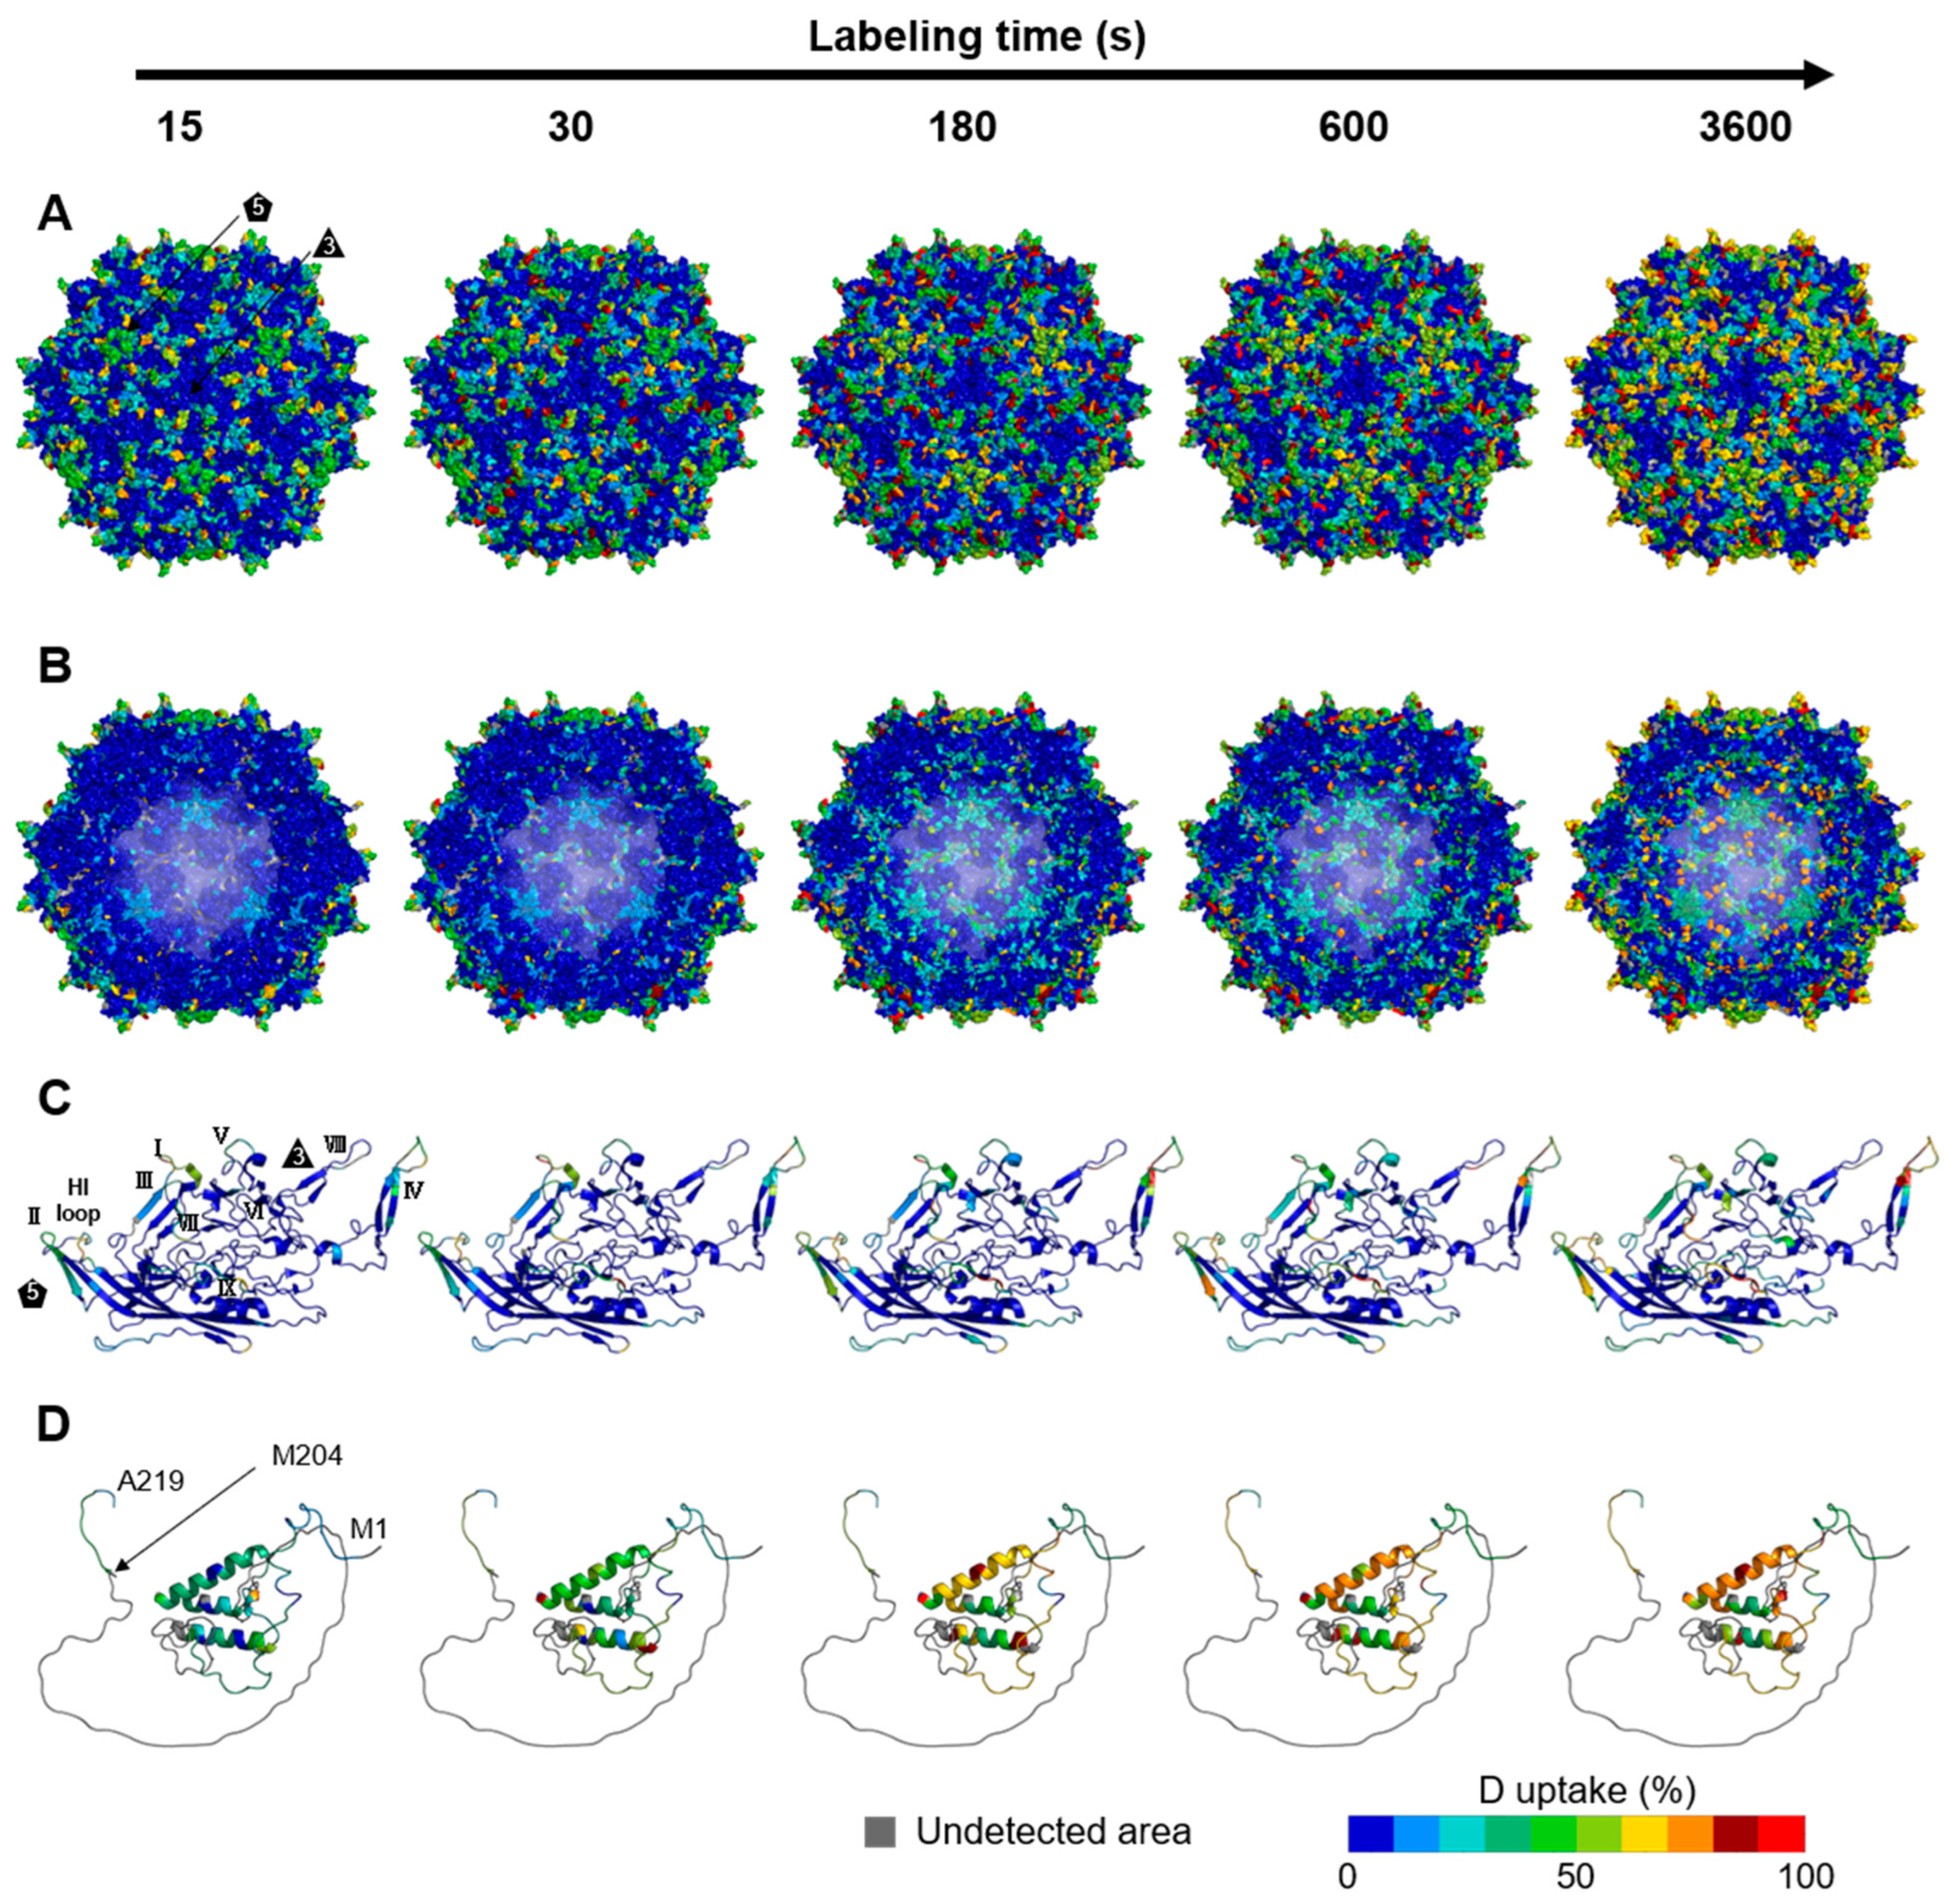
3.2. Dynamics of the rAAV8 Capsid
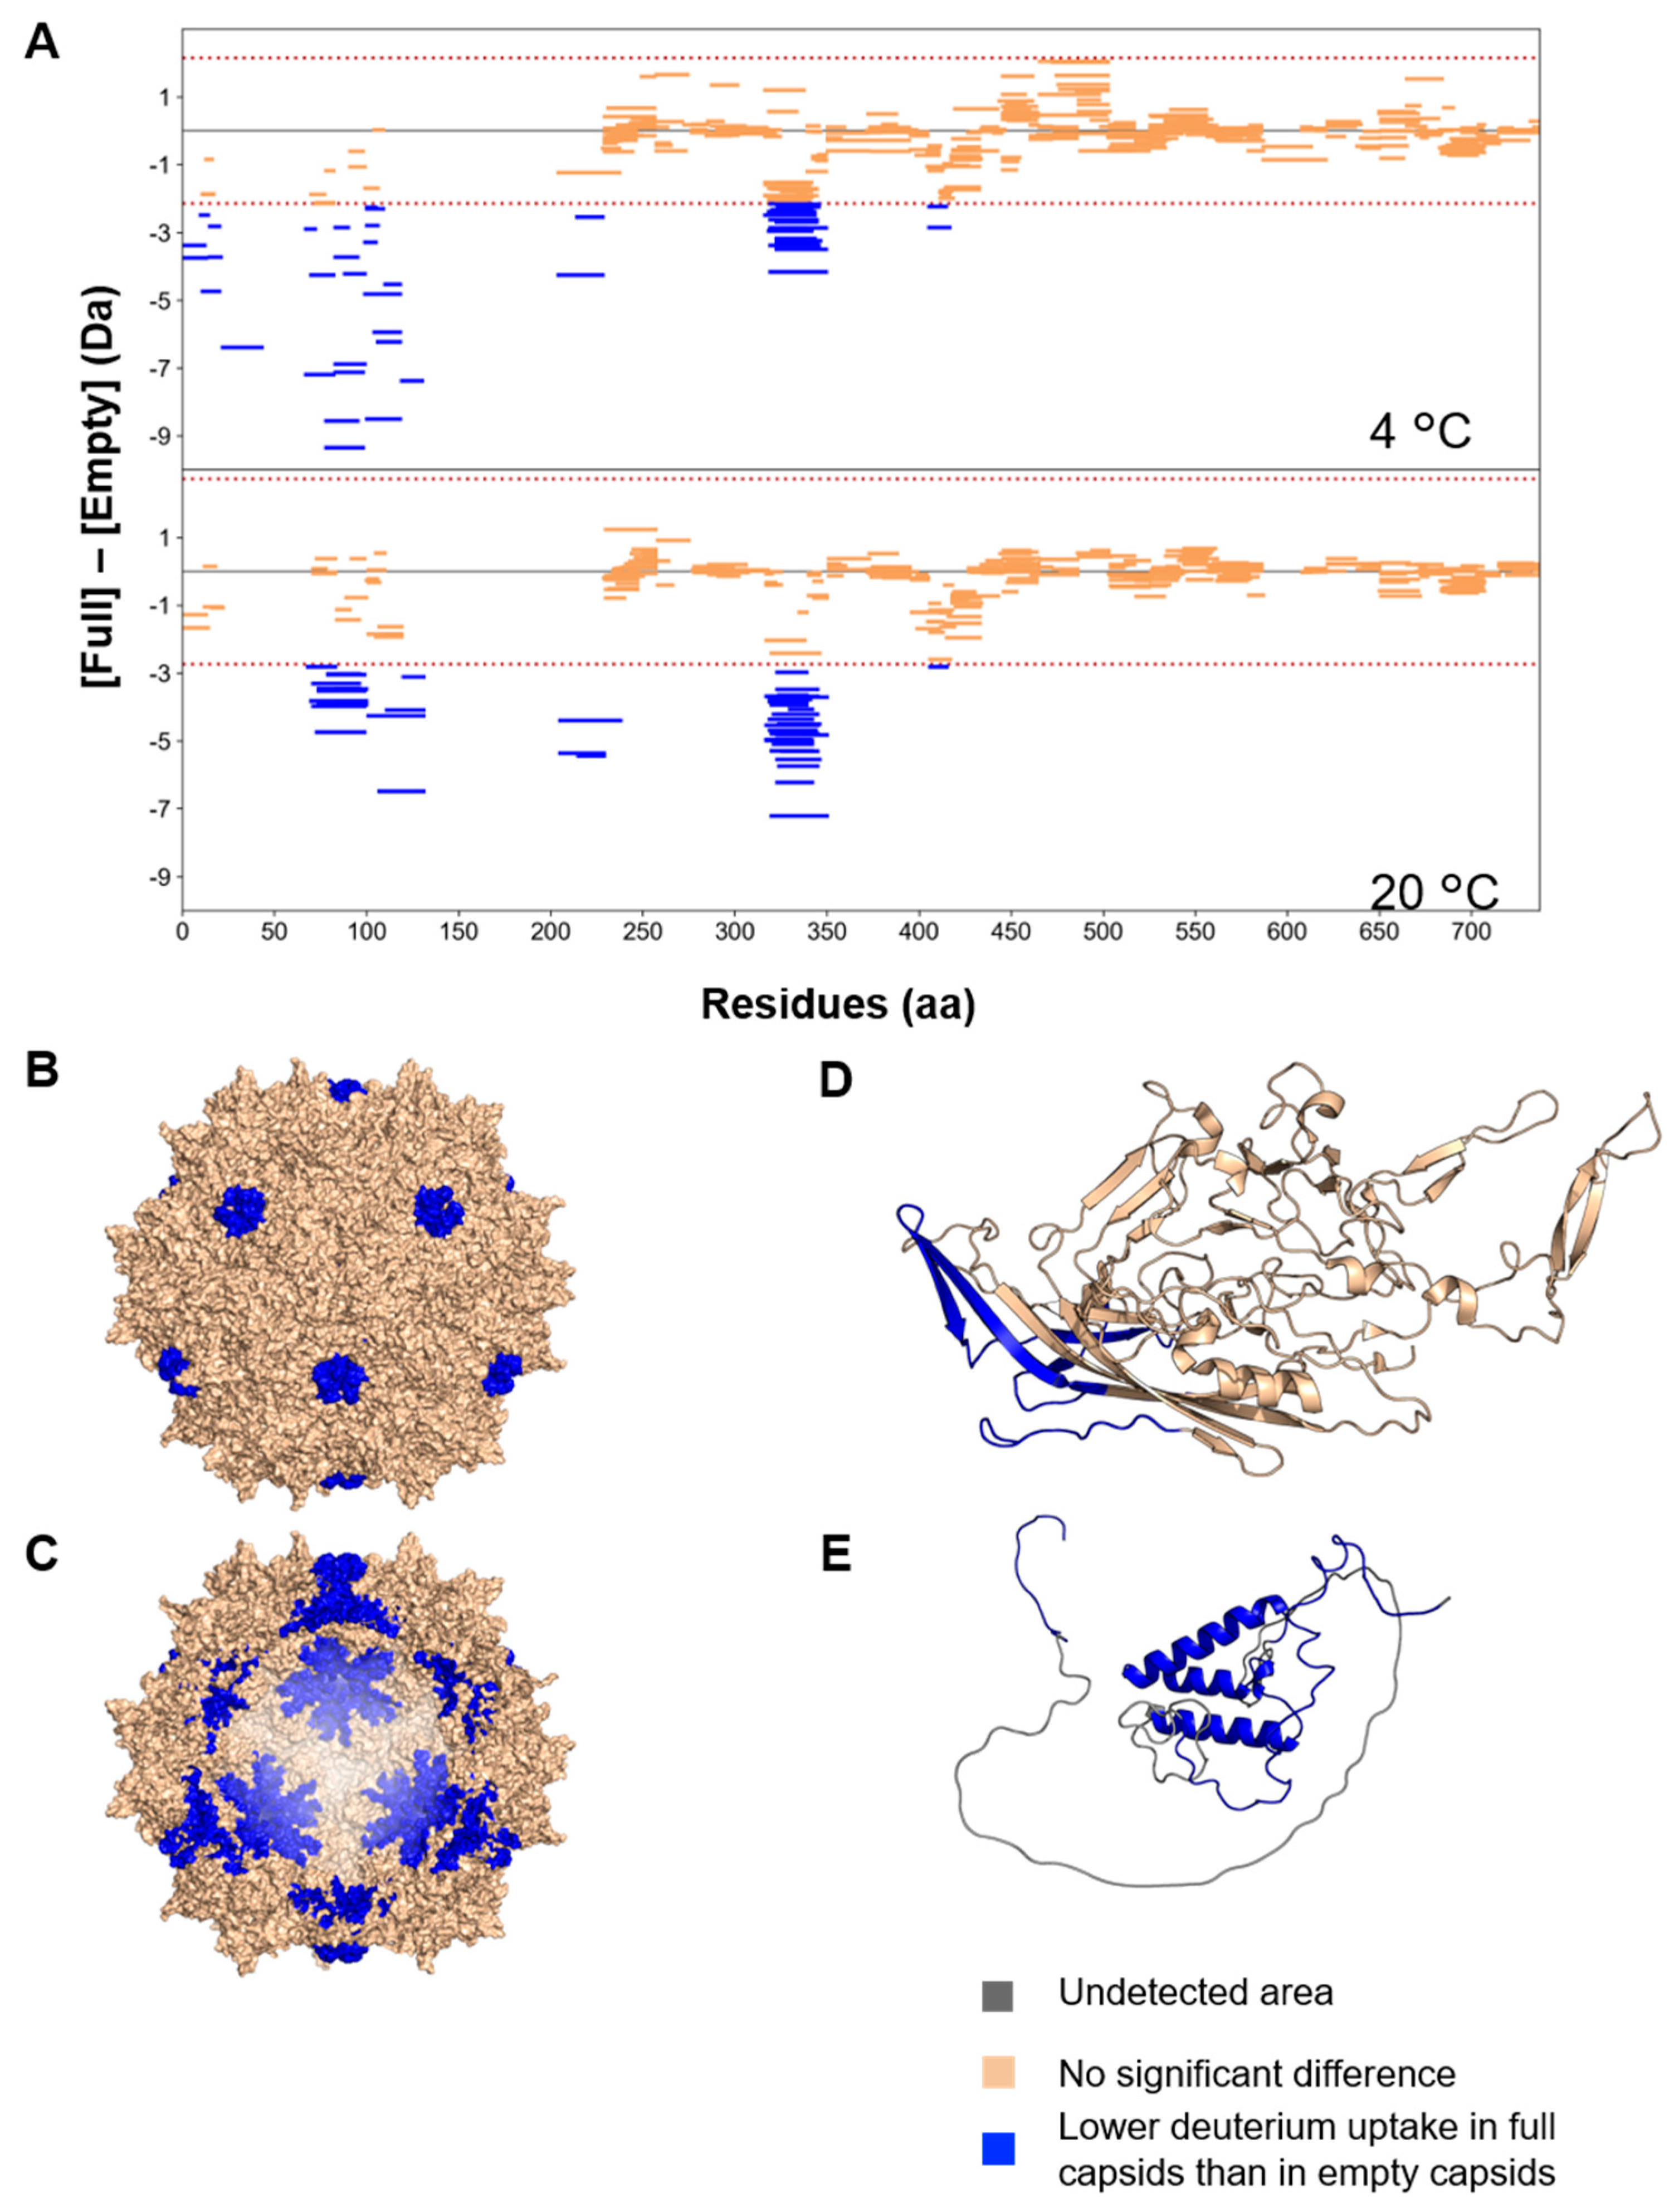
3.3. Structural Differences between Full and Empty Capsids
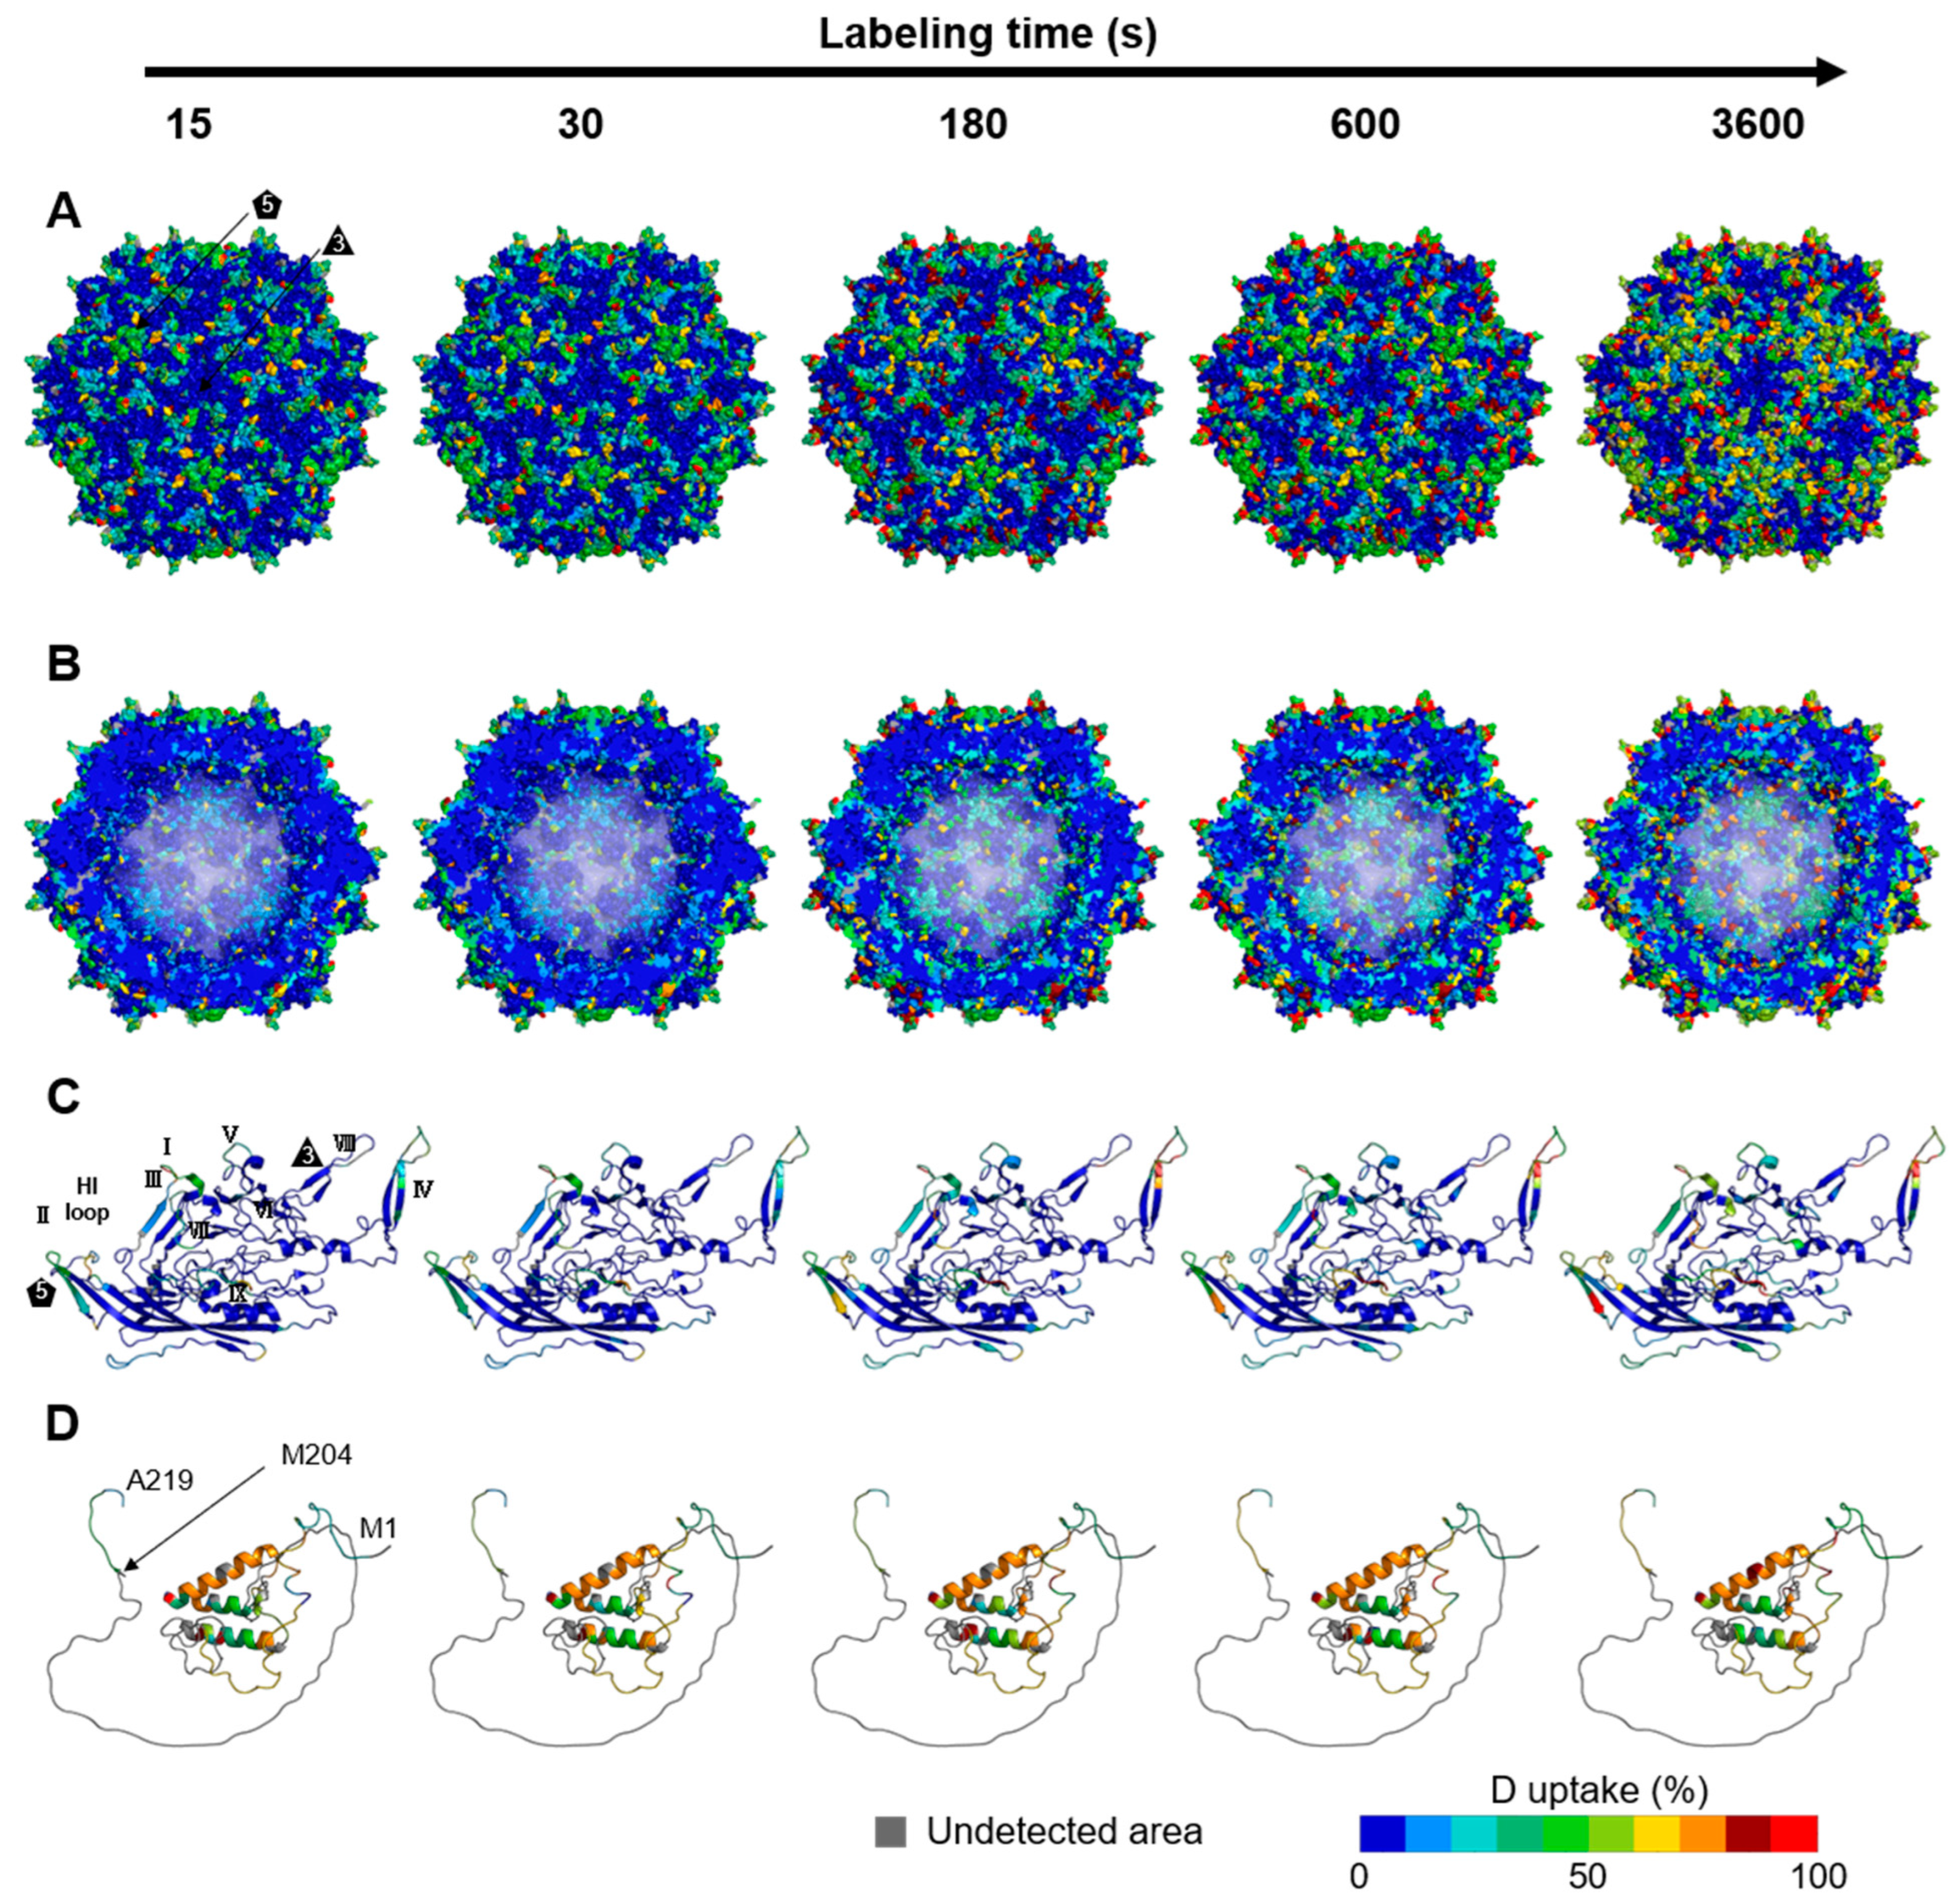
3.4. Structural Differences near the VP3 Transcriptional Start Site between VP1/VP2 and VP3
4. Conclusions
Supplementary Materials
Author Contributions
Funding
Institutional Review Board Statement
Informed Consent Statement
Data Availability Statement
Acknowledgments
Conflicts of Interest
References
- Mietzsch, M.; Pénzes, J.J.; Agbandje-McKenna, M. Twenty-five years of structural parvovirology. Viruses 2019, 11, 362. [Google Scholar] [CrossRef]
- Wang, D.; Tai, P.W.L.; Gao, G. Adeno-associated virus vector as a platform for gene therapy delivery. Nat. Rev. Drug Discov. 2019, 18, 358–378. [Google Scholar] [CrossRef] [PubMed]
- Oyama, H.; Ishii, K.; Maruno, T.; Torisu, T.; Uchiyama, S. Characterization of Adeno-Associated Virus Capsid Proteins with Two Types of VP3-Related Components by Capillary Gel Electrophoresis and Mass Spectrometry. Hum. Gene Ther. 2021, 32, 1403–1416. [Google Scholar] [CrossRef] [PubMed]
- Snijder, J.; van de Waterbeemd, M.; Damoc, E.; Denisov, E.; Grinfeld, D.; Bennett, A.; Agbandje-McKenna, M.; Makarov, A.; Heck, A.J.R. Defining the stoichiometry and cargo load of viral and bacterial nanoparticles by orbitrap mass spectrometry. J. Am. Chem. Soc. 2014, 136, 7295–7299. [Google Scholar] [CrossRef] [PubMed]
- Wörner, T.P.; Bennett, A.; Habka, S.; Snijder, J.; Friese, O.; Powers, T.; Agbandje-McKenna, M.; Heck, A.J.R. Adeno-associated virus capsid assembly is divergent and stochastic. Nat. Commun. 2021, 12, 1642. [Google Scholar] [CrossRef] [PubMed]
- Shahryari, A.; Burtscher, I.; Nazari, Z.; Lickert, H. Engineering Gene Therapy: Advances and Barriers. Adv. Ther. 2021, 4, 2100040. [Google Scholar] [CrossRef]
- Li, L.; Vasan, L.; Kartono, B.; Clifford, K.; Attarpour, A.; Sharma, R.; Mandrozos, M.; Kim, A.; Zhao, W.; Belotserkovsky, A.; et al. Advances in Recombinant Adeno-Associated Virus Vectors for Neurodegenerative Diseases. Biomedicines 2023, 11, 2725. [Google Scholar] [CrossRef] [PubMed]
- Rodrigues, G.A.; Shalaev, E.; Karami, T.K.; Cunningham, J.; Slater, N.K.H.; Rivers, H.M. Pharmaceutical Development of AAV-Based Gene Therapy Products for the Eye. Pharm. Res. 2018, 36, 29. [Google Scholar] [CrossRef]
- Wang, F.; Qin, Z.; Lu, H.; He, S.; Luo, J.; Jin, C.; Song, X. Clinical translation of gene medicine. J. Gene Med. 2019, 21, e3108. [Google Scholar] [CrossRef]
- Venkatakrishnan, B.; Yarbrough, J.; Domsic, J.; Bennett, A.; Bothner, B.; Kozyreva, O.G.; Samulski, R.J.; Muzyczka, N.; McKenna, R.; Agbandje-McKenna, M. Structure and Dynamics of Adeno-Associated Virus Serotype 1 VP1-Unique N-Terminal Domain and Its Role in Capsid Trafficking. J. Virol. 2013, 87, 4974–4984. [Google Scholar] [CrossRef]
- Grieger, J.C.; Johnson, J.S.; Gurda-Whitaker, B.; Agbandje-McKenna, M.; Samulski, R.J. Surface-Exposed Adeno-Associated Virus Vp1-NLS Capsid Fusion Protein Rescues Infectivity of Noninfectious Wild-Type Vp2/Vp3 and Vp3-Only Capsids but Not That of Fivefold Pore Mutant Virions. J. Virol. 2007, 81, 7833–7843. [Google Scholar] [CrossRef] [PubMed]
- Sonntag, F.; Bleker, S.; Leuchs, B.; Fischer, R.; Kleinschmidt, J.A. Adeno-Associated Virus Type 2 Capsids with Externalized VP1/VP2 Trafficking Domains Are Generated prior to Passage through the Cytoplasm and Are Maintained until Uncoating Occurs in the Nucleus. J. Virol. 2006, 80, 11040–11054. [Google Scholar] [CrossRef] [PubMed]
- Stagg, S.M.; Yoshioka, C.; Davulcu, O.; Chapman, M.S. Cryo-electron Microscopy of Adeno-associated Virus. Chem. Rev. 2021, 122, 14018–14054. [Google Scholar] [CrossRef] [PubMed]
- Nam, H.-J.; Lane, M.D.; Padron, E.; Gurda, B.; McKenna, R.; Kohlbrenner, E.; Aslanidi, G.; Byrne, B.; Muzyczka, N.; Zolotukhin, S.; et al. Structure of Adeno-Associated Virus Serotype 8, a Gene Therapy Vector. J. Virol. 2007, 81, 12260–12271. [Google Scholar] [CrossRef] [PubMed]
- Agbandje-McKenna, M.; Kleinschmidt, J. AAV Capsid Structure and Cell Interactions; Springer: New York, NY, USA, 2011; Volume 807. [Google Scholar]
- Krupovic, M.; Koonin, E.V. Multiple origins of viral capsid proteins from cellular ancestors. Proc. Natl. Acad. Sci. USA 2017, 114, E2401–E2410. [Google Scholar] [CrossRef] [PubMed]
- Govindasamy, L.; Padron, E.; McKenna, R.; Muzyczka, N.; Kaludov, N.; Chiorini, J.A.; Agbandje-McKenna, M. Structurally Mapping the Diverse Phenotype of Adeno-Associated Virus Serotype 4. J. Virol. 2006, 80, 11556–11570. [Google Scholar] [CrossRef] [PubMed]
- Tenney, R.M.; Bell, C.L.; Wilson, J.M. AAV8 capsid variable regions at the two-fold symmetry axis contribute to high liver transduction by mediating nuclear entry and capsid uncoating. Virology 2014, 454-455, 227–236. [Google Scholar] [CrossRef]
- Gurda, B.L.; DiMattia, M.A.; Miller, E.B.; Bennett, A.; McKenna, R.; Weichert, W.S.; Nelson, C.D.; Chen, W.-J.; Muzyczka, N.; Olson, N.H.; et al. Capsid Antibodies to Different Adeno-Associated Virus Serotypes Bind Common Regions. J. Virol. 2013, 87, 9111–9124. [Google Scholar] [CrossRef] [PubMed]
- Zhang, R.; Xu, G.; Cao, L.; Sun, Z.; He, Y.; Cui, M.; Sun, Y.; Li, S.; Li, H.; Qin, L.; et al. Divergent engagements between adeno-associated viruses with their cellular receptor AAVR. Nat. Commun. 2019, 10, 3760. [Google Scholar] [CrossRef]
- Bleker, S.; Sonntag, F.; Kleinschmidt, J.A. Mutational Analysis of Narrow Pores at the Fivefold Symmetry Axes of Adeno-Associated Virus Type 2 Capsids Reveals a Dual Role in Genome Packaging and Activation of Phospholipase A2 Activity. J. Virol. 2005, 79, 2528–2540. [Google Scholar] [CrossRef]
- Kern, A.; Schmidt, K.; Leder, C.; Muller, O.J.; Wobus, C.E.; Bettinger, K.; Von der Lieth, C.W.; King, J.A.; Kleinschmidt, J.A. Identification of a Heparin-Binding Motif on Adeno-Associated Virus Type 2 Capsids. J. Virol. 2003, 77, 11072–11081. [Google Scholar] [CrossRef] [PubMed]
- Huang, L.-Y.; Patel, A.; Ng, R.; Miller, E.B.; Halder, S.; McKenna, R.; Asokan, A.; Agbandje-McKenna, M. Characterization of the Adeno-Associated Virus 1 and 6 Sialic Acid Binding Site. J. Virol. 2016, 90, 5219–5230. [Google Scholar] [CrossRef] [PubMed]
- Bartlett, J.S.; Wilcher, R.; Samulski, R.J. Infectious Entry Pathway of Adeno-Associated Virus and Adeno-Associated Virus Vectors. J. Virol. 2000, 74, 2777–2785. [Google Scholar] [CrossRef] [PubMed]
- Riyad, J.M.; Weber, T. Intracellular trafficking of adeno-associated virus (AAV) vectors: Challenges and future directions. Gene Ther. 2021, 28, 683–696. [Google Scholar] [CrossRef] [PubMed]
- Xiao, P.-J.; Samulski, R.J. Cytoplasmic Trafficking, Endosomal Escape, and Perinuclear Accumulation of Adeno-Associated Virus Type 2 Particles Are Facilitated by Microtubule Network. J. Virol. 2012, 86, 10462–10473. [Google Scholar] [CrossRef] [PubMed]
- Nicolson, S.C.; Samulski, R.J. Recombinant Adeno-Associated Virus Utilizes Host Cell Nuclear Import Machinery To Enter the Nucleus. J. Virol. 2014, 88, 4132–4144. [Google Scholar] [CrossRef] [PubMed]
- Stahnke, S.; Lux, K.; Uhrig, S.; Kreppel, F.; Hösel, M.; Coutelle, O.; Ogris, M.; Hallek, M.; Büning, H. Intrinsic phospholipase A2 activity of adeno-associated virus is involved in endosomal escape of incoming particles. Virology 2011, 409, 77–83. [Google Scholar] [CrossRef]
- Onishi, T.; Nonaka, M.; Maruno, T.; Yamaguchi, Y.; Fukuhara, M.; Torisu, T.; Maeda, M.; Abbatiello, S.; Haris, A.; Richardson, K.; et al. Enhancement of recombinant adeno-associated virus activity by improved stoichiometry and homogeneity of capsid protein assembly. Mol. Ther.–Methods Clin. Dev. 2023, 31, 101142. [Google Scholar] [CrossRef]
- Engen, J.R.; Botzanowski, T.; Peterle, D.; Georgescauld, F.; Wales, T.E. Developments in Hydrogen/Deuterium Exchange Mass Spectrometry. Anal. Chem. 2021, 93, 567–582. [Google Scholar] [CrossRef]
- Yamaguchi, Y.; Wakaizumi, N.; Irisa, M.; Maruno, T.; Shimada, M.; Shintani, K.; Nishiumi, H.; Yogo, R.; Yanaka, S.; Higo, D.; et al. The Fab portion of immunoglobulin G has sites in the CL domain that interact with Fc gamma receptor IIIa. mAbs 2022, 14, 2038531. [Google Scholar] [CrossRef]
- Chen, G.; Tao, L.; Li, Z. Recent advancements in mass spectrometry for higher order structure characterization of protein therapeutics. Drug Discov. Today 2022, 27, 196–206. [Google Scholar] [CrossRef] [PubMed]
- Fang, J.; Doneanu, C.; Alley, W.R.; Yu, Y.Q.; Beck, A.; Chen, W. Advanced assessment of the physicochemical characteristics of Remicade® and Inflectra® by sensitive LC/MS techniques. mAbs 2016, 8, 1021–1034. [Google Scholar] [CrossRef] [PubMed]
- Chandramohan, A.; Lim, X.Y.E.; Bag, N.; Sharma, K.K.; Wirawan, M.; Wohland, T.; Lok, S.-M.; Anand, G.S. Conformational changes in intact dengue virus reveal serotype-specific expansion. Nat. Commun. 2017, 8, 14339. [Google Scholar] [CrossRef]
- Van de Waterbeemd, M.; Llauró, A.; Snijder, J.; Valbuena, A.; Rodríguez-Huete, A.; Fuertes, M.A.; de Pablo, P.J.; Mateu, M.G.; Heck, A.J. Structural Analysis of a Temperature-Induced Transition in a Viral Capsid Probed by HDX-MS. Biophys. J. 2017, 112, 1157–1165. [Google Scholar] [CrossRef] [PubMed]
- Bai, Y.; Milne, J.S.; Mayne, L.; Englander, S.W. Primary structure effects on peptide group hydrogen exchange. Proteins 1993, 17, 75–86. [Google Scholar] [CrossRef]
- Matthew, J.B.; Richards, F.M. The pH dependence of hydrogen exchange in proteins. J. Biol. Chem. 1983, 258, 3039–3044. [Google Scholar] [CrossRef] [PubMed]
- Goswami, D.; Devarakonda, S.; Chalmers, M.J.; Pascal, B.D.; Spiegelman, B.M.; Griffin, P.R. Time Window Expansion for HDX Analysis of an Intrinsically Disordered Protein. J. Am. Soc. Mass Spectrom. 2013, 24, 1584–1592. [Google Scholar] [CrossRef] [PubMed]
- Burke, J.E.; Dennis, E.A. Phospholipase A2 structure/function, mechanism, and signaling. J. Lipid Res. 2009, 50, 237–242. [Google Scholar] [CrossRef] [PubMed]
- Schwartz, G.M. Highly Sensitive SDS Capillary Gel Electrophoresis with Sample Stacking Requiring Only Nanograms of Adeno-Associated Virus Capsid Proteins. Methods Mol. Biol. 2023, 1972, 75–77. [Google Scholar] [CrossRef]
- Kuipers, B.J.H.; Gruppen, H. Prediction of molar extinction coefficients of proteins and peptides using UV absorption of the constituent amino acids at 214 nm to enable quantitative reverse phase high-performance liquid chromatography−Mass spectrometry analysis. J. Agric. Food Chem. 2007, 55, 5445–5451. [Google Scholar] [CrossRef]
- Kubota, K.; Metoki, Y.; Athauda, S.B.P.; Shibata, C.; Takahashi, K. Stability Profiles of nepenthesin in urea and guanidine hydrochloride: Comparison with porcine pepsin A. Biosci. Biotechnol. Biochem. 2010, 74, 2323–2326. [Google Scholar] [CrossRef] [PubMed]
- Mary, B.; Maurya, S.; Arumugam, S.; Kumar, V.; Jayandharan, G.R. Post-translational modifications in capsid proteins of recombinant adeno-associated virus (AAV) 1-rh10 serotypes. FEBS J. 2019, 286, 4964–4981. [Google Scholar] [CrossRef] [PubMed]
- Hageman, T.S.; Weis, D.D. Reliable Identification of Significant Differences in Differential Hydrogen Exchange-Mass Spectrometry Measurements Using a Hybrid Significance Testing Approach. Anal. Chem. 2019, 91, 8008–8016. [Google Scholar] [CrossRef] [PubMed]
- Weis, D.D. Recommendations for the Propagation of Uncertainty in Hydrogen Exchange-Mass Spectrometric Measurements. J. Am. Soc. Mass Spectrom. 2021, 32, 1610–1617. [Google Scholar] [CrossRef] [PubMed]
- Rumachik, N.G.; Malaker, S.A.; Poweleit, N.; Maynard, L.H.; Adams, C.M.; Leib, R.D.; Cirolia, G.; Thomas, D.; Stamnes, S.; Holt, K.; et al. Methods Matter: Standard Production Platforms for Recombinant AAV Produce Chemically and Functionally Distinct Vectors. Mol. Ther.–Methods Clin. Dev. 2020, 18, 98–118. [Google Scholar] [CrossRef] [PubMed]
- Jumper, J.; Evans, R.; Pritzel, A.; Green, T.; Figurnov, M.; Ronneberger, O.; Tunyasuvunakool, K.; Bates, R.; Žídek, A.; Potapenko, A.; et al. Highly accurate protein structure prediction with AlphaFold. Nature 2021, 596, 583–589. [Google Scholar] [CrossRef] [PubMed]
- Masson, G.R.; Burke, J.E.; Ahn, N.G.; Anand, G.S.; Borchers, C.; Brier, S.; Bou-Assaf, G.M.; Engen, J.R.; Englander, S.W.; Faber, J.; et al. Recommendations for performing, interpreting and reporting hydrogen deuterium exchange mass spectrometry (HDX-MS) experiments. Nat. Methods 2019, 16, 595–602. [Google Scholar] [CrossRef] [PubMed]
- Jackson, P.; Attalla, M.I. Specificity of immobilized porcine pepsin in H/D exchange compatible conditions. Rapid Commun. Mass Spectrom. 2010, 24, 1457–1466. [Google Scholar] [CrossRef]
- Nirudodhi, S.N.; Sperry, J.B.; Rouse, J.C.; Carroll, J.A. Application of Dual Protease Column for HDX-MS Analysis of Monoclonal Antibodies. J. Pharm. Sci. 2017, 106, 530–536. [Google Scholar] [CrossRef]
- Hamuro, Y.; Zhang, T. High-Resolution HDX-MS of Cytochrome c Using Pepsin/Fungal Protease Type XIII Mixed Bed Column. J. Am. Soc. Mass Spectrom. 2019, 30, 227–234. [Google Scholar] [CrossRef]
- Zhang, R.; Cao, L.; Cui, M.; Sun, Z.; Hu, M.; Zhang, R.; Stuart, W.; Zhao, X.; Yang, Z.; Li, X.; et al. Adeno-associated virus 2 bound to its cellular receptor AAVR. Nat. Microbiol. 2019, 4, 675–682. [Google Scholar] [CrossRef] [PubMed]
- Lochrie, M.A.; Tatsuno, G.P.; Christie, B.; McDonnell, J.W.; Zhou, S.; Surosky, R.; Pierce, G.F.; Colosi, P. Mutations on the External Surfaces of Adeno-AssociatedVirus Type 2 Capsids That Affect Transduction and Neutralization. J. Virol. 2006, 80, 821–834. [Google Scholar] [CrossRef] [PubMed]
- Mietzsch, M.; Jose, A.; Chipman, P.; Bhattacharya, N.; Daneshparvar, N.; McKenna, R.; Agbandje-McKenna, M. Completion of the AAV structural atlas: Serotype capsid structures reveals clade-specific features. Viruses 2021, 13, 101. [Google Scholar] [CrossRef] [PubMed]
- Vinciauskaite, V.; Masson, G.R. Fundamentals of HDX-MS. Essays Biochem. 2023, 67, 301–314. [Google Scholar] [CrossRef]
- Hodge, E.A.; Benhaim, M.A.; Lee, K.K. Bridging protein structure, dynamics, and function using hydrogen/deuterium-exchange mass spectrometry. Protein Sci. 2020, 29, 843–855. [Google Scholar] [CrossRef] [PubMed]
- Englander, S.W.; Mayne, L.; Bai, Y.; Sosnick, T.R. Hydrogen exchange: The modern legacy of Linderstrøm-Lang. Protein Sci. 1997, 6, 1101–1109. [Google Scholar] [CrossRef] [PubMed]
- Clarke, J.; Itzhaki, L.S.; Fersht, A.R. Hydrogen exchange at equilibrium: A short cut for analysing protein-folding pathways? Trends Biochem. Sci. 1997, 22, 284–287. [Google Scholar] [CrossRef] [PubMed]
- Rodrigues, C.; Alves, C.; Santos-neto, A.J.; Fernandes, C.; Lan, F.M. Protein structure and dynamics studied by mass spectrometry: H/D exchange, hydroxyl radical labeling, and related approaches. J. Mass Spectrom. 2007, 43, 1342–1347. [Google Scholar] [CrossRef]
- Kurian, J.J.; Lakshmanan, R.; Chmely, W.M.; Hull, J.A.; Yu, J.C.; Bennett, A.; McKenna, R.; Agbandje-McKenna, M. Adeno-associated virus VP1u exhibits protease activity. Viruses 2019, 11, 399. [Google Scholar] [CrossRef]
- Mietzsch, M.; Barnes, C.; Hull, J.A.; Chipman, P.; Xie, J.; Bhattacharya, N.; Sousa, D.; McKenna, R.; Gao, G.; Agbandje-McKenna, M. Comparative Analysis of the Capsid Structures of AAVrh.10, AAVrh.39, and AAV8. J. Virol. 2020, 94, e01769-19. [Google Scholar] [CrossRef]
- Gerlach, B.; Kleinschmidt, J.A.; Böttcher, B. Conformational changes in adeno-associated virus type 1 induced by genome packaging. J. Mol. Biol. 2011, 409, 427–438. [Google Scholar] [CrossRef] [PubMed]
- Ahmad, F.; Patterson, A.; Deveryshetty, J.; Mattice, J.R.; Pokhrel, N.; Bothner, B.; Antony, E. Hydrogen–deuterium exchange reveals a dynamic DNA-binding map of replication protein A. Nucleic Acids Res. 2021, 49, 1455–1469. [Google Scholar] [CrossRef] [PubMed]
- Hamuro, Y.; Coales, S.J. Hydrogen/Deuterium Exchange Mass Spectrometry for Weak Binders. J. Am. Soc. Mass Spectrom. 2022, 33, 735–739. [Google Scholar] [CrossRef] [PubMed]
- Becerra, S.P.; A. Rose, J.; Hardy, M.; Baroudy, B.M.; Anderson, C.W. Direct mapping of adeno-associated virus capsid proteins B and C: A possible ACG initiation codon. Proc. Natl. Acad. Sci. USA 1985, 82, 7919–7923. [Google Scholar] [CrossRef]
- Engen, J.R.; Komives, E.A. Complementarity of Hydrogen/Deuterium Exchange Mass Spectrometry and Cryo-Electron Microscopy. Trends Biochem. Sci. 2020, 45, 906–918. [Google Scholar] [CrossRef]


Disclaimer/Publisher’s Note: The statements, opinions and data contained in all publications are solely those of the individual author(s) and contributor(s) and not of MDPI and/or the editor(s). MDPI and/or the editor(s) disclaim responsibility for any injury to people or property resulting from any ideas, methods, instructions or products referred to in the content. |
© 2024 by the authors. Licensee MDPI, Basel, Switzerland. This article is an open access article distributed under the terms and conditions of the Creative Commons Attribution (CC BY) license (https://creativecommons.org/licenses/by/4.0/).
Share and Cite
Ikeda, T.; Yamaguchi, Y.; Oyama, H.; Matsushita, A.; Tsunaka, Y.; Fukuhara, M.; Torisu, T.; Uchiyama, S. Higher-Order Structure of Adeno-Associated Virus Serotype 8 by Hydrogen/Deuterium Exchange Mass Spectrometry. Viruses 2024, 16, 585. https://doi.org/10.3390/v16040585
Ikeda T, Yamaguchi Y, Oyama H, Matsushita A, Tsunaka Y, Fukuhara M, Torisu T, Uchiyama S. Higher-Order Structure of Adeno-Associated Virus Serotype 8 by Hydrogen/Deuterium Exchange Mass Spectrometry. Viruses. 2024; 16(4):585. https://doi.org/10.3390/v16040585
Chicago/Turabian StyleIkeda, Tomohiko, Yuki Yamaguchi, Hiroaki Oyama, Aoba Matsushita, Yasuo Tsunaka, Mitsuko Fukuhara, Tetsuo Torisu, and Susumu Uchiyama. 2024. "Higher-Order Structure of Adeno-Associated Virus Serotype 8 by Hydrogen/Deuterium Exchange Mass Spectrometry" Viruses 16, no. 4: 585. https://doi.org/10.3390/v16040585
APA StyleIkeda, T., Yamaguchi, Y., Oyama, H., Matsushita, A., Tsunaka, Y., Fukuhara, M., Torisu, T., & Uchiyama, S. (2024). Higher-Order Structure of Adeno-Associated Virus Serotype 8 by Hydrogen/Deuterium Exchange Mass Spectrometry. Viruses, 16(4), 585. https://doi.org/10.3390/v16040585