
Natural Killer Cells Do Not Attenuate a Mouse-Adapted SARS-CoV-2-Induced Disease in Rag2−/− Mice
 , , , , , , and
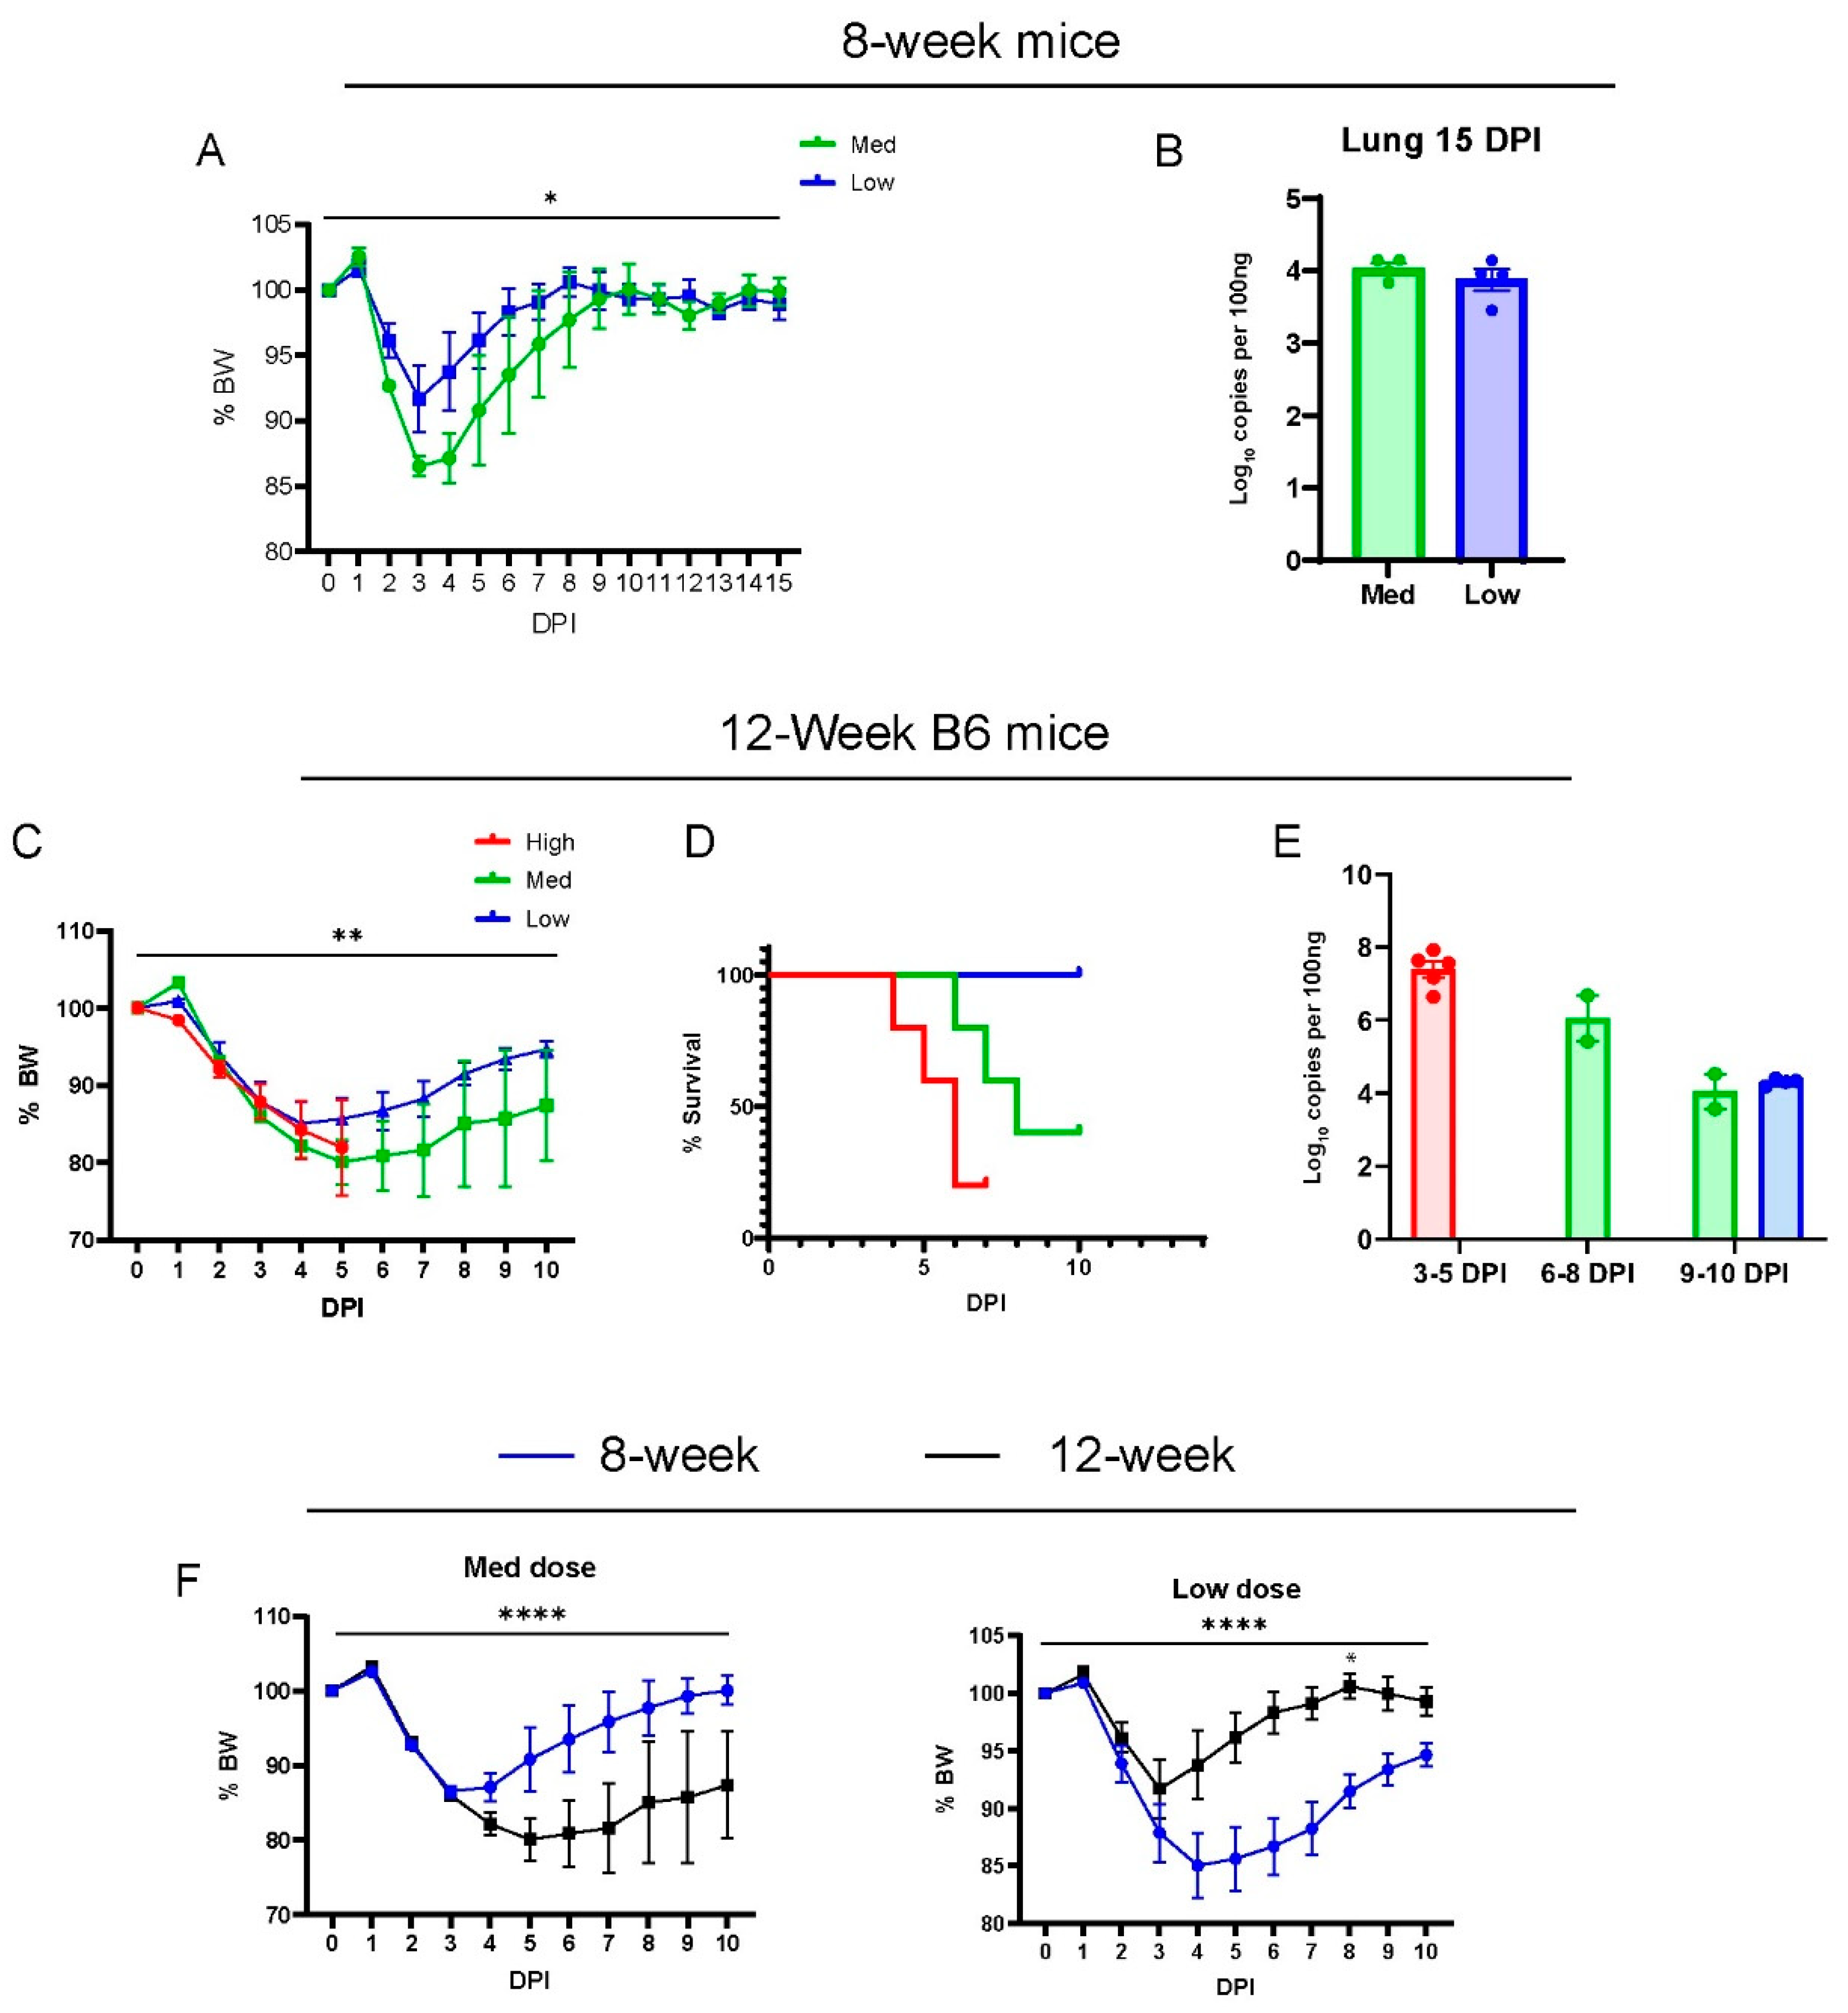
Abstract
:1. Introduction
2. Methods
2.1. Ethical Compliance and Animal Models
2.2. Inoculation with SARS-CoV-2
2.3. NK Cell Depletion
2.4. Histopathological Examination
2.5. Detection of Viral RNA
2.6. Immunohistochemical Staining
2.7. Illumina Total RNA Library Prep, Sequencing, and Analysis
2.8. Preparation of Single Cells from Mouse and Flow Cytometry
2.9. Statistics
3. Results
3.1. MA30-Infected B6 Mice Recapitulate the COVID-19 Phenotype
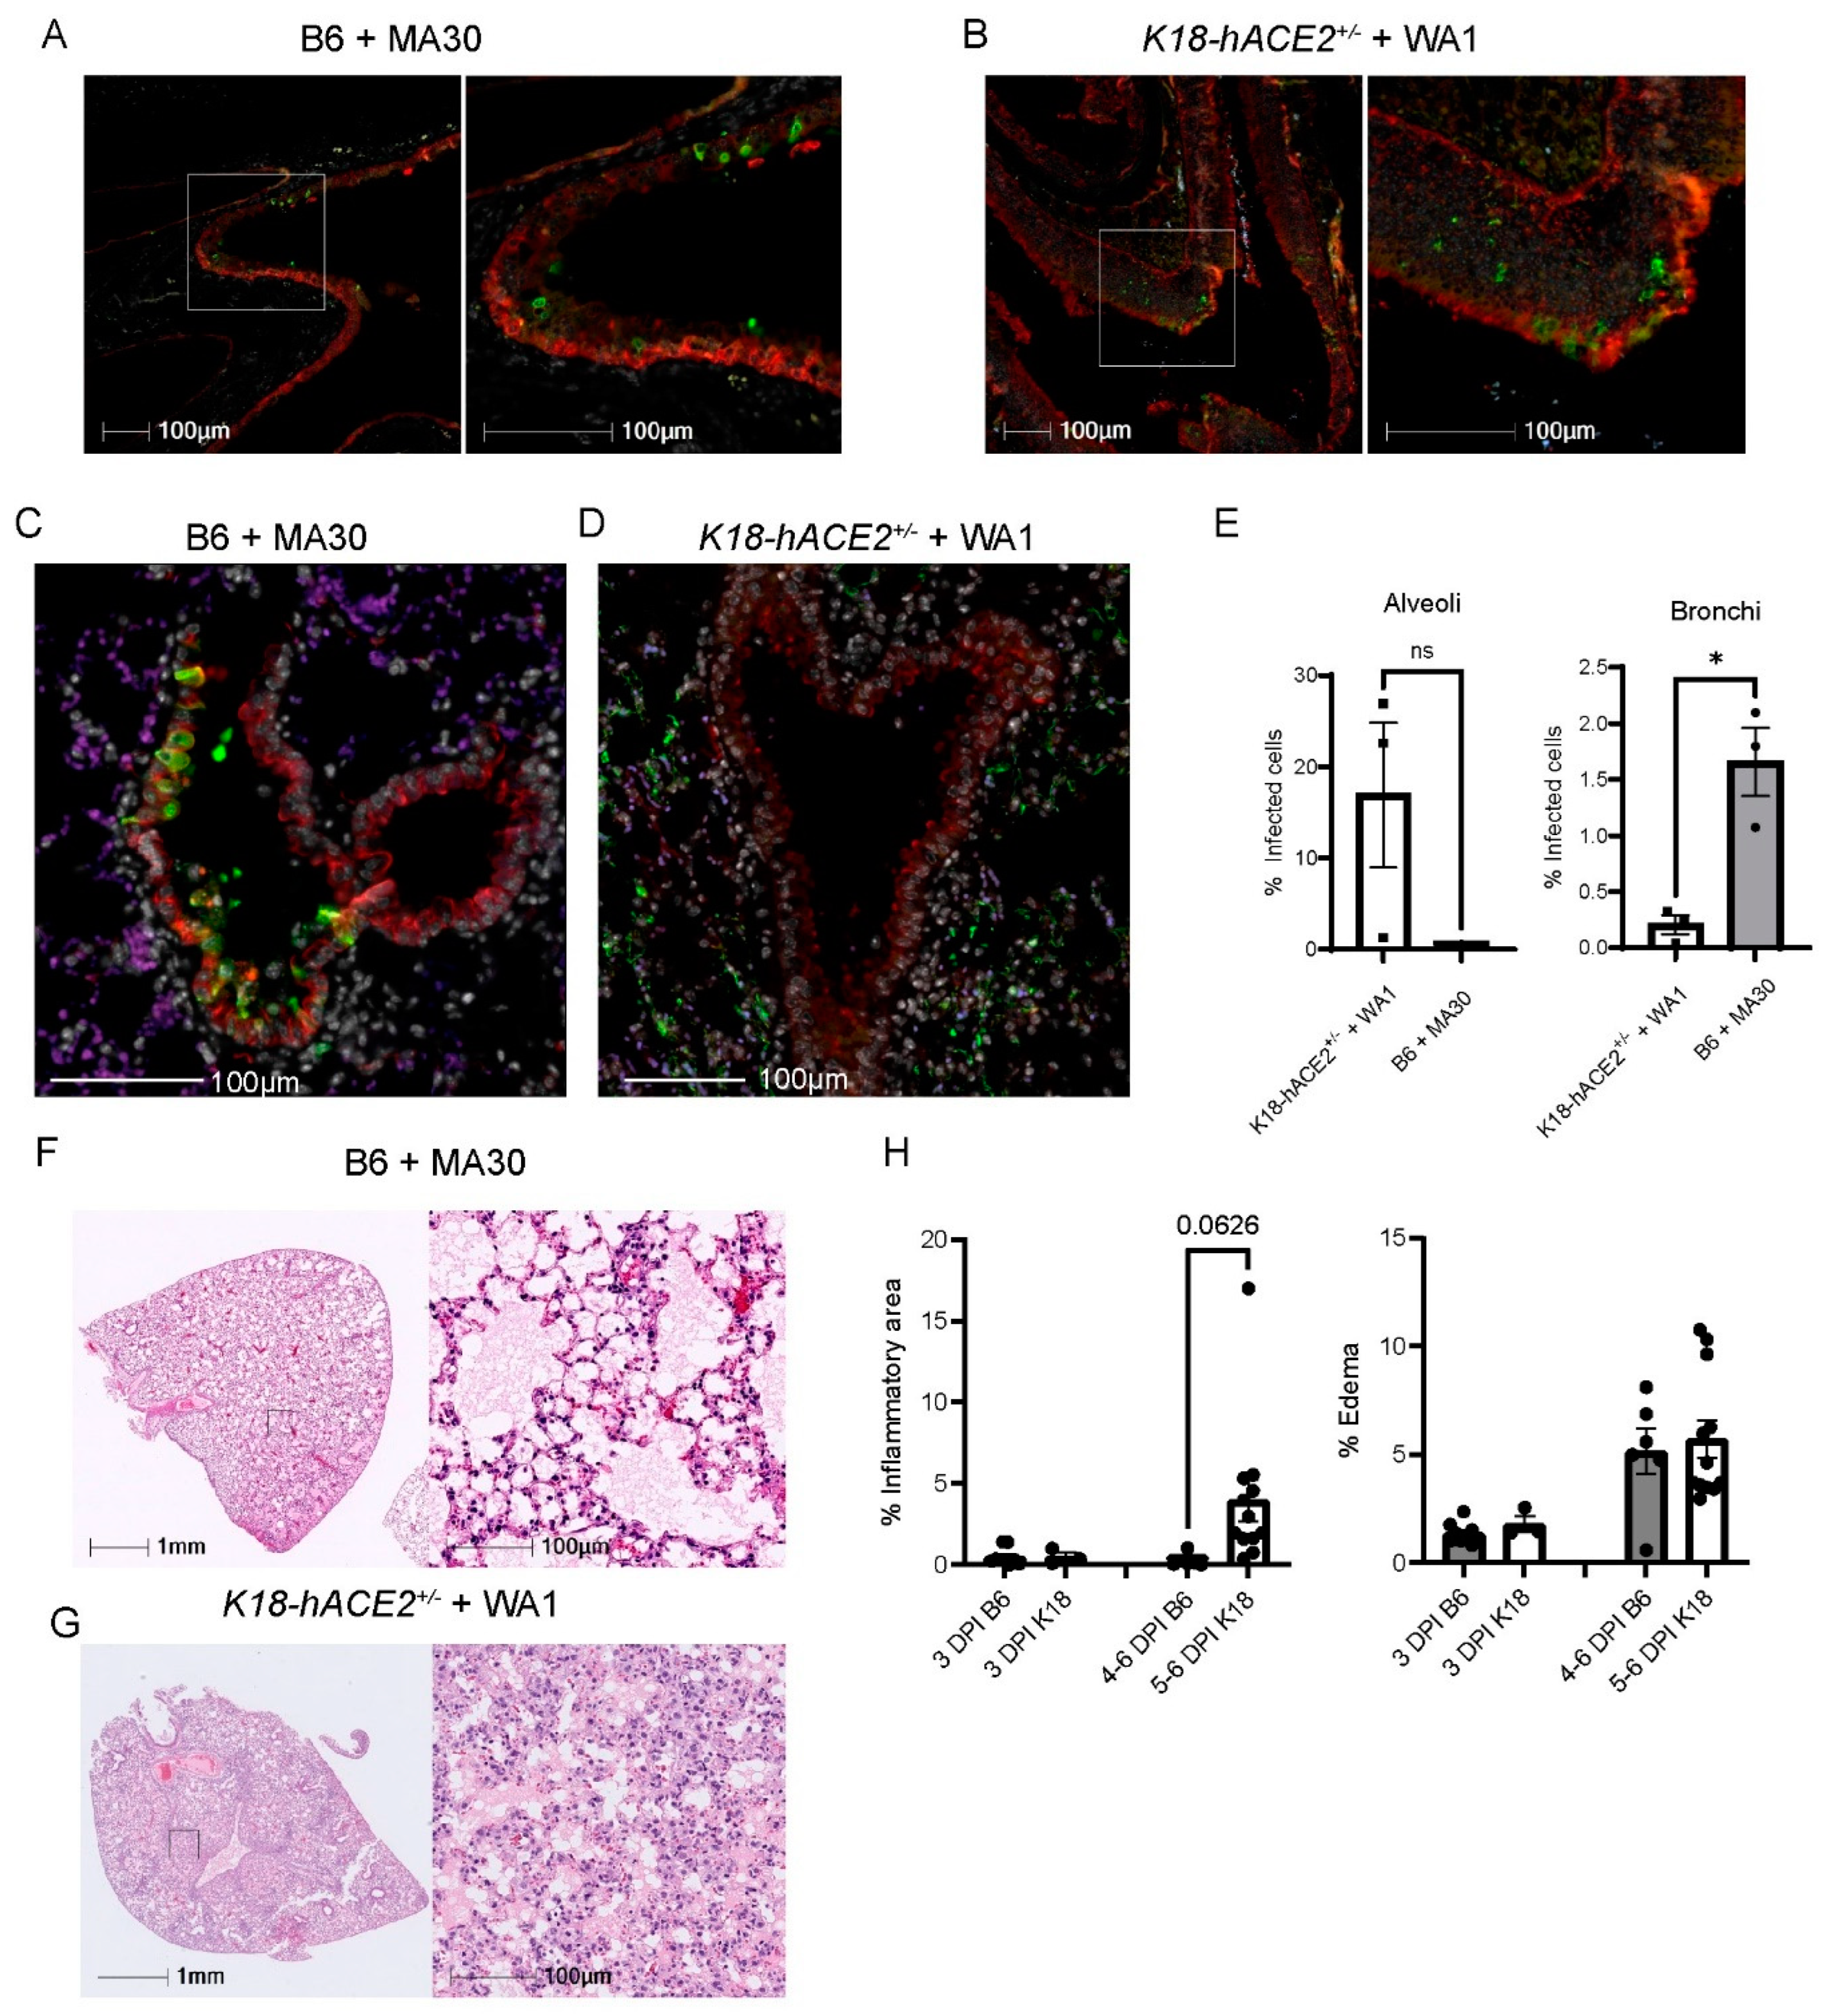
3.2. Comparison of MA30 vs. the K18-hACE2 SARS-CoV-2-WA1 Model
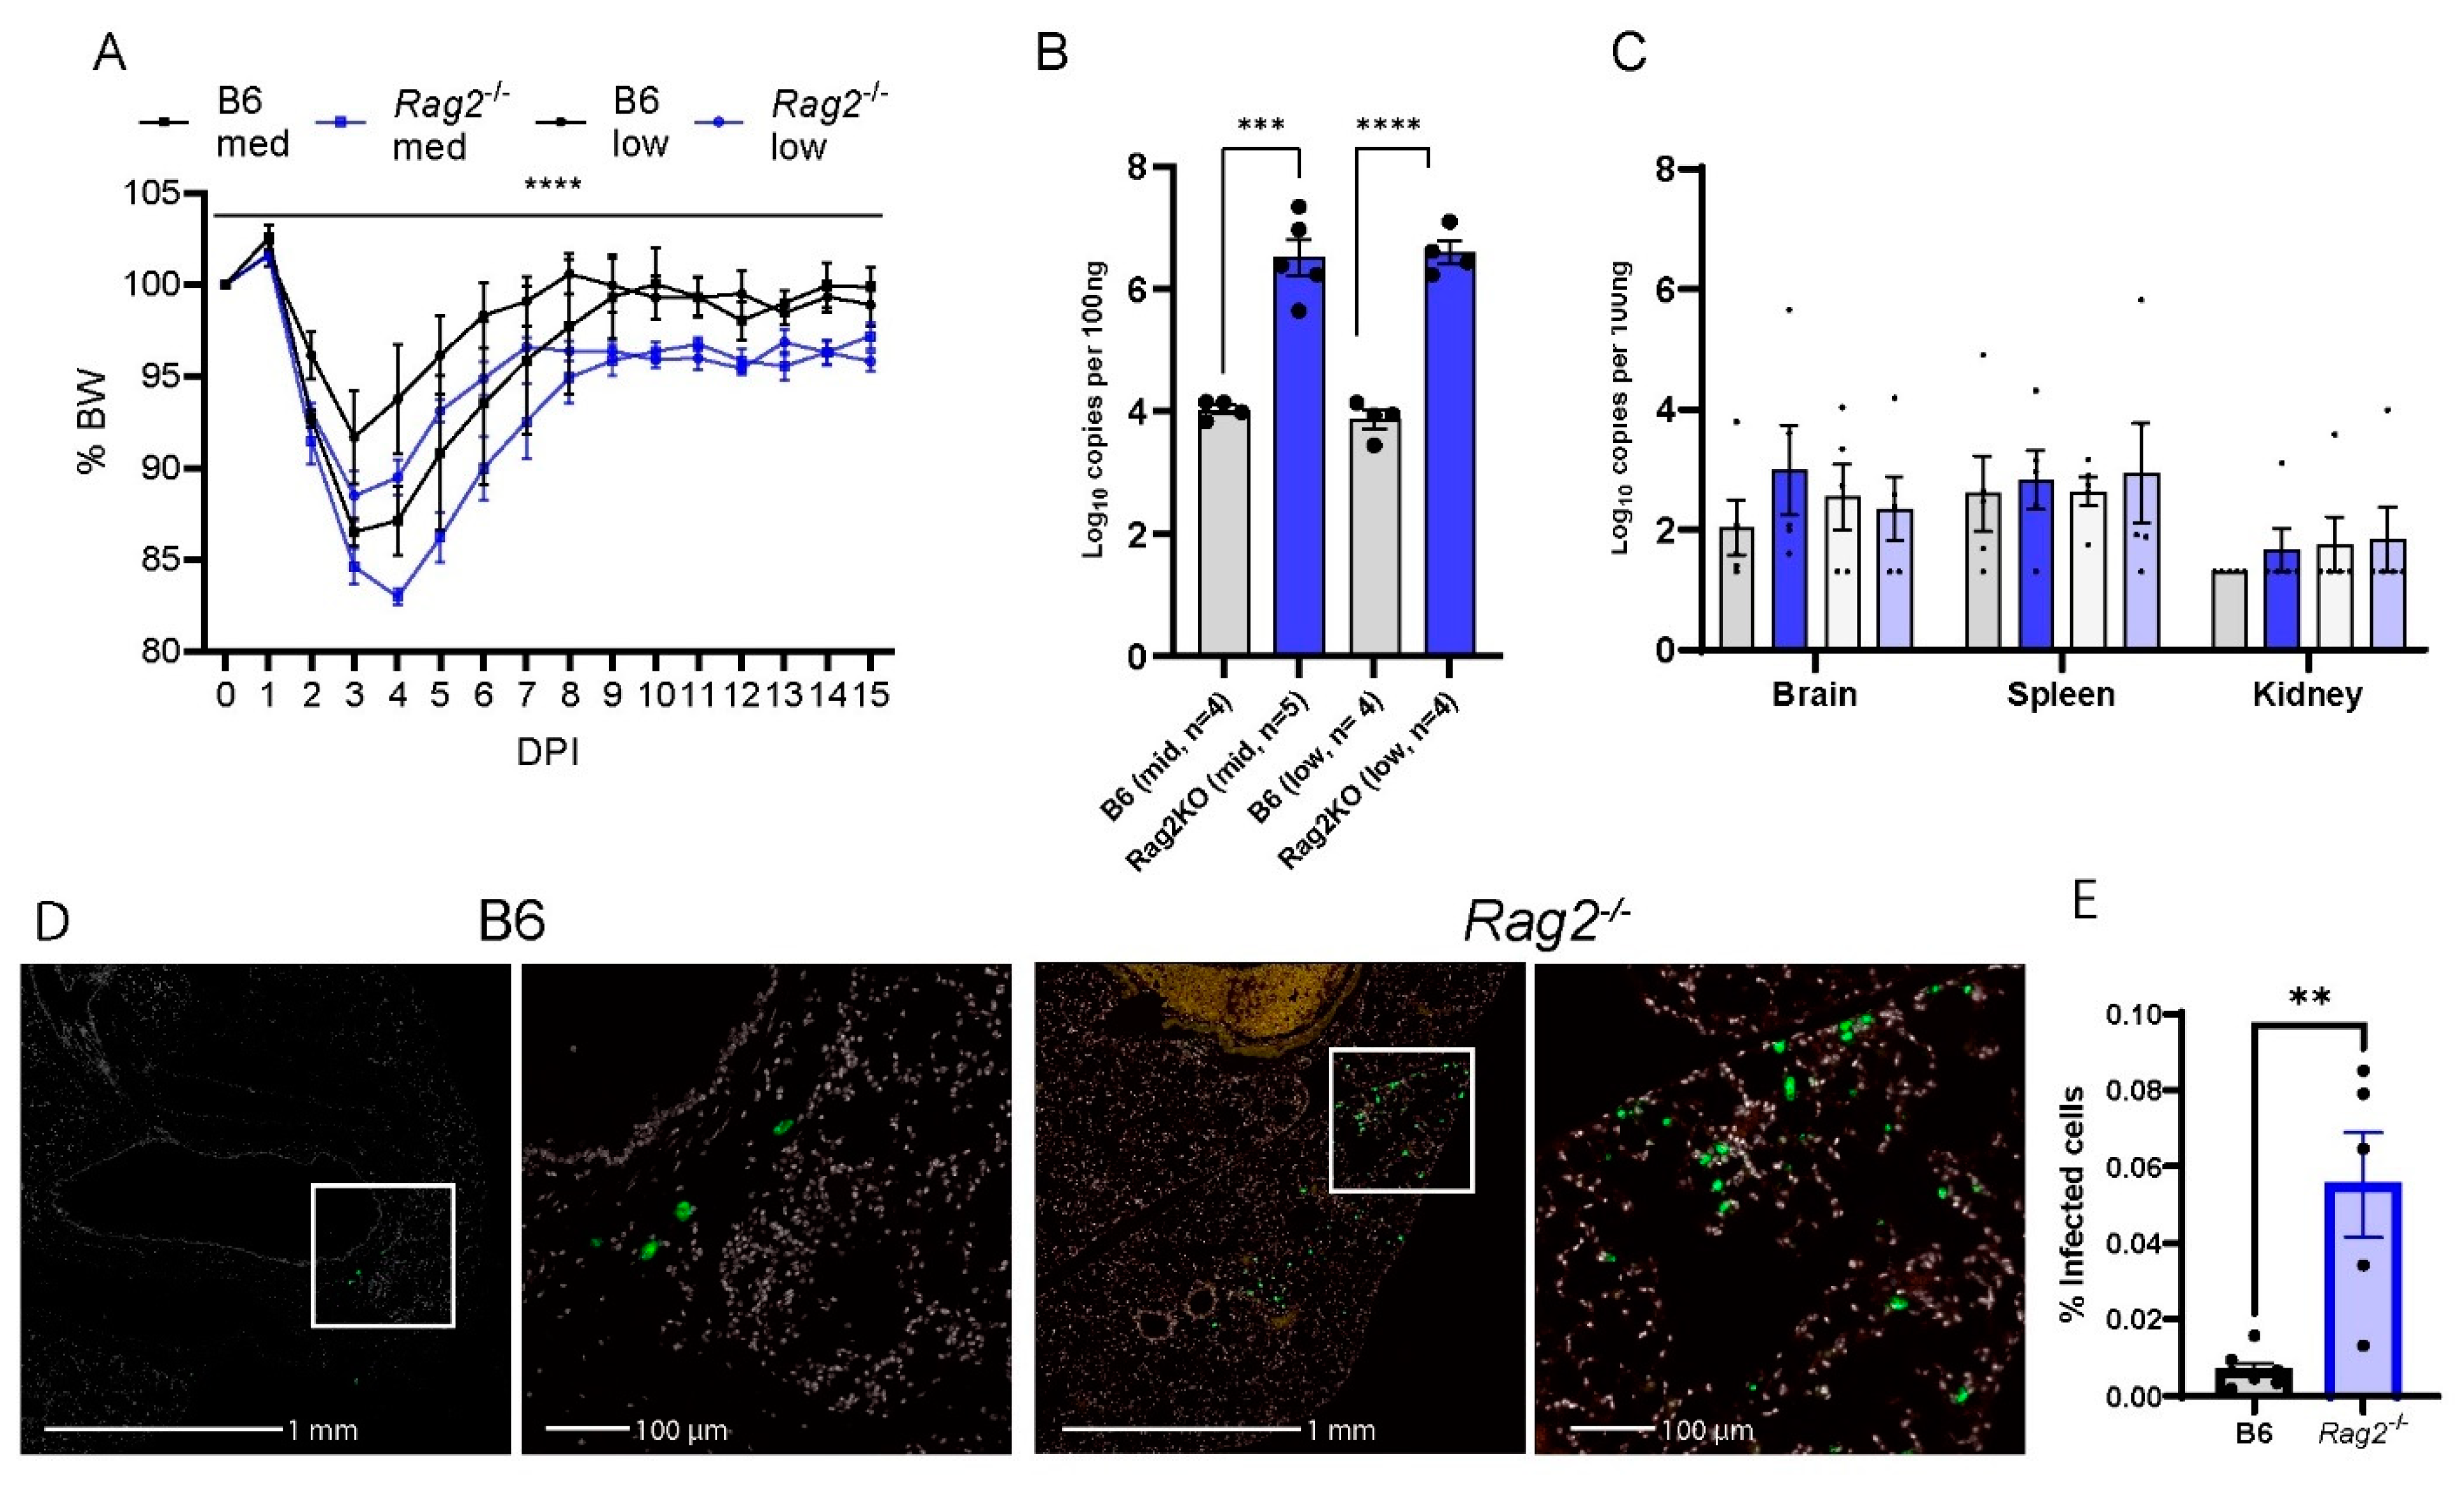
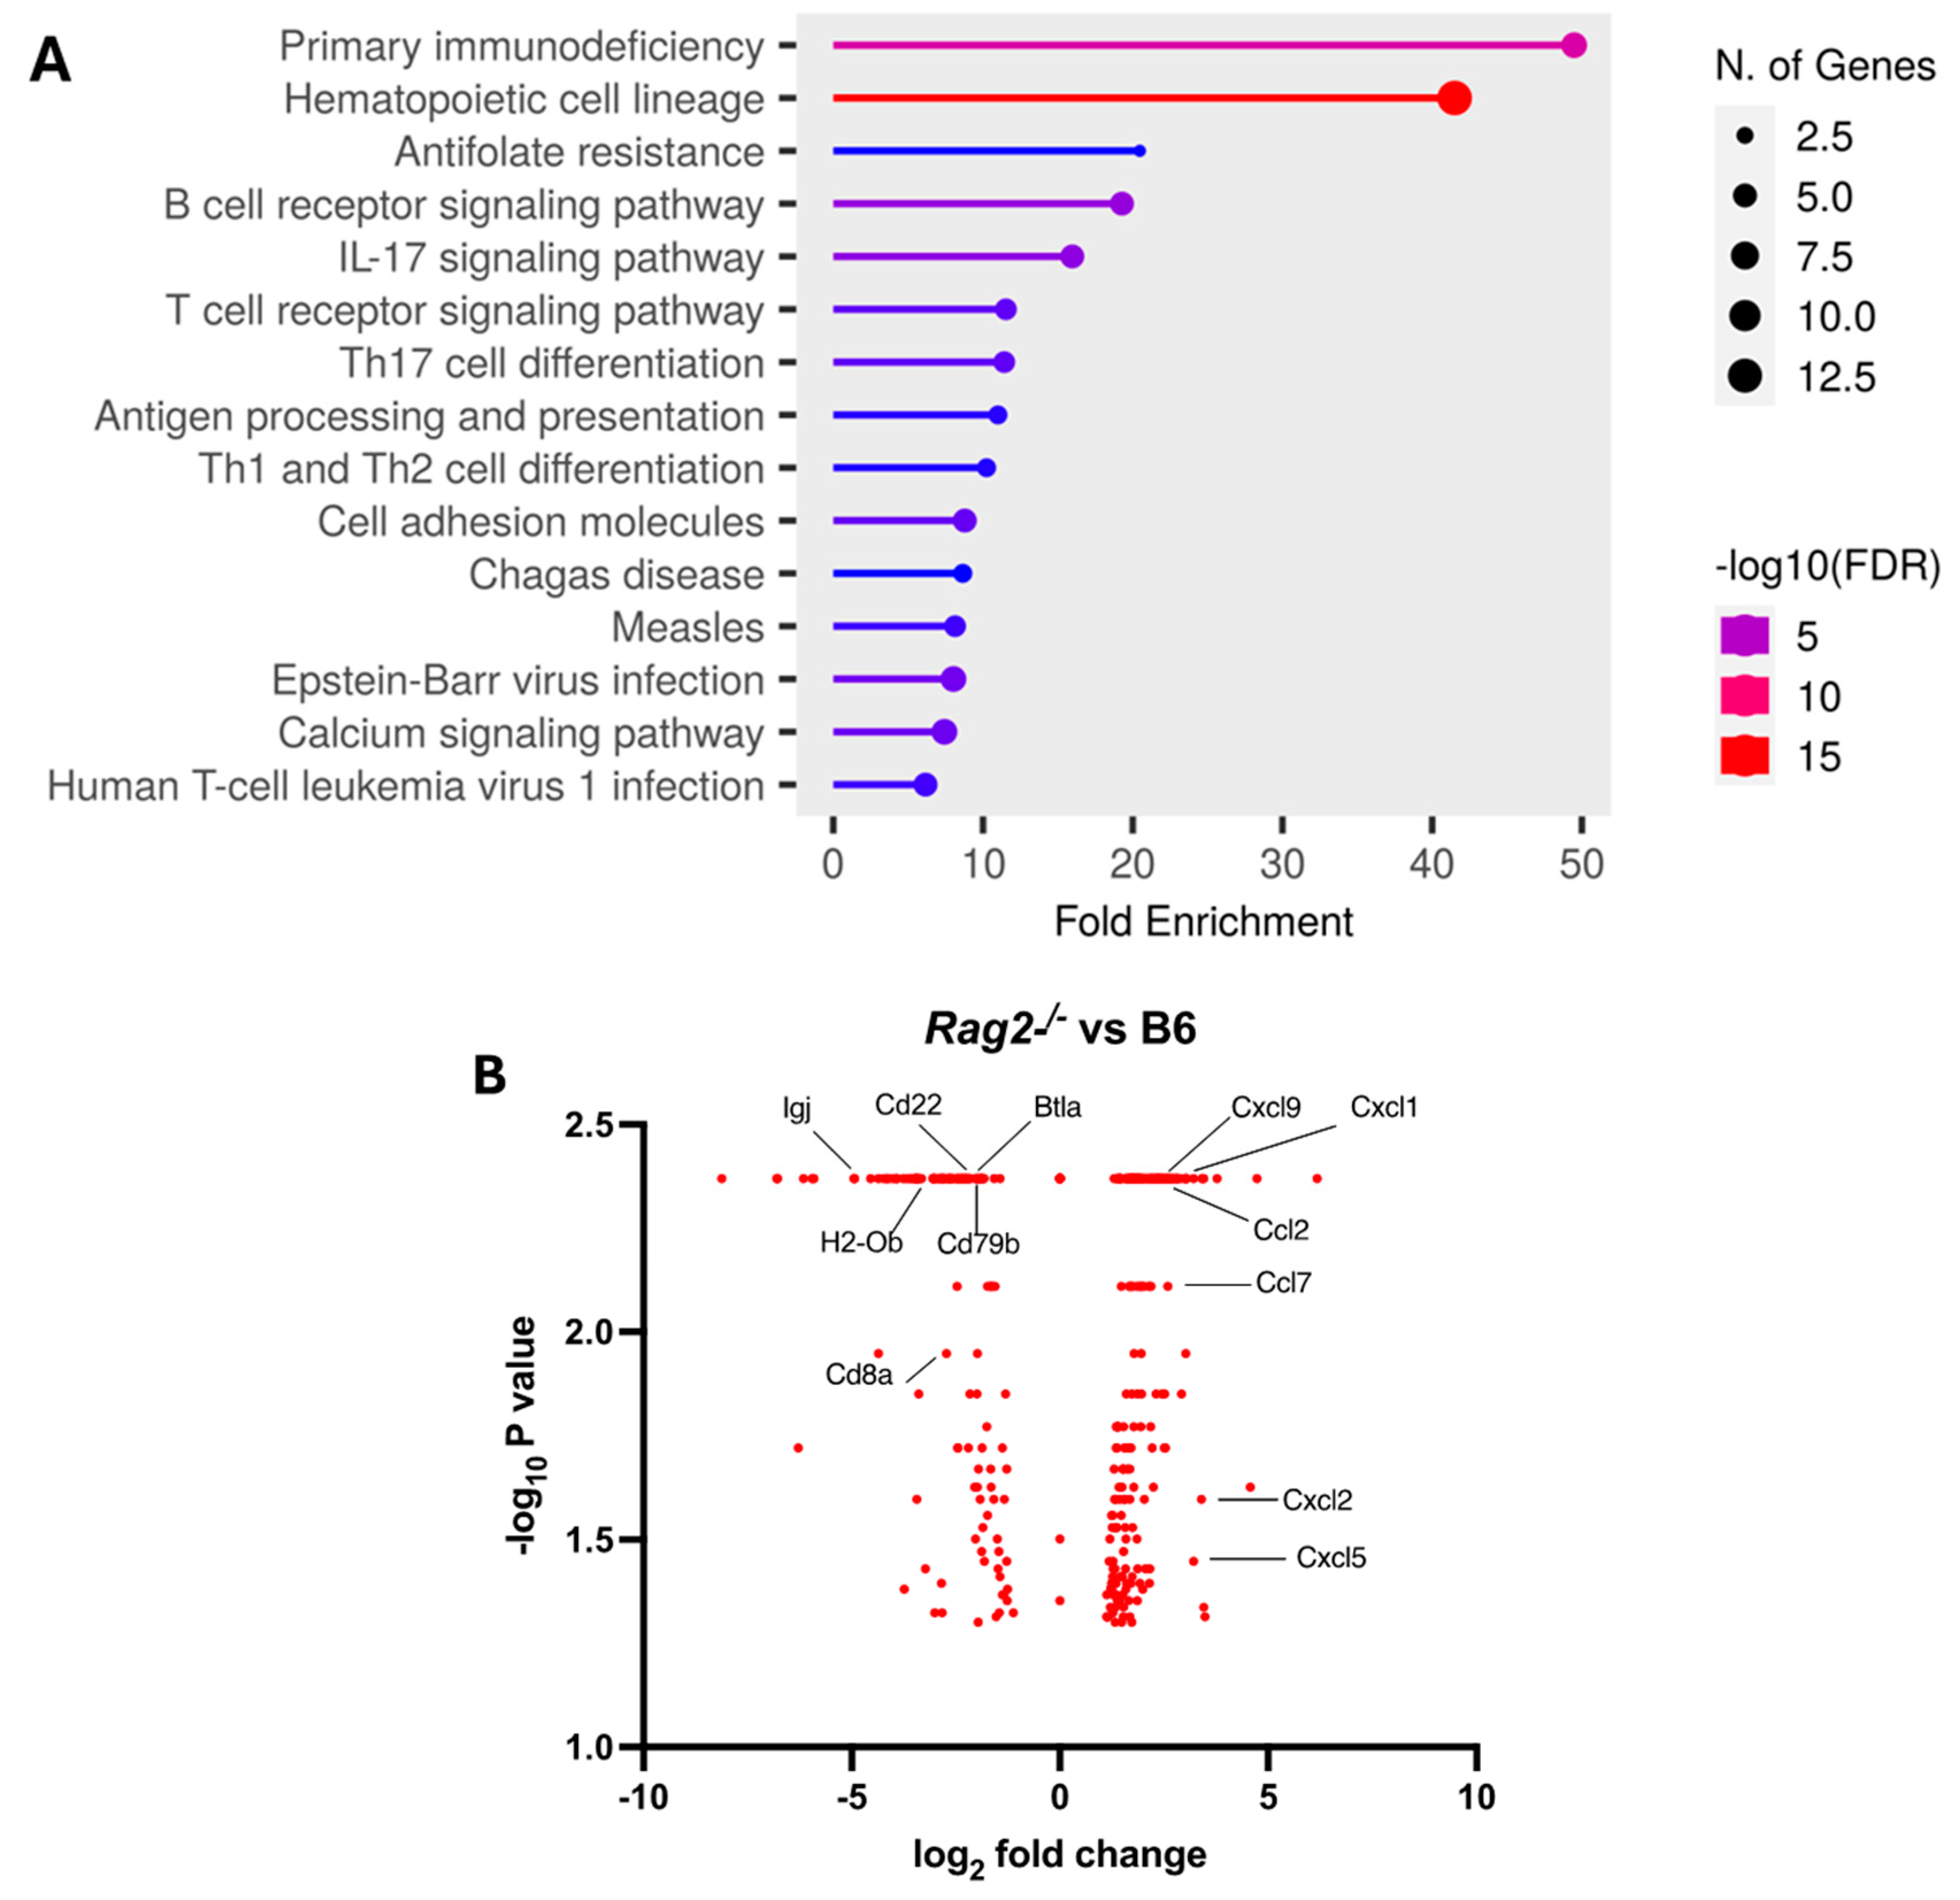
3.3. Deficiency of Rag2 Accelerates MA30-Induced Disease in Mice
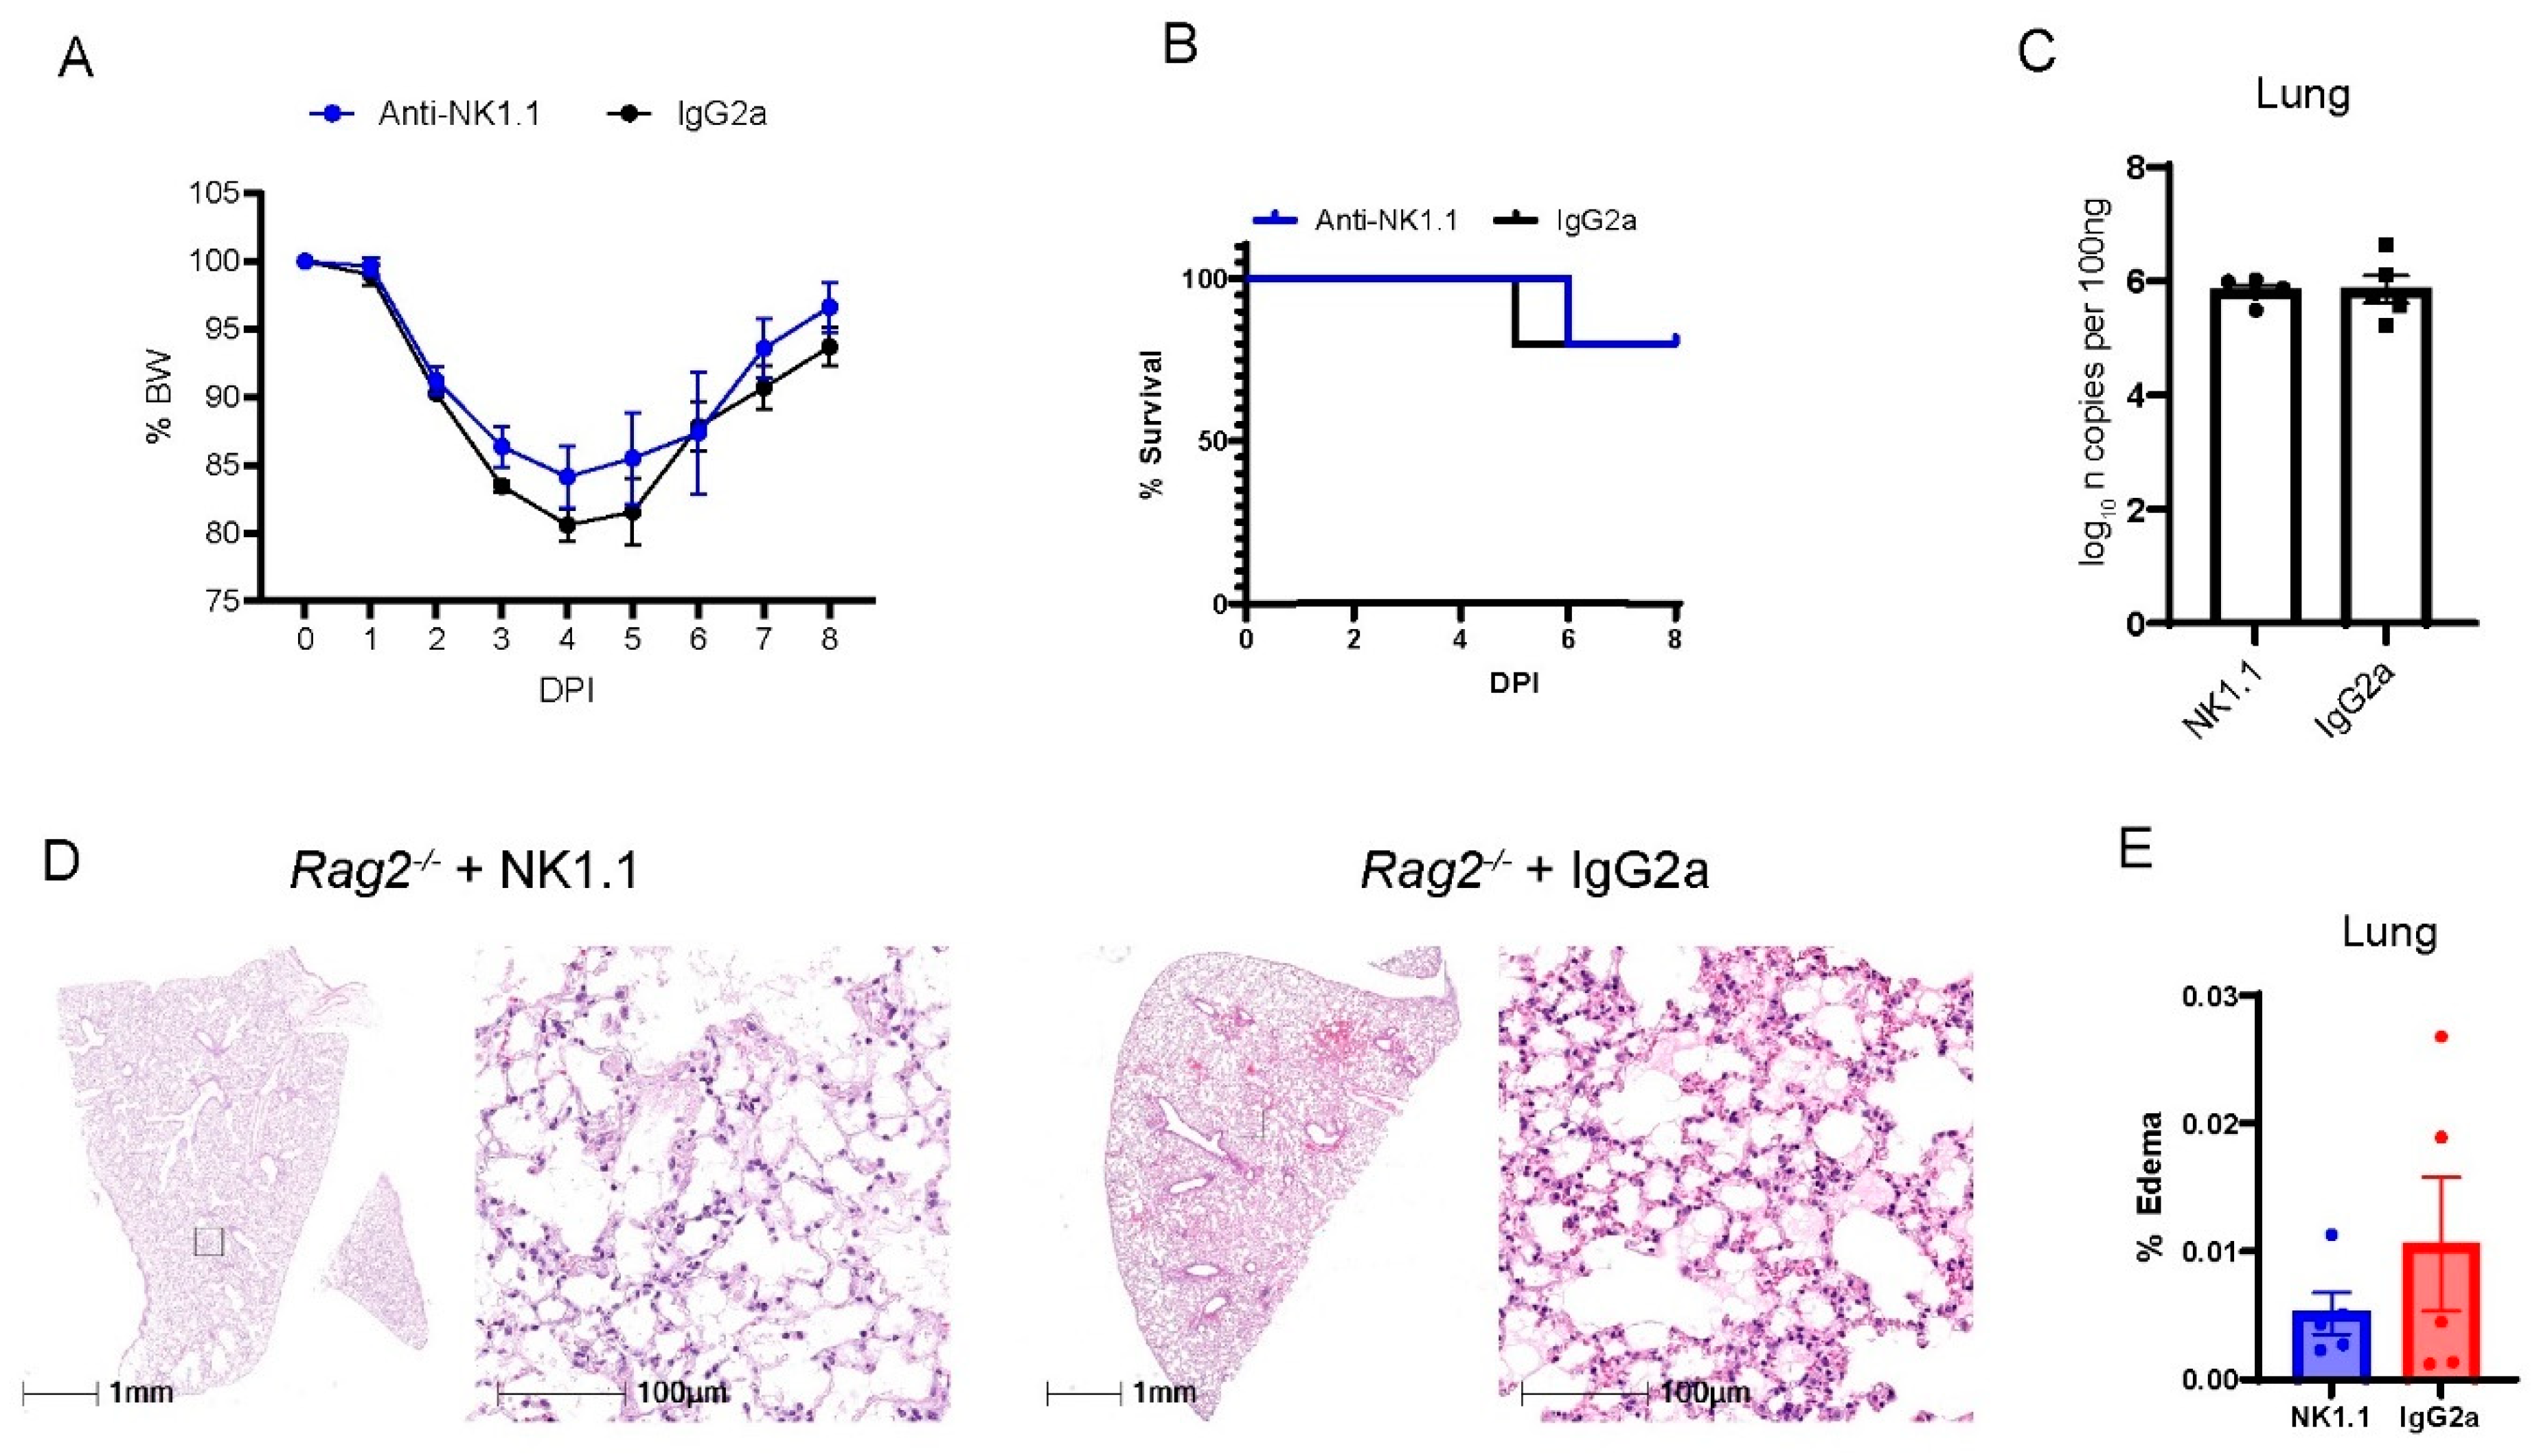
3.4. Depletion of NK Cells in Rag2−/− Mice Did Not Accelerate MA30-Induced Severe Disease
4. Discussion
Supplementary Materials
Author Contributions
Funding
Institutional Review Board Statement
Informed Consent Statement
Data Availability Statement
Acknowledgments
Conflicts of Interest
References
- Hadj Hassine, I. COVID-19 vaccines and variants of concern: A review. Rev. Med. Virol. 2022, 32, e2313. [Google Scholar] [CrossRef] [PubMed]
- Fernandes, Q.; Inchakalody, V.P.; Merhi, M.; Mestiri, S.; Taib, N.; Moustafa Abo El-Ella, D.; Bedhiafi, T.; Raza, A.; Al-Zaidan, L.; Mohsen, M.O.; et al. Emerging COVID-19 variants and their impact on SARS-CoV-2 diagnosis, therapeutics and vaccines. Ann. Med. 2022, 54, 524–540. [Google Scholar] [CrossRef] [PubMed]
- Zeng, B.; Gao, L.; Zhou, Q.; Yu, K.; Sun, F. Effectiveness of COVID-19 vaccines against SARS-CoV-2 variants of concern: A systematic review and meta-analysis. BMC Med. 2022, 20, 200. [Google Scholar] [CrossRef] [PubMed]
- Diamond, M.S.; Kanneganti, T.-D. Innate immunity: The first line of defense against SARS-CoV-2. Nat. Immunol. 2022, 23, 165–176. [Google Scholar] [CrossRef] [PubMed]
- Malahe, S.R.K.; Hoek, R.A.S.; Dalm, V.; Broers, A.E.C.; den Hoed, C.M.; Manintveld, O.C.; Baan, C.C.; van Deuzen, C.M.; Papageorgiou, G.; Bax, H.I.; et al. Clinical Characteristics and Outcomes of Immunocompromised Patients with Coronavirus Disease 2019 Caused by the Omicron Variant: A Prospective, Observational Study. Clin. Infect. Dis. 2023, 76, e172–e178. [Google Scholar] [CrossRef]
- Smits, P.D.; Gratzl, S.; Simonov, M.; Nachimuthu, S.K.; Goodwin Cartwright, B.M.; Wang, M.D.; Baker, C.; Rodriguez, P.; Bogiages, M.; Althouse, B.M.; et al. Risk of COVID-19 breakthrough infection and hospitalization in individuals with comorbidities. Vaccine 2023, 41, 2447–2455. [Google Scholar] [CrossRef]
- Wang, W.; Kaelber, D.C.; Xu, R.; Berger, N.A. Breakthrough SARS-CoV-2 Infections, Hospitalizations, and Mortality in Vaccinated Patients with Cancer in the US Between December 2020 and November 2021. JAMA Oncol. 2022, 8, 1027–1034. [Google Scholar] [CrossRef]
- Ben Fredj, S.; Ghammem, R.; Zammit, N.; Maatouk, A.; Haddad, N.; Haddad, N.; Kachroudi, M.; Rebai, S.; Laadhari, H.; Ghodhbani, M.M.; et al. Risk factors for severe COVID-19 breakthrough infections: An observational longitudinal study. BMC Infect. Dis. 2022, 22, 894. [Google Scholar] [CrossRef] [PubMed]
- Barnes, E.; Goodyear, C.S.; Willicombe, M.; Gaskell, C.; Siebert, S.; I de Silva, T.; Murray, S.M.; Rea, D.; Snowden, J.A.; Carroll, M.; et al. SARS-CoV-2-specific immune responses and clinical outcomes after COVID-19 vaccination in patients with immune-suppressive disease. Nat. Med. 2023, 29, 1760–1774. [Google Scholar] [CrossRef]
- Neumann, G.; Kawaoka, Y. Which Virus Will Cause the Next Pandemic? Viruses 2023, 15, 199. [Google Scholar] [CrossRef]
- Mansourabadi, A.H.; Aghamajidi, A.; Dorfaki, M.; Keshavarz, F.; Shafeghat, Z.; Moazzeni, A.; Arab, F.L.; Rajabian, A.; Roozbehani, M.; Falak, R.; et al. B lymphocytes in COVID-19, a tale of harmony and discordance. Arch. Virol. 2023, 168, 148. [Google Scholar] [CrossRef] [PubMed]
- Rezaei, M.; Marjani, M.; Mahmoudi, S.; Mortaz, E.; Mansouri, D. Dynamic Changes of Lymphocyte Subsets in the Course of COVID-19. Int. Arch. Allergy Immunol. 2021, 182, 254–262. [Google Scholar] [CrossRef] [PubMed]
- Moss, P. The T cell immune response against SARS-CoV-2. Nat. Immunol. 2022, 23, 186–193. [Google Scholar] [CrossRef]
- Qi, H.; Liu, B.; Wang, X.; Zhang, L. The humoral response and antibodies against SARS-CoV-2 infection. Nat. Immunol. 2022, 23, 1008–1020. [Google Scholar] [CrossRef]
- Apostolidis, S.A.; Kakara, M.; Painter, M.M.; Goel, R.R.; Mathew, D.; Lenzi, K.; Rezk, A.; Patterson, K.R.; Espinoza, D.A.; Kadri, J.C.; et al. Cellular and humoral immune responses following SARS-CoV-2 mRNA vaccination in patients with multiple sclerosis on anti-CD20 therapy. Nat. Med. 2021, 27, 1990–2001. [Google Scholar] [CrossRef] [PubMed]
- Riise, J.; Meyer, S.; Blaas, I.; Chopra, A.; Tran, T.T.; Delic-Sarac, M.; Hestdalen, M.L.; Brodin, E.; Rustad, E.H.; Dai, K.Z.; et al. Rituximab-treated patients with lymphoma develop strong CD8 T-cell responses following COVID-19 vaccination. Br. J. Haematol. 2022, 197, 697–708. [Google Scholar] [CrossRef] [PubMed]
- Shree, T. Can B cell-deficient patients rely on COVID-19 vaccine-induced T-cell immunity? Br. J. Haematol. 2022, 197, 659–661. [Google Scholar] [CrossRef]
- Woodruff, M.C.; Ramonell, R.P.; Nguyen, D.C.; Cashman, K.S.; Saini, A.S.; Haddad, N.S.; Ley, A.M.; Kyu, S.; Howell, J.C.; Ozturk, T.; et al. Extrafollicular B cell responses correlate with neutralizing antibodies and morbidity in COVID-19. Nat. Immunol. 2020, 21, 1506–1516. [Google Scholar] [CrossRef]
- Maucourant, C.; Filipovic, I.; Ponzetta, A.; Aleman, S.; Cornillet, M.; Hertwig, L.; Strunz, B.; Lentini, A.; Reinius, B.; Brownlie, D.; et al. Natural killer cell immunotypes related to COVID-19 disease severity. Sci. Immunol. 2020, 5, eabd6832. [Google Scholar] [CrossRef]
- Lee, M.J.; Leong, M.W.; Rustagi, A.; Beck, A.; Zeng, L.; Holmes, S.; Qi, L.S.; Blish, C.A. SARS-CoV-2 escapes direct NK cell killing through Nsp1-mediated downregulation of ligands for NKG2D. Cell Rep. 2022, 41, 111892. [Google Scholar] [CrossRef]
- Witkowski, M.; Tizian, C.; Ferreira-Gomes, M.; Niemeyer, D.; Jones, T.C.; Heinrich, F.; Frischbutter, S.; Angermair, S.; Hohnstein, T.; Mattiola, I.; et al. Untimely TGFβ responses in COVID-19 limit antiviral functions of NK cells. Nature 2021, 600, 295–301. [Google Scholar] [CrossRef] [PubMed]
- Wong, L.-Y.R.; Zheng, J.; Wilhelmsen, K.; Li, K.; Ortiz, M.E.; Schnicker, N.J.; Thurman, A.; Pezzulo, A.A.; Szachowicz, P.J.; Li, P.; et al. Eicosanoid signalling blockade protects middle-aged mice from severe COVID-19. Nature 2022, 605, 146–151. [Google Scholar] [CrossRef] [PubMed]
- Hao, Z.; Rajewsky, K. Homeostasis of peripheral B cells in the absence of B cell influx from the bone marrow. J. Exp. Med. 2001, 194, 1151–1164. [Google Scholar] [CrossRef] [PubMed]
- Qin, Z.; Liu, F.; Blair, R.; Wang, C.; Yang, H.; Mudd, J.; Currey, J.M.; Iwanaga, N.; He, J.; Mi, R.; et al. Endothelial cell infection and dysfunction, immune activation in severe COVID-19. Theranostics 2021, 11, 8076–8091. [Google Scholar] [CrossRef] [PubMed]
- McCray, P.B., Jr.; Pewe, L.; Wohlford-Lenane, C.; Hickey, M.; Manzel, L.; Shi, L.; Netland, J.; Jia, H.P.; Halabi, C.; Sigmund, C.D.; et al. Lethal infection of K18-hACE2 mice infected with severe acute respiratory syndrome coronavirus. J. Virol. 2007, 81, 813–821. [Google Scholar] [CrossRef] [PubMed]
- Liu, F.; Han, K.; Blair, R.; Kenst, K.; Qin, Z.; Upcin, B.; Wörsdörfer, P.; Midkiff, C.C.; Mudd, J.; Belyaeva, E.; et al. SARS-CoV-2 Infects Endothelial Cells In Vivo and In Vitro. Front. Cell Infect. Microbiol. 2021, 11, 701278. [Google Scholar] [CrossRef]
- Han, K.; Blair, R.V.; Iwanaga, N.; Liu, F.; Russell-Lodrigue, K.E.; Qin, Z.; Midkiff, C.C.; Golden, N.A.; Doyle-Meyers, L.A.; Kabir, M.E.; et al. Lung Expression of Human Angiotensin-Converting Enzyme 2 Sensitizes the Mouse to SARS-CoV-2 Infection. Am. J. Respir. Cell Mol. Biol. 2021, 64, 79–88. [Google Scholar] [CrossRef] [PubMed]
- Ge, S.X.; Jung, D.; Yao, R. ShinyGO: A graphical gene-set enrichment tool for animals and plants. Bioinformatics 2020, 36, 2628–2629. [Google Scholar] [CrossRef]
- Liu, F.; Dai, S.; Feng, D.; Qin, Z.; Peng, X.; Sakamuri, S.; Ren, M.; Huang, L.; Cheng, M.; Mohammad, K.E.; et al. Distinct fate, dynamics and niches of renal macrophages of bone marrow or embryonic origins. Nat. Commun. 2020, 11, 2280. [Google Scholar] [CrossRef]
- Perera, R.; Tso, E.; Tsang, O.T.Y.; Tsang, D.N.C.; Fung, K.; Leung, Y.W.Y.; Chin, A.W.H.; Chu, D.K.W.; Cheng, S.M.S.; Poon, L.L.M.; et al. SARS-CoV-2 Virus Culture and Subgenomic RNA for Respiratory Specimens from Patients with Mild Coronavirus Disease. Emerg. Infect. Dis. 2020, 26, 2701–2704. [Google Scholar] [CrossRef]
- Iwanaga, N.; Cooper, L.; Rong, L.; Maness, N.J.; Beddingfield, B.; Qin, Z.; Crabtree, J.; Tripp, R.A.; Yang, H.; Blair, R.; et al. ACE2-IgG1 fusions with improved in vitro and in vivo activity against SARS-CoV-2. iScience 2022, 25, 103670. [Google Scholar] [CrossRef] [PubMed]
- Khatun, M.S.; Remcho, T.P.; Qin, X.; Kolls, J.K. Cell-intrinsic and -extrinsic effects of SARS-CoV-2 RNA on pathogenesis: Single-cell meta-analysis. mSphere 2023, 8, e0037523. [Google Scholar] [CrossRef]
- Izadpanah, A.; Mudd, J.C.; Garcia, J.G.N.; Srivastav, S.; Abdel-Mohsen, M.; Palmer, C.; Goldman, A.R.; Kolls, J.K.; Qin, X.; Rappaport, J. SARS-CoV-2 infection dysregulates NAD metabolism. Front. Immunol. 2023, 14, 1158455. [Google Scholar] [CrossRef] [PubMed]
- Wang, C.; Khatun, M.S.; Zhang, Z.; Allen, M.J.; Chen, Z.; Ellsworth, C.R.; Currey, J.M.; Dai, G.; Tian, D.; Bach, K.; et al. COVID-19 and influenza infections mediate distinct pulmonary cellular and transcriptomic changes. Commun. Biol. 2023, 6, 1265. [Google Scholar] [CrossRef]
- Dong, W.; Mead, H.; Tian, L.; Park, J.G.; Garcia, J.I.; Jaramillo, S.; Barr, T.; Kollath, D.S.; Coyne, V.K.; Stone, N.E.; et al. The K18-Human ACE2 Transgenic Mouse Model Recapitulates Non-severe and Severe COVID-19 in Response to an Infectious Dose of the SARS-CoV-2 Virus. J. Virol. 2022, 96, e0096421. [Google Scholar] [CrossRef]
- Sadofsky, M.J. The RAG proteins in V(D)J recombination: More than just a nuclease. Nucleic Acids Res. 2001, 29, 1399–1409. [Google Scholar] [CrossRef] [PubMed]
- Vivier, E.; Raulet, D.H.; Moretta, A.; Caligiuri, M.A.; Zitvogel, L.; Lanier, L.L.; Yokoyama, W.M.; Ugolini, S. Innate or adaptive immunity? The example of natural killer cells. Science 2011, 331, 44–49. [Google Scholar] [CrossRef]
- Malengier-Devlies, B.; Filtjens, J.; Ahmadzadeh, K.; Boeckx, B.; Vandenhaute, J.; De Visscher, A.; Bernaerts, E.; Mitera, T.; Jacobs, C.; Vanderbeke, L.; et al. Severe COVID-19 patients display hyper-activated NK cells and NK cell-platelet aggregates. Front. Immunol. 2022, 13, 861251. [Google Scholar] [CrossRef]
- Zhou, Z.; Ren, L.; Zhang, L.; Zhong, J.; Xiao, Y.; Jia, Z.; Guo, L.; Yang, J.; Wang, C.; Jiang, S.; et al. Heightened Innate Immune Responses in the Respiratory Tract of COVID-19 Patients. Cell Host Microbe 2020, 27, 883–890.e882. [Google Scholar] [CrossRef] [PubMed]
- Iwanaga, N.; Sandquist, I.; Wanek, A.; McCombs, J.; Song, K.; Kolls, J.K. Host immunology and rational immunotherapy for carbapenem-resistant Klebsiella pneumoniae infection. JCI Insight 2020, 5, e135591. [Google Scholar] [CrossRef]
- Glasner, A.; Levi, A.; Enk, J.; Isaacson, B.; Viukov, S.; Orlanski, S.; Scope, A.; Neuman, T.; Enk, C.D.; Hanna, J.H.; et al. NKp46 Receptor-Mediated Interferon-γ Production by Natural Killer Cells Increases Fibronectin 1 to Alter Tumor Architecture and Control Metastasis. Immunity 2018, 48, 107–119.e104. [Google Scholar] [CrossRef]
- Moynihan, K.D.; Opel, C.F.; Szeto, G.L.; Tzeng, A.; Zhu, E.F.; Engreitz, J.M.; Williams, R.T.; Rakhra, K.; Zhang, M.H.; Rothschilds, A.M.; et al. Eradication of large established tumors in mice by combination immunotherapy that engages innate and adaptive immune responses. Nat. Med. 2016, 22, 1402–1410. [Google Scholar] [CrossRef] [PubMed]
- Anker, M.S.; Landmesser, U.; von Haehling, S.; Butler, J.; Coats, A.J.S.; Anker, S.D. Weight loss, malnutrition, and cachexia in COVID-19, facts and numbers. J. Cachexia Sarcopenia Muscle 2021, 12, 9–13. [Google Scholar] [CrossRef] [PubMed]
- Liu, J.; Li, Y.; Liu, Q.; Yao, Q.; Wang, X.; Zhang, H.; Chen, R.; Ren, L.; Min, J.; Deng, F.; et al. SARS-CoV-2 cell tropism and multiorgan infection. Cell Discov. 2021, 7, 17. [Google Scholar] [CrossRef] [PubMed]
- Sungnak, W.; Huang, N.; Bécavin, C.; Berg, M.; Queen, R.; Litvinukova, M.; Talavera-López, C.; Maatz, H.; Reichart, D.; Sampaziotis, F.; et al. SARS-CoV-2 entry factors are highly expressed in nasal epithelial cells together with innate immune genes. Nat. Med. 2020, 26, 681–687. [Google Scholar] [CrossRef] [PubMed]
- Schaefer, I.-M.; Padera, R.F.; Solomon, I.H.; Kanjilal, S.; Hammer, M.M.; Hornick, J.L.; Sholl, L.M. In Situ detection of SARS-CoV-2 in lungs and airways of patients with COVID-19. Mod. Pathol. 2020, 33, 2104–2114. [Google Scholar] [CrossRef]
- Jeong, H.; Woo Lee, Y.; Park, I.H.; Noh, H.; Kim, S.H.; Kim, J.; Jeon, D.; Jang, H.J.; Oh, J.; On, D.; et al. Comparison of the pathogenesis of SARS-CoV-2 infection in K18-hACE2 mouse and Syrian golden hamster models. Dis. Model. Mech. 2022, 15, dmm049632. [Google Scholar] [CrossRef] [PubMed]
- Bösmüller, H.; Matter, M.; Fend, F.; Tzankov, A. The pulmonary pathology of COVID-19. Virchows Arch. 2021, 478, 137–150. [Google Scholar] [CrossRef]
- Borczuk, A.C.; Salvatore, S.P.; Seshan, S.V.; Patel, S.S.; Bussel, J.B.; Mostyka, M.; Elsoukkary, S.; He, B.; Del Vecchio, C.; Fortarezza, F.; et al. COVID-19 pulmonary pathology: A multi-institutional autopsy cohort from Italy and New York City. Mod. Pathol. 2020, 33, 2156–2168. [Google Scholar] [CrossRef]
- Datta, P.K.; Liu, F.; Fischer, T.; Rappaport, J.; Qin, X. SARS-CoV-2 pandemic and research gaps: Understanding SARS-CoV-2 interaction with the ACE2 receptor and implications for therapy. Theranostics 2020, 10, 7448–7464. [Google Scholar] [CrossRef]
- Mikhaleva, L.; Chernayev, A.; Samsonova, M.; Zayratyants, O.; Kakturskiy, L.; Vasyukova, O.; Birukov, A.; Kontorshchikov, A.; Sorokina, A.; Sinelnikov, M. Pathological Features in 100 Deceased Patients with COVID-19 in Correlation with Clinical and Laboratory Data. Pathol. Oncol. Res. 2021, 27, 1609900. [Google Scholar] [CrossRef] [PubMed]
- Polak, S.B.; Van Gool, I.C.; Cohen, D.; von der Thüsen, J.H.; van Paassen, J. A systematic review of pathological findings in COVID-19, a pathophysiological timeline and possible mechanisms of disease progression. Mod. Pathol. 2020, 33, 2128–2138. [Google Scholar] [CrossRef] [PubMed]
- Hu, W.; Ferris, S.P.; Tweten, R.K.; Wu, G.; Radaeva, S.; Gao, B.; Bronson, R.T.; Halperin, J.A.; Qin, X. Rapid conditional targeted ablation of cells expressing human CD59 in transgenic mice by intermedilysin. Nat. Med. 2008, 14, 98–103. [Google Scholar] [CrossRef] [PubMed]
- Feng, D.; Dai, S.; Liu, F.; Ohtake, Y.; Zhou, Z.; Wang, H.; Zhang, Y.; Kearns, A.; Peng, X.; Zhu, F.; et al. Cre-inducible human CD59 mediates rapid cell ablation after intermedilysin administration. J. Clin. Investig. 2016, 126, 2321–2333. [Google Scholar] [CrossRef] [PubMed]
- Liu, F.; Dai, S.; Feng, D.; Peng, X.; Qin, Z.; Kearns, A.C.; Huang, W.; Chen, Y.; Ergun, S.; Wang, H.; et al. Versatile cell ablation tools and their applications to study loss of cell functions. Cell Mol. Life Sci. 2019, 76, 4725–4743. [Google Scholar] [CrossRef] [PubMed]
- Saito, M.; Iwawaki, T.; Taya, C.; Yonekawa, H.; Noda, M.; Inui, Y.; Mekada, E.; Kimata, Y.; Tsuru, A.; Kohno, K. Diphtheria toxin receptor-mediated conditional and targeted cell ablation in transgenic mice. Nat. Biotechnol. 2001, 19, 746–750. [Google Scholar] [CrossRef] [PubMed]
- Akamatsu, Y.; Monroe, R.; Dudley, D.D.; Elkin, S.K.; Gärtner, F.; Talukder, S.R.; Takahama, Y.; Alt, F.W.; Bassing, C.H.; Oettinger, M.A. Deletion of the RAG2 C terminus leads to impaired lymphoid development in mice. Proc. Natl. Acad. Sci. USA 2003, 100, 1209–1214. [Google Scholar] [CrossRef] [PubMed]
- Shinkai, Y.; Rathbun, G.; Lam, K.-P.; Oltz, E.M.; Stewart, V.; Mendelsohn, M.; Charron, J.; Datta, M.; Young, F.; Stall, A.M.; et al. RAG-2-deficient mice lack mature lymphocytes owing to inability to initiate V(D)J rearrangement. Cell 1992, 68, 855–867. [Google Scholar] [CrossRef]
- de la Calle-Martin, O.; Hernandez, M.; Ordi, J.; Casamitjana, N.; Arostegui, J.I.; Caragol, I.; Ferrando, M.; Labrador, M.; Rodriguez-Sanchez, J.L.; Español, T. Familial CD8 deficiency due to a mutation in the CD8 alpha gene. J. Clin. Investig. 2001, 108, 117–123. [Google Scholar] [CrossRef]
- Meyer, S.J.; Steffensen, M.; Acs, A.; Weisenburger, T.; Wadewitz, C.; Winkler, T.H.; Nitschke, L. CD22 Controls Germinal Center B Cell Receptor Signaling, Which Influences Plasma Cell and Memory B Cell Output. J. Immunol. 2021, 207, 1018–1032. [Google Scholar] [CrossRef]
- He, X.; Kläsener, K.; Iype, J.M.; Becker, M.; Maity, P.C.; Cavallari, M.; Nielsen, P.J.; Yang, J.; Reth, M. Continuous signaling of CD79b and CD19 is required for the fitness of Burkitt lymphoma B cells. EMBO J. 2018, 37, e97980. [Google Scholar] [CrossRef] [PubMed]
- Lim, J.-H.; Cho, S.-J.; Park, S.-K.; Kim, J.; Cho, D.; Lee, W.J.; Kang, C.-J. Stage-Specific Expression of Two Neighboring Crlz1 and IgJ Genes during B Cell Development Is Regulated by Their Chromatin Accessibility and Histone Acetylation1. J. Immunol. 2006, 177, 5420–5429. [Google Scholar] [CrossRef] [PubMed]
- Ning, Z.; Liu, K.; Xiong, H. Roles of BTLA in Immunity and Immune Disorders. Front. Immunol. 2021, 12, 654960. [Google Scholar] [CrossRef]
- Draghi, N.A.; Denzin, L.K. H2-O, a MHC class II-like protein, sets a threshold for B-cell entry into germinal centers. Proc. Natl. Acad. Sci. USA 2010, 107, 16607–16612. [Google Scholar] [CrossRef]
- Sugimoto, E.; Li, J.; Hayashi, Y.; Iida, K.; Asada, S.; Fukushima, T.; Tamura, M.; Shikata, S.; Zhang, W.; Yamamoto, K.; et al. Hyperactive Natural Killer cells in Rag2 knockout mice inhibit the development of acute myeloid leukemia. Commun. Biol. 2023, 6, 1294. [Google Scholar] [CrossRef]
- Lee, G.; Schauner, R.; Burke, J.; Borocz, J.; Vasana, S.; Sobieraj, L.; Giraudo, M.; Jackson, Z.; Ansari, Q.; Navas, M.; et al. NK cells from COVID-19 positive patients exhibit enhanced cytotoxic activity upon NKG2A and KIR2DL1 blockade. Front. Immunol. 2023, 14, 1022890. [Google Scholar] [CrossRef]
- Varchetta, S.; Mele, D.; Oliviero, B.; Mantovani, S.; Ludovisi, S.; Cerino, A.; Bruno, R.; Castelli, A.; Mosconi, M.; Vecchia, M.; et al. Unique immunological profile in patients with COVID-19. Cell Mol. Immunol. 2021, 18, 604–612. [Google Scholar] [CrossRef] [PubMed]
- Lenart, M.; Górecka, M.; Bochenek, M.; Barreto-Duran, E.; Szczepański, A.; Gałuszka-Bulaga, A.; Mazur-Panasiuk, N.; Węglarczyk, K.; Siwiec-Koźlik, A.; Korkosz, M.; et al. SARS-CoV-2 infection impairs NK cell functions via activation of the LLT1-CD161 axis. Front. Immunol. 2023, 14, 1123155. [Google Scholar] [CrossRef]
- Bi, J. NK cell dysfunction in patients with COVID-19. Cell Mol. Immunol. 2022, 19, 127–129. [Google Scholar] [CrossRef]


Disclaimer/Publisher’s Note: The statements, opinions and data contained in all publications are solely those of the individual author(s) and contributor(s) and not of MDPI and/or the editor(s). MDPI and/or the editor(s) disclaim responsibility for any injury to people or property resulting from any ideas, methods, instructions or products referred to in the content. |
© 2024 by the authors. Licensee MDPI, Basel, Switzerland. This article is an open access article distributed under the terms and conditions of the Creative Commons Attribution (CC BY) license (https://creativecommons.org/licenses/by/4.0/).
Share and Cite
Ellsworth, C.R.; Wang, C.; Katz, A.R.; Chen, Z.; Islamuddin, M.; Yang, H.; Scheuermann, S.E.; Goff, K.A.; Maness, N.J.; Blair, R.V.; et al. Natural Killer Cells Do Not Attenuate a Mouse-Adapted SARS-CoV-2-Induced Disease in Rag2−/− Mice. Viruses 2024, 16, 611. https://doi.org/10.3390/v16040611
Ellsworth CR, Wang C, Katz AR, Chen Z, Islamuddin M, Yang H, Scheuermann SE, Goff KA, Maness NJ, Blair RV, et al. Natural Killer Cells Do Not Attenuate a Mouse-Adapted SARS-CoV-2-Induced Disease in Rag2−/− Mice. Viruses. 2024; 16(4):611. https://doi.org/10.3390/v16040611
Chicago/Turabian StyleEllsworth, Calder R, Chenxiao Wang, Alexis R Katz, Zheng Chen, Mohammad Islamuddin, Haoran Yang, Sarah E Scheuermann, Kelly A Goff, Nicholas J Maness, Robert V Blair, and et al. 2024. "Natural Killer Cells Do Not Attenuate a Mouse-Adapted SARS-CoV-2-Induced Disease in Rag2−/− Mice" Viruses 16, no. 4: 611. https://doi.org/10.3390/v16040611