
Design and Development of an Antigen Test for SARS-CoV-2 Nucleocapsid Protein to Validate the Viral Quality Assurance Panels

 ,
,  , ,
, ,  , and
, and
Abstract
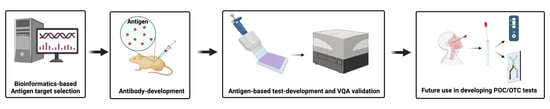
1. Introduction
2. Materials and Methods
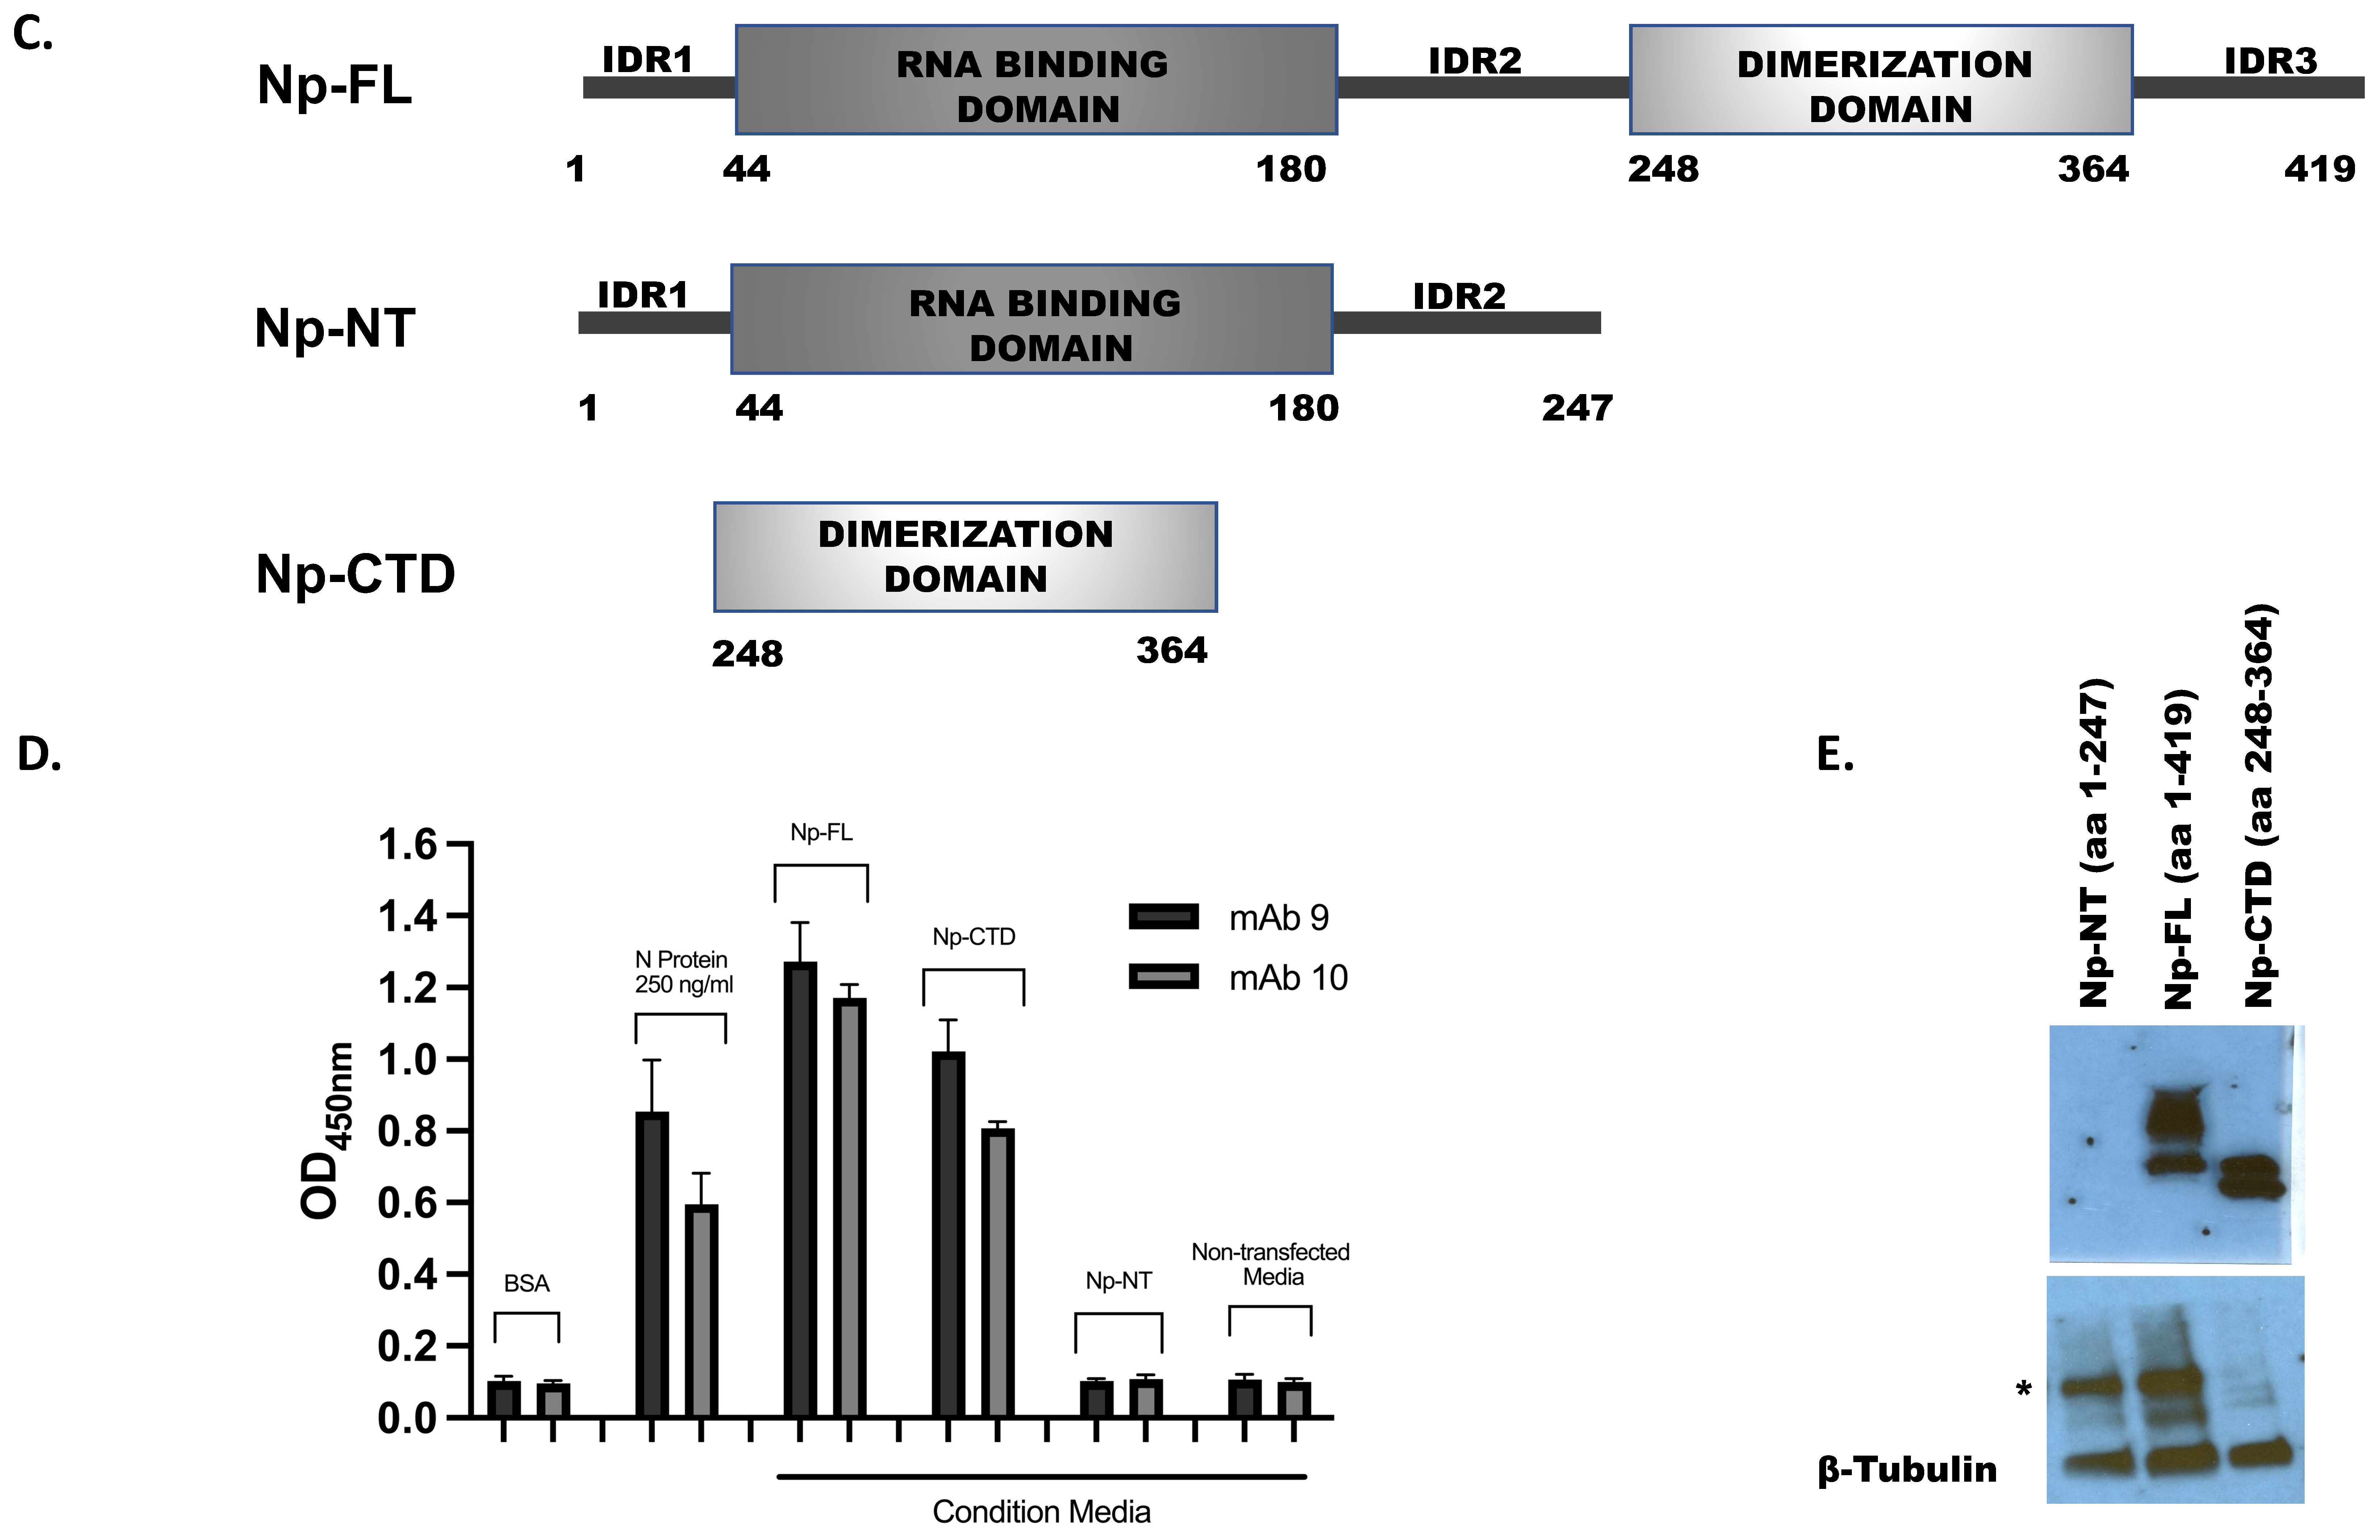
Cloning and Expression of SARS-CoV-2 Nucleocapsid (Np) Protein Subdomains
3. Results
3.1. Bioinformatics Approach for Selecting Antigen
- (a)
- Examination of the pre-existing ‘Defining Mutations’:
- (b)
- Single-Point Shannon Entropy Analysis for Mutation Variability
- (c)
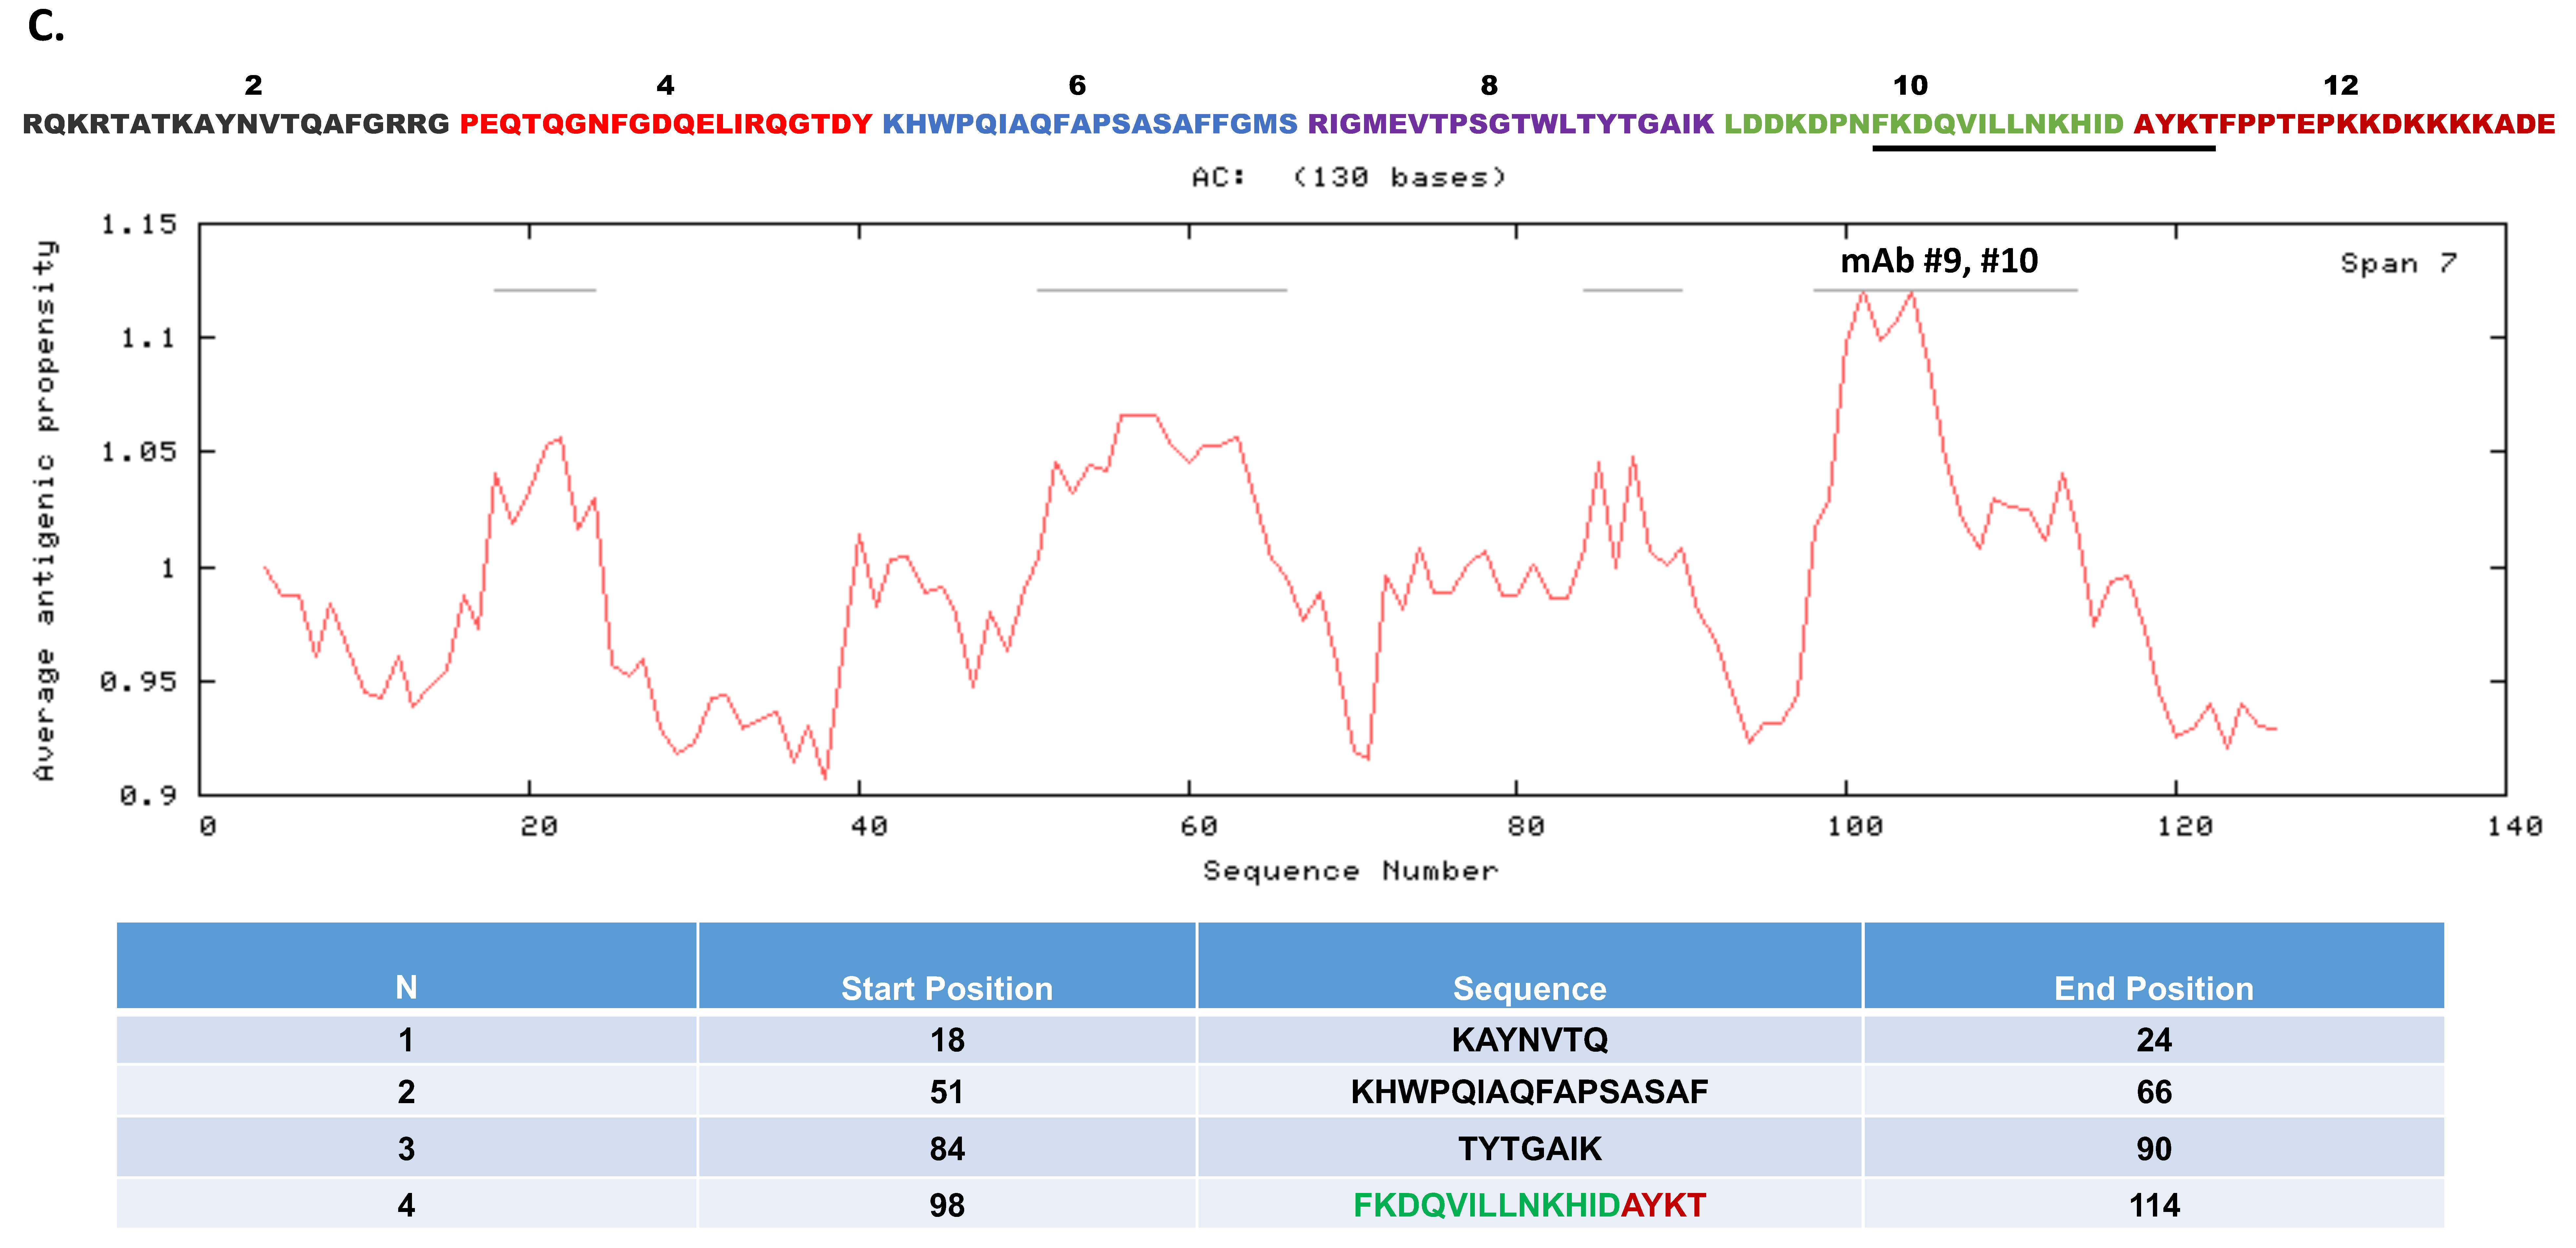
- Epitope Windowed Shannon Entropy Analysis
3.2. Production of Antibodies
3.3. Characterization of the Antibodies
- (a)
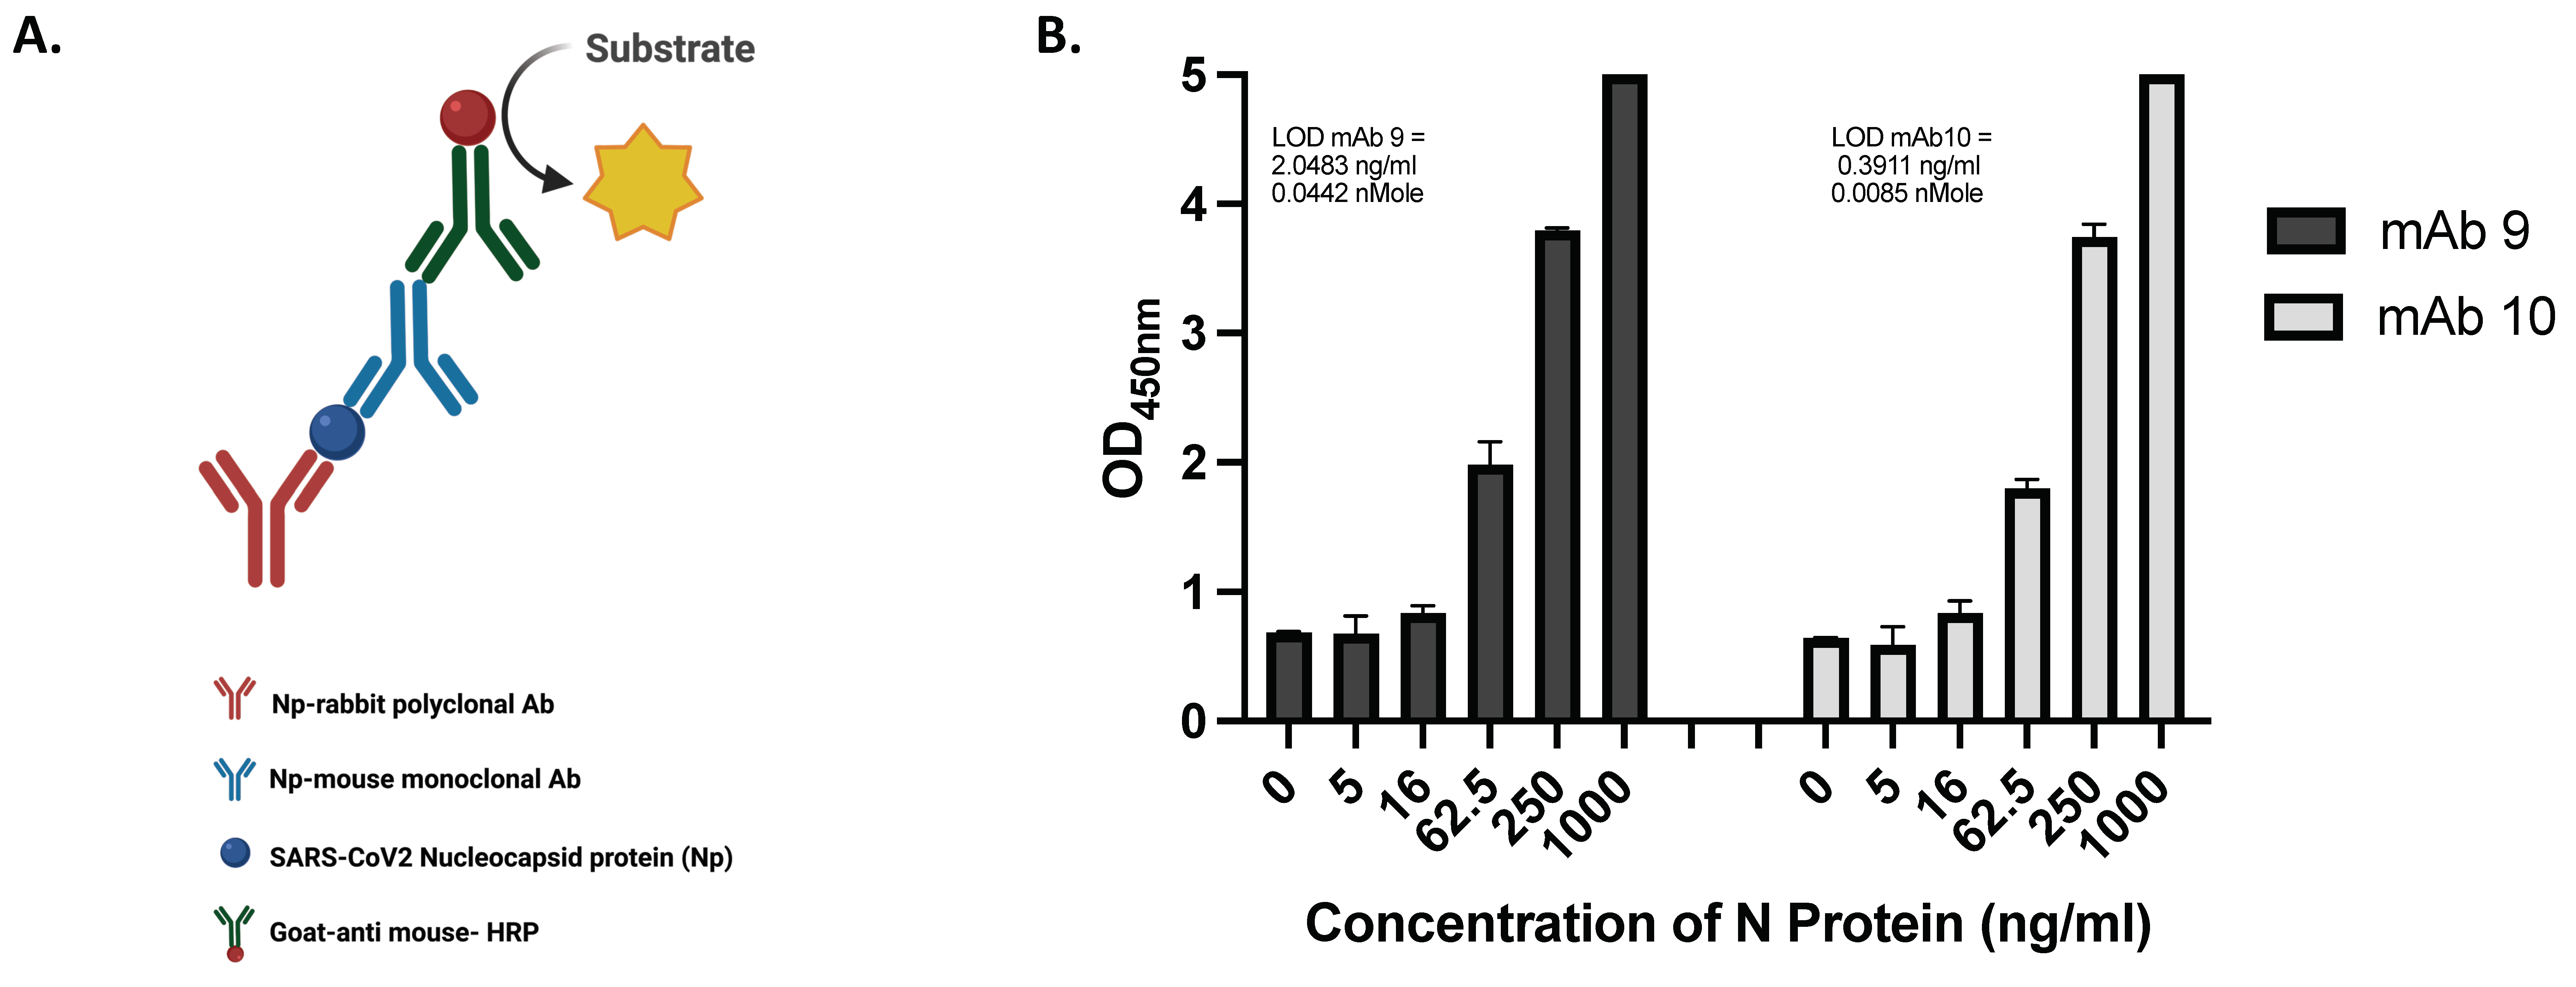
- Developing sandwich ELISA and determining the assay’s sensitivity
- (b)
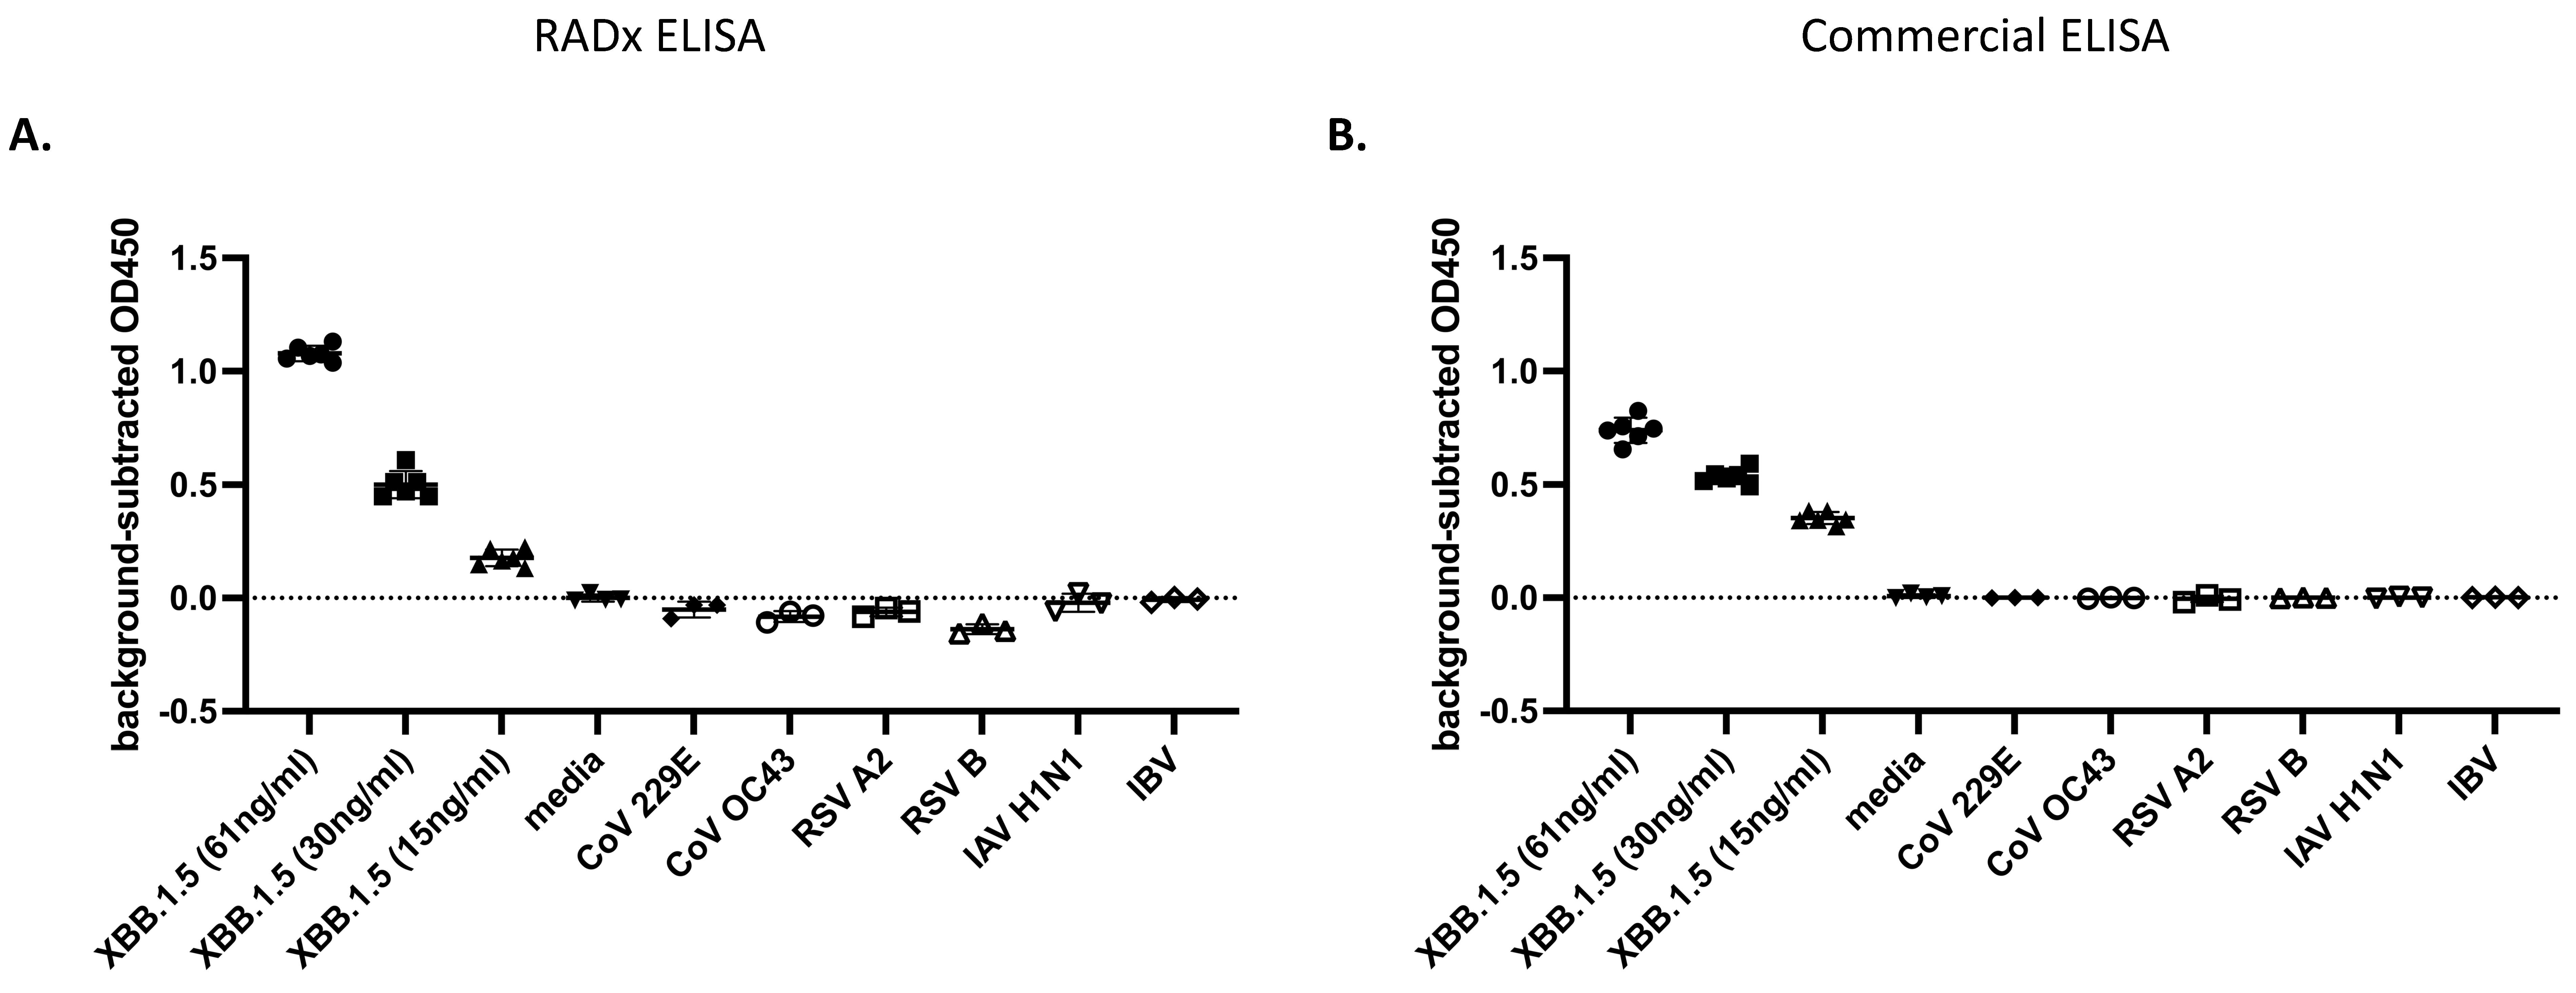
- Determining the Selectivity of the ELISA
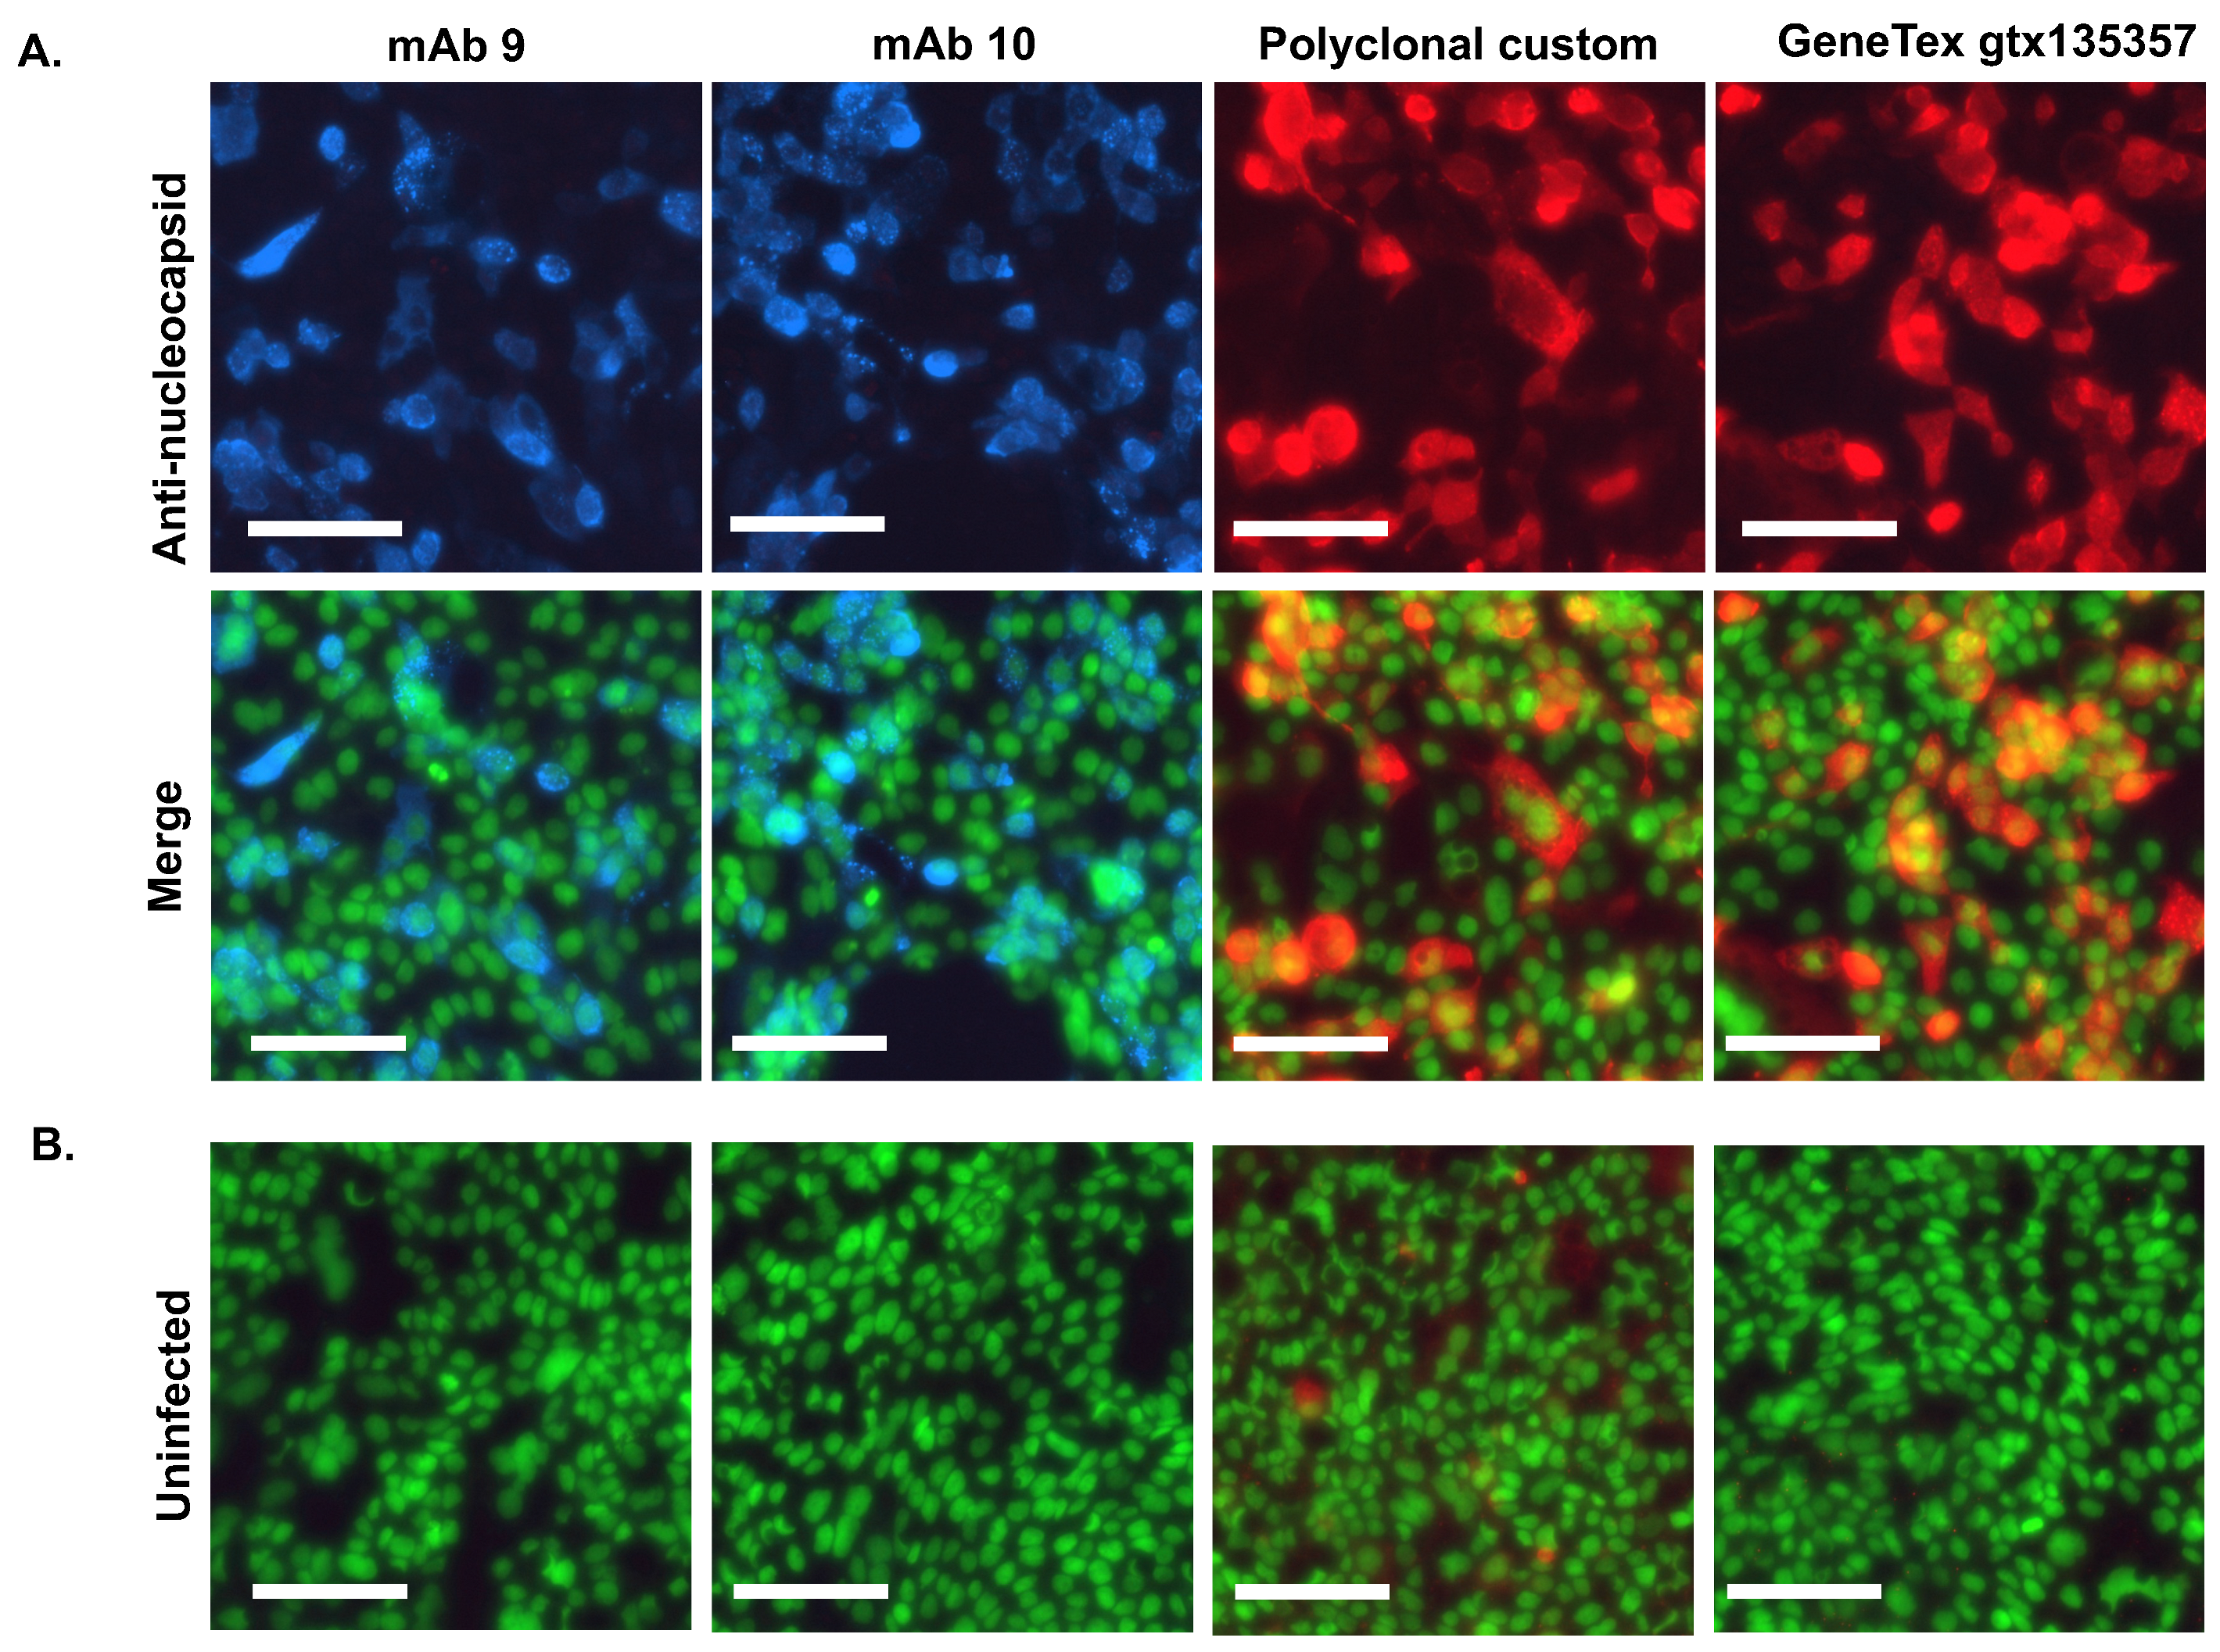
3.4. Immunofluorescent Staining of SARS-CoV-2 Infected Cells Using the Antibodies
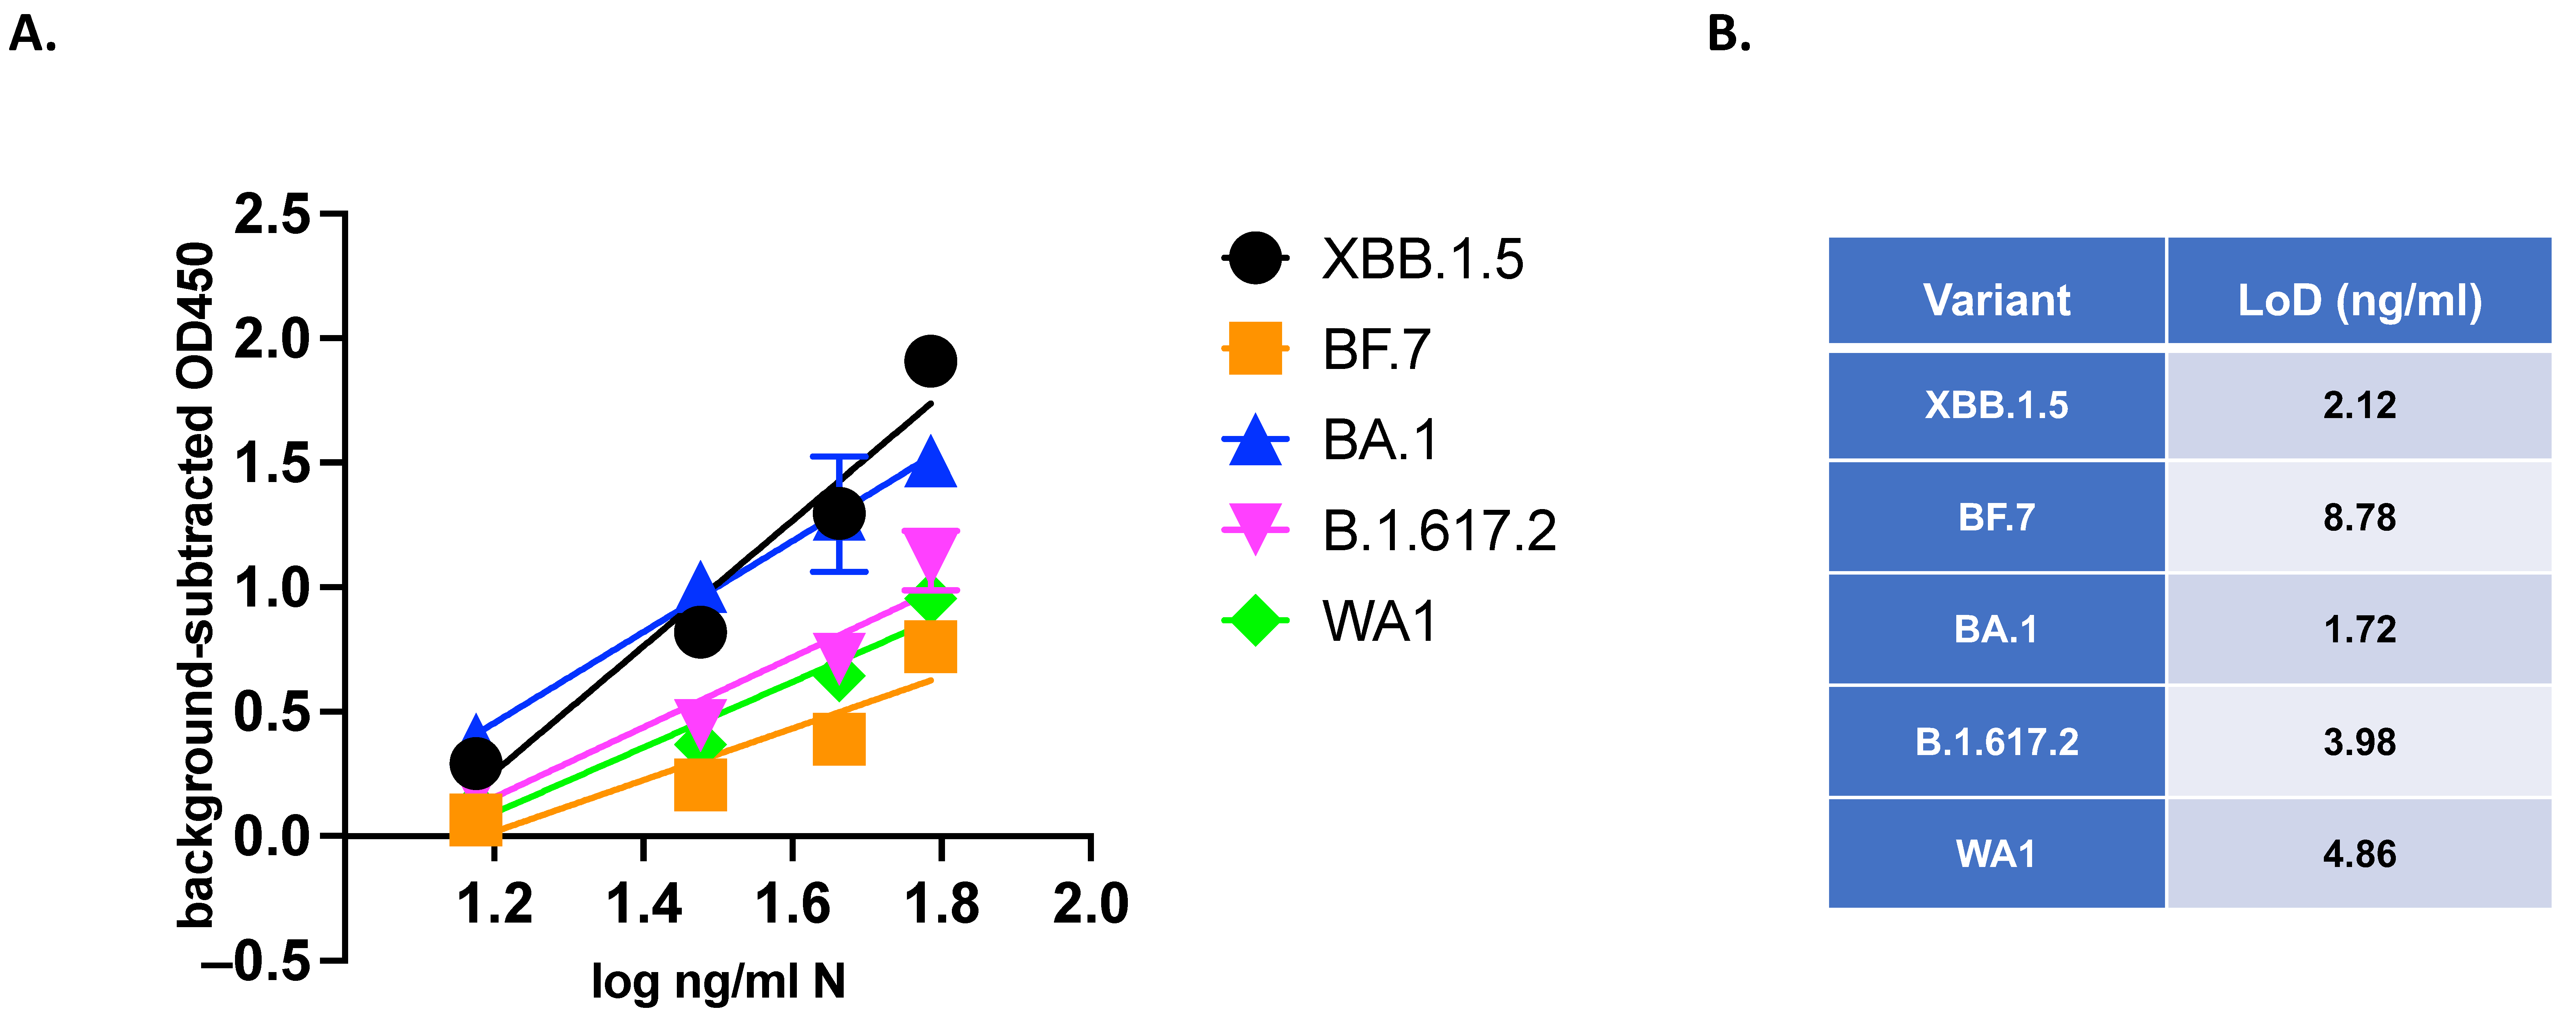
3.5. VQA Testing: Quantitative Evaluation of Variants of SARS-CoV-2
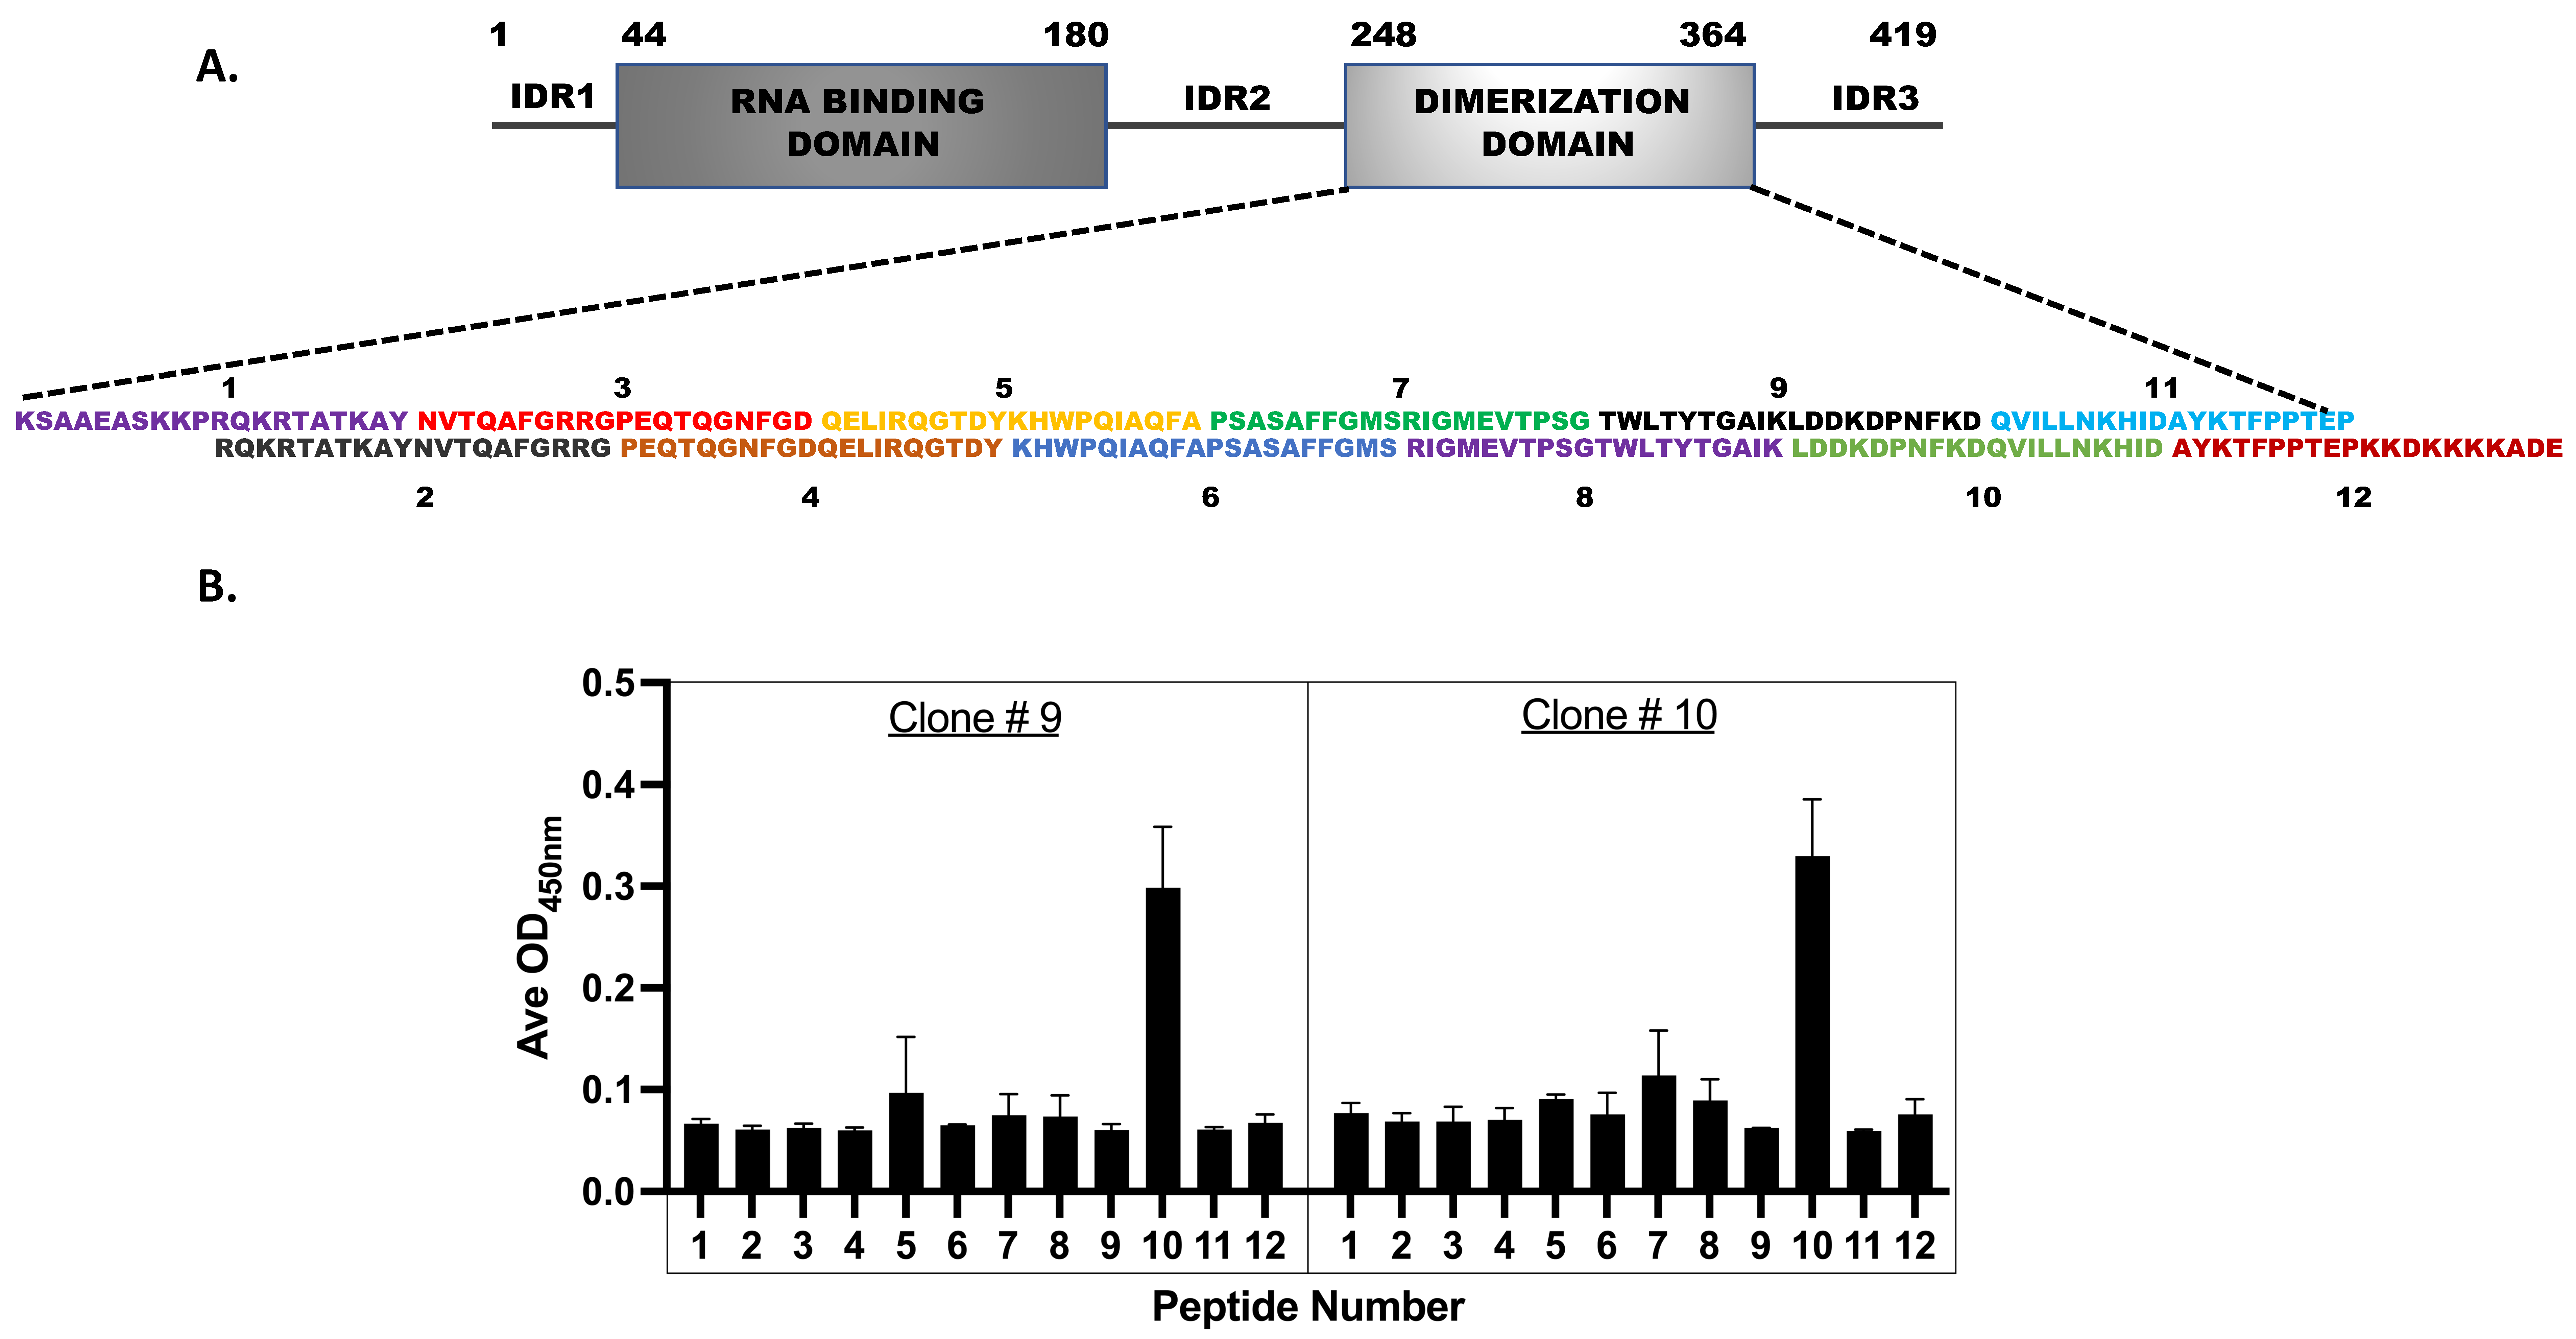
3.6. Epitope Mapping for the Monoclonal Antibodies
4. Discussion
5. Conclusions
Supplementary Materials
Author Contributions
Funding
Institutional Review Board Statement
Informed Consent Statement
Data Availability Statement
Acknowledgments
Conflicts of Interest
References
- Kevadiya, B.D.; Machhi, J.; Herskovitz, J.; Oleynikov, M.D.; Blomberg, W.R.; Bajwa, N.; Soni, D.; Das, S.; Hasan, M.; Patel, M.; et al. Diagnostics for SARS-CoV-2 infections. Nat. Mater. 2021, 20, 593–605. [Google Scholar] [CrossRef] [PubMed]
- Peeling, R.W.; Heymann, D.L.; Teo, Y.Y.; Garcia, P.J. Diagnostics for COVID-19: Moving from pandemic response to control. Lancet 2022, 399, 757–768. [Google Scholar] [CrossRef] [PubMed]
- Dong, T.; Wang, M.; Liu, J.; Ma, P.; Pang, S.; Liu, W.; Liu, A. Diagnostics and analysis of SARS-CoV-2: Current status, recent advances, challenges and perspectives. Chem. Sci. 2023, 14, 6149–6206. [Google Scholar] [CrossRef] [PubMed]
- Lancet Commission on COVID-19 Vaccines; Therapeutics Task Force Members. Operation Warp Speed: Implications for global vaccine security. Lancet. Glob. Health 2021, 9, e1017–e1021. [Google Scholar] [CrossRef] [PubMed]
- RADxSM. Radical. Available online: https://www.radxrad.org/ (accessed on 8 March 2024).
- Weisblum, Y.; Schmidt, F.; Zhang, F.; DaSilva, J.; Poston, D.; Lorenzi, J.C.; Muecksch, F.; Rutkowska, M.; Hoffmann, H.H.; Michailidis, E.; et al. Escape from neutralizing antibodies by SARS-CoV-2 spike protein variants. eLife 2020, 9, e61312. [Google Scholar] [CrossRef] [PubMed]
- Liu, Z.; VanBlargan, L.A.; Bloyet, L.M.; Rothlauf, P.W.; Chen, R.E.; Stumpf, S.; Zhao, H.; Errico, J.M.; Theel, E.S.; Liebeskind, M.J.; et al. Identification of SARS-CoV-2 spike mutations that attenuate monoclonal and serum antibody neutralization. Cell Host Microbe 2021, 29, 477–488 e474. [Google Scholar] [CrossRef] [PubMed]
- Bojkova, D.; Klann, K.; Koch, B.; Widera, M.; Krause, D.; Ciesek, S.; Cinatl, J.; Munch, C. Proteomics of SARS-CoV-2-infected host cells reveals therapy targets. Nature 2020, 583, 469–472. [Google Scholar] [CrossRef] [PubMed]
- Wu, W.; Cheng, Y.; Zhou, H.; Sun, C.; Zhang, S. The SARS-CoV-2 nucleocapsid protein: Its role in the viral life cycle, structure and functions, and use as a potential target in the development of vaccines and diagnostics. Virol. J. 2023, 20, 6. [Google Scholar] [CrossRef]
- Cubuk, J.; Alston, J.J.; Incicco, J.J.; Singh, S.; Stuchell-Brereton, M.D.; Ward, M.D.; Zimmerman, M.I.; Vithani, N.; Griffith, D.; Wagoner, J.A.; et al. The SARS-CoV-2 nucleocapsid protein is dynamic, disordered, and phase separates with RNA. Nat. Commun. 2021, 12, 1936. [Google Scholar] [CrossRef]
- Peng, Y.; Du, N.; Lei, Y.; Dorje, S.; Qi, J.; Luo, T.; Gao, G.F.; Song, H. Structures of the SARS-CoV-2 nucleocapsid and their perspectives for drug design. EMBO J. 2020, 39, e105938. [Google Scholar] [CrossRef]
- Bai, Z.; Cao, Y.; Liu, W.; Li, J. The SARS-CoV-2 Nucleocapsid Protein and Its Role in Viral Structure, Biological Functions, and a Potential Target for Drug or Vaccine Mitigation. Viruses 2021, 13, 1115. [Google Scholar] [CrossRef] [PubMed]
- At-Home OTC COVID-19 Diagnostic Tests. Available online: https://www.fda.gov/medical-devices/coronavirus-covid-19-and-medical-devices/home-otc-covid-19-diagnostic-tests (accessed on 18 April 2024).
- Dutta, N.K.; Mazumdar, K.; Gordy, J.T. The Nucleocapsid Protein of SARS-CoV-2: A Target for Vaccine Development. J. Virol. 2020, 94, 1110–1128. [Google Scholar] [CrossRef] [PubMed]
- Rahman, M.S.; Islam, M.R.; Alam, A.; Islam, I.; Hoque, M.N.; Akter, S.; Rahaman, M.M.; Sultana, M.; Hossain, M.A. Evolutionary dynamics of SARS-CoV-2 nucleocapsid protein and its consequences. J. Med. Virol. 2021, 93, 2177–2195. [Google Scholar] [CrossRef] [PubMed]
- Oliveira, S.C.; de Magalhaes, M.T.Q.; Homan, E.J. Immunoinformatic Analysis of SARS-CoV-2 Nucleocapsid Protein and Identification of COVID-19 Vaccine Targets. Front. Immunol. 2020, 11, 587615. [Google Scholar] [CrossRef] [PubMed]
- Frank, F.; Keen, M.M.; Rao, A.; Bassit, L.; Liu, X.; Bowers, H.B.; Patel, A.B.; Cato, M.L.; Sullivan, J.A.; Greenleaf, M.; et al. Deep mutational scanning identifies SARS-CoV-2 Nucleocapsid escape mutations of currently available rapid antigen tests. Cell 2022, 185, 3603–3616.e13. [Google Scholar] [CrossRef] [PubMed]
- Hagag, I.T.; Pyrc, K.; Weber, S.; Balkema-Buschmann, A.; Groschup, M.H.; Keller, M. Mutations in SARS-CoV-2 nucleocapsid in variants of concern impair the sensitivity of SARS-CoV-2 detection by rapid antigen tests. Front. Virol. 2022, 2, 81. [Google Scholar] [CrossRef]
- Zhao, H.; Nguyen, A.; Wu, D.; Li, Y.; Hassan, S.A.; Chen, J.; Shroff, H.; Piszczek, G.; Schuck, P. Plasticity in structure and assembly of SARS-CoV-2 nucleocapsid protein. PNAS Nexus 2022, 1, pgac049. [Google Scholar] [CrossRef]
- Cubuk, J.; Alston, J.J.; Incicco, J.J.; Holehouse, A.S.; Hall, K.B.; Stuchell-Brereton, M.D.; Soranno, A. The disordered N-terminal tail of SARS-CoV-2 Nucleocapsid protein forms a dynamic complex with RNA. Nucleic Acids Res. 2023, 52, 2609–2624. [Google Scholar] [CrossRef] [PubMed]
- Hodcroft, E.B. CoVariants: SARS-CoV-2 Mutations and Variants of Interest. Available online: https://covariants.org/ (accessed on 21 October 2022).
- Hadfield, J.; Megill, C.; Bell, S.M.; Huddleston, J.; Potter, B.; Callender, C.; Sagulenko, P.; Bedford, T.; Neher, R.A. Nextstrain: Real-time tracking of pathogen evolution. Bioinformatics 2018, 34, 4121–4123. [Google Scholar] [CrossRef]
- Garcia-Boronat, M.; Diez-Rivero, C.M.; Reinherz, E.L.; Reche, P.A. PVS: A web server for protein sequence variability analysis tuned to facilitate conserved epitope discovery. Nucleic Acids Res. 2008, 36, W35–W41. [Google Scholar] [CrossRef]
- Khare, S.; Gurry, C.; Freitas, L.; Schultz, M.B.; Bach, G.; Diallo, A.; Akite, N.; Ho, J.; Lee, R.T.; Yeo, W.; et al. GISAID’s Role in Pandemic Response. China CDC Wkly. 2021, 3, 1049–1051. [Google Scholar] [CrossRef] [PubMed]
- Kabat, E.A.; Wu, T.T.; Bilofsky, H. Unusual distributions of amino acids in complementarity-determining (hypervariable) segments of heavy and light chains of immunoglobulins and their possible roles in specificity of antibody-combining sites. J. Biol. Chem. 1977, 252, 6609–6616. [Google Scholar] [CrossRef]
- Simpson, E.H. Measurement of Diversity. Nature 1949, 163, 688. [Google Scholar] [CrossRef]
- Shannon, C.E. A mathematical theory of communication. Bell Syst. Tech. J. 1948, 27, 379–423. [Google Scholar] [CrossRef]
- Stewart, J.J.; Lee, C.Y.; Ibrahim, S.; Watts, P.; Shlomchik, M.; Weigert, M.; Litwin, S. A Shannon entropy analysis of immunoglobulin and T cell receptor. Mol. Immunol. 1997, 34, 1067–1082. [Google Scholar] [CrossRef]
- Jost, L. Entropy and Diversity. Oikos 2006, 113, 363–375. [Google Scholar] [CrossRef]
- Wang, A.; Yao, H.; Estrin, K.; Wang, H.; Yao, K.; Estrin, D. Information-theoretic approaches for sensor selection and placement in sensor networks for target localization and tracking. J. Commun. Netw. 2005, 7, 438–449. [Google Scholar] [CrossRef]
- Zhou, R.; Cai, R.; Tong, G. Applications of Entropy in Finance: A Review. Entropy 2013, 15, 4909–4931. [Google Scholar] [CrossRef]
- Karmeshu (Ed.) Entropy Measures, Maximum Entropy Principle and Emerging Applications, 1st ed.; Springer: Berlin/Heidelberg, Germany, 2003. [Google Scholar]
- Vopson, M.M. A Possible Information Entropic Law of Genetic Mutations. Appl. Sci. 2022, 12, 6912. [Google Scholar] [CrossRef]
- Baczkowski, A.J.; Joanes, D.N.; Shamia, G.M. Range of validity of α and β for a generalized diversity index H(α,β) due to Good. Math. Biosci. 1998, 148, 115–128. [Google Scholar] [CrossRef]
- Pasechnik, A.; Mylläri, A.; Salakoski, T. Dynamical Visualization of the Dna Sequence and Its Nucleotide Content. Proc. KRBIO 2005, 5, 47–50. [Google Scholar]
- Ranjbar, M.M.; Ataei, S.; Nikbakht Brujeni, G.; Golabdar, S. Analysis of variations, structures, and phylogenic characteristics of bovine leukocyte antigen DRB3 exon2. Arch. Razi Inst. 2017, 72, 147–157. [Google Scholar] [CrossRef]
- Yang, O.O. Candidate vaccine sequences to represent intra- and inter-clade HIV-1 variation. PLoS ONE 2009, 4, e7388. [Google Scholar] [CrossRef] [PubMed]
- Yuan, F.; Wang, L.; Fang, Y.; Wang, L. Global SNP analysis of 11,183 SARS-CoV-2 strains reveals high genetic diversity. Transbound Emerg. Dis. 2021, 68, 3288–3304. [Google Scholar] [CrossRef] [PubMed]
- Litwin, S.; Jores, R. Shannon Information as a Measure of Amino Acid Diversity. In Theoretical and Experimental Insights into Immunology; Springer: Berlin/Heidelberg, Germany, 1992; pp. 279–287. [Google Scholar]
- Buus, S.; Rockberg, J.; Forsström, B.; Nilsson, P.; Uhlen, M.; Schafer-Nielsen, C. High-resolution Mapping of Linear Antibody Epitopes Using Ultrahigh-density Peptide Microarrays. Mol. Cell. Proteom. 2012, 11, 1790–1800. [Google Scholar] [CrossRef]
- Ghanchi, N.K.; Nasir, A.; Masood, K.I.; Abidi, S.H.; Mahmood, S.F.; Kanji, A.; Razzak, S.; Khan, W.; Shahid, S.; Yameen, M.; et al. Higher entropy observed in SARS-CoV-2 genomes from the first COVID-19 wave in Pakistan. PLoS ONE 2021, 16, e0256451. [Google Scholar] [CrossRef] [PubMed]
- Li, R.; Mor, M.; Ma, B.; Clark, A.E.; Alter, J.; Werbner, M.; Lee, J.C.; Leibel, S.L.; Carlin, A.F.; Dessau, M.; et al. Conformational flexibility in neutralization of SARS-CoV-2 by naturally elicited anti-SARS-CoV-2 antibodies. Commun. Biol. 2022, 5, 789. [Google Scholar] [CrossRef] [PubMed]
- Carlin, A.F.; Clark, A.E.; Chaillon, A.; Garretson, A.F.; Bray, W.; Porrachia, M.; Santos, A.T.; Rana, T.M.; Smith, D.M. Virologic and Immunologic Characterization of Coronavirus Disease 2019 Recrudescence After Nirmatrelvir/Ritonavir Treatment. Clin. Infect. Dis. 2023, 76, e530–e532. [Google Scholar] [CrossRef] [PubMed]
- Carlin, A.F.; Clark, A.E.; Garretson, A.F.; Bray, W.; Porrachia, M.; Santos, A.T.; Rana, T.M.; Chaillon, A.; Smith, D.M. Neutralizing Antibody Responses After Severe Acute Respiratory Syndrome Coronavirus 2 BA.2 and BA.2.12.1 Infection Do Not Neutralize BA.4 and BA.5 and Can Be Blunted by Nirmatrelvir/Ritonavir Treatment. Open Forum Infect. Dis. 2023, 10, ofad154. [Google Scholar] [CrossRef] [PubMed]
- Q2(R2) Validation of Analytical Procedures. 2024, 12. Available online: https://www.fda.gov/media/161201/download (accessed on 18 April 2024).
- Graham, R. ELISA NProtein Entropy Analysis. Available online: https://github.com/center4health/ELISA-NProtein-Entropy-Analysis (accessed on 18 April 2024).
- Sun, Z.; Zheng, X.; Ji, F.; Zhou, M.; Su, X.; Ren, K.; Li, L. Mass Spectrometry Analysis of SARS-CoV-2 Nucleocapsid Protein Reveals Camouflaging Glycans and Unique Post-Translational Modifications. Infect. Microbes Dis. 2021, 3, 149–157. [Google Scholar] [CrossRef]
- Supekar, N.T.; Shajahan, A.; Gleinich, A.S.; Rouhani, D.S.; Heiss, C.; Chapla, D.G.; Moremen, K.W.; Azadi, P. Variable posttranslational modifications of severe acute respiratory syndrome coronavirus 2 nucleocapsid protein. Glycobiology 2021, 31, 1080–1092. [Google Scholar] [CrossRef] [PubMed]
- Scherer, K.M.; Mascheroni, L.; Carnell, G.W.; Wunderlich, L.C.S.; Makarchuk, S.; Brockhoff, M.; Mela, I.; Fernandez-Villegas, A.; Barysevich, M.; Stewart, H.; et al. SARS-CoV-2 nucleocapsid protein adheres to replication organelles before viral assembly at the Golgi/ERGIC and lysosome-mediated egress. Sci. Adv. 2022, 8, eabl4895. [Google Scholar] [CrossRef] [PubMed]
- Geysen, H.M.; Meloen, R.H.; Barteling, S.J. Use of peptide synthesis to probe viral antigens for epitopes to a resolution of a single amino acid. Proc. Natl. Acad. Sci. USA 1984, 81, 3998–4002. [Google Scholar] [CrossRef]
- Wu, C.; Qavi, A.J.; Hachim, A.; Kavian, N.; Cole, A.R.; Moyle, A.B.; Wagner, N.D.; Sweeney-Gibbons, J.; Rohrs, H.W.; Gross, M.L.; et al. Characterization of SARS-CoV-2 nucleocapsid protein reveals multiple functional consequences of the C-terminal domain. iScience 2021, 24, 102681. [Google Scholar] [CrossRef] [PubMed]


| Primers | Sequence | Target |
|---|---|---|
| F1 | 5′-CCGCTCGAGAAGAAATCTGCTGCTGAGGCTTC-3′ | Np-CTD (Lys248-Pro364) |
| R1 | 5′-CTCGGATCCTTATGGGAATGTTTTGTATGCGTC-3′ | Np-CTD (Lys248-Pro364) |
| F2 | 5′-AGGCACTCGAGATGTCCGATAATGGGCCACAGAA-3′ | Np-NT (Met1-Thr247) |
| R2 | 5′-CTCTGGATCCGGTAACGGTCTGCCCCTGTTGCTGTTG-3′ | Np-NT (Met1-Thr247) |
| Clones | Protein |
|---|---|
| pUNO1His-SARS2-N (Invivogen Catalog code: p1his-cov2-n) | Full-length Np (Met1-Ala419) |
| pUNO1His-SARS2-Np-CTD (This work) | Np-CTD (Lys248-Pro364) |
| pUNO1His-SARS2- Np-NT (This work) | Np-NT (Met1-Thr247) |
Disclaimer/Publisher’s Note: The statements, opinions and data contained in all publications are solely those of the individual author(s) and contributor(s) and not of MDPI and/or the editor(s). MDPI and/or the editor(s) disclaim responsibility for any injury to people or property resulting from any ideas, methods, instructions or products referred to in the content. |
© 2024 by the authors. Licensee MDPI, Basel, Switzerland. This article is an open access article distributed under the terms and conditions of the Creative Commons Attribution (CC BY) license (https://creativecommons.org/licenses/by/4.0/).
Share and Cite
Ray, P.; Ledgerwood-Lee, M.; Brickner, H.; Clark, A.E.; Garretson, A.; Graham, R.; Van Zant, W.; Carlin, A.F.; Aronoff-Spencer, E.S. Design and Development of an Antigen Test for SARS-CoV-2 Nucleocapsid Protein to Validate the Viral Quality Assurance Panels. Viruses 2024, 16, 662. https://doi.org/10.3390/v16050662
Ray P, Ledgerwood-Lee M, Brickner H, Clark AE, Garretson A, Graham R, Van Zant W, Carlin AF, Aronoff-Spencer ES. Design and Development of an Antigen Test for SARS-CoV-2 Nucleocapsid Protein to Validate the Viral Quality Assurance Panels. Viruses. 2024; 16(5):662. https://doi.org/10.3390/v16050662
Chicago/Turabian StyleRay, Partha, Melissa Ledgerwood-Lee, Howard Brickner, Alex E. Clark, Aaron Garretson, Rishi Graham, Westley Van Zant, Aaron F. Carlin, and Eliah S. Aronoff-Spencer. 2024. "Design and Development of an Antigen Test for SARS-CoV-2 Nucleocapsid Protein to Validate the Viral Quality Assurance Panels" Viruses 16, no. 5: 662. https://doi.org/10.3390/v16050662
APA StyleRay, P., Ledgerwood-Lee, M., Brickner, H., Clark, A. E., Garretson, A., Graham, R., Van Zant, W., Carlin, A. F., & Aronoff-Spencer, E. S. (2024). Design and Development of an Antigen Test for SARS-CoV-2 Nucleocapsid Protein to Validate the Viral Quality Assurance Panels. Viruses, 16(5), 662. https://doi.org/10.3390/v16050662