Abstract
The novel coronavirus disease 2019 (COVID-19), caused by the severe acute respiratory syndrome coronavirus 2 (SARS-CoV-2), has emerged as one of the most significant global health crises in recent history. The clinical characteristics of COVID-19 patients have revealed the possibility of immune activity changes contributing to disease severity. Nevertheless, limited information is available regarding the immune response in human lung tissue, which is the primary site of infection. In this study, we conducted an extensive analysis of lung tissue to screen for differentially expressed miRNAs and mRNAs in five individuals who died due to COVID-19 and underwent a rapid autopsy, as well as seven control individuals who died of other causes unrelated to COVID-19. To analyze the host response gene expression, miRNA microarray and Nanostring’s nCounter XT gene expression assay were performed. Our study identified 37 downregulated and 77 upregulated miRNAs in COVID-19 lung biopsy samples compared to the controls. A total of 653 mRNA transcripts were differentially expressed between the two sample types, with most transcripts (472) being downregulated in COVID-19-positive specimens. Hierarchical and PCA K-means clustering analysis showed distinct clustering between COVID-19 and control samples. Enrichment and network analyses revealed differentially expressed genes important for innate immunity and inflammatory response in COVID-19 lung biopsies. The interferon-signaling pathway was highly upregulated in COVID-19 specimens while genes involved in interleukin-17 signaling were downregulated. These findings shed light on the mechanisms of host cellular responses to COVID-19 infection in lung tissues and could help identify new targets for the prevention and treatment of COVID-19 infection.
1. Introduction
The lung is one of the most extensively studied organs in the context of the COVID-19 pandemic, as it serves the primary sites of infection and a frequent site of organ failure [1]. The virus spreads through respiratory droplets, and due to the high density of angiotensin-converting enzyme 2 (ACE2) receptors (binding partner of SARS-Cov2’s spike protein) in nasal epithelium, it can be easily transmitted to and colonize the lower respiratory tract [2]. After infection is established, the host response progresses from viral entry and early infection to an early immune response marked by macrophages and dendritic cells, and a late immune response with cytotoxic T cells. If the host is unable to clear the infection, they may progress to a hyperinflammatory stage characterized by a cytokine storm, followed by multiorgan dysfunction and ultimately organ failure before death [3]. Current evidence suggests that these immunopathological responses are not solely determined by host characteristics and disease severity, but also exhibit distinct characteristics based on the type of organ or tissue affected. Specifically, variations in immunopathology are observed in different organs such as the lungs, heart, and stomach, as determined by relevant biological parameters [4].
Considering the central role played by lungs in establishment and pathology of COVID-19 infection, understanding the molecular processes taking place in lungs during severe and critical COVID-19 infections could be crucial in developing life-saving therapies. However, despite this rationale, only a limited number of studies have investigated the molecular mechanisms underlying COVID-19 in clinical lung tissues. Some studies have shown that the COVID-19 virus can repress the type IFN I response, which is an important part of the body’s antiviral defense mechanism [5]. However, cultured alveolar epithelium exposed to the virus has demonstrated that SARS-CoV-2 infection is unable to suppress downstream type I IFN signaling, and certain proteins, such as IRF7, IFIT1, and STAT 1/2, can help induce the first line of antiviral type I IFN response [6,7]. Other studies have used targeted immunohistochemical analysis and multi-omics approaches to investigate the molecular changes in COVID-19-infected lung tissues. In targeted immunohistochemical analysis, COVID-19 biopsy tissue was found to display significantly higher IL-4 tissue expression and Sphingosine-1 than in H1N1- and non-infected lung, but these data were limited to M2 macrophages [7]. Additionally, some studies have identified cytokine signaling and upregulation of certain genes, such as NFKB1, and STAT1, in COVID-19-infected tissue [8,9]. Another valuable dataset has been created by performing single-cell and single-nucleus RNA sequencing on various organs of 32 postmortem COVID-19-infected patients [10]. Here, COVID-19 alveolar tissue was found to be enriched with IFNα and IFNγ response genes and oxidative phosphorylation pathways. Here, highly infected tissue displayed upregulated IFIT1, IFIT3, IDO1, GZMB, LAG3, NKG7, and PRF1. Furthermore, SARS-CoV-2+ myeloid cells expressed TNFAIP6, CXCL11, CCL8, ISG1, and GBP5. Conversely, TNF, IL2, STAT5, and TGFβ signaling as well as apical junction/hypoxia pathways were downregulated.
A more integrated approach might be to undertake a combined evaluation of mRNA and miRNA expression profiles of COVID-19 patients to gain insights into the intricate regulatory networks underlying the host response to the infection. MicroRNAs (miRNAs) are a class of small endogenous RNA molecules that play a crucial role in regulating various physiological processes within cells, including the maintenance of endothelial homeostasis, which is critical in the context of vascular diseases [11]. Aberrant expression of miRNAs has been linked to respiratory syndromes and pulmonary diseases caused by viral infections [12,13]. With regards to the current COVID-19 pandemic caused by SARS-CoV-2, most of the studies investigating miRNAs in association with COVID-19 have relied on computational miRNA prediction analyses [14,15]. However, to date, there have been no reports on the expression analysis of miRNAs and mRNA in lung biopsies of COVID-19 patients.
In this study, we aimed to explore the transcriptome profiles of patients who succumbed to severe COVID-19 infection compared to those who died from unrelated causes. To achieve this, we collected biopsy specimens and performed comprehensive analyses of both regulatory miRNA and mRNA expression. Notably, this investigation represents one of the earliest attempts to analyze miRNA and mRNA simultaneously in COVID-19 patients at an organ level, enabling us to identify potential regulatory interactions. Our comparative analysis revealed distinct differences in miRNA and mRNA expression patterns between postmortem lung biopsy specimens of COVID-19-positive and COVID-19-negative lungs. Moreover, our computational analysis provided valuable insight into the cellular activities, signaling pathways, and regulatory mechanisms that are involved in the viral host response during acute COVID-19 deaths. Our findings shed light on new avenues for the development of therapeutic interventions in the fight against COVID-19.
2. Materials and Methods
2.1. Sample Collection
The present study describes the acquisition of five postmortem lung biopsy samples from patients who were treated for COVID-19 at Augusta University Medical Center (AUMC) in Augusta, GA, USA. In order to assess the specificity of miRNA deregulation as a result of SARS-CoV-2 infection, a control group consisting of seven postmortem lung samples was also collected from patients who had died due to other causes that did not involve lung injuries. The use of this control group enabled us to determine the specificity of miRNA deregulation due to SARS-CoV-2 infection and to eliminate the potential influence of tissue type on miRNA expression variation. The specimens were procured via postmortem dissection and subjected to fixation with formalin to prevent degradation of nucleic acids. Following fixation, the specimens were sectioned into slices 8 μm in thickness and subsequently affixed to a glass slide for further analysis.
2.2. Total RNA Isolation
The isolation of total RNA from formalin-fixed paraffin embedded (FFPE) lung tissue was performed utilizing the Qiagen (QIAGEN Inc, Valencia, CA, USA) miRNAeasy kit (217504), following the manufacturer’s protocol. A DNase treatment step was implemented during the isolation of total RNA to remove any residual DNA carryover. The quantity of the total RNA samples was determined utilizing an ultraviolet spectrophotometer (Nanodrop, Thermo Scientific, Pittsburgh, PA, USA). Total RNA samples isolated from FFPE samples were utilized for microRNA analysis and NanoString’s nCounter XT Gene Expression Assay.
2.3. miRNA Microarray Analysis
The quality of the RNA sample was assessed using the RNA integrity number, which was determined through analysis with an Agilent BioAnalyzer equipped with an RNA6000 Pico Chip. The miRNA microarray analysis was performed using an Affymetrix GeneChip® miRNA 4.0 array at the Integrated Genomics Core of Augusta University, GA, USA. The labeling of 250 ng of total RNA with biotin was achieved using the FlashTag Biotin HSR RNA Labeling Kit from Thermofisher, following the manufacturer’s protocol. The labeled samples were then hybridized to the GeneChip miRNA 4.0 array, which included 1908 mature and 1255 premature miRNA. Array hybridization, washing, and scanning were carried out following the manufacturer’s instructions, and the resulting data were obtained in the CEL file format. The CEL files were then imported into Partek Genomic Suites version 7.0 using the standard import tool and subjected to RMA normalization for further analysis.
2.4. NanoString’s nCounter® Host Reponse Panel
Nanostring’s proprietary nCounter® Host Response Panel was employed to precisely measure mRNA expression levels in this study. This comprehensive panel consisted of 773 carefully selected genes, encompassing various aspects of the host immune response to infectious diseases. To ensure accurate data normalization, the panel also featured 12 internal reference genes (Table S1).
The nCounter® Host Response Panel spanned five pivotal immune functional themes, each containing a substantial number of genes. The adaptive immune response pathway, for instance, comprised 483 genes, while the homeostasis pathway included 282 genes (Table S2). Additionally, the panel addressed host susceptibility with 26 genes, innate immune cell activation with 567 genes, and the interferon response with 288 genes.
2.5. NanoString’s nCounter XT Gene Expression Assay
NanoString’s nCounter (NanoString Technologies, Inc. 530 Fairview Ave N, Seattle, WA, USA) technology was used to analyze the comparison of host response gene expression between COVID-19 (+) and COVID-19 (−) groups. This technology is based on digital detection and direct molecular barcoding of individual target molecules, using a unique probe pair for each target of interest. The probe pair consists of a color-coded reporter probe, which carries the visible signal on its 5′ end, and a capture probe, which carries a biotin moiety on the 3′ end. A total of 300 nanograms of RNA with an OD260/280 ratio between 1.7–2.2 were subjected to hybridization with a reporter and capture code set (HS host response) at 65 °C for over 12 h. Excess probes were eliminated using a two-step magnetic bead-based purification method on an nCounter instrument. The resulting purified target–probe complexes were eluted off the beads, immobilized on the cartridge, and aligned for data collection. Data collection was performed using epifluorescence microscopy and CCD capture technology on an nCounter instrument, generating hundreds of thousands of target molecule counts. Digital images were processed within the nCounter instrument, and the reporter probe counts were tabulated in a comma-separated value (CSV) format. The CSV file was analyzed with NanoString’s free nSolver™ Analysis Software V.4 (NanoString Technologies, Inc. 530 Fairview Ave N, Seattle, WA, USA).
2.6. Functional Enrichment Analysis
To understand the regulatory interactions between miRNA and mRNA, we used miRDIP (Version 5.3.0.1), a web-based platform that allows for the identification of bidirectional overlapping interactions between miRNAs and mRNAs in Homo sapiens. A total of 40 mRNAs showing the highest negative and positive fold differential expression in COVID-19 (+) versus COVID-19 (−) lung biopsy specimens were queried against a set of 113 significantly differentially expressed miRNAs. To enhance the reliability of our results, we used miR target predictions derived from two different databases, namely MBStar and miRbase, with a medium confidence threshold level; i.e., interactions were ranked in the top one-third (33.33%) of the predicted interactions reported [16].
Further, the Search Tool for Retrieval of Interacting Genes (STRING) database, which integrates both known and predicted protein–protein interactions (PPIs), was used for exploring the functional implications of our findings (https://string-db.org/ accessed on 1 March 2024). The active interaction sources including text mining, experiments, databases, and other co-expression analysis were used by STRING to construct the PPI networks, and the outcomes are represented as nodes and edges. The nodes correspond to the proteins, and the edges represent the interactions. Specifically, differentially expressed mRNAs were queried for proteins with values/ranks against Homo sapiens with log2-fold change input. The resulting network outcomes were visualized as nodes and edges, with nodes corresponding to the proteins and the edges representing the interactions.
Finally, we manually analyzed the Kyoto Encyclopedia of Genes and Genomes (KEGG) pathways for the highest associations with differentially expressed gene sets.
2.7. Statistical Analysis
To visualize the partition among the groups and identify the major sources of variation within the experiment, we conducted principal component analysis (PCA) Partek (Partek® Flow® software, version 9.0.20.0622, Copyright © 2020, Partek Inc., St. Louis, MO, USA). Additionally, the differential expressions were calculated using ANOVA of Partek Package and heat maps were generated by hierarchical clustering of miRNA. The results were normalized using robust multichip averages. T-tests were used to determine whether there was a significant difference (2.5 fold) for miRNA expression between the COVID-19 (−) and the COVID-19 (+) groups. The p-value (0.05) was taken as significant.
3. Results
3.1. COVID-19 Patients and Control Demographics
In this study, a cohort of 12 samples was subjected to analysis, comprising 7 males and 5 females, with an age distribution ranging from 33 to 100 years (Table 1). Among these specimens, 5 were diagnosed with COVID-19, encompassing 4 males and 1 female, aged between 40 and 80 years. All COVID-19 cases resulted in mortality attributed to COVID-19-induced pneumonia. The control group samples predominantly exhibited pathology consistent with atherosclerotic cardiovascular disease and complications arising from diabetes, contributing to their fatal outcomes. Also, one control was included as duplicate sample in Nanostring analysis but not in the miRNA analysis.

Table 1.
Demograhic details of the COVID-19 positive and negative samples.
3.2. miRNA Expression Alterations in Lung Biopsy Specimens of COVID-19 Patients
The study identified 37 miRNAs that were downregulated and 77 miRNAs that were upregulated in COVID-19 (+) lung biopsy specimens compared to COVID-19 (−) lung biopsy specimens, with a significant difference of 2.5-fold miRNA expression and a p-value of 0.05 (Table S3). Hierarchical cluster analysis was used to generate a heatmap of the differentially expressed miRNAs using the Partek Package (Figure 1). The analysis revealed a distinct split between those who died from COVID-19 and those who died from other causes.
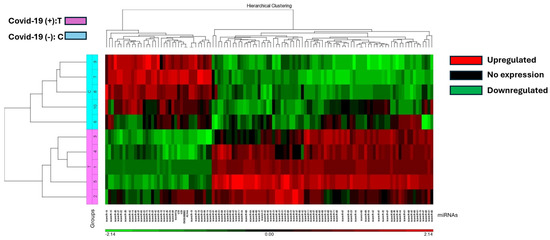
Figure 1.
The heat map illustrates miRNA expression patterns in COVID-19 positive (T) and negative (C) lung biopsies. Five samples from each group were analyzed using the Affymetrix array system. miRNAs are represented as columns, while samples are depicted as rows. Expression levels are color-coded: red indicates higher expression, black indicates no expression, and green indicates lower expression. COVID-19 positive samples are denoted in pink, while negative samples are highlighted in blue.
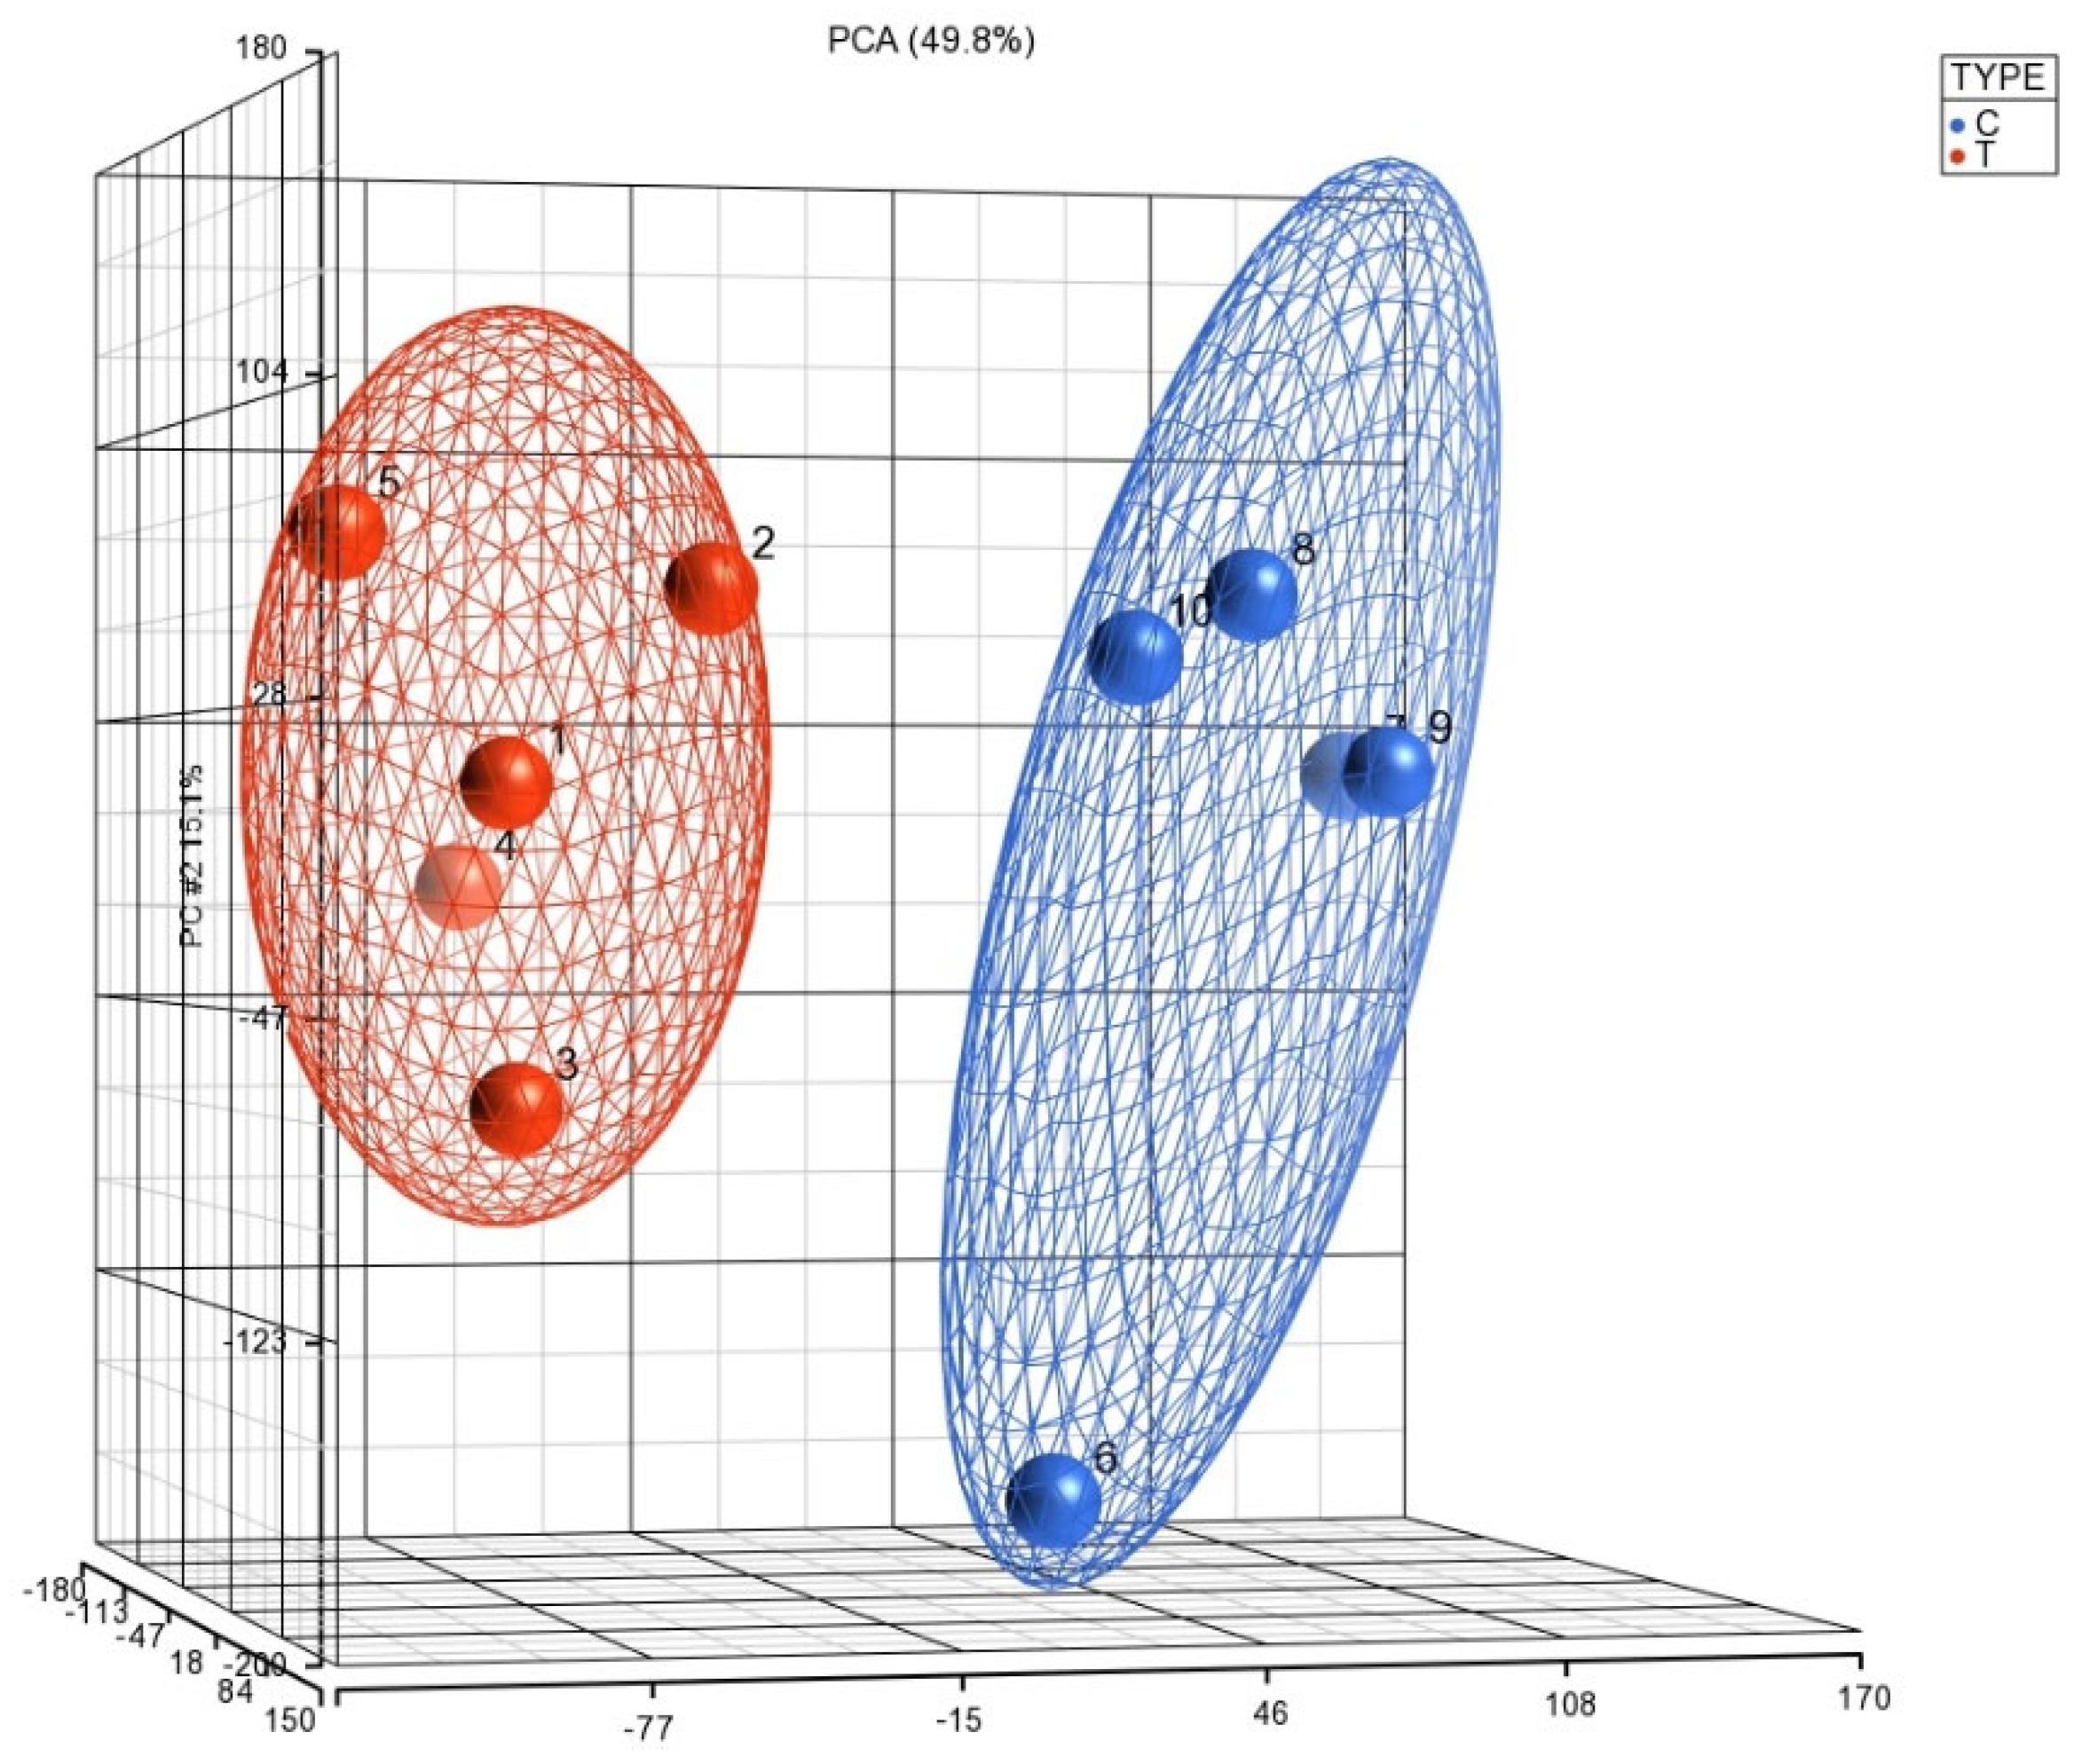
This was supported by Principal Component Analysis (PCA) K-means clustering, which demonstrated the distinct clustering of data between the 5 COVID-19 (+) and 5 COVID-19 (−) biopsy specimens (Figure 2). The 10 most downregulated miRNAs were hsa-miR-30c-5p, hsa-miR-150-5p, hsa-miR-342-3p, hsa-miR-30b-5p, hsa-miR-30a-3p, hsa-miR-99a-5p, hsa-miR-15b-5p, hsa-miR-145-5p, hsa-miR-361-5p, and hsa-miR-125b-5p. The miRNA with the highest differential expression was hsa-miR-30c-5p, with a −5.75965 fold-change in COVID-19 (+) samples. The 10 most upregulated miRNAs were hsa-miR-5703, hsa-miR-5739, hsa-miR-4788, hsa-miR-6086, hsa-miR-4689, hsa-miR-6870-5p, hsa-miR-5195-3p, hsa-miR-6893-5p, hsa-miR-4442, and hsa-miR-642b-3p. The miRNA with the highest differential expression was hsa-miR-642b-3p, with a 5.1684-fold change in COVID-19 (+) samples.

Figure 2.
The PCA plot illustrates the distribution of miRNA expression patterns in lung biopsies from COVID-19 positive (T) and negative (C) cases, obtained from postmortem formalin-fixed paraffin-embedded samples using the Affymetrix array system. The x-axis represents the expression levels of genes, with negative values indicating downregulation and positive values indicating upregulation. The y-axis and z-axis denote the percentage of variance explained by the principal components, with PCA 15.1% and PCA 49.8%, respectively. This visualization enables the exploration of overall miRNA expression trends and clustering patterns between COVID-19 positive and negative lung biopsies.
3.3. Perturbed mRNA Expression Profiles in COVID-19 Lung Biopsies
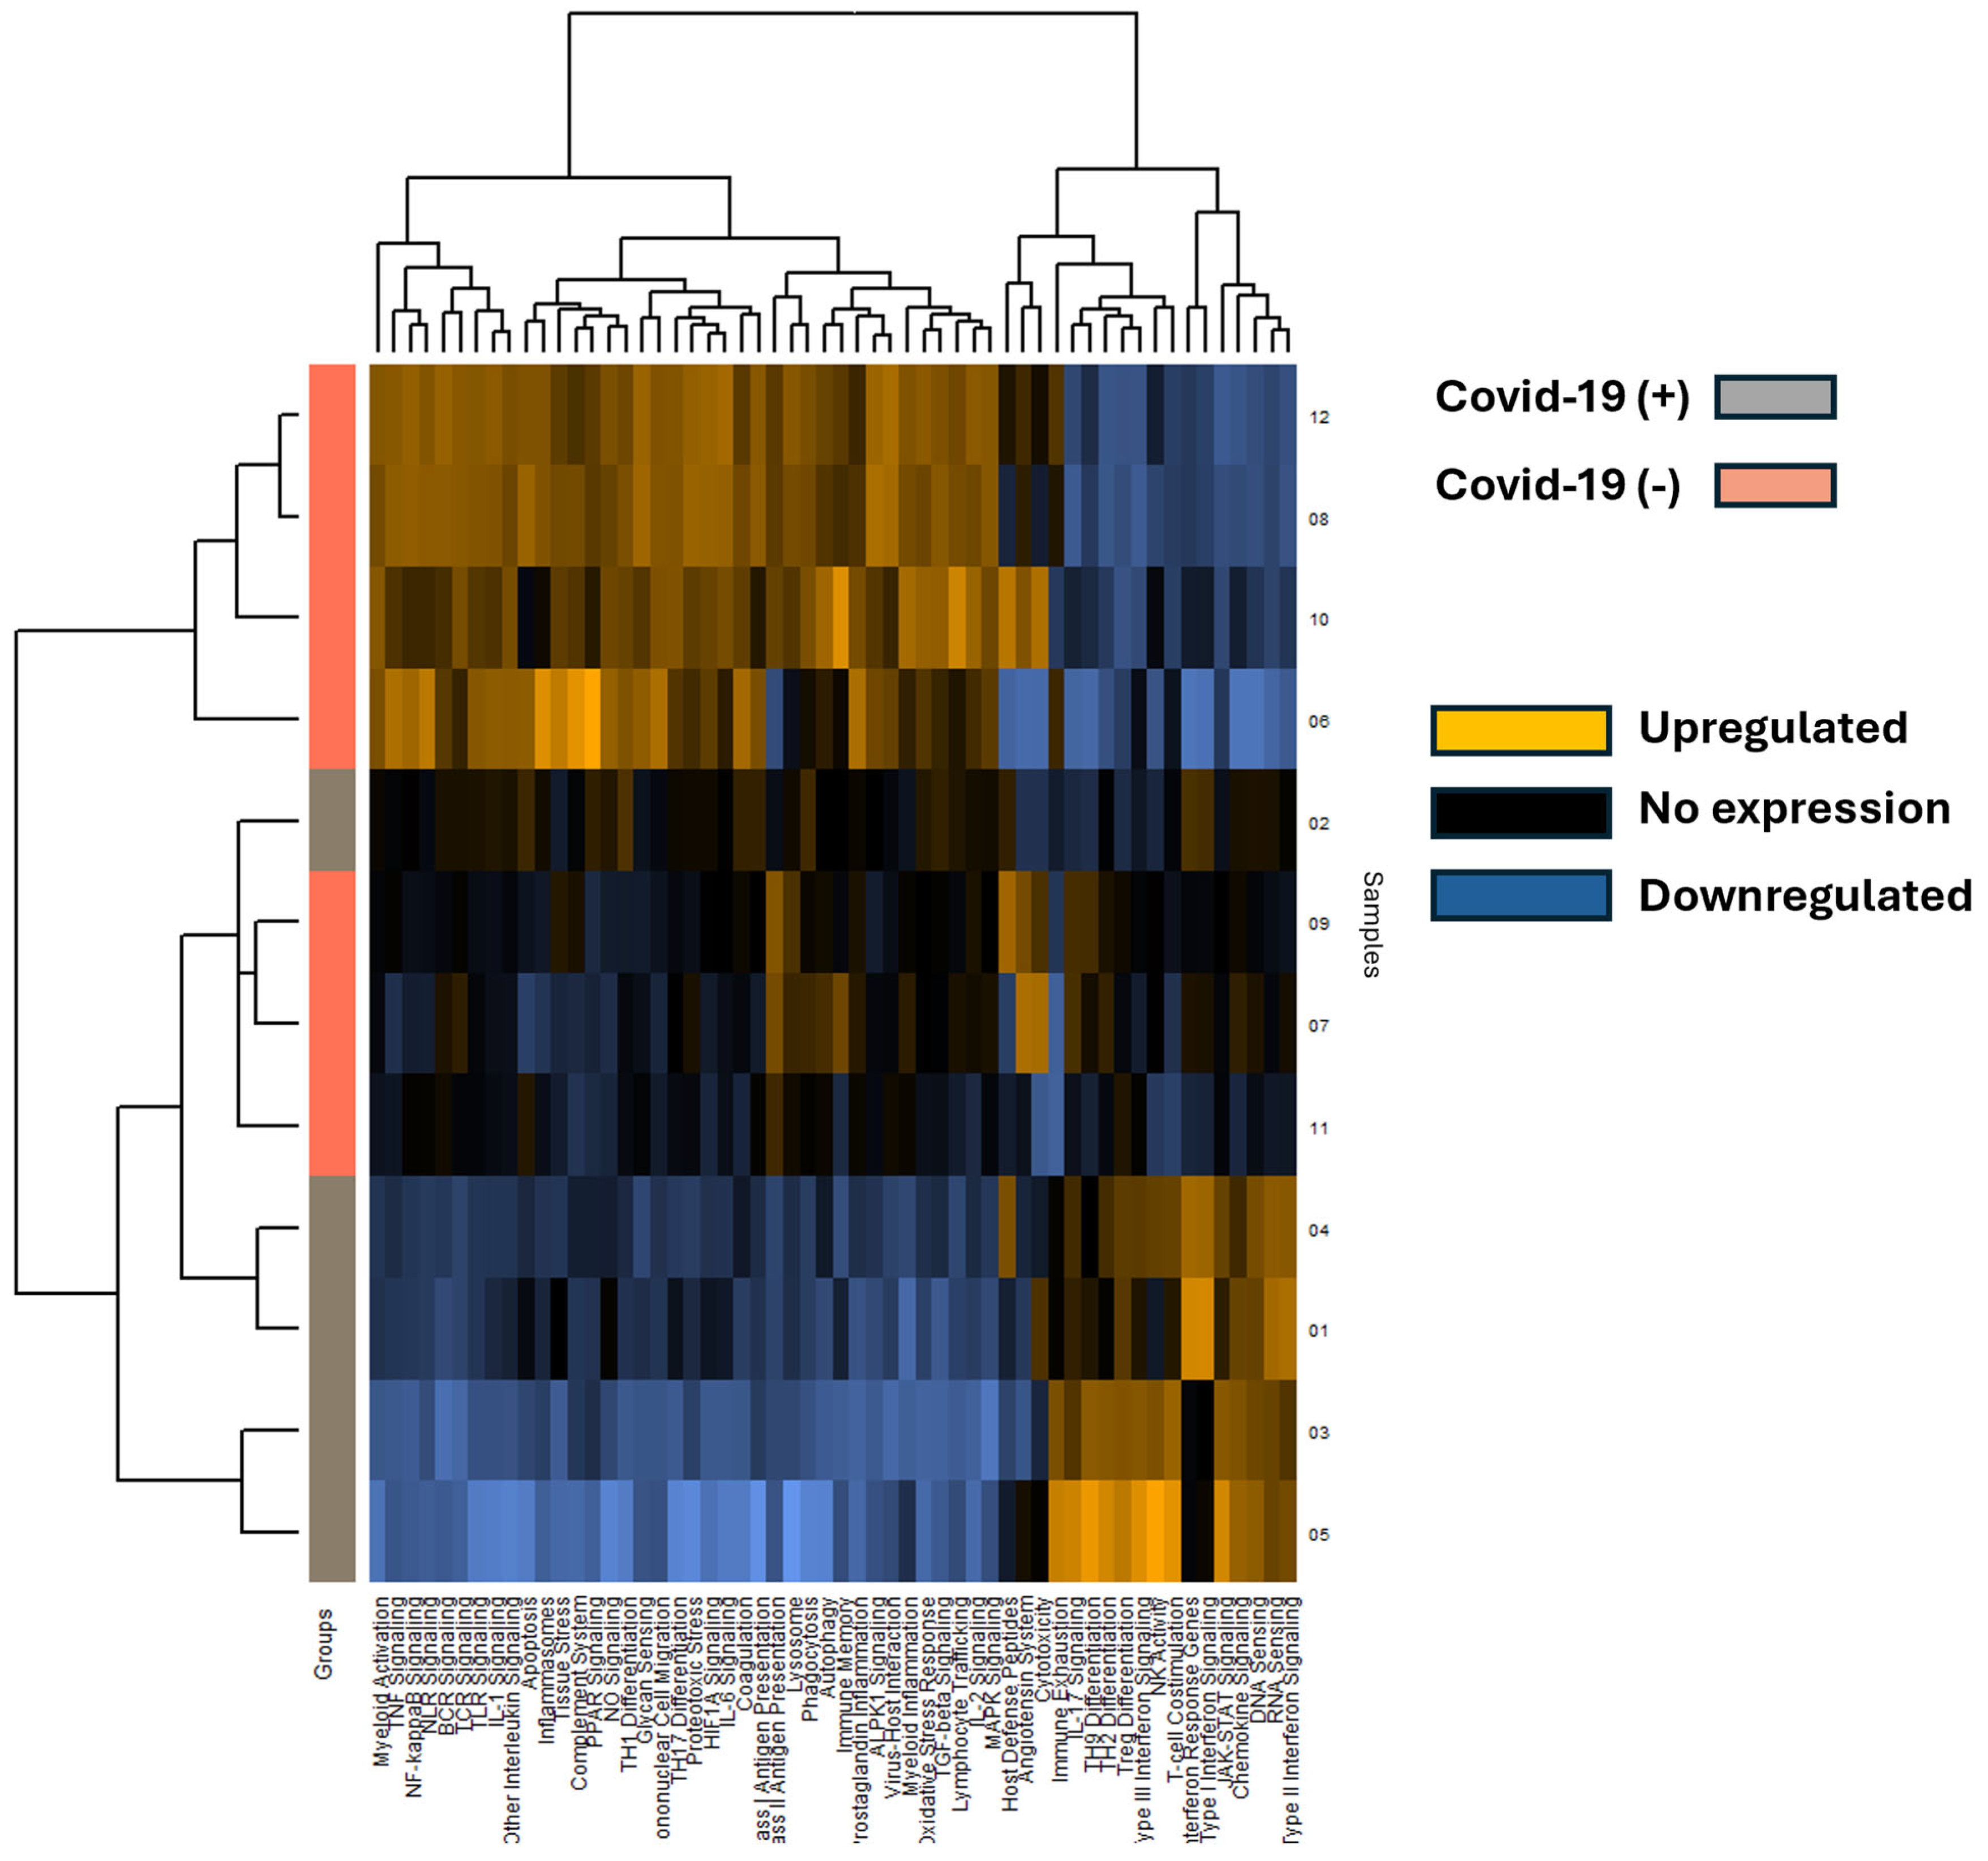
A total of 653 mRNA transcripts were found to be differentially expressed between the COVID-19 (+) and COVID-19 (−) samples. Interestingly, a greater number of transcripts were downregulated (472) than upregulated (170) in the COVID-19 (+) specimens. The mRNA heatmap of expression was generated using Nanostring Advanced Analysis software, which revealed distinct clustering between COVID-19 (+) and COVID-19 (−) patients (Figure 3). Notably, COVID-19 (+) patient 2 clustered with the COVID-19 (−) specimens, while the added COVID-19 (−) patients 11 and 12 clustered closest and furthest away from the COVID-19 (+) group, respectively. These findings suggest that COVID-19 infection may have a greater impact on downregulating mRNA transcripts in lung tissue. The mRNA transcripts that showed a greater than 2.0 log2-fold change in expression are listed in Table 2, and the top 40 differentially expressed transcripts (both up and down) were further analyzed by miRNA target analysis.

Figure 3.
The heatmap displays mRNA pathway scores derived from Nanostring Advanced Analysis, with COVID-19 positive (+) specimens represented by grey rows and COVID-19 negative (−) specimens by salmon-colored rows. Each column represents a differentially expressed mRNA, and patient sample numbers are indicated as rows. Notably, COVID-19 positive sample 2 appears unclustered with other COVID-19 positive samples. Expression levels are color-coded: blue indicates lower expression, black indicates no expression, and gold indicates higher expression.
Table 2.
List of differentially expressed mRNA with log2 fold change, standard error, confidence, and significant limits along with the associated gene sets.
3.4. Differential Gene Expression and Pathway Enrichment of Host Cellular Responses to COVID-19 Infection in Lung
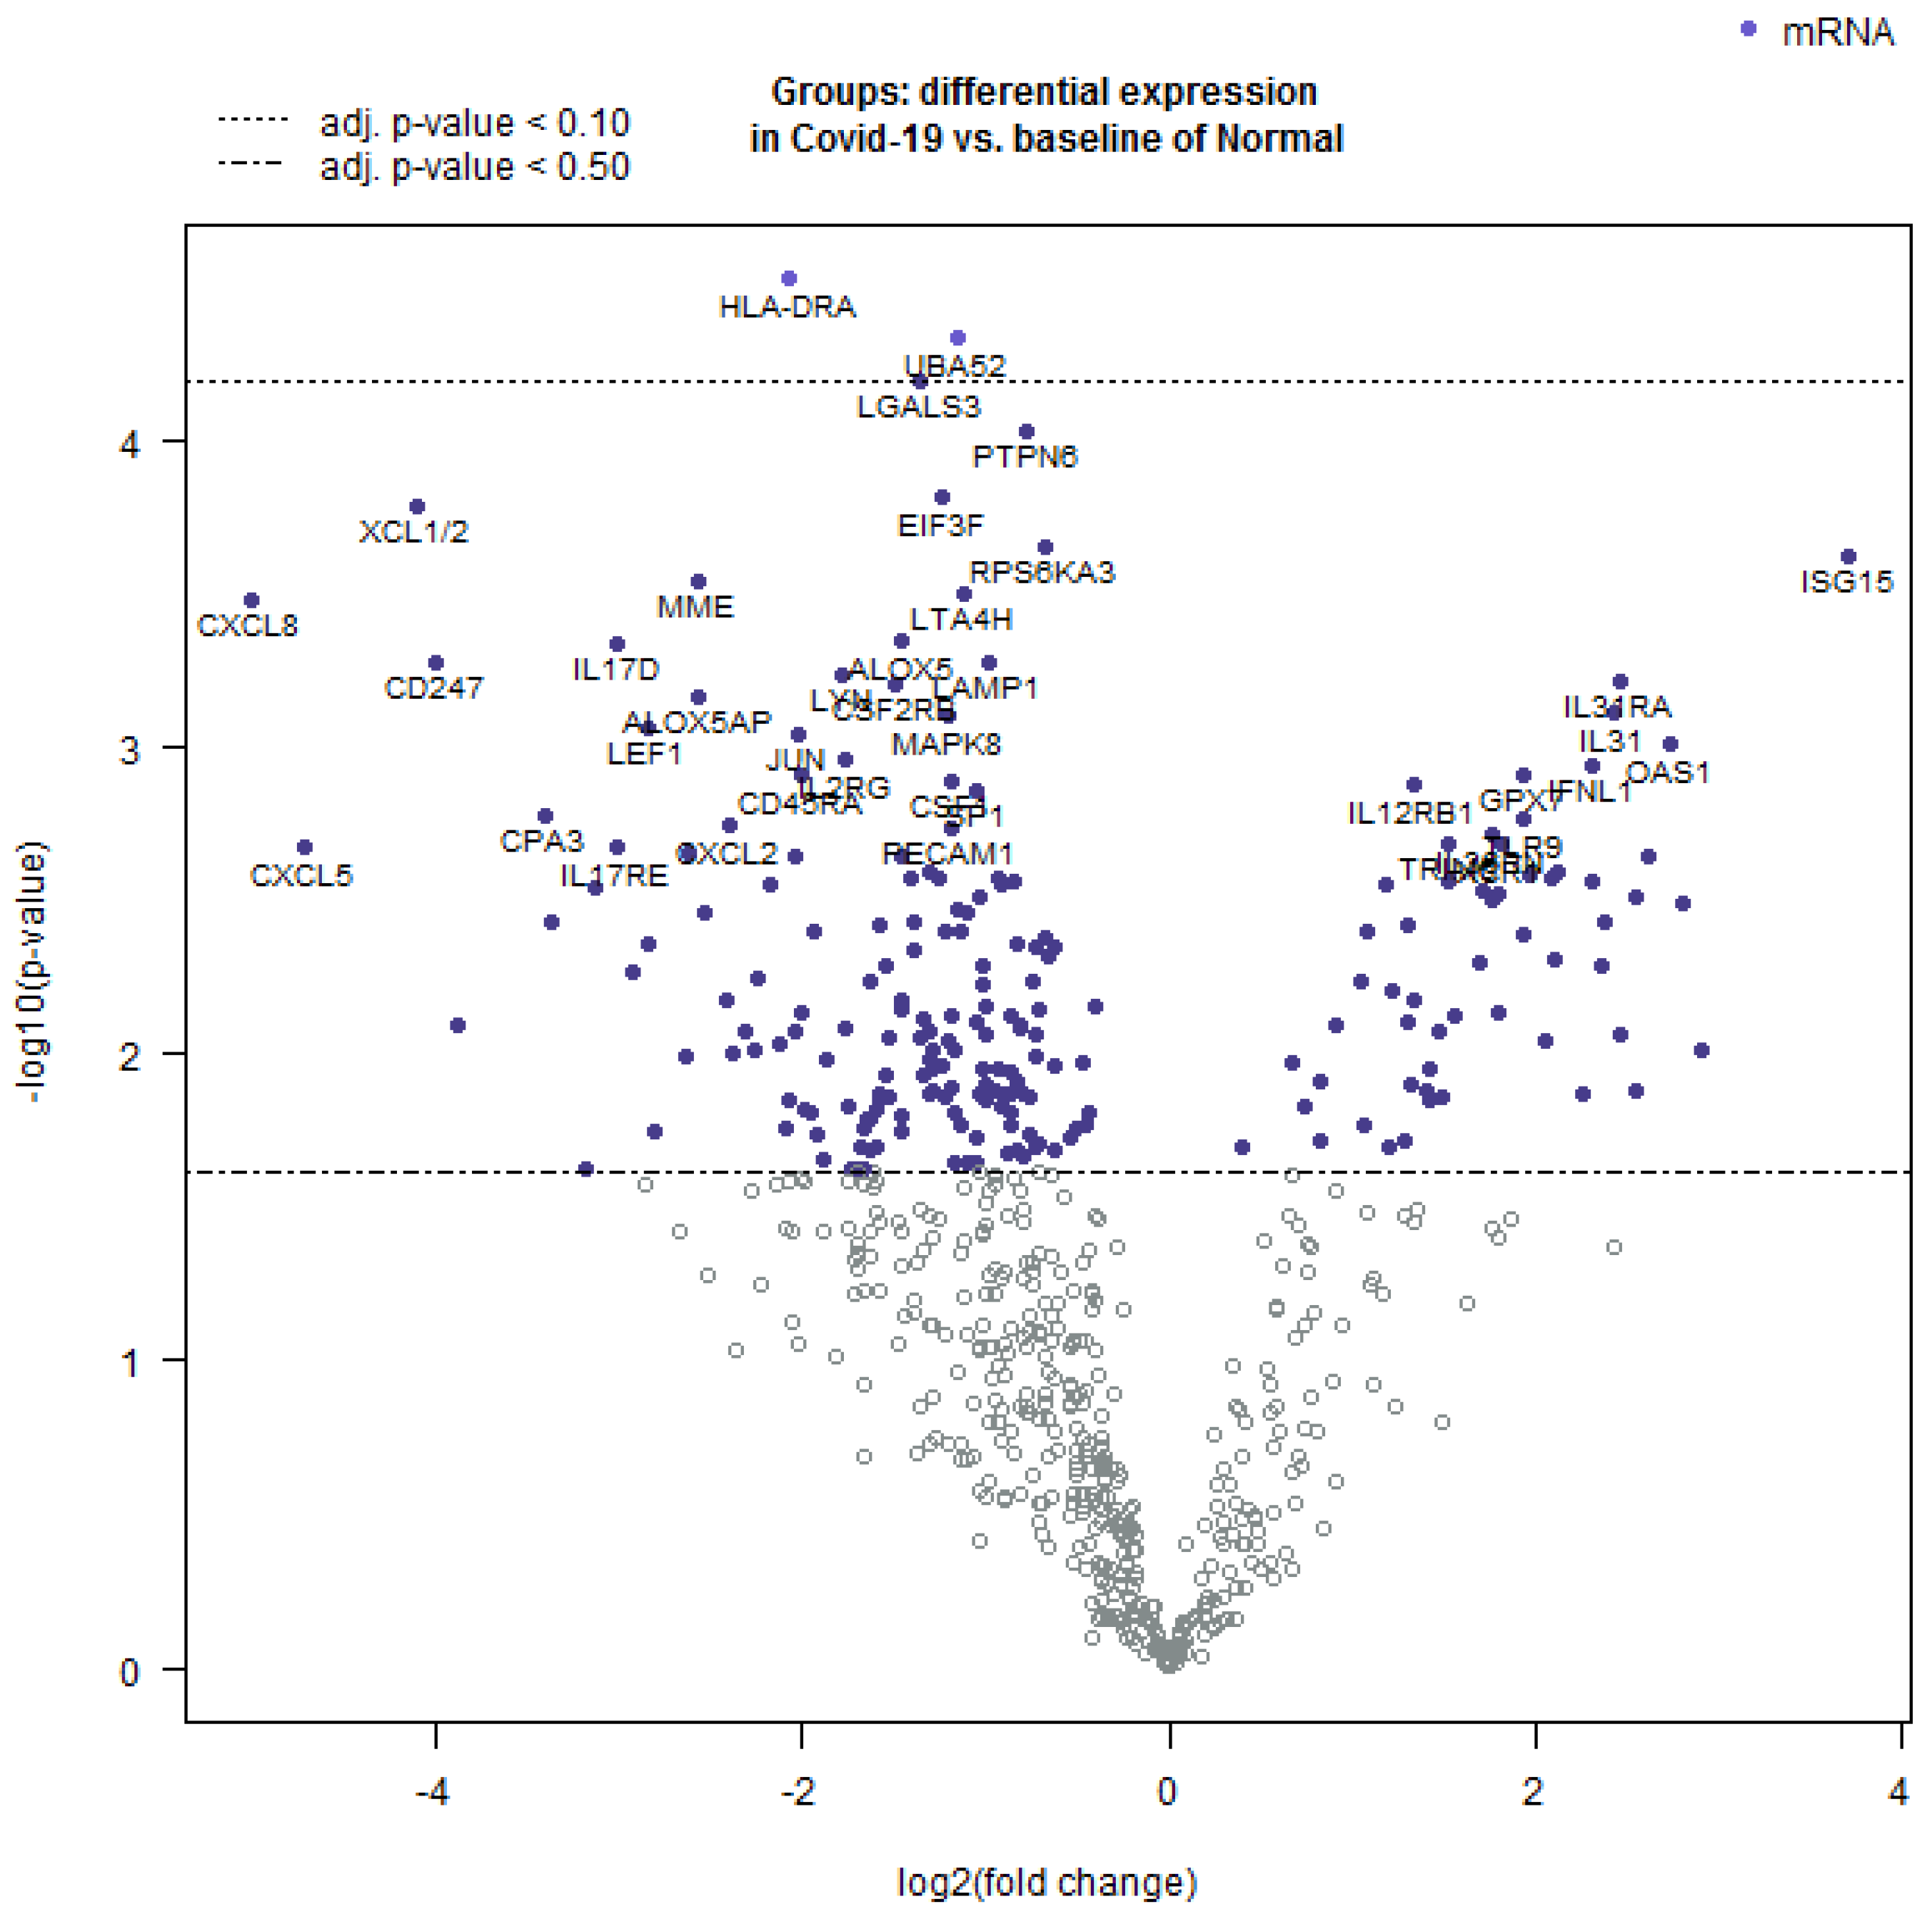
Further, the Nanostring Advanced Analysis software package was employed to create a volcano plot of differentially expressed transcripts (Figure 4). The highest positive log2-fold differentially expressed mRNA was observed for genes involved in innate immunity, while those with a negative log2-fold differential expression were important for the inflammatory response.
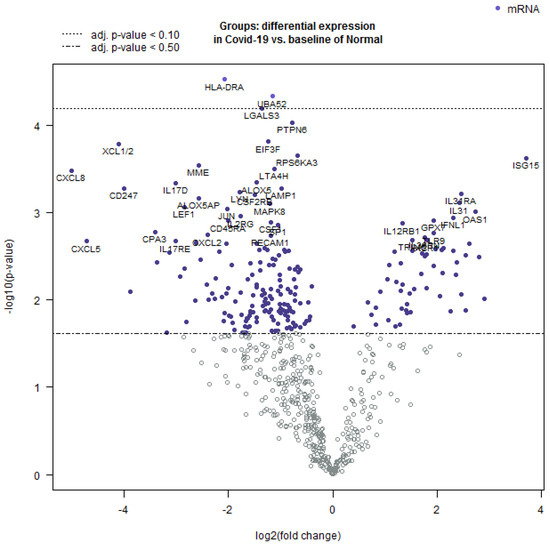
Figure 4.
Volcano plot showing the comparison of differentially expressed mRNAs in COVID-19 as compared to normal lung tissue. The log 10-fold change was observed in the variables and the statistical significance was set at p < 0.05. The values that are farthest from the center were considered as most significant. The white dots represent markers that are below the threshold and close to 0 and thus represent non-significant fold change.
An undirected and directed global significance scores table was generated using the same package, and three pathways were positively directed in COVID-19 (+) compared to baseline COVID-19 (−), including type III interferon signaling, interferon response genes, and type I interferon signaling (Table 3). Conversely, tissue stress, ALPK1 signaling, and leukotriene and prostaglandin inflammation were negatively directed in COVID-19 (+).
Table 3.
The Nanostring undirected and directed global significance scores table showcases the global significance scores and directed global significance scores for each sample, as defined in the accompanying heatmaps. The global significance score is derived from the square root of the mean squared t-statistic for the genes within a gene set, utilizing the t-statistics obtained from the linear regression that underlies our differential expression analysis. Similarly, the directed global significance score is calculated from the square root of the mean signed squared t-statistic for the genes within a gene set, utilizing the same t-statistics from the linear regression.
Additionally, cluster analysis for pathway enrichment was conducted using the STRING online tool, which revealed that genes involved in the type 1 interferon signaling pathway were highly differentially expressed and associated with upregulated genes in the COVID-19 (+) lung biopsy specimen (Figure 5).
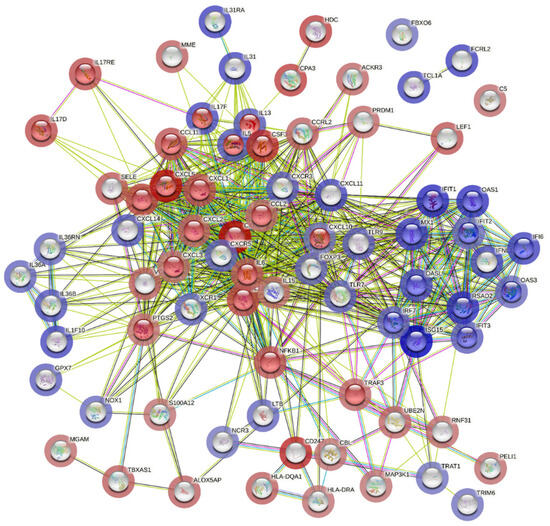
Figure 5.
Potential interactions among genes involved in the type 1 interferon signaling pathway using STRING (Search Tool for the Retrieval of Interacting Genes/Proteins). The colored edges reflect different types of protein-protein interactions: red edges indicate interactions curated from known databases, green edges depict interactions predicted through gene fusions, and blue edges represent gene co-occurrence. The proteins jointly contribute to a shared function and do not necessarily physically bind to each other. The nodes are color-coded to represent query proteins and their interaction shells: dark red for the first shell of interaction and light red for the second shell. Similarly, nodes are colored dark and light blue to denote the interaction shells.
On the other hand, genes involved in the interleukin-17 signaling pathway correlated with downregulated genes, which corroborated the global significance scores data (Figure 5). These findings provide a molecular signature of the host cellular responses to acute severe COVID-19 infection in lung tissues.
4. Discussion
The SARS-CoV-2, a novel coronavirus, is widely recognized to have originated from zoonotic coronaviruses, causing severe pneumonia and lung failure, posing a threat to global public health [17]. Diagnostic kits to test for COVID-19 are currently available, and several antiviral agents, including favipiravir, remdesivir, lopinavir, and ritonavir, have exhibited clinical efficacy against SARS-CoV-2 [18]. Despite the significant progress in developing vaccines and drugs against COVID-19, the mechanisms underlying the pathogenesis of SARS-CoV-2-associated lung disorders in humans remain incompletely understood. Here, we have conducted one of the initial investigations measuring combined miRNA and mRNA expression levels in COVID-19 afflicted lung biopsy tissue. Our study utilizes locally and tissue-specific expressed gene signatures to elucidate the underlying regulatory pathways and networks underlying severe COVID-19 infection and its fatal progression.
A significant differential expression of microRNAs and mRNAs between COVID-19-infected and non-infected lung tissues was observed in this study. Specifically, we have identified 37 microRNAs that were downregulated and 77 microRNAs that were upregulated in COVID-19-infected tissues. In addition, we found 472 mRNAs that were downregulated and 170 mRNAs that were upregulated in COVID-19 (+) biopsy specimens compared to COVID-19 (−) lung biopsy specimens. Upon further analysis of the differentially expressed mRNA, we observed that the highest and lowest differentially regulated genes were predominantly involved in immune regulation, supporting the notion that immune dysregulation is a crucial factor in the progression of severe COVID-19 infection and death. Of particular interest were two genes, CXCL5 and CXCL8, which play a significant role in neutrophil recruitment and accumulation [19] and have been shown to be dysregulated in the cytokine storm associated with COVID-19 infection [20]. Our dataset demonstrated downregulation of both CXCL5 and CXCL8 in COVID-19 (+) lung biopsy specimens, with these genes having the most negative Log2 fold change difference compared to COVID-19 (−) lung tissues. We also identified miR-23a and miR-23b as significantly downregulated in our samples, which are predicted to target CXCL5, further supporting the role of immune dysregulation in COVID-19 infection. Additionally, we found other mediators of neutrophil recruitment, such as CXCL1 [21], as well as NFKB1 [22], which is important for innate immune response and inflammation activation, to be downregulated in COVID-19 (+) tissues. We also observed patterns of chronic inflammation downregulation in COVID-19 (+) tissues, specifically the downregulation of IL-6, a key gene in promoting chronic inflammation by recruiting monocytic lineages to replace first responder polymorphonuclear neutrophils [23]. Because we used probe alignment systems, COVID-19 viral RNA was not detected and did not influence this analysis.
The innate immune system plays a crucial role in detecting and responding to infections. Dendritic cells, macrophages, and natural killer cells express toll-like receptors (TLRs) that recognize pathogen-associated molecular patterns (PAMPs) and damage-associated molecular patterns (DAMPs) [24]. Activation of TLR pathways leads to the production of pro-inflammatory cytokines, such as interleukin-1 (IL-1), IL-6, tumor necrosis factor-α, and type 1 interferon (IFN-1) [25]. In COVID-19, TLRs, especially TLR7 and TLR8, which bind to single-stranded RNA, are enriched in lung tissues and play critical roles in different stages of the immune response [26]. The TLR pathways promote IFN-1 signaling, which induces the production of pro-inflammatory cytokines and activates the ISG15-mediated antiviral innate response [27]. In COVID-19, the lung tissue response to the viral invasion becomes evident when evaluating the ISG15 pathway. In this study, the highest differentially expressed genes in COVID-19 (+) tissue, including ISG15 itself, IFIT1, RSAD2, OAS1, MX1, OASL, and IFIT3, are all important for the ISG15 pathway’s progression and are part of the lung tissue’s antiviral response. While the ISG15 pathway’s role in antiviral response is established, it is emerging as a key facilitator of local inflammation and poor outcomes in COVID-19 [27,28].
Several miRNAs, known to repress and fine-tune this pathway, were identified as downregulated in the miRNA list. For example, hsa-miR-146a-5p exhibited a greater than −3 fold-change in COVID-19 (+) tissue. Predicted miRNA targets, including IFIT1, IFI6, IFIT3, OASL, and OAS3, were all upregulated in the mRNA list and important for the ISG15 pathway’s progression. MiR-146a deficiency is associated with excessive inflammation, as MiR-146a leads to activation of the host antiviral response, and downregulation in chronic inflammatory states such as obesity, diabetes, and hypertension may lead to increased COVID-19 infection severity [29]. Further investigation of miRNAs such as miR-146a and the ISG15 pathway’s modulation is warranted to determine their regulatory role in the antiviral response.
Upon analyzing the datasets, a prominent theme that emerges is the nature of the response elicited. The functional enrichment analysis of STRING revealed that a considerable number of actors involved in pro-inflammatory Th17 response exhibited downregulation, whereas those associated with the T-helper cell subset Th1 response demonstrated upregulation in COVID-19 (+) lung tissue. Although this trend aligns with the current understanding of immunology, several studies conducted on peripheral serum indicate that Th17 cytokines are generally upregulated in systemic COVID-19 infection [30,31,32]. The discrepancy between serum studies and the present data derived from lung biopsy specimens highlights the significance of tissue-level analysis. A closer inspection of the mRNA list unveils another interesting pattern—Th2 supporting cytokines such as IL5 and IL13 are among the most positively upregulated mRNAs in COVID-19 (+) samples. Th2 cell-mediated immune functions are generally classified into two roles: innate response to large extracellular pathogens like helminths and promotion of allergic and atopic immunology [33]. Furthermore, the 11th and 9th most differentially expressed transcripts in COVID-19 (+) biopsy belonged to IL31 and its receptor IL31RA, respectively. IL31 is a potent regulator of atopic response and downstream too, as well as possibly promoting Th2 differentiation. Due to its role in allergic inflammation, IL31 has earned the moniker the “itchy” cytokine and has been linked to inflammatory bowel disease, airway hypersensitivity in asthma, dermatitis, and pulmonary fibrosis [34,35,36].
Based on current evidence, there is a strong likelihood that the T-helper cell-mediated immune responses observed in the lung and serum during severe COVID-19 infection may differ significantly. If Th2-mediated allergic reactions are indeed present, this could lead to significant implications for the prevention and treatment of severe COVID-19. To gain deeper insight into this phenomenon, miRNA datasets should be examined. Specifically, the almost 3-fold downregulation of hsa-let-7g-5p, which is predicted to target IL13, is noteworthy. The Let-7g family is known to modulate inflammation and has been shown to directly reduce allergic airway inflammation by binding IL13. Recent studies have hypothesized that IL13 may be a driver of COVID-19 severity [37]. Other miRNAs and mRNA targets, such as downregulated hsa-miR-125b-5p and upregulated IL31, as well as downregulated hsa-miR-145-5p and upregulated IL31a, are also present. It is plausible that the development of diffuse alveolar damage and acute respiratory distress syndrome during severe COVID-19 infection could be partially allergy-mediated through dysregulation, which necessitates further research.
Taken together, our findings highlight the crucial role of immune dysregulation in the pathogenesis of severe COVID-19 infection in lungs and provide valuable insights into potential therapeutic targets for mitigating the deleterious effects of COVID-19.
5. Limitations
5.1. Limited Information on Lung Sample Location
The present study lacks data regarding the specific location within the lung from which the samples were obtained. While acknowledging the importance of such information, particularly in the context of SARS-CoV-2 infection dynamics, this study was constrained by the available resources. Nevertheless, future investigations could benefit from incorporating this detail to enhance the understanding of viral tropism and host response.
5.2. Low Sample Size
Another constraint of the present study is the relatively small sample size. Increasing the sample size could enhance the statistical power of the analyses and provide more robust conclusions. Efforts to expand sample collection should be pursued in future research endeavors to further validate our findings.
5.3. Selection of Control Group
The choice of control group, comprising individuals with various non-COVID-19-related conditions like atherosclerosis and diabetes could also influence the immune signaling and could affect the results. While this selection allowed for comparisons across different inflammatory contexts, it may introduce confounding factors, particularly considering the dysregulation of pro-inflammatory signals and immune-related proteins in affected tissues.
6. Conclusions
Immune dysregulation emerges as a crucial factor in the progression of severe COVID-19 infection and death, with genes involved in immune regulation showing the highest differential regulation. This study sheds light on the underlying mechanisms of severe COVID-19 infection and its fatal progression by analyzing locally and tissue-specific expressed gene signatures. The findings reveal significant differential expression of microRNAs and mRNAs in COVID-19-infected lung tissues compared to non-infected tissues. The study also identifies downregulation of key genes involved in neutrophil recruitment and accumulation, as well as chronic inflammation, suggesting their role in COVID-19 infection. The innate immune response, toll-like receptor pathways, and the ISG15 pathway are implicated in the lung tissue’s antiviral response to COVID-19. Dysregulated miRNAs in the ISG15 pathway and Th2-mediated immune responses may have implications for the severity of COVID-19 infection and the development of allergic reactions. Further research is needed to explore the regulatory roles of miRNAs and the modulation of immune responses in COVID-19.
Supplementary Materials
The following supporting information can be downloaded at: https://www.mdpi.com/article/10.3390/v16060853/s1, Table S1: List of reference genes included in the NanoString’s nCounter® Host Reponse Panel, Table S2: Showing the summary of Pathways, Cell Types, and Functional Themes provided by the NanoString’s nCounter® Host Reponse Panel, Table S3: Showing the differentially expressed miRNAs in COVID-19 (+) and COVID-19 (−) lung biopsy specimen. The p-value of 0.05 was taken as statistically significant.
Author Contributions
Conceptualization, R.B., A.K.M. and R.K.; methodology, R.B., A.K.M., A.V., N.S. and K.J.; software, A.K.M. and N.S.; validation, R.B. and A.K.M.; formal analysis, R.B., A.K.M., A.V. and N.S.; investigation, R.B. and A.K.M.; resources, R.K.; data curation, R.B., A.K.M., A.V. and N.S.; writing—R.B, A.K.M. and A.V.; writing—review and editing, N.S., V.V., H.S. and J.F.; visualization, R.B., A.K.M., A.V. and N.S.; supervision, R.K.; project administration, R.K.; funding acquisition, R.K. All authors have read and agreed to the published version of the manuscript.
Funding
This research received no external funding.
Institutional Review Board Statement
The study was conducted under Augusta University IRB protocol number 611298.
Informed Consent Statement
As the samples were obtained from tumor bank and all the samples were de-identified, patient consent was waived off.
Data Availability Statement
No new datasets were created.
Conflicts of Interest
The authors declare no conflicts of interest.
References
- Vincent, J.-L.; Taccone, F.S. Understanding pathways to death in patients with COVID-19. Lancet Respir. Med. 2020, 8, 430–432. [Google Scholar] [CrossRef] [PubMed]
- Fine, D.H.; Mendieta, C.; Barnett, M.L.; Furgang, D.; Meyers, R.; Olshan, A.; Vincent, J. Efficacy of preprocedural rinsing with an antiseptic in reducing viable bacteria in dental aerosols. J. Periodontol. 1992, 63, 821–824. [Google Scholar] [CrossRef] [PubMed]
- Dorward, D.A.; Russell, C.D.; Um, I.H.; Elshani, M.; Armstrong, S.D.; Penrice-Randal, R.; Lucas, C.D. Tissue-specific immunopathology in fatal COVID-19. Am. J. Respir. Crit. Care Med. 2021, 203, 192–201. [Google Scholar] [CrossRef] [PubMed]
- Pandey, P.; Agarwal, S. Lung pathology in COVID-19: A systematic review. Int. J. Appl. Basic Med. Res. 2020, 10, 226. [Google Scholar] [CrossRef] [PubMed]
- Banerjee, A.; El-Sayes, N.; Budylowski, P.; Jacob, R.A.; Richard, D.; Maan, H.; Mossman, K. Experimental and natural evidence of SARS-CoV-2-infection-induced activation of type I interferon responses. IScience 2021, 24, 102477. [Google Scholar] [CrossRef] [PubMed]
- Kawai, T.; Akira, S. Innate immune recognition of viral infection. Nat. Immunol. 2006, 7, 131–137. [Google Scholar] [CrossRef] [PubMed]
- de Paula, C.B.V.; de Azevedo, M.L.V.; Nagashima, S.; Martins, A.P.C.; Malaquias, M.A.S.; Miggiolaro, A.F.R.d.S.; Júnior, J.d.S.M.; Avelino, G.; Carmo, L.A.P.D.; Carstens, L.B.; et al. IL-4/IL-13 remodeling pathway of COVID-19 lung injury. Sci. Rep. 2020, 10, 18689. [Google Scholar] [CrossRef] [PubMed]
- Su, C.-M.; Wang, W.; Yoo, D. Activation of NF-κB and induction of proinflammatory cytokine expressions mediated by ORF7a protein of SARS-CoV-2. Sci. Rep. 2021, 11, 13464. [Google Scholar] [CrossRef]
- Rincon-Arevalo, H.; Aue, A.; Ritter, J.; Szelinski, F.; Khadzhynov, D.; Zickler, D.; Stefanski, L.; Lino, A.C.; Körper, S.; Eckardt, K.; et al. Altered increase in STAT1 expression and phosphorylation in severe COVID-19. Eur. J. Immunol. 2022, 52, 138–148. [Google Scholar] [CrossRef]
- Delorey, T.M.; Ziegler, C.G.K.; Heimberg, G.; Normand, R.; Yang, Y.; Segerstolpe, A.; Abbondanza, D.; Fleming, S.J.; Subramanian, A.; Montoro, D.T.; et al. COVID-19 tissue atlases reveal SARS-CoV-2 pathology and cellular targets. Nature 2021, 595, 107–113. [Google Scholar] [CrossRef]
- Nemecz, M.; Alexandru, N.; Tanko, G.; Georgescu, A. Role of microRNA in endothelial dysfunction and hypertension. Curr. Hypertens. Rep. 2016, 18, 87. [Google Scholar] [CrossRef] [PubMed]
- Bruscella, P.; Bottini, S.; Baudesson, C.; Pawlotsky, J.-M.; Feray, C.; Trabucchi, M. Viruses and miRNAs: More friends than foes. Front. Microbiol. 2017, 8, 824. [Google Scholar] [CrossRef] [PubMed]
- Stolzenburg, L.R.; Harris, A. The role of microRNAs in chronic respiratory disease: Recent insights. Biol. Chem. 2018, 399, 219–234. [Google Scholar] [CrossRef] [PubMed]
- Bartoszewski, R.; Dabrowski, M.; Jakiela, B.; Matalon, S.; Harrod, K.S.; Sanak, M.; Collawn, J.F. SARS-CoV-2 may regulate cellular responses through depletion of specific host miRNAs. Am. J. Physiol. -Lung Cell. Mol. Physiol. 2020, 319, L444–L455. [Google Scholar] [CrossRef] [PubMed]
- Khan, M.A.A.K.; Sany, M.R.U.; Islam, M.S.; Islam, A.B.M.M.K. Epigenetic regulator miRNA pattern differences among SARS-CoV, SARS-CoV-2, and SARS-CoV-2 world-wide isolates delineated the mystery behind the epic pathogenicity and distinct clinical characteristics of pandemic COVID-19. Front. Genet. 2020, 11, 765. [Google Scholar] [CrossRef] [PubMed]
- Tokar, T.; Pastrello, C.; Rossos, A.E.; Abovsky, M.; Hauschild, A.C.; Tsay, M.; Jurisica, I. mirDIP 4.1—Integrative database of human microRNA target predictions. Nucleic Acids Res. 2018, 46, D360–D370. [Google Scholar] [CrossRef] [PubMed]
- Li, H.; Liu, S.-M.; Yu, X.-H.; Tang, S.-L.; Tang, C.-K. Coronavirus disease 2019 (COVID-19): Current status and future perspectives. Int. J. Antimicrob. Agents 2020, 55, 105951. [Google Scholar] [CrossRef] [PubMed]
- Ahn, D.-G.; Shin, H.-J.; Kim, M.-H.; Lee, S.; Kim, H.-S.; Myoung, J.; Kim, B.-T.; Kim, S.-J. Current status of epidemiology, diagnosis, therapeutics, and vaccines for novel coronavirus disease 2019 (COVID-19). J. Microbiol. Biotechnol. 2020, 30, 313–324. [Google Scholar] [CrossRef]
- Kitamura, T.; Qian, B.-Z.; Pollard, J.W. Immune cell promotion of metastasis. Nat. Rev. Immunol. 2015, 15, 73–86. [Google Scholar] [CrossRef]
- Sims, J.T.; Krishnan, V.; Chang, C.-Y.; Engle, S.M. Characterization of the cytokine storm reflects hyperinflammatory endothelial dysfunction in COVID-19. J. Allergy Clin. Immunol. 2021, 147, 107–111. [Google Scholar] [CrossRef] [PubMed]
- Sawant, K.V.; Poluri, K.M.; Dutta, A.K.; Sepuru, K.M.; Troshkina, A.; Garofalo, R.P.; Rajarathnam, K. Chemokine CXCL1 mediated neutrophil recruitment: Role of glycosaminoglycan interactions. Sci. Rep. 2016, 6, 33123. [Google Scholar] [CrossRef] [PubMed]
- Ghosh, S.; Karin, M. Missing pieces in the NF-κB puzzle. Cell 2002, 109, S81–S96. [Google Scholar] [CrossRef] [PubMed]
- Gabay, C. Interleukin-6 and chronic inflammation. Arthritis Res. Ther. 2006, 8, S3. [Google Scholar] [CrossRef]
- Kawasaki, T.; Kawai, T. Toll-like receptor signaling pathways. Front. Immunol. 2014, 5, 461. [Google Scholar] [CrossRef] [PubMed]
- Khanmohammadi, S.; Rezaei, N. Role of Toll-like receptors in the pathogenesis of COVID-19. J. Med. Virol. 2021, 93, 2735–2739. [Google Scholar] [CrossRef] [PubMed]
- De Groot, N.G.; Bontrop, R.E. COVID-19 Pandemic: Is a Gender-Defined Dosage Effect Responsible for the High Mortality Rate among Males? Springer: Berlin/Heidelberg, Germany, 2020. [Google Scholar]
- Cao, X. ISG15 secretion exacerbates inflammation in SARS-CoV-2 infection. Nat. Immunol. 2021, 22, 1360–1362. [Google Scholar] [CrossRef] [PubMed]
- Hu, B.; Huang, S.; Yin, L. The cytokine storm and COVID-19. J. Med. Virol. 2021, 93, 250–256. [Google Scholar] [CrossRef] [PubMed]
- Roganović, J. Downregulation of microRNA-146a in diabetes, obesity and hypertension may contribute to severe COVID-19. Med. Hypotheses 2021, 146, 110448. [Google Scholar] [CrossRef]
- Martonik, D.; Parfieniuk-Kowerda, A.; Rogalska, M.; Flisiak, R. The role of Th17 response in COVID-19. Cells 2021, 10, 1550. [Google Scholar] [CrossRef]
- Parackova, Z.; Bloomfield, M.; Klocperk, A.; Sediva, A. Neutrophils mediate Th17 promotion in COVID-19 patients. J. Leucoc. Biol. 2021, 109, 73–76. [Google Scholar] [CrossRef] [PubMed]
- De Biasi, S.; Meschiari, M.; Gibellini, L.; Bellinazzi, C.; Borella, R.; Fidanza, L.; Gozzi, L.; Iannone, A.; Tartaro, D.L.; Mattioli, M.; et al. Marked T cell activation, senescence, exhaustion and skewing towards TH17 in patients with COVID-19 pneumonia. Nat. Commun. 2020, 11, 3434. [Google Scholar] [CrossRef]
- Nakayama, T.; Hirahara, K.; Onodera, A.; Endo, Y.; Hosokawa, H.; Shinoda, K.; Okamoto, Y. Th2 cells in health and disease. Annu. Rev. Immunol. 2017, 35, 53–84. [Google Scholar] [CrossRef] [PubMed]
- Zhang, Q.; Putheti, P.; Zhou, Q.; Liu, Q.; Gao, W. Structures and biological functions of IL-31 and IL-31 receptors. Cytokine Growth Factor Rev. 2008, 19, 347–356. [Google Scholar] [CrossRef] [PubMed]
- Yombo, D.J.; Odayar, V.; Gupta, N.; Jegga, A.G.; Madala, S.K. The Protective Effects of IL-31RA Deficiency During Bleomycin-Induced Pulmonary Fibrosis. Front. Immunol. 2021, 12, 645717. [Google Scholar] [CrossRef]
- Kumar, M.; Ahmad, T.; Sharma, A.; Mabalirajan, U.; Kulshreshtha, A.; Agrawal, A.; Ghosh, B. Let-7 microRNA–mediated regulation of IL-13 and allergic airway inflammation. J. Allergy Clin. Immunol. 2011, 128, 1077–1085.e10. [Google Scholar] [CrossRef]
- Donlan, A.N.; Sutherland, T.E.; Marie, C.; Preissner, S.; Bradley, B.T.; Carpenter, R.M.; Sturek, J.M.; Ma, J.Z.; Moreau, G.B.; Donowitz, J.R.; et al. IL-13 is a driver of COVID-19 severity. JCI Insight 2021, 6, e150107. [Google Scholar] [CrossRef]


Disclaimer/Publisher’s Note: The statements, opinions and data contained in all publications are solely those of the individual author(s) and contributor(s) and not of MDPI and/or the editor(s). MDPI and/or the editor(s) disclaim responsibility for any injury to people or property resulting from any ideas, methods, instructions or products referred to in the content. |
© 2024 by the authors. Licensee MDPI, Basel, Switzerland. This article is an open access article distributed under the terms and conditions of the Creative Commons Attribution (CC BY) license (https://creativecommons.org/licenses/by/4.0/).