Pharmacokinetic Simulations of Intravitreal Biologicals: Aspects of Drug Delivery to the Posterior and Anterior Segments


Abstract
:
1. Introduction
2. Materials and Methods
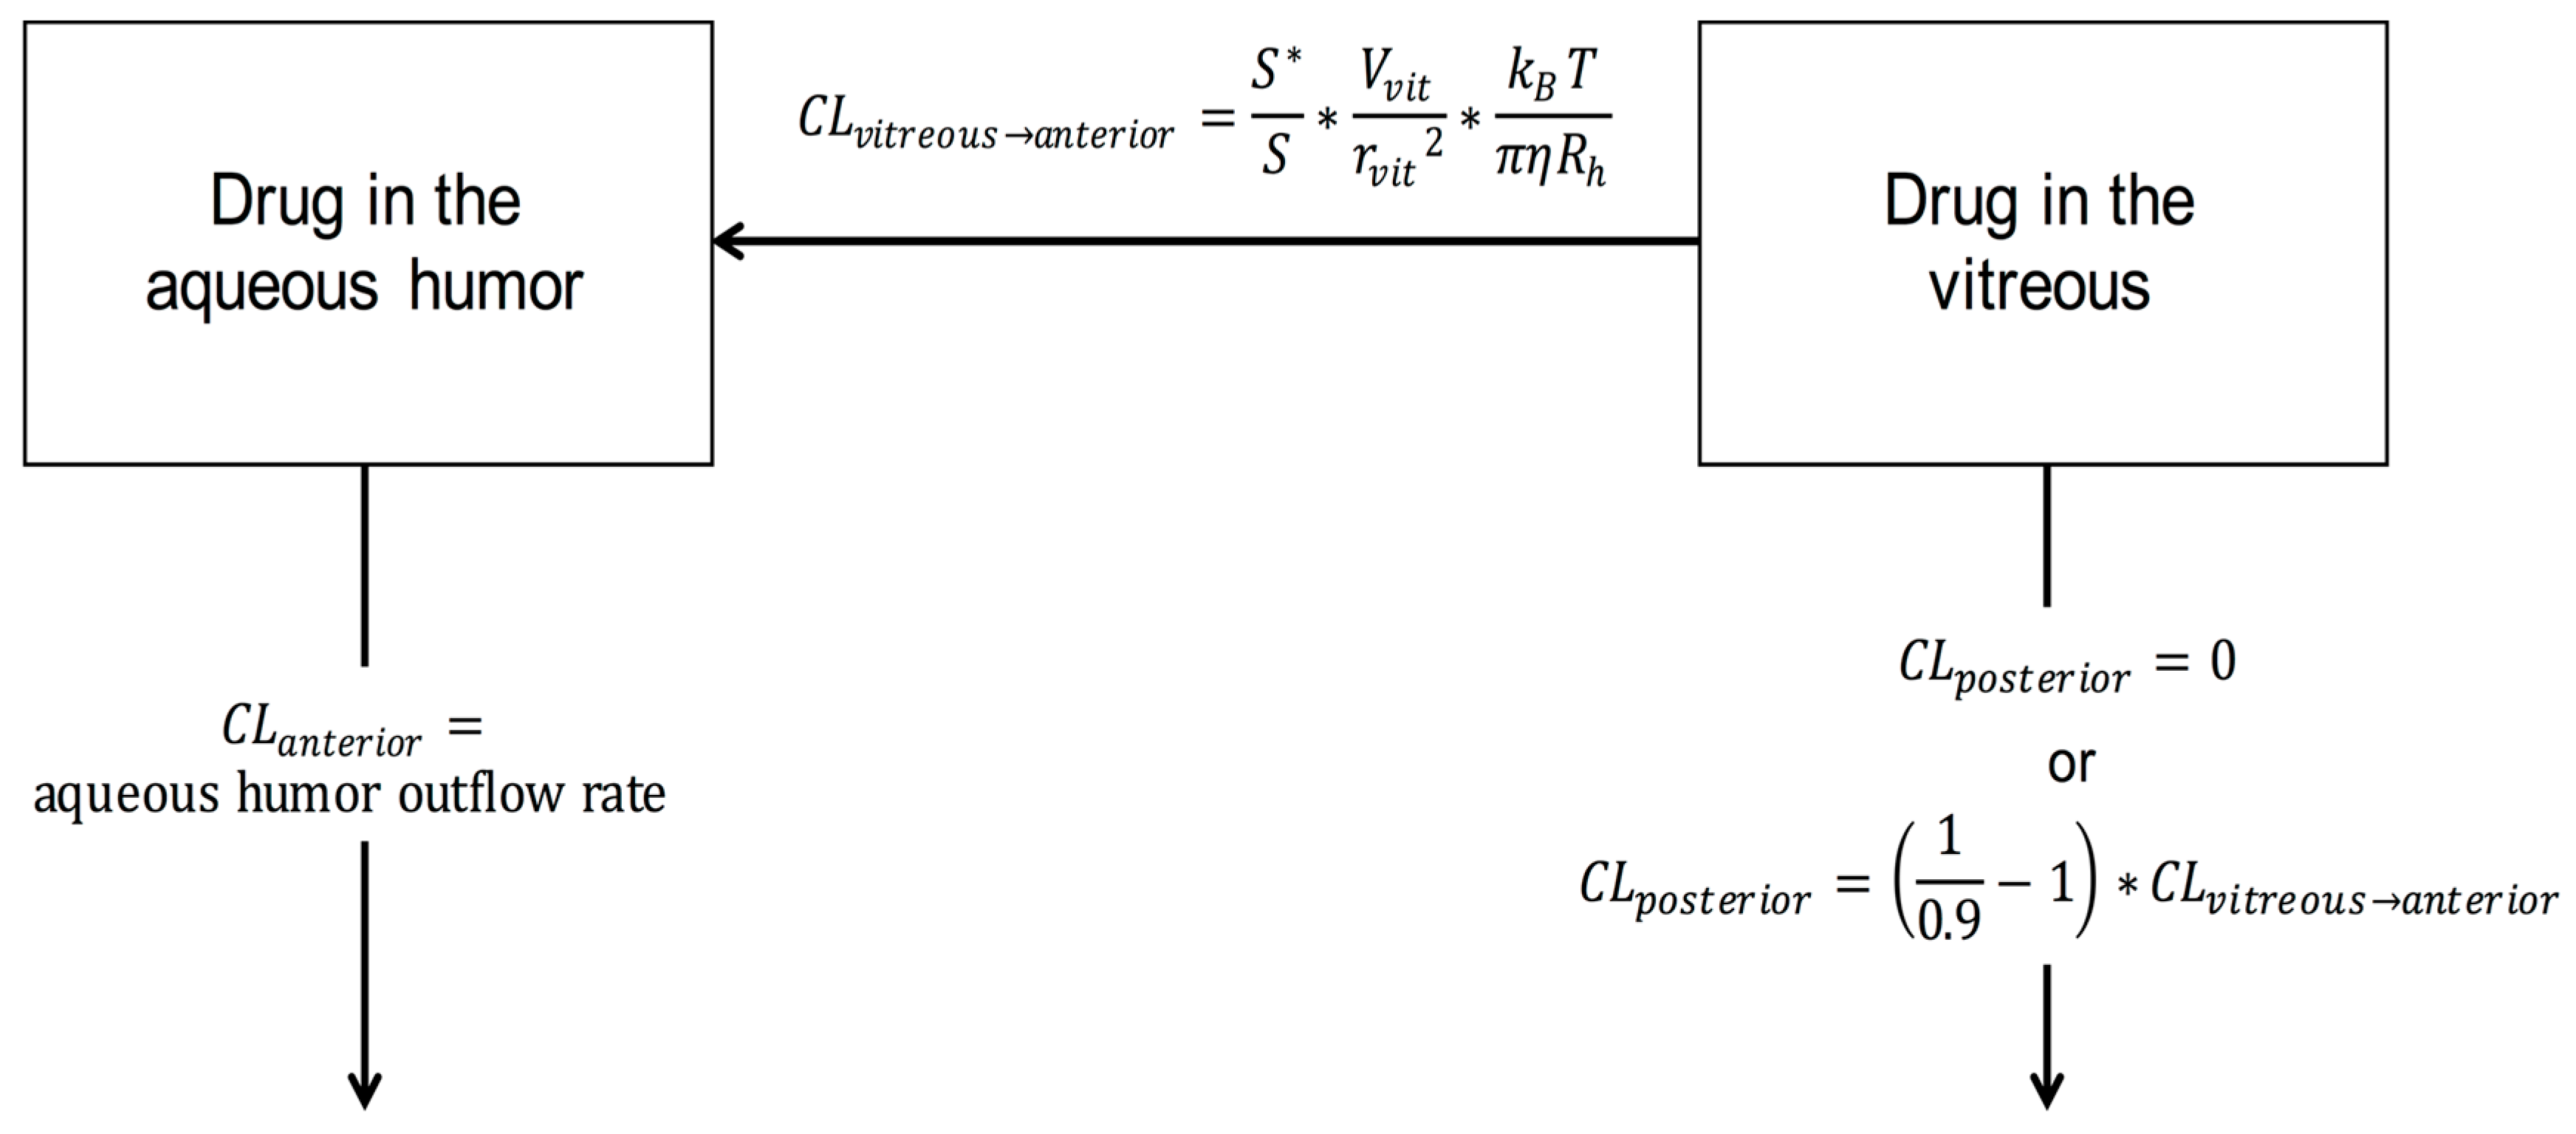
2.1. Elimination of the Intravitreal Biological
2.2. Sustained Intravitreal Drug Delivery
2.3. Simulations
3. Results
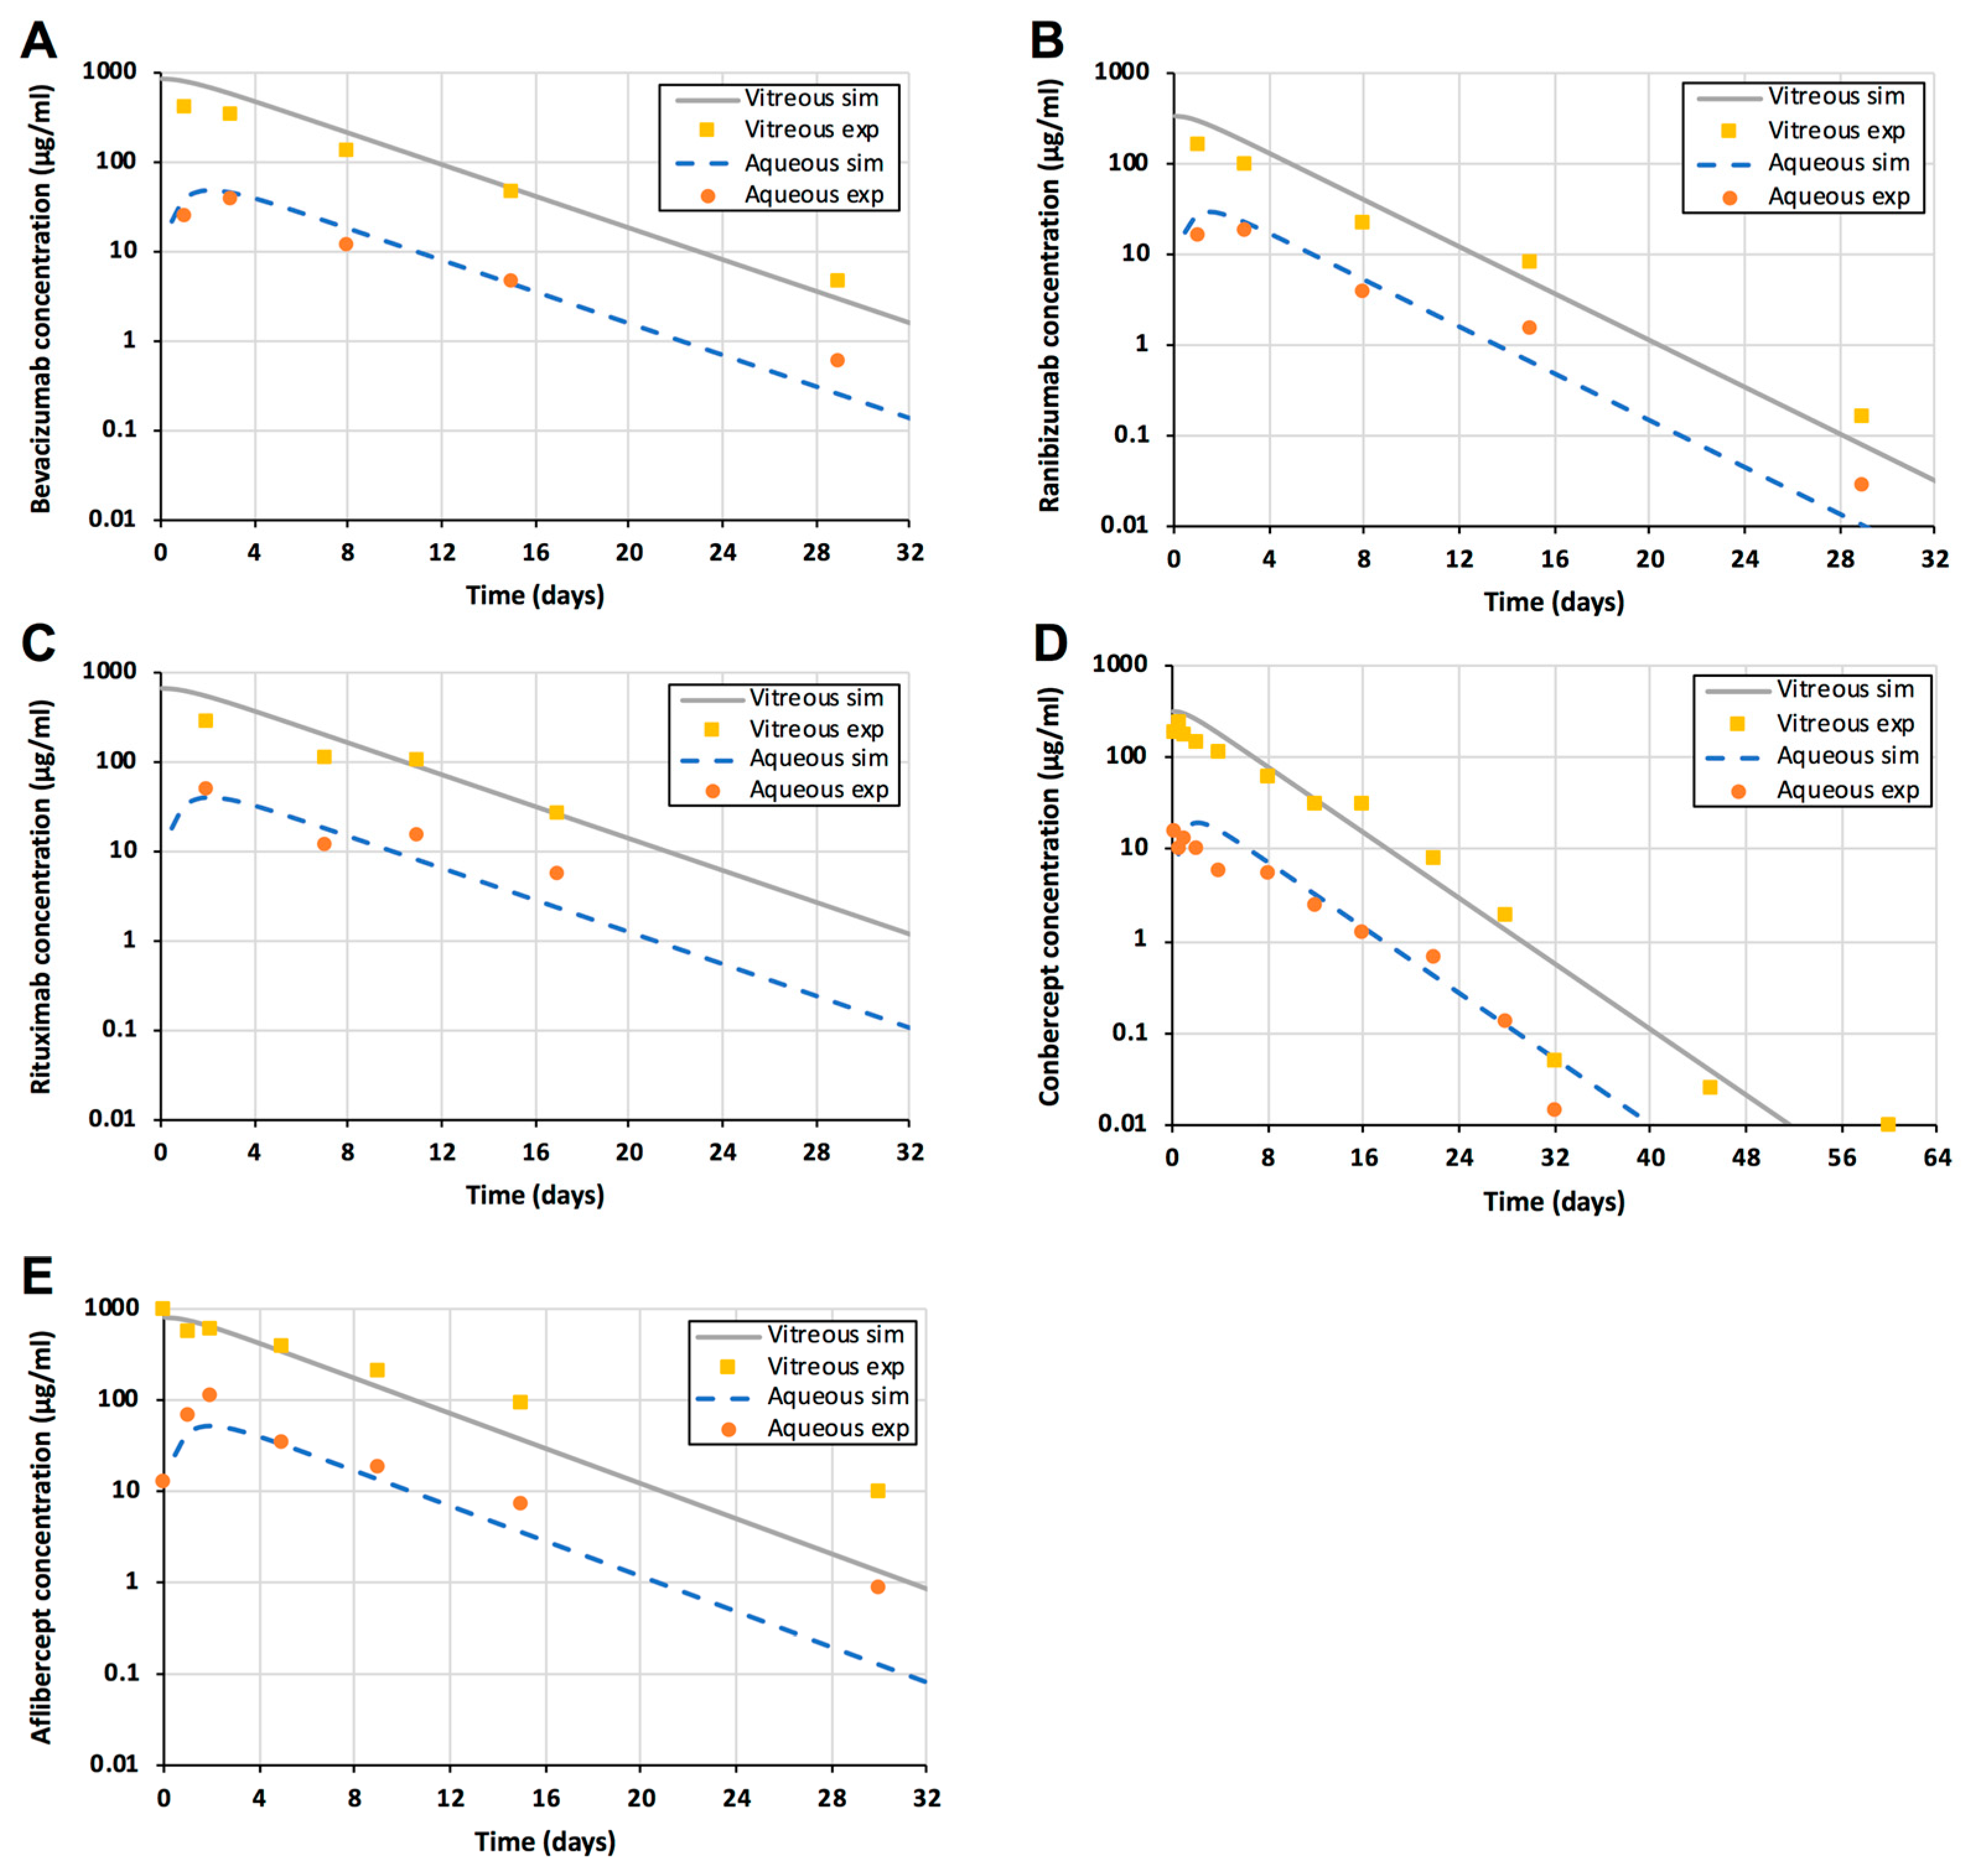
3.1. Injections
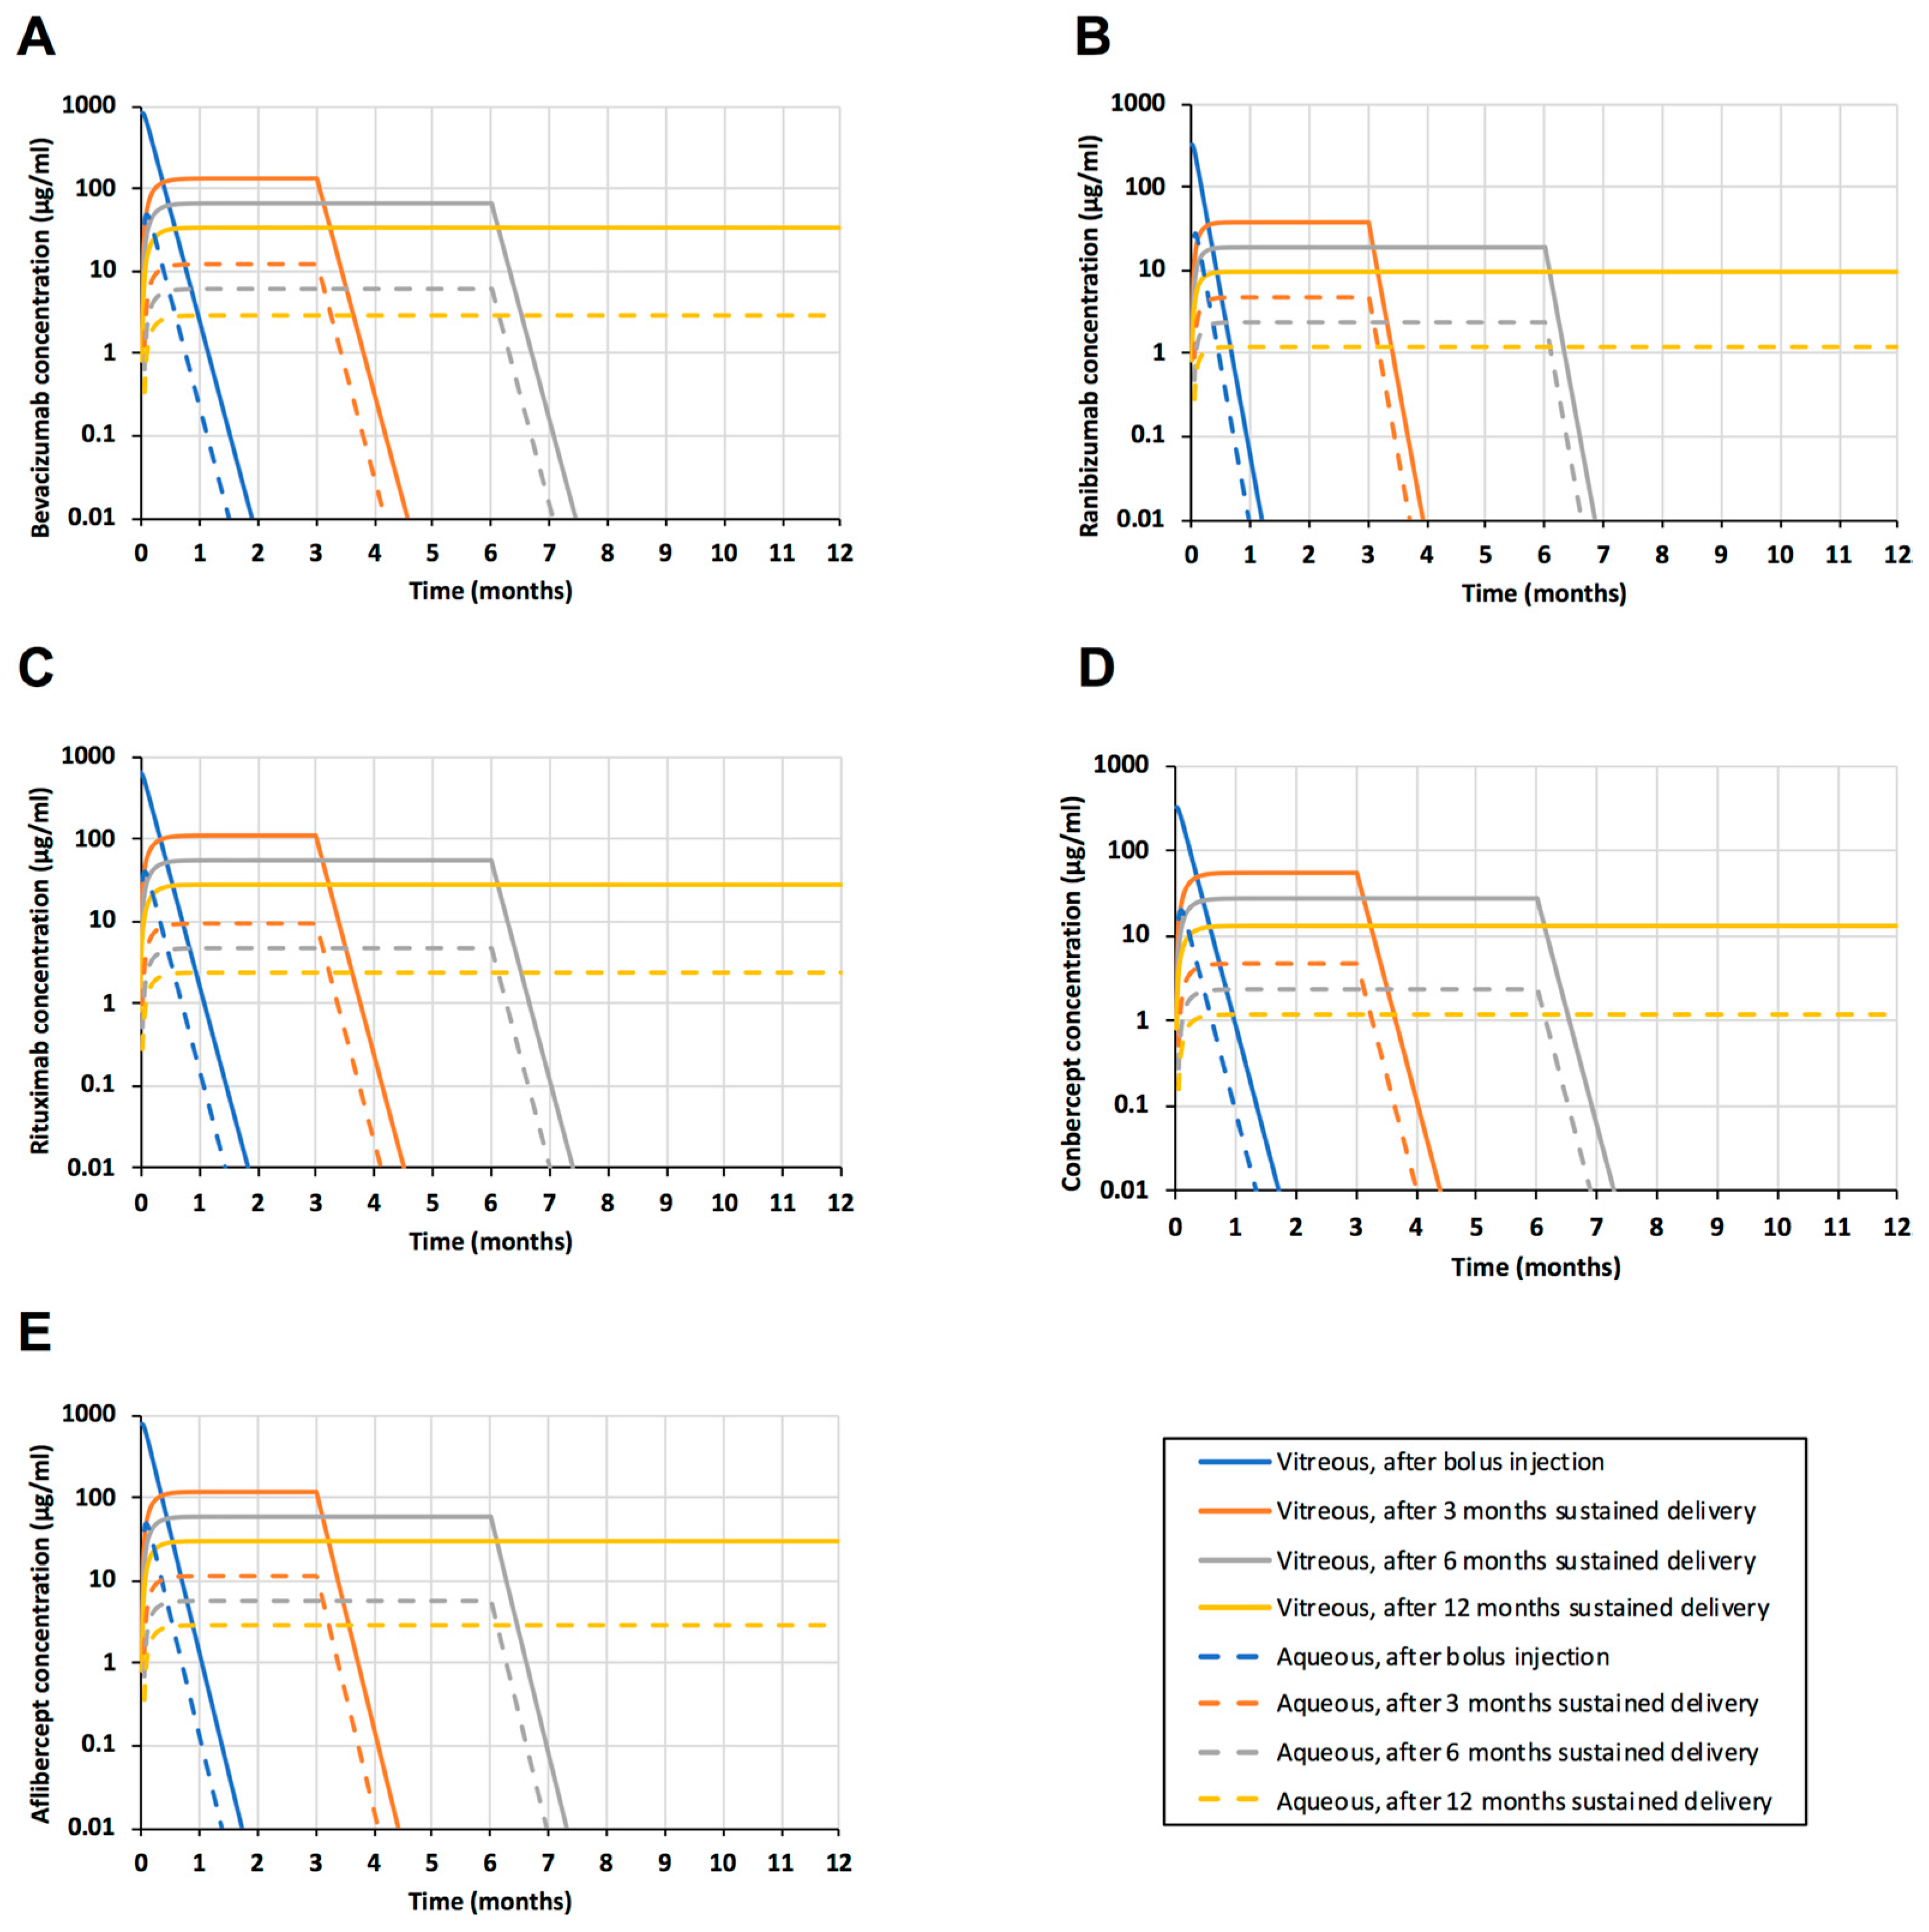
3.2. Sustained Release
4. Discussion
5. Conclusions
Author Contributions
Funding
Conflicts of Interest
References
- Barakat, M.R.; Kaiser, P.K. VEGF inhibitors for the treatment of neovascular age-related macular degeneration. Exp. Opin. Investig. Drugs 2009, 18, 637–646. [Google Scholar] [CrossRef] [PubMed]
- Bakall, B.; Folk, J.C.; Boldt, H.C.; Sohn, E.H.; Stone, E.M.; Russell, S.R.; Mahajan, V.B. Aflibercept therapy for exudative age-related macular degeneration resistant to bevacizumab and ranibizumab. Am. J. Ophthalmol. 2013, 156, 15–22. [Google Scholar] [CrossRef] [PubMed]
- Holz, F.G.; Tadayoni, R.; Beatty, S.; Berger, A.; Cereda, M.G.; Cortez, R.; Hoyng, C.B.; Hykin, P.; Staurenghi, G.; Heldner, S.; Bogumil, T.; Heah, T.; Sivaprasad, S. Multi-country real-life experience of anti-vascular endothelial growth factor therapy for wet age-related macular degeneration. Br. J. Ophthalmol. 2015, 99, 220–226. [Google Scholar] [CrossRef] [PubMed]
- Bhatt, N.; Tucker, W.; Sen, H.; Nussenblatt, R.B. Biologic therapies: Anti-tumor necrosis factor-, anti-interlekins, rituximab and others. Dev. Ophthalmol. 2016, 55, 252–264. [Google Scholar] [PubMed]
- Haghjou, N.; Soheilian, M.; Abdekhodaie, M.J. Sustained release intraocular drug delivery devices for treatment of uveitis. J. Ophthal. Vis. Res. 2011, 6, 317–329. [Google Scholar]
- Market Scope Estimate. Available online: http://market-scope.com/ (accessed on 3 December 2018).
- Maurice, D.M.; Mishima, S. Ocular pharmacokinetics. In Pharmacology of the Eye; Springer: Berlin/Heidelberg, Germany, 1984; Volume 69, pp. 16–119. [Google Scholar]
- Hutton-Smith, L.A.; Gaffney, E.A.; Byrne, H.M.; Maini, P.K.; Schwab, D.; Mazer, N.A. A mechanistic model of intravitreal pharmacokinetics of large molecules and the pharmacodynamic suppression of ocular vascular endothelial growth factor levels by ranibizumab in patients with neo-vascular age related macular degeneration. Mol. Pharm. 2016, 13, 2941–2950. [Google Scholar] [CrossRef] [PubMed]
- del Amo, E.M.; Vellonen, K.S.; Kidron, H.; Urtti, A. In Silico Prediction of Intravitreal Primary Pharmacokinetic Parameters and Drug Concentrations: Tool for Ocular Drug Development. Eur. J. Pharm. Biopharm. 2015, 95, 215–226. [Google Scholar] [CrossRef]
- Hutton-Smith, L.A.; Gaffney, E.A.; Byrne, H.M.; Maini, P.K.; Gadkar, K.; Mazer, N.A. Ocular pharmacokinetics of therapeutic antibodies given by intravitreal injection: Estimation of retinal permeabilities using a 3-compartment semi-mechanistic model. Mol. Pharm. 2017, 14, 2690–2696. [Google Scholar] [CrossRef]
- Pitkänen, L.; Ranta, V.P.; Moilanen, H.; Urtti, A. Permeability of retinal pigment epithelium: Effects of permeant molecular weight and lipophilicity. Investig. Ophthalmol. Vis. Sci. 2005, 46, 641–646. [Google Scholar] [CrossRef]
- Kim, H.; Robinson, M.R.; Lizak, M.J.; Tansey, G.; Lutz, R.J.; Yuan, P.; Wang, N.S.; Csaky, K.G. Controlled drug release from an ocular implant: An evaluation using dynamic three-dimensional magnetic resonance imaging. Investig. Ophthalmol. Vis. Sci. 2004, 45, 2722–2731. [Google Scholar] [CrossRef]
- Ranta, V.P.; Mannermaa, E.; Lummepuro, K.; Subrizi, A.; Laukkanen, A.; Antopolsky, M.; Murtomäki, L.; Hornof, M.; Urtti, A. Barrier analysis of periocular drug delivery to the posterior segment. J. Control. Release 2010, 148, 42–48. [Google Scholar] [CrossRef] [PubMed]
- Bakri, S.J.; Snyder, M.R.; Reid, J.M.; Pulido, J.S.; Singh, R.J. Pharmacokinetics of intravitreal bevacizumab (Avastin). Ophthalmology 2007, 114, 855–859. [Google Scholar] [CrossRef] [PubMed]
- Bakri, S.J.; Snyder, M.R.; Reid, J.M.; Pulido, J.S.; Ezzat, M.K.; Singh, R.J. Pharmacokinetics of intravitreal ranibizumab (Lucentis). Ophthalmology 2007, 114, 2179–2182. [Google Scholar] [CrossRef] [PubMed]
- Kim, H.; Csaky, K.G.; Chan, C.C.; Bungay, P.M.; Lutz, R.J.; Dedrick, R.; Yuan, P.; Rosenberg, J.; Grillo-Lopez, A.J.; Wilson, W.H.; et al. The pharmacokinetics of rituximab after intravitreal injection. Exp. Eye Res. 2006, 82, 760–766. [Google Scholar] [CrossRef] [PubMed]
- Li, H.; Lei, N.; Zhang, M.; Li, Y.; Xiao, H.; Hao, X. Pharmacokineitics of long-lasting anti-VEGF fusion protein in rabbit. Exp. Eye Res. 2012, 97, 154–159. [Google Scholar] [CrossRef] [PubMed]
- Park, S.J.; Choi, Y.; Na, Y.M.; Hong, H.K.; Park, J.Y.; Park, H.K.; Chung, J.Y.; Woo, S.J. Intraocular pharmacokinetics of intravitreal aflibercept (Eylea) in a rabbit model. Investig. Ophthalmol. Vis. Sci. 2016, 57, 2612–2617. [Google Scholar] [CrossRef] [PubMed]
- Lamminsalo, M.; Taskinen, E.; Karvinen, T.; Subrizi, A.; Murtomäki, L.; Urtti, A.; Ranta, V.P. Extended Pharmacokinetic Model of the Rabbit Eye for Intravitreal and Intracameral Injections of Macromolecules: Quantitative Analysis of Anterior and Posterior Elimination Pathways. Pharm. Res. 2018, 35, 153–167. [Google Scholar] [CrossRef]
- Gaul, G.R.; Brubaker, R.F. Measurement of aqueous flow in rabbits with corneal and vitreous depots of fluorescent dye. Investig. Ophthalmol. Vis. Sci. 1986, 27, 1331–1335. [Google Scholar]
- Barany, E.; Kinsey, V.E. The rate of flow of aqueous humor; the rate of disappearance of para-aminohippuric acid, radioactive rayopake, and radioactive diodrast from the aqueous humor of rabbits. Am. Ophthalmol. 1949, 32, 177–188. [Google Scholar]
- Missel, P.J. Simulating intravitreal injections in anatomically accurate models for rabbit, monkey, and human eyes. Pharm. Res. 2012, 29, 3251–3272. [Google Scholar] [CrossRef]
- Conrad, J.M.; Robinson, J.R. Aqueous chamber drug distribution volume measurement in rabbits. J. Pharm. Sci. 1977, 66, 219–224. [Google Scholar] [CrossRef] [PubMed]
- Harpaz, Y.; Gerstein, M.; Chothia, C. Volume Changes on Protein Folding. Structure 1994, 2, 641–649. [Google Scholar] [CrossRef]
- del Amo, E.M.; Rimpelä, A.; Heikkinen, E.; Otto, K.; Ramsay, K.E.; Lajunen, T.; Schmitt, M.; Pelkonen, L.; Bhattacharya, M.; Richardson, D.; et al. Arto Urtti: Pharmacokinetic Aspects of Retinal Drug Delivery. Progr. Ret. Eye Res. 2017, 57, 134–185. [Google Scholar] [CrossRef]
- Nomoto, H.; Shiraga, F.; Kuno, N.; Kimura, E.; Fujii, S.; Shinomiya, K.; Nugent, A.K.; Hirooka, K.; Baba, T. Pharmacokinetics of bevacizumab after topical, subconjunctiuval, and intravitreal administration in rabbits. Investig. Ophthalmol. Vis. Sci. 2009, 50, 4807–4813. [Google Scholar] [CrossRef] [PubMed]
- Heiduschka, P.; Fietz, H.; Hofmeister, S.; Schultheiss, S.; Mack, A.F.; Peters, S.; Ziemssen, F.; Niggemann, B.; Julien, S.; Bartz-Schmidt, K.U.; Schraermeyer, U. Penetration of bevacizumab through the retina after intravitreal injection in the monkey. Investig. Ophthalmol. Vis. Sci. 2007, 48, 2814–2823. [Google Scholar] [CrossRef] [PubMed]
- Shatz, W.; Hass, P.E.; Mathieu, M.; Kim, H.S.; Leach, K.; Zhou, M.; Crawford, Y.; Shen, A.; Wang, K.; Chang, D.P.; et al. Contribution of antibody hydrodynamic size to vitreal clearance revealed through rabbit studies using a species-matched fab. Mol. Pharm. 2016, 13, 2996–3003. [Google Scholar] [CrossRef] [PubMed]
- Luoma, T.D.; Wyatt, E.A.; Shi, W.; Shatz, W.; Hass, P.E.; Mathieu, M.; Yi, L.; Corn, J.E.; Maass, K.F.; Wang, K.; et al. Protein engineering to increase the potential of a therapeutic antibody Fab for long-acting delivery to the eye. mAbs 2017, 9, 1297–1305. [Google Scholar] [Green Version]
- Lau, C.M.; Yu, Y.; Jahamir, G.; Chau, Y. Controlled release technology for anti-angiogenesis treatment of posterior eye diseases: Current status and challenges. Adv. Drug Deliv. Rev. 2018, 126, 145–161. [Google Scholar] [CrossRef]
- Araie, M.; Maurice, D.M. The loss of fluorescein, fluorescein glucuronide and fluorescein isothiocyanate dextran from the vitreous by the anterior and retinal pathways. Exp. Eye Res. 1991, 52, 27–39. [Google Scholar] [CrossRef]
- Miller, S.C.; Gokhale, R.D.; Patton, T.F.; Himmelstein, K.J. Pilocarpine ocular distribution volume. J. Pharm. Sci. 1980, 69, 615–616. [Google Scholar] [CrossRef]
- Loyet, K.; Hass, P.E.; Sandoval, W.N.; Morando, A.; Liu, P.; Shatz, W.; Dickmann, L.; Kenrick, M.; Good, J.; Davancaze, T.; et al. In vivo profiles of anti-factor D molecules support long-acting delivery approaches. Mol. Pharm 2018, in press. [Google Scholar] [CrossRef] [PubMed]
- Kim, J.; Kudisch, M.; Konichida Silva, N.R.; Asada, H.; Shibuya, E.A.; Bloomer, M.M.; Mudumba, S.; Bhisitkul, R.B.; Desai, T.A. Long-term intraocular pressure reduction with intracameral polycaprolactone glaucoma devices that deliver a novel anti-glaucoma agent. J. Control. Release 2018, 269, 45–51. [Google Scholar] [CrossRef] [PubMed]
- Kholdebarin, R.; Campbell, R.J.; Jin, Y.P.; Buys, Y.M. Multicenter study of compliance and drop administration in glaucoma. Can. J. Ophthalmol. 2008, 43, 454–461. [Google Scholar] [CrossRef] [PubMed]


| Parameter | Value | Reference |
|---|---|---|
| Aqueous outflow rate (mL/day) | 3.49 a | [20,21] |
| Vvit (mL) | 1.50 | [22] |
| rvit (cm) | 0.71 | [8] |
| Vaq (mL) | 0.30 | [23] |
| S*/S | 0.23 | [8] |
| ν (mL/g)2 | 0.73 | [24] |
| η (kg/s/m)3 | 7.53 × 10⁻⁴ | general knowledge |
| kB (J mol−1 K−1) | 8.314 | general knowledge |
| T (K) | 298 | Temperature |
| NA | 6.023 × 10²³ | general knowledge |
© 2018 by the authors. Licensee MDPI, Basel, Switzerland. This article is an open access article distributed under the terms and conditions of the Creative Commons Attribution (CC BY) license (http://creativecommons.org/licenses/by/4.0/).
Share and Cite
Rimpelä, A.-K.; Kiiski, I.; Deng, F.; Kidron, H.; Urtti, A. Pharmacokinetic Simulations of Intravitreal Biologicals: Aspects of Drug Delivery to the Posterior and Anterior Segments. Pharmaceutics 2019, 11, 9. https://doi.org/10.3390/pharmaceutics11010009
Rimpelä A-K, Kiiski I, Deng F, Kidron H, Urtti A. Pharmacokinetic Simulations of Intravitreal Biologicals: Aspects of Drug Delivery to the Posterior and Anterior Segments. Pharmaceutics. 2019; 11(1):9. https://doi.org/10.3390/pharmaceutics11010009
Chicago/Turabian StyleRimpelä, Anna-Kaisa, Iiro Kiiski, Feng Deng, Heidi Kidron, and Arto Urtti. 2019. "Pharmacokinetic Simulations of Intravitreal Biologicals: Aspects of Drug Delivery to the Posterior and Anterior Segments" Pharmaceutics 11, no. 1: 9. https://doi.org/10.3390/pharmaceutics11010009