Further Evidence of Possible Therapeutic Uses of Sambucus nigra L. Extracts by the Assessment of the In Vitro and In Vivo Anti-Inflammatory Properties of Its PLGA and PCL-Based Nanoformulations


 , , ,
, , ,  ,
, 
 , , , , , and
Abstract
1. Introduction
2. Materials and Methods
2.1. Materials
2.1.1. Plant Materials
2.1.2. Chemicals
2.1.3. Biological or Cell Lines
2.1.4. Animals
2.2. Methods
2.2.1. Extraction
2.2.2. Quantification of Major Compounds
2.2.3. Residual Quantity of Methanol
2.2.4. Preparation of Extract-Loaded Nanoparticles
2.2.5. Physical Characterization of Nanoparticles
2.2.6. Morphological Characterization
2.2.7. Encapsulation Efficiency
2.2.8. Rutin and Nanoparticles’ Complexes
2.2.9. In Vitro Release of the Extract from PLGA and PCL Nanoparticles
2.2.10. Total Polyphenol Content
2.2.11. Antioxidant Activity
- 2,2-Diphenyl-1-picrylhydrazyl Assay (DPPH)
- Oxygen Radical Absorbance Capacity Assay (ORAC)
- Hydroxyl Radical Scavenging Capacity Assay (HOSC)
2.2.12. In Vitro Collagenase Inhibition Activity
2.2.13. In Vitro Safety Assessment for Potential Topical Use
- Cell Viability of Human Keratinocyte Cells
- Cell Viability of Human Fibroblast Cells
2.2.14. In Vitro and In Vivo Anti-Inflammatory Activity
- In Vitro Anti-Inflammatory Activity
- In Vivo Anti-Inflammatory Activity
2.2.15. Statistical Analysis
3. Results and Discussion
3.1. Quantification of Major Compounds and the Residual Quantity of Methanol
3.2. Characterization of Nanoparticles
3.3. In Vitro Safety Assessment
3.4. Efficacy of Nanocarriers
4. Conclusions and Perspectives
Author Contributions
Funding
Acknowledgments
Conflicts of Interest
References
- Mota, A.H.; Sousa, A.; Figueira, M.; Amaral, M.; Sousa, B.; Rocha, J.; Fattal, E.; Almeida, A.J.; Reis, C.P. Natural-based consumer health nanoproducts: Medicines, cosmetics, and food supplements. In Handbook of Functionalized Nanomaterials for Industrial Applications—Micro and Nano Technologies; Hussain, C.M., Ed.; Elsevier: Amsterdam, The Netherlands, 2020; pp. 527–578. ISBN 9780128167885. [Google Scholar]
- Mota, A.H.; Silva, C.O.; Nicolai, M.; Baby, A.; Palma, L.; Rijo, P.; Ascensão, L.; Reis, C.P. Design and evaluation of novel topical formulation with olive oil as natural functional active. Pharm. Dev. Technol. 2018, 23, 794–805. [Google Scholar] [CrossRef] [PubMed]
- European Medicines Agency. European Union Herbal Monograph on Sambucus Nigra L., Flos (EMA/HMPC/611512/2016); Committee on Herbal Medicinal Products: London, UK, 2007; Volume 44, Available online: https://www.ema.europa.eu/en/documents/herbal-monograph/final-european-union-herbal-monograph-sambucus-nigra-l-flos-revision-1_en.pdf (accessed on 18 November 2020).
- European Medicines Agency. Assessment Report on Sambucus nigra L., Flos (EMA/HMPC/611504/2016); Committee on Herbal Medicinal Products: London, UK, 2016; Available online: https://www.ema.europa.eu/en/documents/herbal-references/final-list-references-supporting-assessment-sambucus-nigra-l-revision-1_en.pdf (accessed on 9 October 2020).
- Mota, A.H.; Andrade, J.M.; Ntungwe, E.N.; Pereira, P.; Cebola, M.J.; Bernardo-Gil, M.G.; Molpeceres, J.; Rijo, P.; Viana, A.S.; Ascensão, L.; et al. Green extraction of Sambucus nigra L. for potential application in skin nanocarriers. Green Mater. 2020, 1–13. [Google Scholar] [CrossRef]
- Mota, A.H.; Andrade, J.M.; Rodrigues, M.J.; Custódio, L.; Bronze, M.R.; Duarte, N.; Baby, A.; Rocha, J.; Gaspar, M.M.; Simões, S.; et al. Synchronous insight of in vitro and in vivo biological activities of Sambucus nigra L. extracts for industrial uses. Ind. Crops Prod. 2020, 154, 1–11. [Google Scholar] [CrossRef]
- Rijo, P.; Matias, D.; Fernandes, A.; Simões, M.; Nicolai, M.; Reis, C. Antimicrobial plant extracts encapsulated into polymeric beads for potential application on the skin. Polymers 2014, 6, 479–490. [Google Scholar] [CrossRef]
- David, L.; Moldovan, B.; Vulcu, A.; Olenic, L.; Perde-Schrepler, M.; Fischer-Fodor, E.; Florea, A.; Crisan, M.; Chiorean, I.; Clichici, S.; et al. Green synthesis, characterization and anti-inflammatory activity of silver nanoparticles using European black elderberry fruits extract. Colloids Surf. B Biointerfaces 2014, 122, 767–777. [Google Scholar] [CrossRef] [PubMed]
- Opris, R.; Tatomir, C.; Olteanu, D.; Moldovan, R.; Moldovan, B.; David, L.; Nagy, A.; Decea, N.; Kiss, M.L.; Filip, G.A. The effect of Sambucus nigra L. extract and phytosinthesized gold nanoparticles on diabetic rats. Colloids Surf. B Biointerfaces 2017, 150, 192–200. [Google Scholar] [CrossRef]
- Bryła, A.; Lewandowicz, G.; Juzwa, W. Encapsulation of elderberry extract into phospholipid nanoparticles. J. Food Eng. 2015, 167, 189–195. [Google Scholar] [CrossRef]
- Rijo, P.; Falé, P.L.; Serralheiro, M.L.; Simões, M.F.; Gomes, A.; Reis, C. Optimization of medicinal plant extraction methods and their encapsulation through extrusion technology. Meas. J. Int. Meas. Confed. 2014, 58, 249–255. [Google Scholar] [CrossRef]
- Silva, C.O.; Rijo, P.; Molpeceres, J.; Figueiredo, I.V.; Ascensão, L.; Fernandes, A.S.; Roberto, A.; Reis, C.P. Polymeric nanoparticles modified with fatty acids encapsulating betamethasone for anti-inflammatory treatment. Int. J. Pharm. 2015, 493, 271–284. [Google Scholar] [CrossRef]
- Mota, A.H.; Direito, R.; Carrasco, M.P.; Rijo, P.; Ascensão, L.; Silveira Viana, A.; Rocha, J.; Eduardo-Figueira, M.; João Rodrigues, M.; Custódio, L.; et al. Combination of hyaluronic acid and PLGA particles as hybrid systems for viscosupplementation in osteoarthritis. Int. J. Pharm. 2019, 559, 13–22. [Google Scholar] [CrossRef]
- Reis, C.P.; Neufeld, R.J.; Ribeiro, A.J.; Veiga, F. Nanoencapsulation I. Methods for preparation of drug-loaded polymeric nanoparticles. Nanomed. Nanotechnol. Biol. Med. 2006, 2, 8–21. [Google Scholar] [CrossRef] [PubMed]
- Dora, C.P.; Singh, S.K.; Kumar, S.; Datusalia, A.K.; Deep, A. Development and characterization of nanoparticles of glibenclamide by solvent displacement method. Acta Pol. Pharm. 2010, 67, 283–290. [Google Scholar] [PubMed]
- Kumar, P.; Choonara, Y.E.; Pillay, V. In silico analytico-mathematical interpretation of biopolymeric assemblies: Quantification of energy surfaces and molecular attributes via atomistic simulations. Bioeng. Transl. Med. 2018, 3, 222–231. [Google Scholar] [CrossRef] [PubMed]
- Santos-Rebelo, A.; Kumar, P.; Pillay, V.; Choonara, Y.E.; Eleutério, C.; Figueira, M.; Viana, A.S.; Ascensão, L.; Molpeceres, J.; Rijo, P.; et al. Development and mechanistic insight into the enhanced cytotoxic potential of parvifloron D albumin nanoparticles in EGFR-overexpressing pancreatic cancer cells. Cancers 2019, 11, 1733. [Google Scholar] [CrossRef]
- Direito, R.; Rocha, J.; Serra, A.; Fernandes, A.; Fernandes, E.; Pinto, R.; Bronze, R.; Sepodes, B.; Figueira, M.; Direito, R. Anti-inflammatory Effects of Persimmon (Diospyros kaki L.) in Experimental Rodent Rheumatoid Arthritis. J. Diet Suppl. 2019, 17, 1–21. [Google Scholar] [CrossRef] [PubMed]
- Huang, D.; Ou, B.; Hampsch-Woodill, M.; Flanagan, J.A.; Prior, R.L. High-throughput assay of oxygen radical absorbance capacity (ORAC) using a multichannel liquid handling system coupled with a microplate fluorescence reader in 96-well format. J. Agric. Food Chem. 2002, 50, 4437–4444. [Google Scholar] [CrossRef]
- Oliveira-Alves, S.C.; Pereira, R.S.; Pereira, A.B.; Ferreira, A.; Mecha, E.; Silva, A.B.; Serra, A.T.; Bronze, M.R. Identification of functional compounds in baru (Dipteryx alata Vog.) nuts: Nutritional value, volatile and phenolic composition, antioxidant activity and antiproliferative effect. Food Res. Int. 2020, 131, 1–15. [Google Scholar] [CrossRef]
- Ou, B.; Hampsch-Woodill, M.; Prior, R.L. Development and Validation of an Improved Oxygen Radical Absorbance Capacity Assay Using Fluorescein as the Fluorescent Probe. J. Agric. Food Chem. 2001, 49, 4619–4626. [Google Scholar] [CrossRef]
- Serra, A.T.; Matias, A.A.; Frade, R.F.M.; Duarte, R.O.; Feliciano, R.P.; Bronze, M.R.; Figueira, M.E.; de Carvalho, A.; Duarte, C.M.M. Characterization of traditional and exotic apple varieties from Portugal. Part 2—Antioxidant and antiproliferative activities. J. Funct. Foods 2010, 2, 46–53. [Google Scholar] [CrossRef]
- Cailing, Z.; Biyin, Q.; Xinyuan, X.; Yan, B. Antioxidant and antimicrobial activity of tellurium dioxide nanoparticles sols. J. Nano Res. 2013, 25, 8–15. [Google Scholar]
- Moore, J.; Yin, J.J.; Yu, L. Novel fluorometric assay for hydroxyl radical scavenging capacity (HOSC) estimation. J. Agric. Food Chem. 2006, 54, 617–626. [Google Scholar] [CrossRef] [PubMed]
- Santos-Rebelo, A.; Garcia, C.; Eleutério, C.; Bastos, A.; Coelho, S.C.; Coelho, M.A.N.; Molpeceres, J.; Viana, A.S.; Ascensão, L.; Pinto, J.F.; et al. Development of parvifloron D-loaded smart nanoparticles to target pancreatic cancer. Pharmaceutics 2018, 10, 216. [Google Scholar] [CrossRef] [PubMed]
- Matos, M.S.; Romero-Díez, R.; Álvarez, A.; Bronze, M.R.; Rodríguez-Rojo, S.; Mato, R.B.; Cocero, M.J.; Matias, A.A. Polyphenol-rich extracts obtained from winemakingwaste streams as natural ingredients with cosmeceutical potential. Antioxidants 2019, 8, 355. [Google Scholar] [CrossRef] [PubMed]
- Elkomy, M.H.; Elmenshawe, S.F.; Eid, H.M.; Ali, A.M.A. Topical ketoprofen nanogel: Artificial neural network optimization, clustered bootstrap validation, and in vivo activity evaluation based on longitudinal dose response modeling. Drug Deliv. 2016, 23, 3294–3306. [Google Scholar] [CrossRef] [PubMed]
- Santos, D.F.G.D. Absorção Percutânea—Geles de Carbopol Contendo Fentiazac. Ph.D. Thesis, Faculdade de Farmacia do Porto, Porto, Portugal, 1995. [Google Scholar]
- European Medicines Agency. Assessment Report on Sambucus Nigra L., Fructus (EMA/HMPC/44208/2012); Committee on Herbal Medicinal Products: London, UK, 2012; Available online: https://www.ema.europa.eu/en/documents/herbal-report/draft-assessment-report-sambucus-nigra-l-fructus_en.pdf (accessed on 25 November 2020).
- Pannu, A.; Goyal, R.K.; Ojha, S.; Nandave, M. Naringenin: A Promising Flavonoid for Herbal Treatment of Rheumatoid Arthritis and Associated Inflammatory Disorders. In Bioactive Food as Dietary Interventions for Arthritis and Related Inflammatory Diseases; Elsevier Inc.: Amsterdam, The Netherlands, 2019; pp. 343–354. ISBN 9780128138205. [Google Scholar]
- International Conference on Harmonization of Technical Requirements for Registration of Pharmaceuticals. ICH Guideline Q3C (R6) on Impurities: Guideline for Residual Solvents: Geneva, Switzerland, 2019. Available online: https://database.ich.org/sites/default/files/Q3C-R6_Guideline_ErrorCorrection_2019_0410_0.pdf (accessed on 28 October 2020).
- Mota, A.H.; Rijo, P.; Molpeceres, J.; Reis, C.P. Broad overview of engineering of functional nanosystems for skin delivery. Int. J. Pharm. 2017, 532, 710–728. [Google Scholar] [CrossRef]
- Mota, A.H.; Santos-Rebelo, A.; Almeida, A.J.; Reis, C.P. Therapeutic Implications of Nanopharmaceuticals in Skin Delivery. In Nanopharmaceuticals: Principles and Applications; Environmental Chemistry for a Sustainable World; Yata, V.K., Ranjan, S., Dasgupta, N., Lichtfouse, E., Eds.; Springer International Publishing: Cham, Switzerland, 2020; Volume 1, pp. 205–272. ISBN 9783030449247. [Google Scholar]
- Reis, C.P.; Martinho, N.; Rosado, C.; Fernandes, A.S.; Roberto, A. Design of polymeric nanoparticles and its applications as drug delivery systems for acne treatment. Drug Dev. Ind. Pharm. 2014, 40, 409–417. [Google Scholar] [CrossRef]
- Milosevic, M.; Stojanovic, D.B.; Simic, V.; Grkovic, M.; Bjelovic, M.; Uskokovic, P.S.; Kojic, M. Preparation and modeling of three-layered PCL/PLGA/PCL fibrous scaffolds for prolonged drug release. Sci. Rep. 2020, 10, 1–12. [Google Scholar] [CrossRef]
- Snehalatha, M.; Venugopal, K.; Saha, R.N. Etoposide-Loaded PLGA and PCL Nanoparticles I: Preparation and Effect of Formulation Variables. Drug Deliv. 2008, 15, 267–275. [Google Scholar] [CrossRef]
- Gupta, A. Transfersomes: A Novel Vesicular Carrier for Enhanced Transdermal Delivery of Sertraline: Development, Characterization, and Performance Evaluation. Sci. Pharm. 2012, 80, 1061–1080. [Google Scholar] [CrossRef]
- Yen, F.-L.; Huang, P.; Hu, S.C.-S.; Lee, C.-W.; Yeh, A.; Tseng, C.-H. Design of acid-responsive polymeric nanoparticles for 7,3′,4′-trihydroxyisoflavone topical administration. Int. J. Nanomed. 2016, 11, 1615–1627. [Google Scholar] [CrossRef]
- Blaak, J.; Staib, P. The Relation of pH and Skin Cleansing. Curr. Probl. Dermatol 2018, 54, 132–142. [Google Scholar] [PubMed]
- Ghasemiyeh, P.; Mohammadi-Samani, S. Potential of Nanoparticles as Permeation Enhancers and Targeted Delivery Options for Skin: Advantages and Disadvantages. Drug Des. Dev. Ther. 2020, 14, 3271–3289. [Google Scholar] [CrossRef] [PubMed]
- Liu, Y.; Tan, J.; Thomas, A.; Ou-Yang, D.; Muzykantov, V.R. The shape of things to come: Importance of design in nanotechnology for drug delivery. Ther. Deliv. 2012, 3, 181–194. [Google Scholar] [CrossRef] [PubMed]
- Proksch, E. pH in nature, humans and skin. J. Dermatol. 2018, 45, 1044–1052. [Google Scholar] [CrossRef] [PubMed]
- Khemani, M.; Sharon, M.; Sharon, M. Encapsulation of Berberine in Nano-Sized PLGA Synthesized by Emulsification Method. ISRN Nanotechnol. 2012, 2012, 1–9. [Google Scholar] [CrossRef]
- Manjili, H.K.; Danafar, H.; Hosseini, D.M. Poly(caprolactone)–poly(ethylene glycol)– poly(caprolactone) (PCL–PEG–PCL) nanoparticles: A valuable and efficient system for in vitro and in vivo delivery of curcumin. RSC Adv. 2016, 6, 14403–14415. [Google Scholar] [CrossRef]
- Badran, M.M.; Alomrani, A.H.; Harisa, G.I.; Ashour, A.E.; Kumar, A.; Yassin, A.E. Novel docetaxel chitosan-coated PLGA/PCL nanoparticles with magnified cytotoxicity and bioavailability. Biomed. Pharm. 2018, 106, 1461–1468. [Google Scholar] [CrossRef]
- Cirpanli, Y.; Yerlikaya, F.; Ozturk, K.; Erdogar, N.; Launay, M.; Gegu, C.; Leturgez, T.; Bilensoy, E.; Calis, S.; Capan, Y. Comparative evaluation of in vitro parameters of tamoxifen citrate loaded poly(lactide-co-glycolide), poly(ε-caprolactone) and chitosan nanoparticles. Pharmazie 2010, 65, 867–870. [Google Scholar]
- Silva, C.O.; Rijo, P.; Molpeceres, J.; Ascensão, L.; Roberto, A.; Fernandes, A.S.; Gomes, R.; Pinto Coelho, J.M.; Gabriel, A.; Vieira, P.; et al. Bioproduction of gold nanoparticles for photothermal therapy. Ther. Deliv. 2016, 7, 287–304. [Google Scholar] [CrossRef]
- Ascenso, A.; Pinho, S.; Eleutério, C.; Praça, F.G.; Bentley, M.V.L.B.; Oliveira, H.; Santos, C.; Silva, O.; Simões, S. Lycopene from tomatoes: Vesicular nanocarrier formulations for dermal delivery. J. Agric. Food Chem. 2013, 61, 7284–7293. [Google Scholar] [CrossRef]
- Ascenso, A.; Salgado, A.; Euletério, C.; Praça, F.G.; Bentley, M.V.L.B.; Marques, H.C.; Oliveira, H.; Santos, C.; Simões, S. In vitro and in vivo topical delivery studies of tretinoin-loaded ultradeformable vesicles. Eur. J. Pharm. Biopharm. 2014, 88, 48–55. [Google Scholar] [CrossRef] [PubMed]
- Nave, M.; Castro, R.E.; Rodrigues, C.M.P.; Casini, A.; Soveral, G.; Gaspar, M.M. Nanoformulations of a potent copper-based aquaporin inhibitor with cytotoxic effect against cancer cells. Nanomedicine 2016, 11, 1817–1830. [Google Scholar] [CrossRef] [PubMed]
- Colombo, I.; Sangiovanni, E.; Maggio, R.; Mattozzi, C.; Zava, S.; Corbett, Y.; Fumagalli, M.; Carlino, C.; Corsetto, P.A.; Scaccabarozzi, D.; et al. HaCaT Cells as a Reliable In Vitro Differentiation Model to Dissect the Inflammatory/Repair Response of Human Keratinocytes. Mediat. Inflamm. 2017, 2017, 1–12. [Google Scholar] [CrossRef] [PubMed]
- Marques, P.; Marto, J.; Gonçalves, L.M.; Pacheco, R.; Fitas, M.; Pinto, P.; Serralheiro, M.L.M.; Ribeiro, H. Cynara scolymus L.: A promising Mediterranean extract for topical anti-aging prevention. Ind. Crops Prod. 2017, 109, 699–706. [Google Scholar] [CrossRef]
- Hamalainen, M.; Nieminen, R.; Vuorela, P.; Heinonen, M.; Moiianen, E. Anti-Inflammatory Effects of Flavonoids: Genistein, Kaempferol, Quercetin, and Daidzein Inhibit STAT-1 and NF-KB Activations, Whereas Flavone, Isorhamnetin, Naringenin, and Pelargonidin Inhibit only NF-KB Activation along with Their Inhibitory Effect on i. Mediat. Inflamm. 2007, 2007, 1–10. [Google Scholar] [CrossRef] [PubMed]
- Devi, K.P.; Malar, D.S.; Nabavi, S.F.; Sureda, A.; Xiao, J.; Nabavi, S.M.; Daglia, M. Kaempferol and inflammation: From chemistry to medicine. Pharm. Res. 2015, 99, 1–10. [Google Scholar] [CrossRef]
- Shahidi, F.; Yeo, J. Bioactivities of Phenolics by Focusing on Suppression of Chronic Diseases: A Review. Int. J. Mol. Sci. 2018, 19, 1573. [Google Scholar] [CrossRef]
- Liu, S.; Adewole, D.; Yu, L.; Sid, V.; Wang, B.; Karmin, O. Immunology, health and disease Rutin attenuates inflammatory responses induced by lipopolysaccharide in an in vitro mouse muscle cell (C2C12) model. Poult. Sci. 2019, 98, 2756–2764. [Google Scholar] [CrossRef]
- Nikfarjam, B.A.; Adineh, M.; Hajiali, F.; Nassiri-asl, M. Treatment with Rutin—A Therapeutic Strategy for Neutrophil-Mediated Inflammatory and Autoimmune Diseases. J. Pharmacopunct. 2017, 20, 52–56. [Google Scholar]
- Gautam, R.; Singh, M.; Gautam, S.; Rawat, J.K.; Saraf, S.A.; Kaithwas, G. Rutin attenuates intestinal toxicity induced by Methotrexate linked with anti-oxidative and anti-inflammatory effects. BMC Complement. Altern. Med. 2016, 16, 1–6. [Google Scholar] [CrossRef]
- Mahdy, A.M.; Galley, H.F.; Abdel-Wahed, M.A.; El-Korny, K.F.; Sheta, S.A.; Webster, N.R. Differential modulation of interleukin-6 and interleukin-10 by diclofenac in patients undergoing major surgery. Br. J. Anaesth. 2002, 88, 797–802. [Google Scholar] [CrossRef]
- Singh, P.; Rastogi, S.; Bansal, M.; Kumar, S.; Singh, R.; Nishad, S.G.; Reddy, M.P.; Anand, K.R.; Kumar, S.; Thayath, M.N. A Prospective Study to Assess the Levels of Interleukin-6 Following Administration of Diclofenac, Ketorolac and Tramadol After Surgical Removal of Lower Third Molars. J. Maxillofac. Oral Surg. 2015, 14, 219–225. [Google Scholar] [CrossRef]
- Fredriksson, L.; Herpers, B.; Benedetti, G.; Matadin, Q.; Puigvert, J.C.; de Bont, H.; Dragovic, S.; Vermeulen, N.P.E.; Commandeur, J.N.M.; Danen, E. Diclofenac Inhibits Tumor Necrosis Factor-α-Induced Nuclear Factor-κB activation Causing Synergistic Hepatocyte Apoptosis. Hepatology 2011, 53, 2027–2041. [Google Scholar] [CrossRef]


| Energy | Rutin | PCL | PCL-Rutin | ΔE 1 | PLGA | PLGA-Rutin | ΔE 1 |
|---|---|---|---|---|---|---|---|
| Total 2 | 23.09 | 6.41 | 11.47 | −18.04 7 | 2.64 | 5.37 | −20.36 7 |
| Bond 3 | 1.16 | 0.34 | 1.41 | −0.09 7 | 0.29 | 1.64 | 0.19 8 |
| Angle 4 | 7.57 | 1.33 | 9.14 | 0.24 8 | 2.53 | 13.55 | 3.44 8 |
| Dihed 5 | 14.32 | 0.05 | 8.63 | −5.74 7 | 0.89 | 14.72 | −0.49 7 |
| vdW 6 | 0.04 | 4.69 | −7.71 | −12.45 7 | −1.06 | −24.12 | −23.18 7 |
| Samples | Concentration | NO Inhibition (%) |
|---|---|---|
| Free Extract | 35 µg/mL | 23.6 ± 1.8 |
| Extract-loaded PLGA NPs | 35 µg/mL | 43.5 ± 4.0 *** |
| Extract-loaded PCL NPs | 35 µg/mL | 55.3 ± 1.8 *** |
| Negative control (DMSO) | 0.5% | 0.0 ± 0.0 |
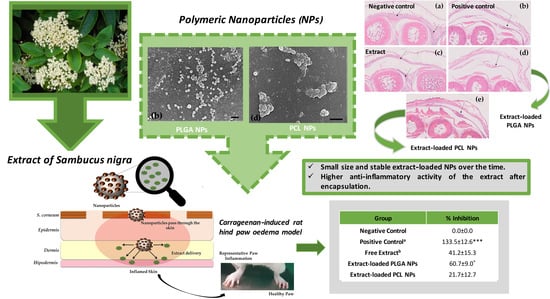
| Group | Formulations | Dose (mg/kg) | Inhibition (%) |
|---|---|---|---|
| Negative Control | Carbopol 940® gel | -- | 0.0 ± 0.0 |
| Positive Control a | Diclofenac in gel | 1.0 | 133.5 ± 12.6 *** |
| Free Extract b | Extract in gel | 1.0 | 41.2 ± 15.3 |
| Extract-loaded PLGA NPs | Extract-loaded PLGA NPs in gel | 1.0 | 60.7 ± 9.0 * |
| Extract-loaded PCL NPs | Extract-loaded PCL NPs in gel | 1.0 | 21.7 ± 12.7 |
| Group | TNF-α (pg/mL) | IL-6 (pg/mL) | IL-10 (pg/mL) |
|---|---|---|---|
| Negative Control | 168.5 ± 42.2 | 109.9 ± 1.2 | 11.4 ± 1.6 |
| Positive Control | 95.0 ± 9.6 | 95.3 ± 9.0 | 28.8 ± 6.7 |
| Free Extract | 133.3 ± 26.5 | 106.9 ± 7.7 | 10.7 ± 1.2 |
| Extract-loaded PLGA NPs | 117.6 ± 15.1 | 96.3 ± 7.6 | 27.3 ± 10.9 |
| Extract-loaded PCL NPs | 123.4 ± 17.3 | 114.6 ± 16.1 | 18.8 ± 2.9 |
Publisher’s Note: MDPI stays neutral with regard to jurisdictional claims in published maps and institutional affiliations. |
© 2020 by the authors. Licensee MDPI, Basel, Switzerland. This article is an open access article distributed under the terms and conditions of the Creative Commons Attribution (CC BY) license (http://creativecommons.org/licenses/by/4.0/).
Share and Cite
Mota, A.H.; Duarte, N.; Serra, A.T.; Ferreira, A.; Bronze, M.R.; Custódio, L.; Gaspar, M.M.; Simões, S.; Rijo, P.; Ascensão, L.; et al. Further Evidence of Possible Therapeutic Uses of Sambucus nigra L. Extracts by the Assessment of the In Vitro and In Vivo Anti-Inflammatory Properties of Its PLGA and PCL-Based Nanoformulations. Pharmaceutics 2020, 12, 1181. https://doi.org/10.3390/pharmaceutics12121181
Mota AH, Duarte N, Serra AT, Ferreira A, Bronze MR, Custódio L, Gaspar MM, Simões S, Rijo P, Ascensão L, et al. Further Evidence of Possible Therapeutic Uses of Sambucus nigra L. Extracts by the Assessment of the In Vitro and In Vivo Anti-Inflammatory Properties of Its PLGA and PCL-Based Nanoformulations. Pharmaceutics. 2020; 12(12):1181. https://doi.org/10.3390/pharmaceutics12121181
Chicago/Turabian StyleMota, Ana Henriques, Noélia Duarte, Ana Teresa Serra, António Ferreira, Maria Rosário Bronze, Luísa Custódio, Maria Manuela Gaspar, Sandra Simões, Patrícia Rijo, Lia Ascensão, and et al. 2020. "Further Evidence of Possible Therapeutic Uses of Sambucus nigra L. Extracts by the Assessment of the In Vitro and In Vivo Anti-Inflammatory Properties of Its PLGA and PCL-Based Nanoformulations" Pharmaceutics 12, no. 12: 1181. https://doi.org/10.3390/pharmaceutics12121181
APA StyleMota, A. H., Duarte, N., Serra, A. T., Ferreira, A., Bronze, M. R., Custódio, L., Gaspar, M. M., Simões, S., Rijo, P., Ascensão, L., Faísca, P., Viana, A. S., Pinto, R., Kumar, P., Almeida, A. J., & Reis, C. P. (2020). Further Evidence of Possible Therapeutic Uses of Sambucus nigra L. Extracts by the Assessment of the In Vitro and In Vivo Anti-Inflammatory Properties of Its PLGA and PCL-Based Nanoformulations. Pharmaceutics, 12(12), 1181. https://doi.org/10.3390/pharmaceutics12121181