3D-Printed Veterinary Dosage Forms—A Comparative Study of Three Semi-Solid Extrusion 3D Printers

 ,
,
Abstract
:
1. Introduction
2. Materials
3. Methods
3.1. Preparation of Orodispersible Films
3.1.1. Ink formulation
3.1.2. Rheology
3.1.3. Film Design
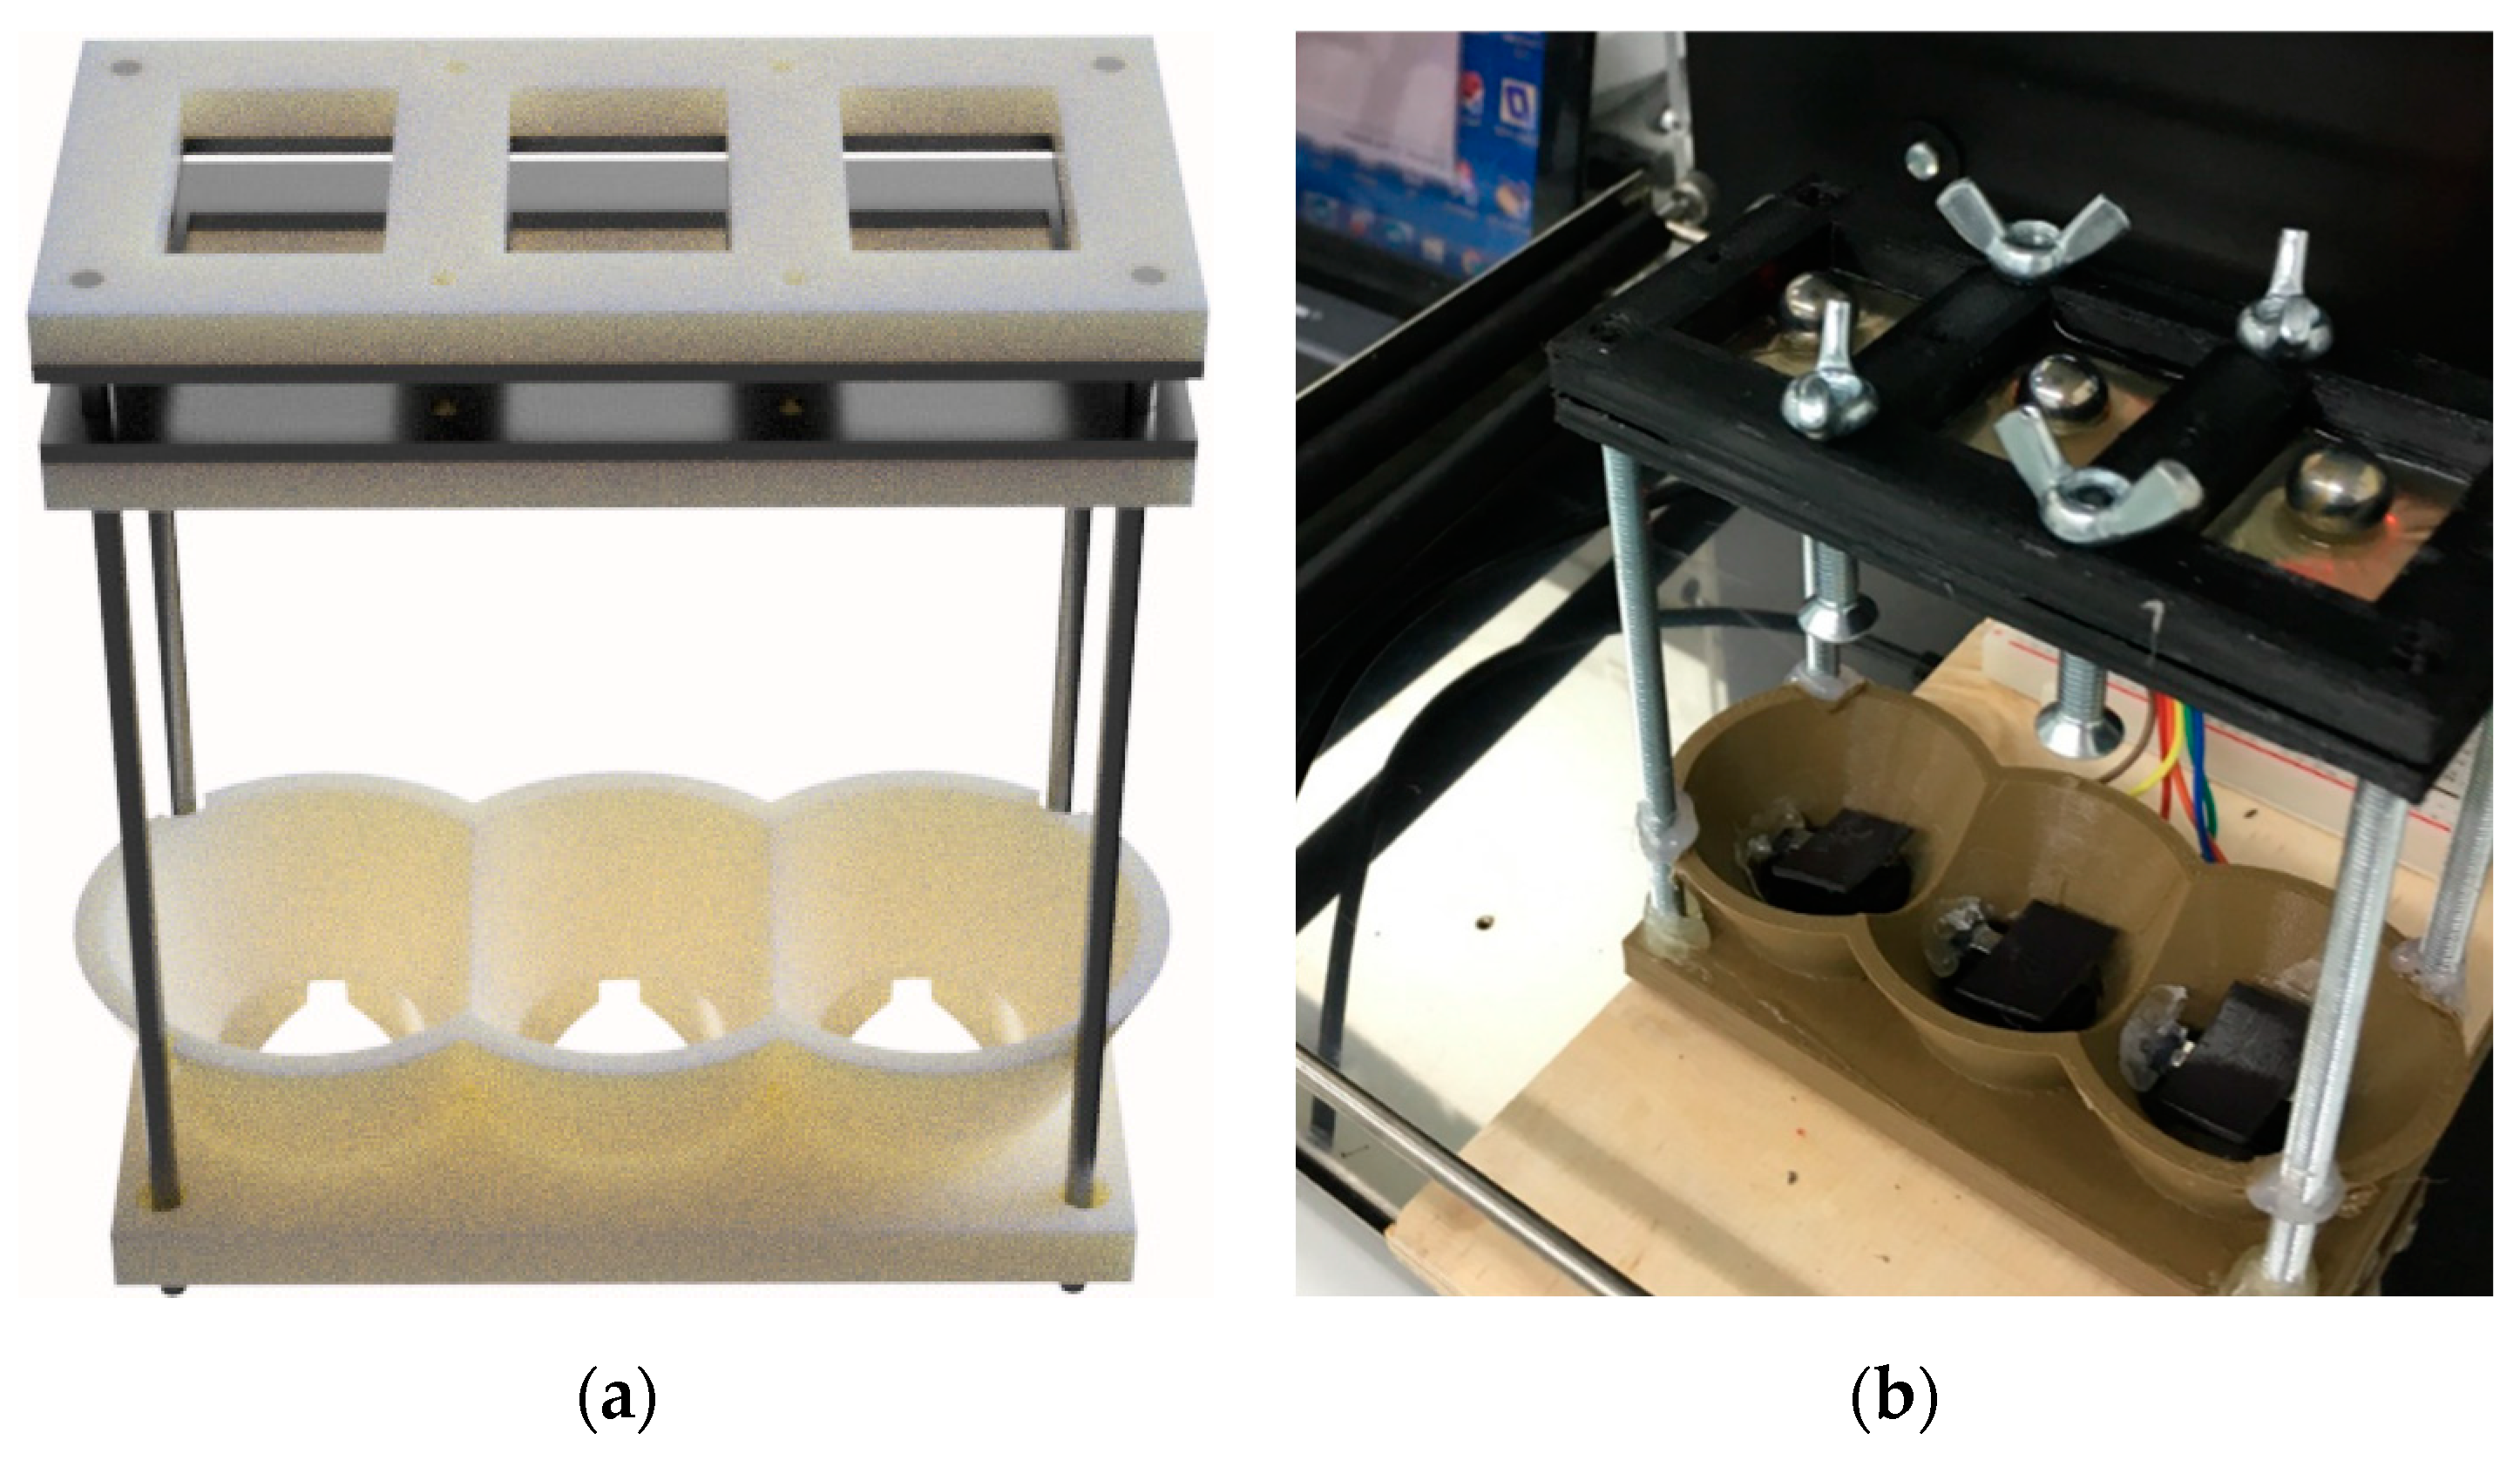
3.1.4. Semi-Solid Extrusion 3D Printing
3.2. Drug Content
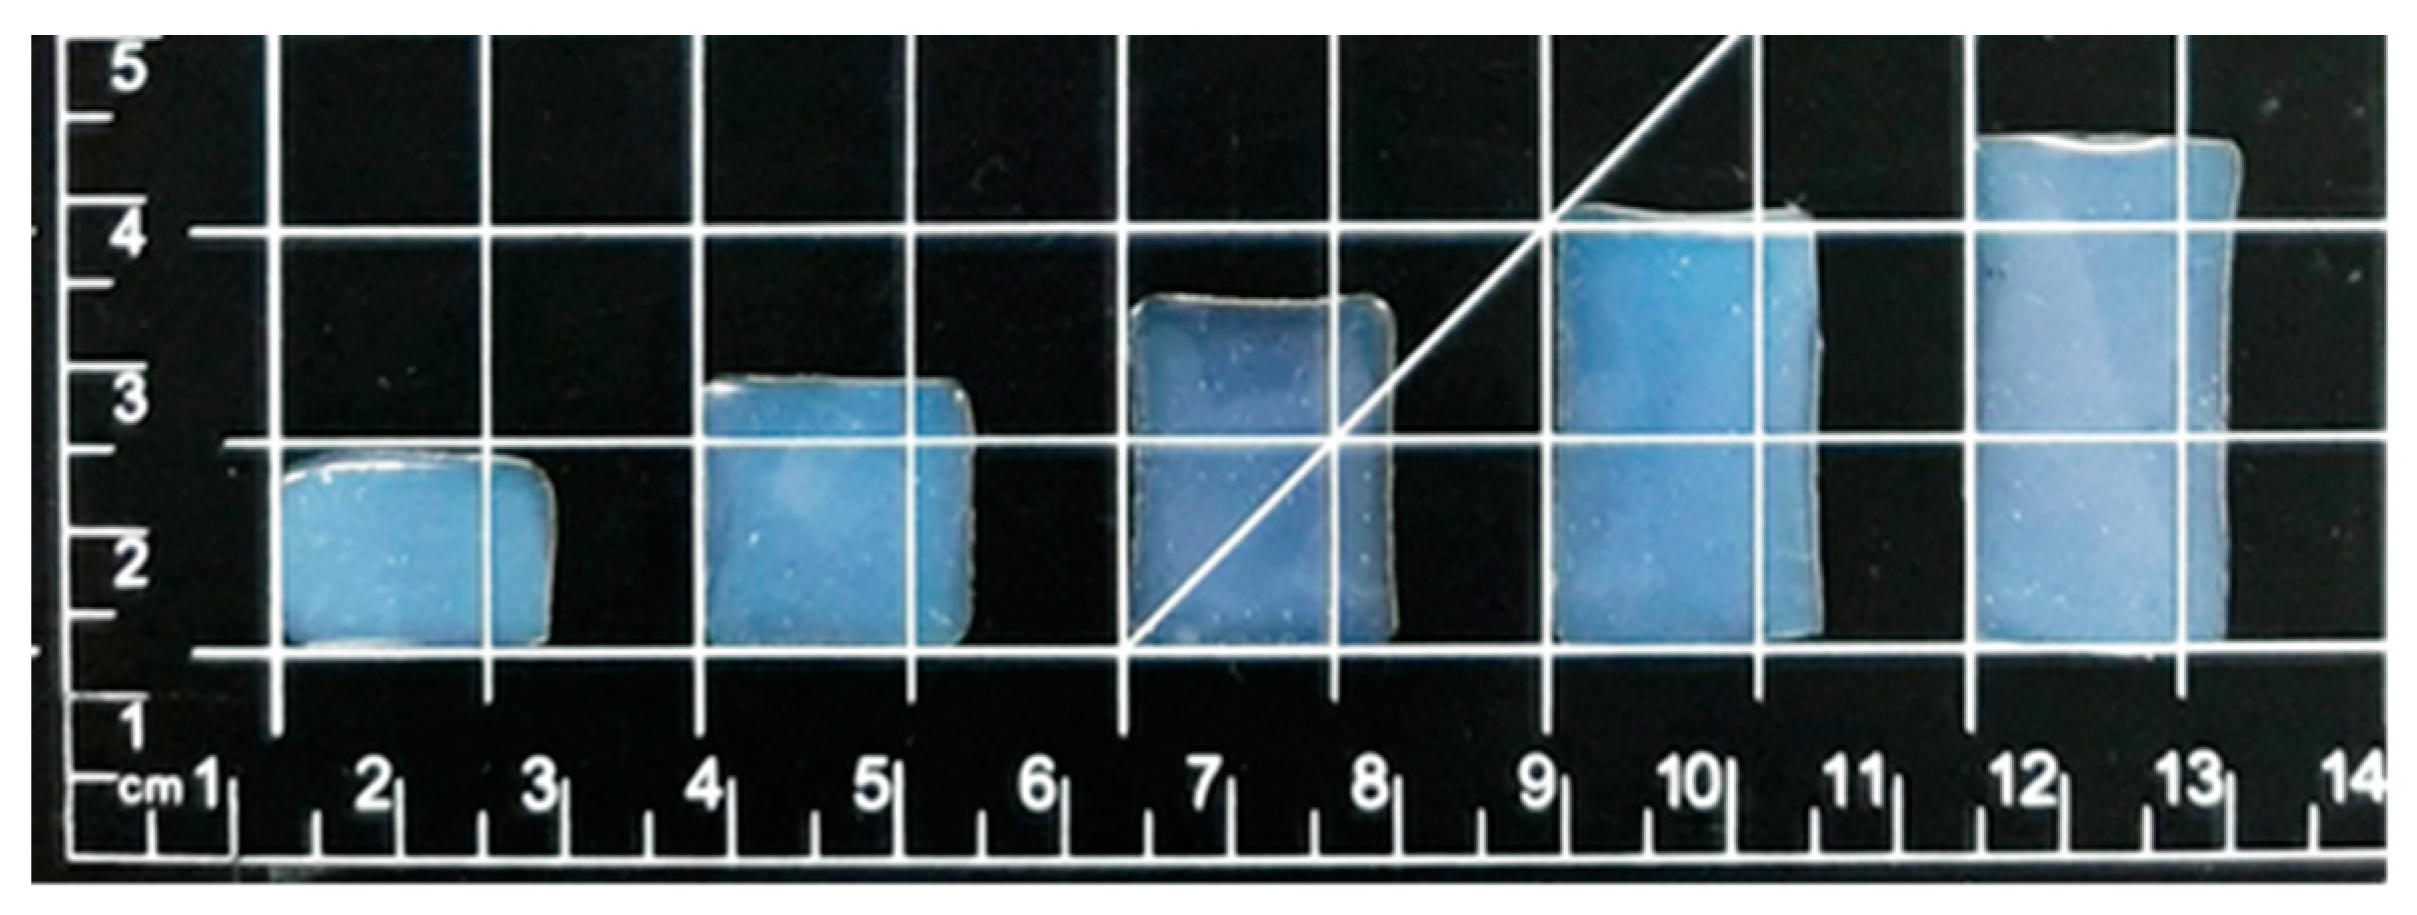
3.3. Weight, Thickness, and Appearance of the Dosage Forms
3.4. Mechanical Testing
3.4.1. Puncture Test
3.4.2. Tensile Strength
3.4.3. Folding Endurance
3.5. Moisture Content
3.6. Surface pH
3.7. Adhesiveness Analysis
3.8. Disintegration
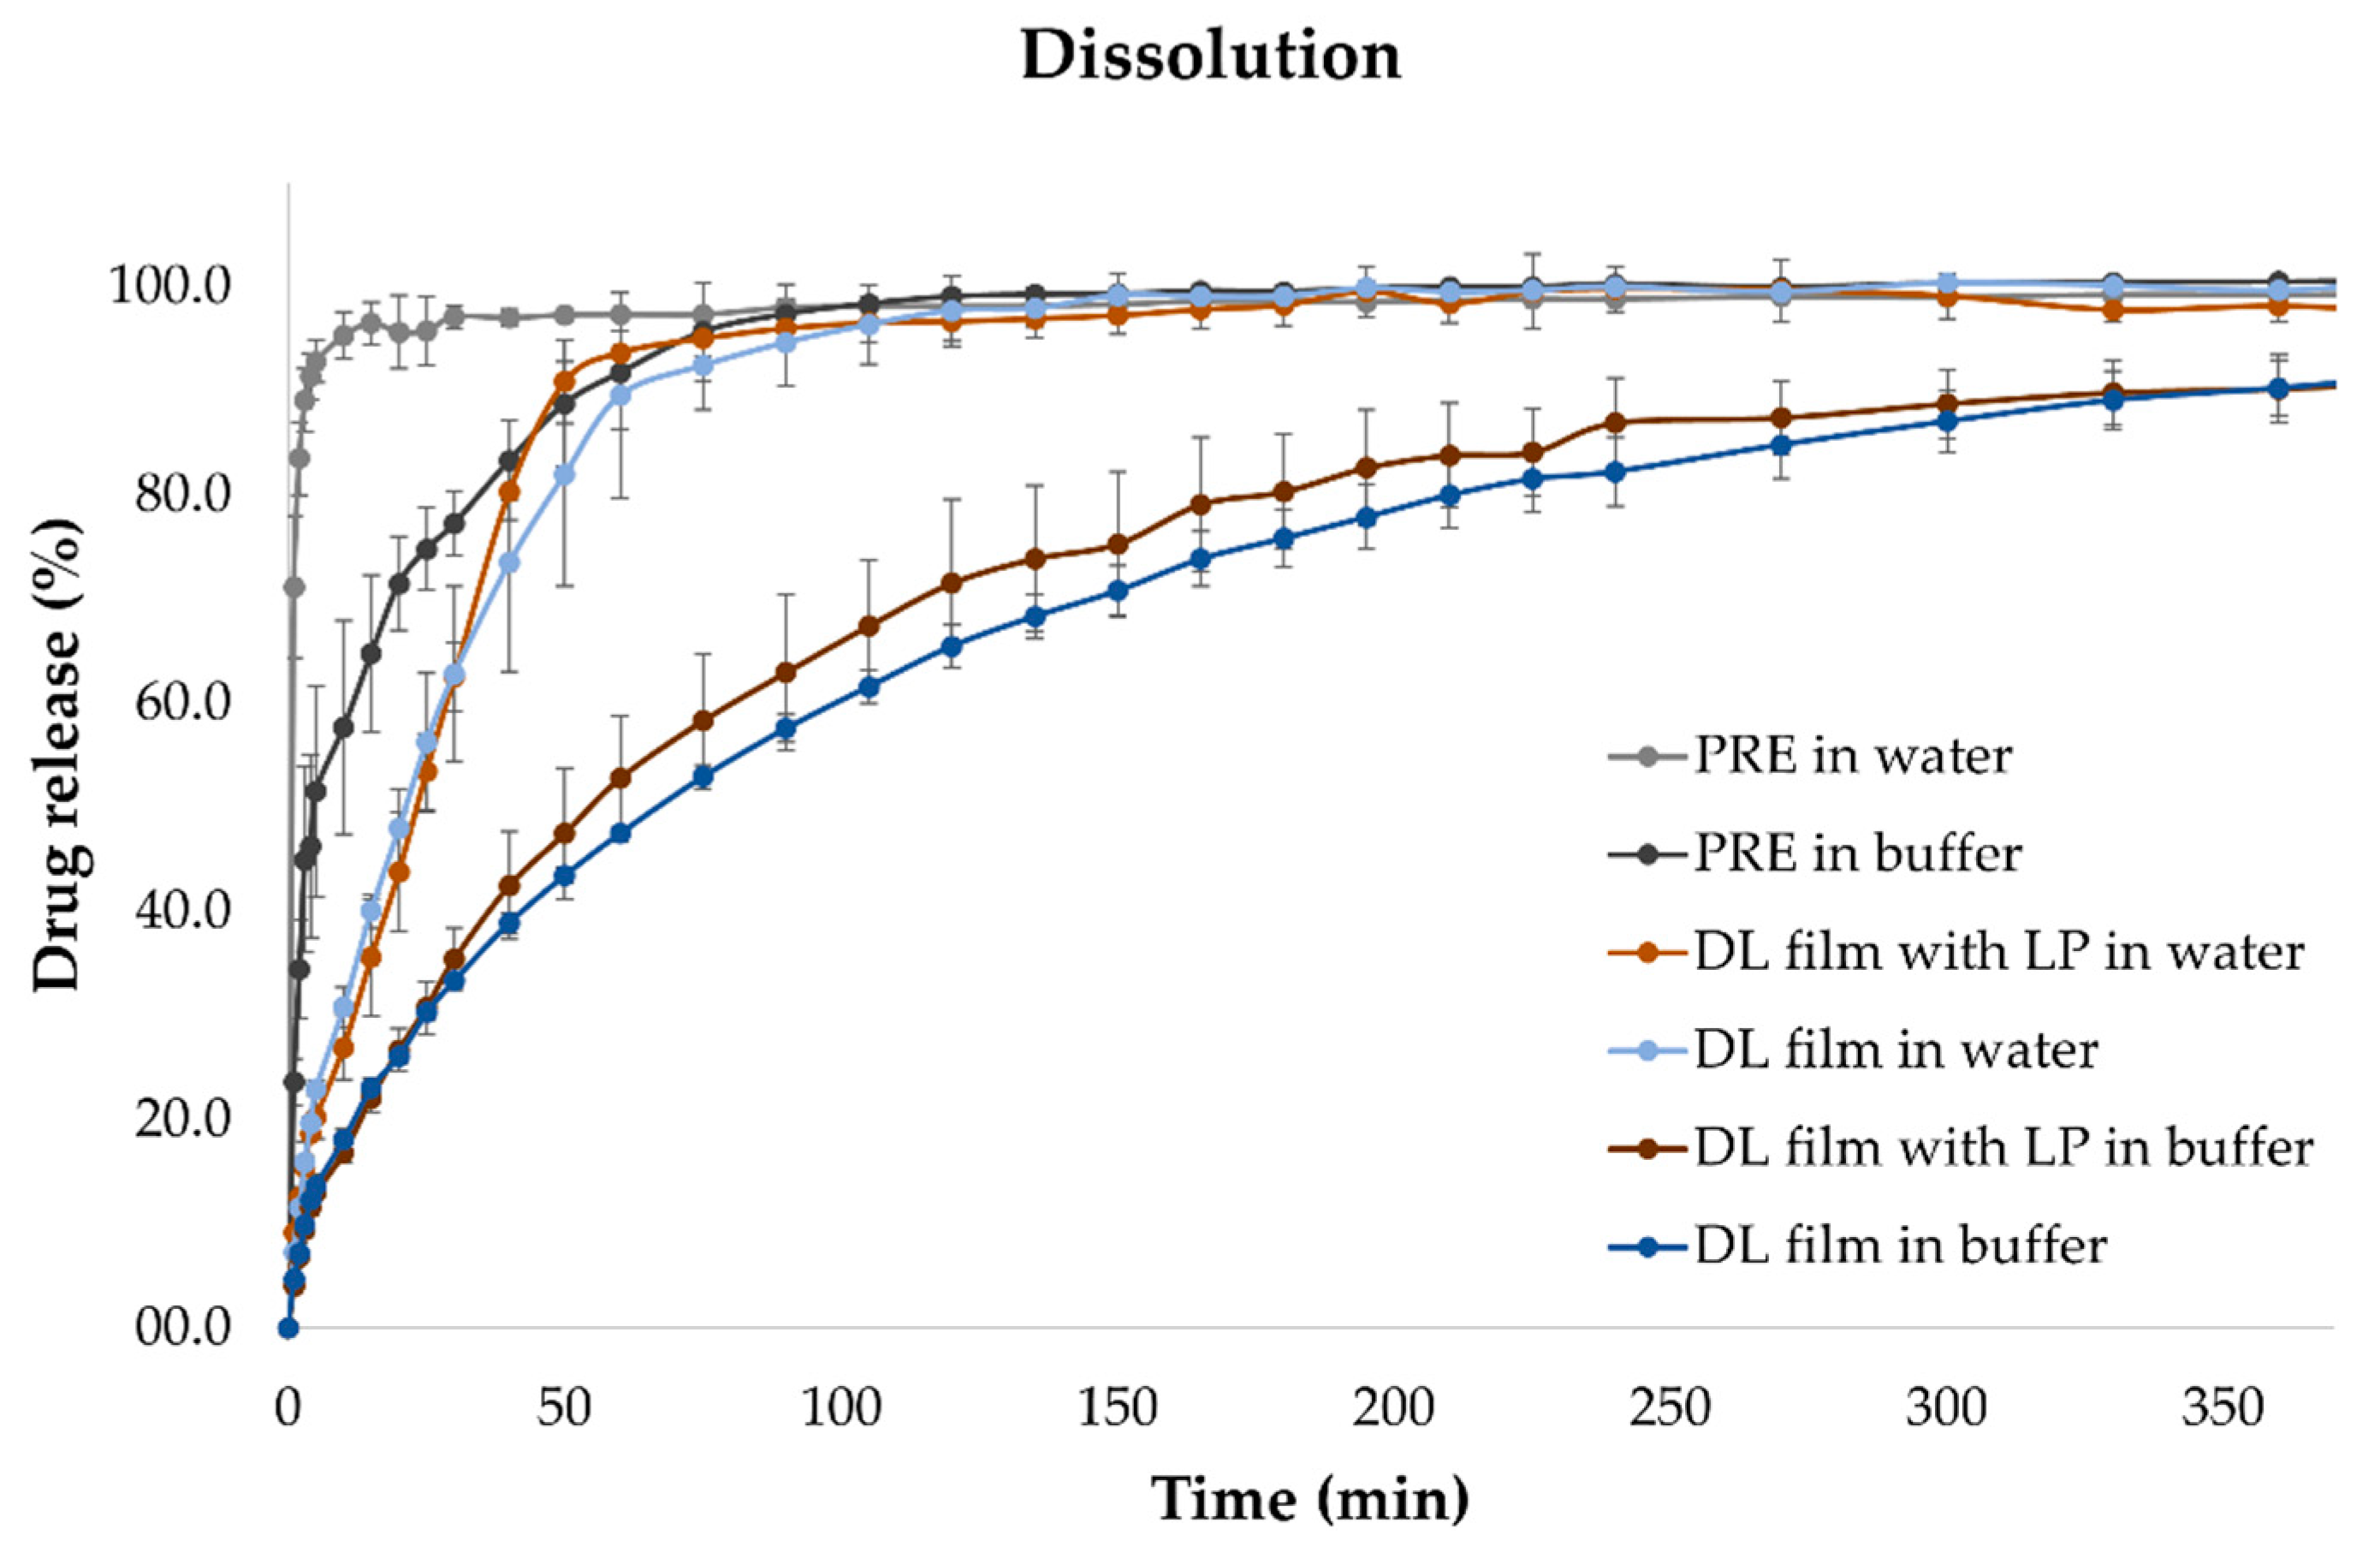
3.9. In Vitro Dissolution
3.10. Drying Test
3.11. ATR-FTIR
3.12. DSC
4. Results and Discussion
4.1. Manufacturing of Veterinary Dosage Forms
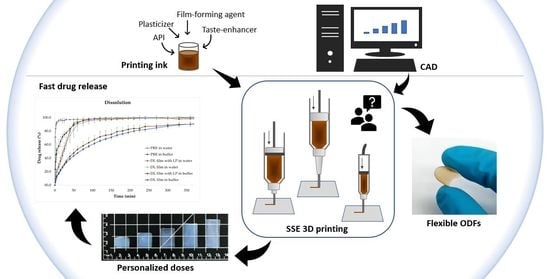
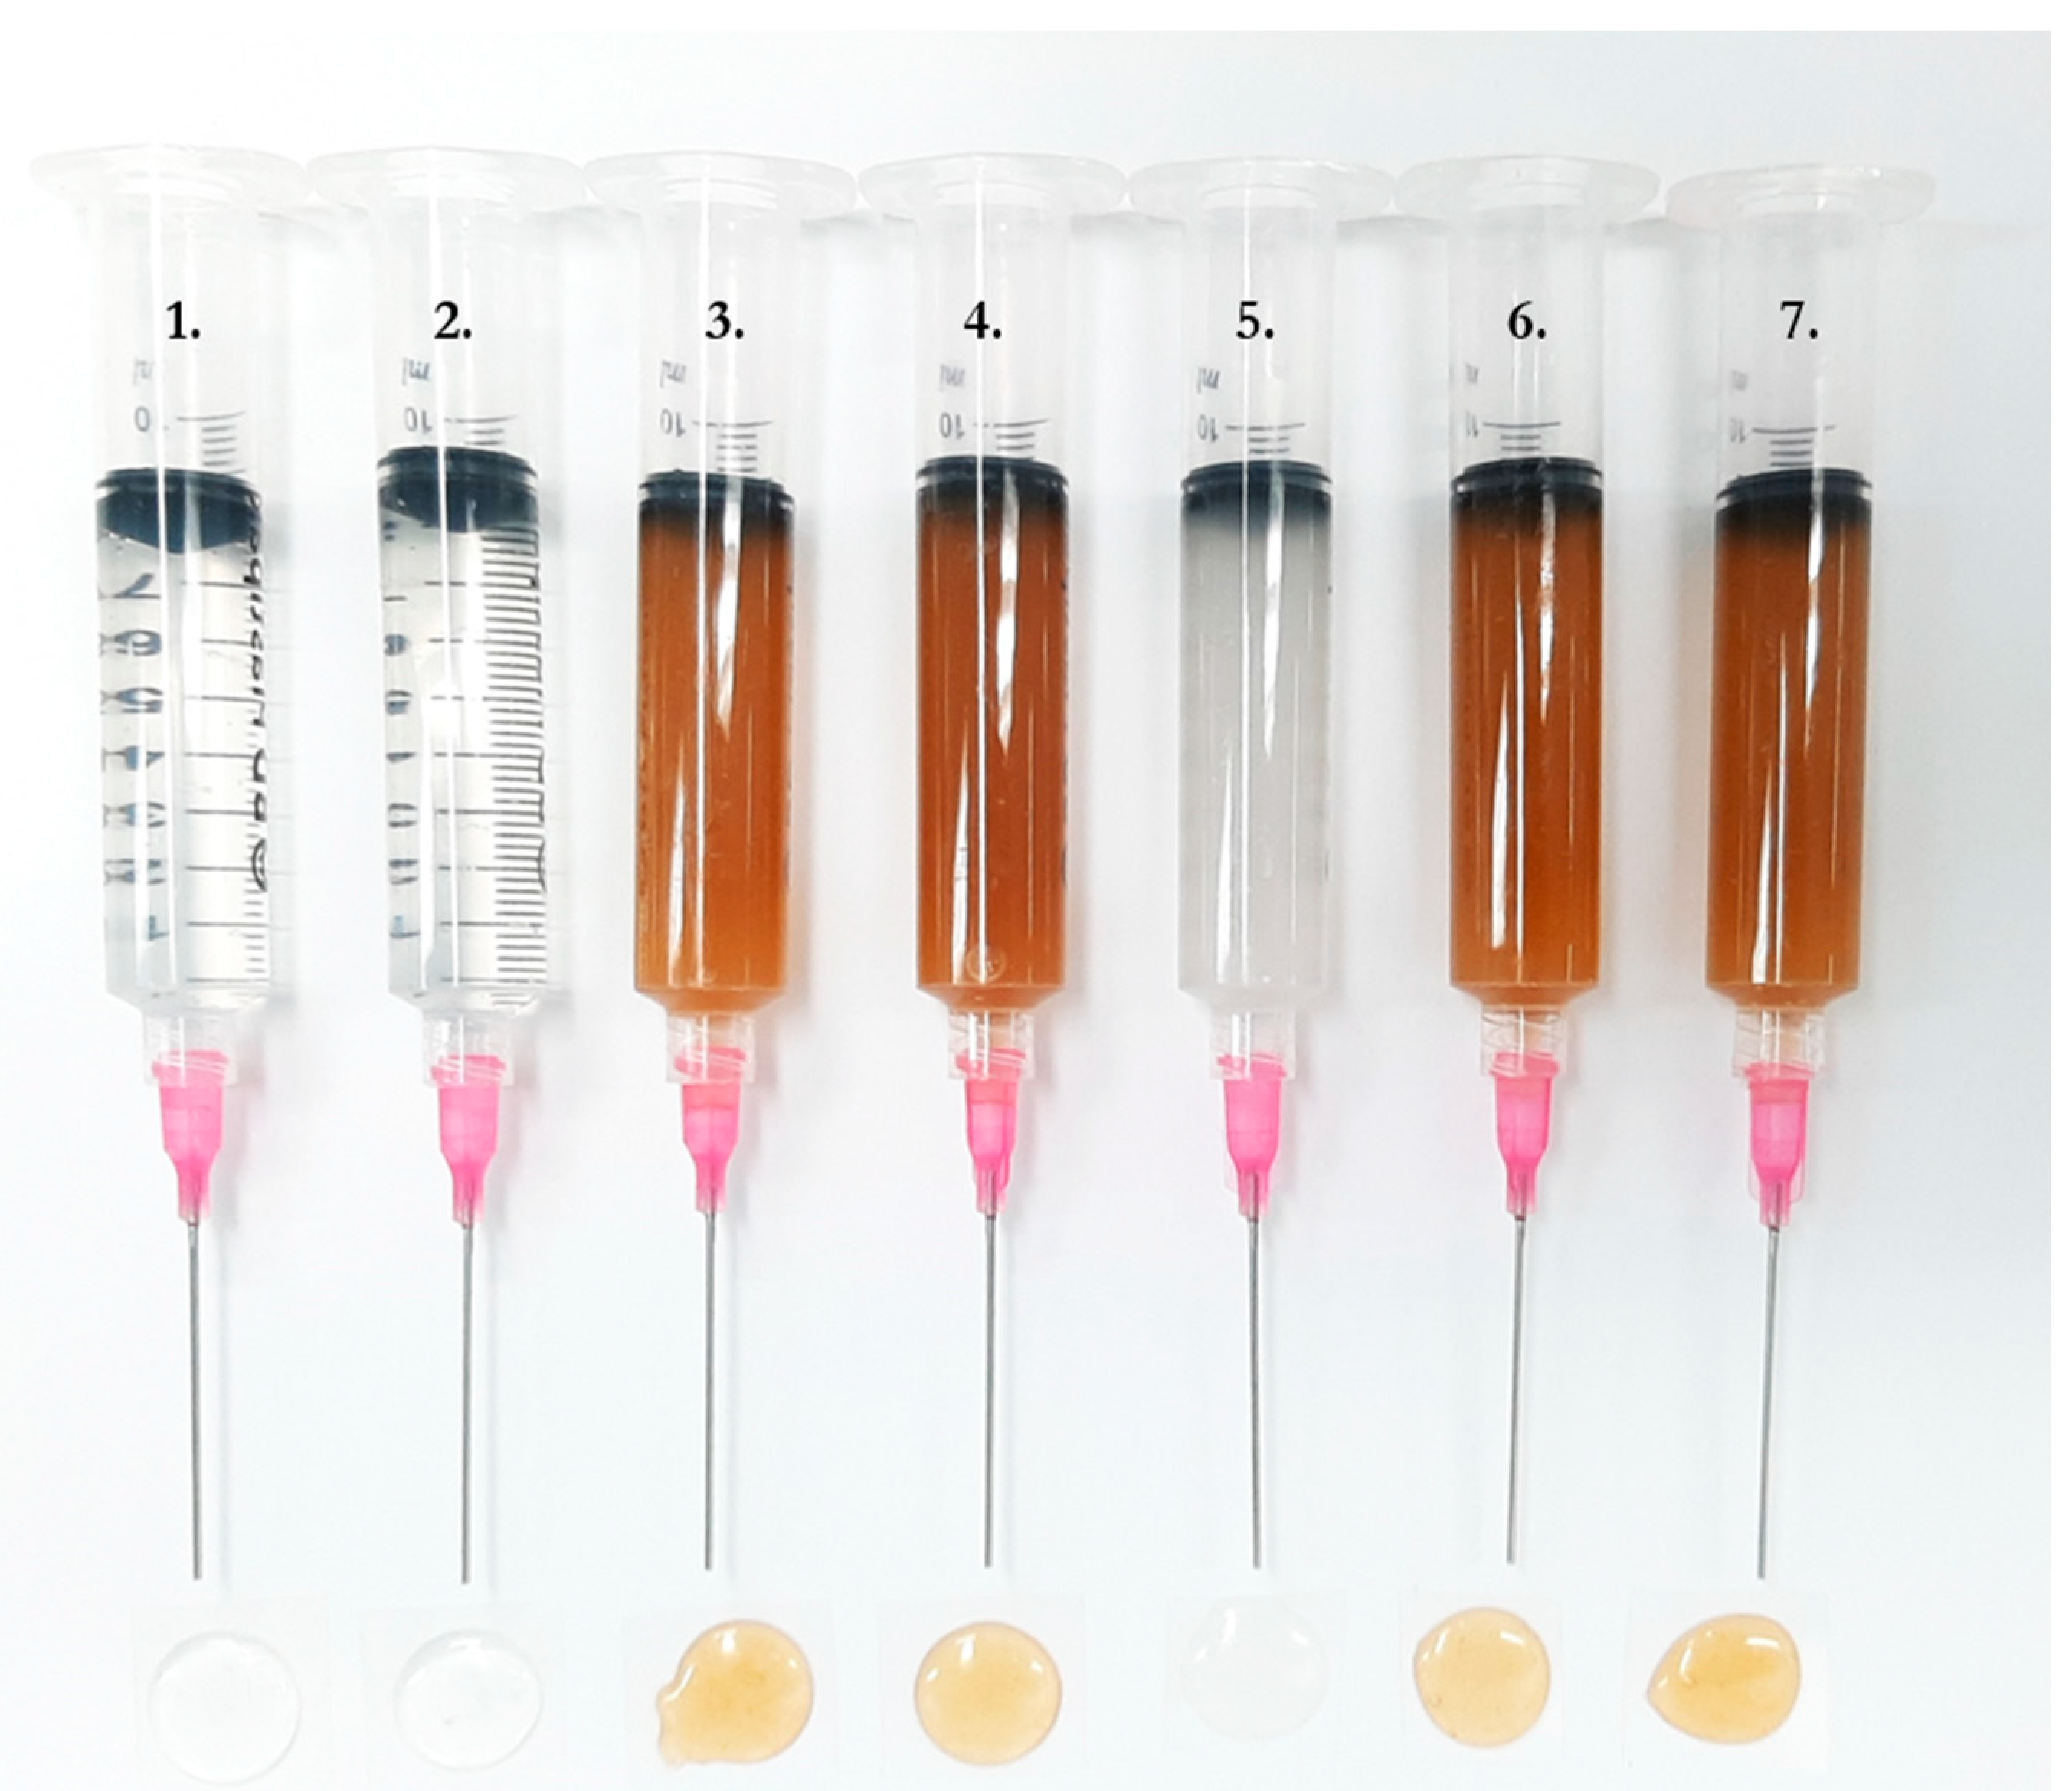
4.1.1. Printing Ink
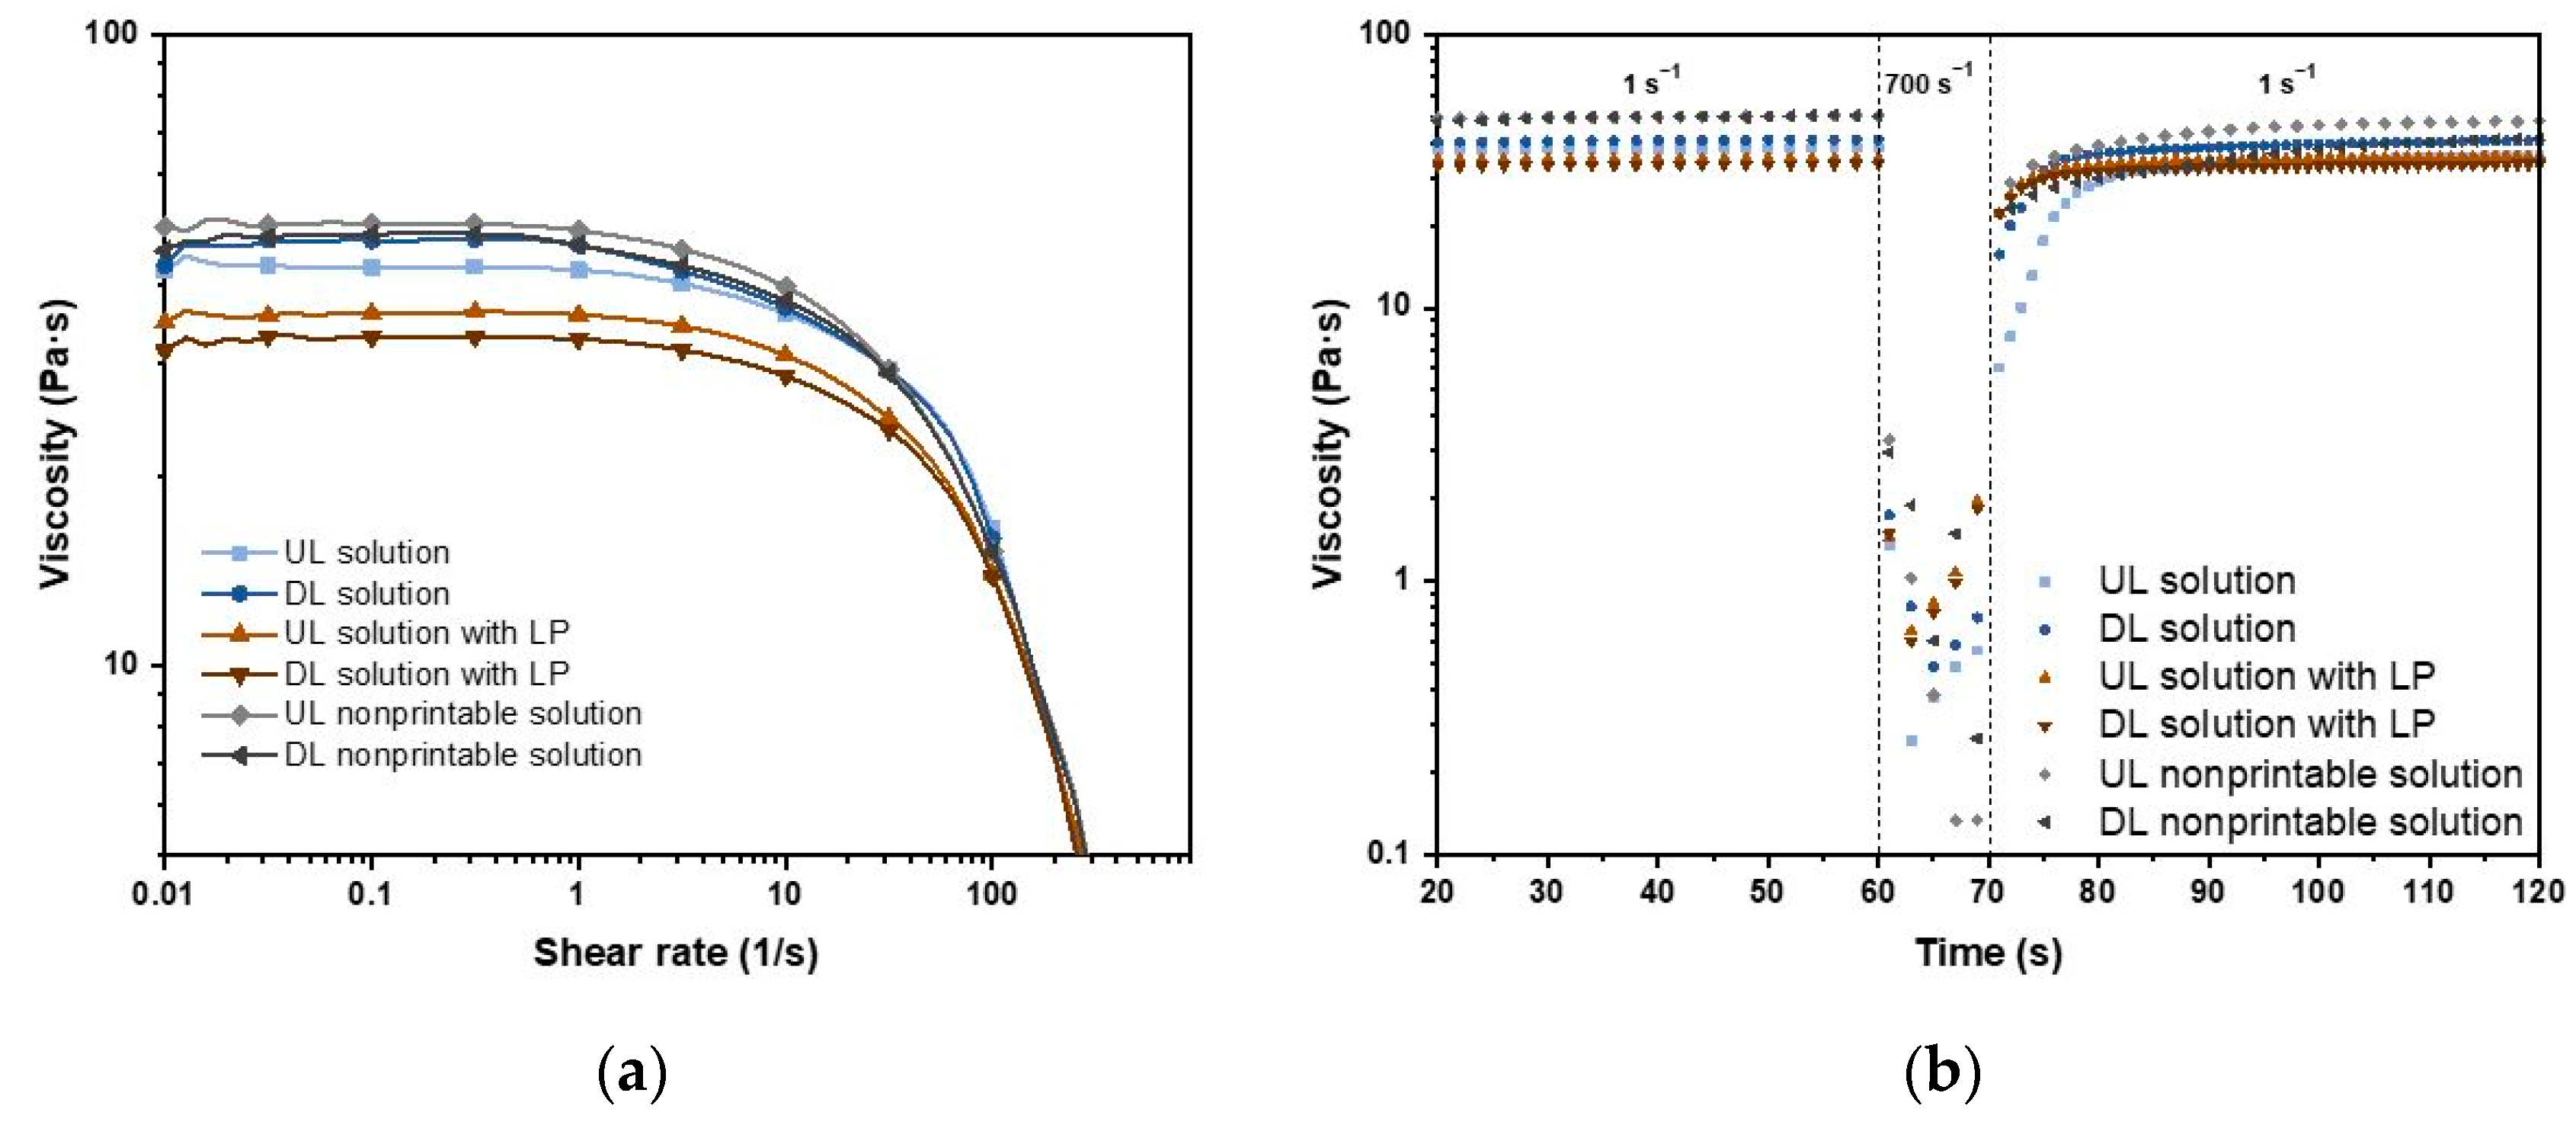
4.1.2. Rheology
4.1.3. Semi-Solid Extrusion 3D Printing
4.2. Weight, Thickness, and Drug Amount
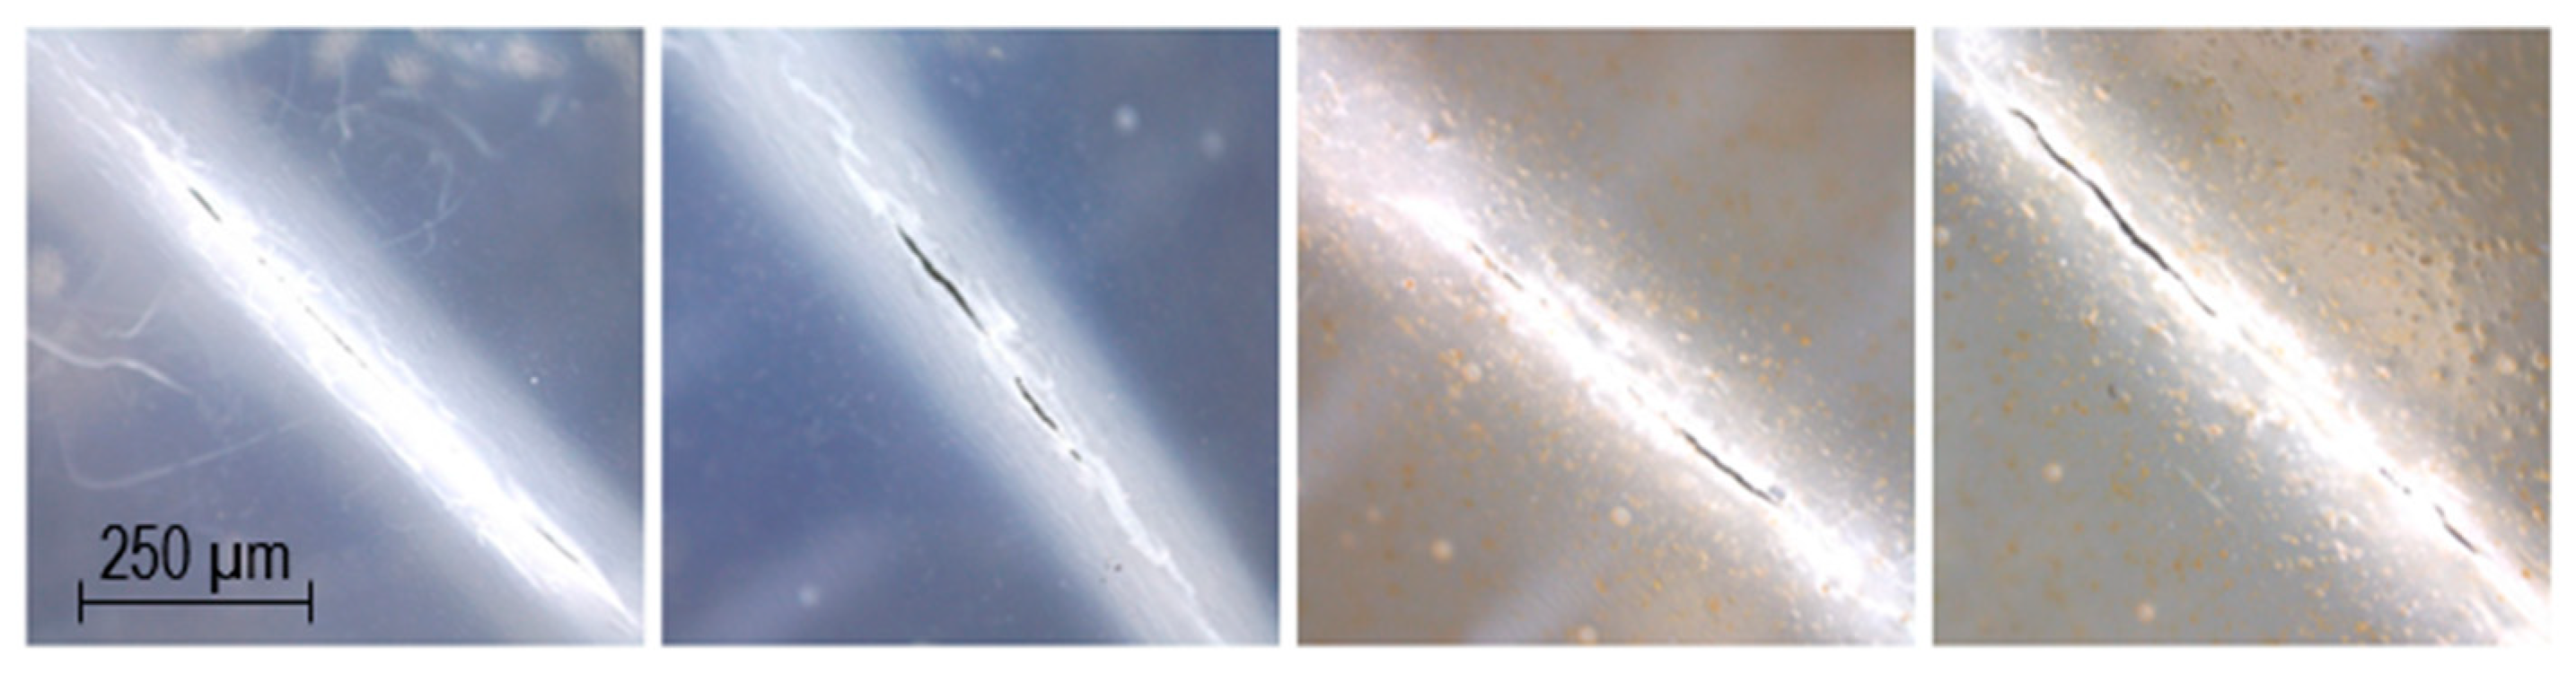
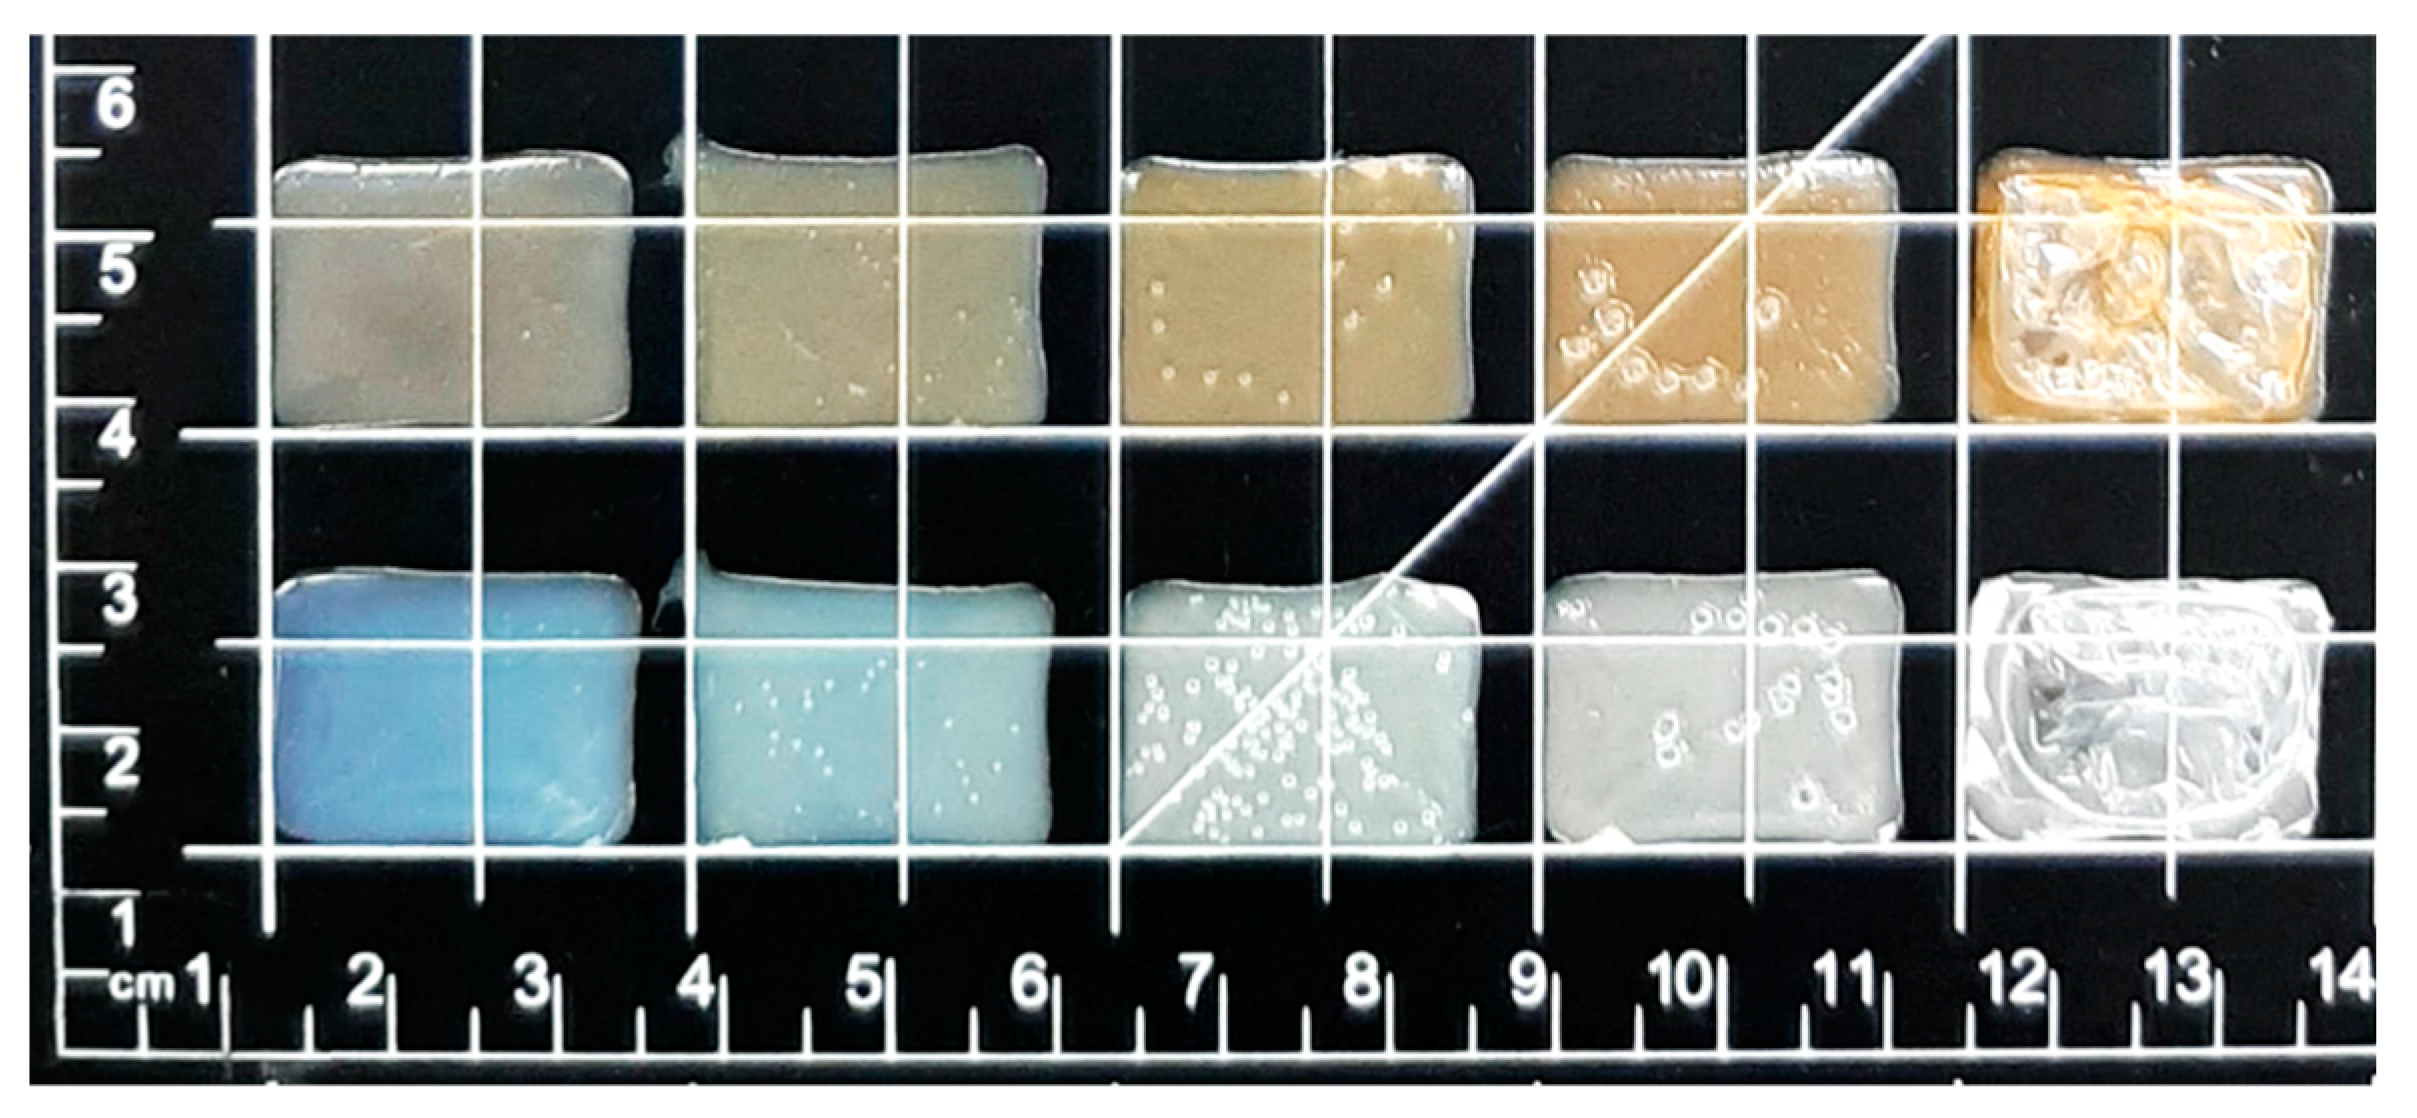
4.3. Appearance of Dosage Forms
4.4. Mechanical Properties
4.5. Moisture Content
4.6. Surface pH
4.7. Adhesiveness
4.8. Disintegration
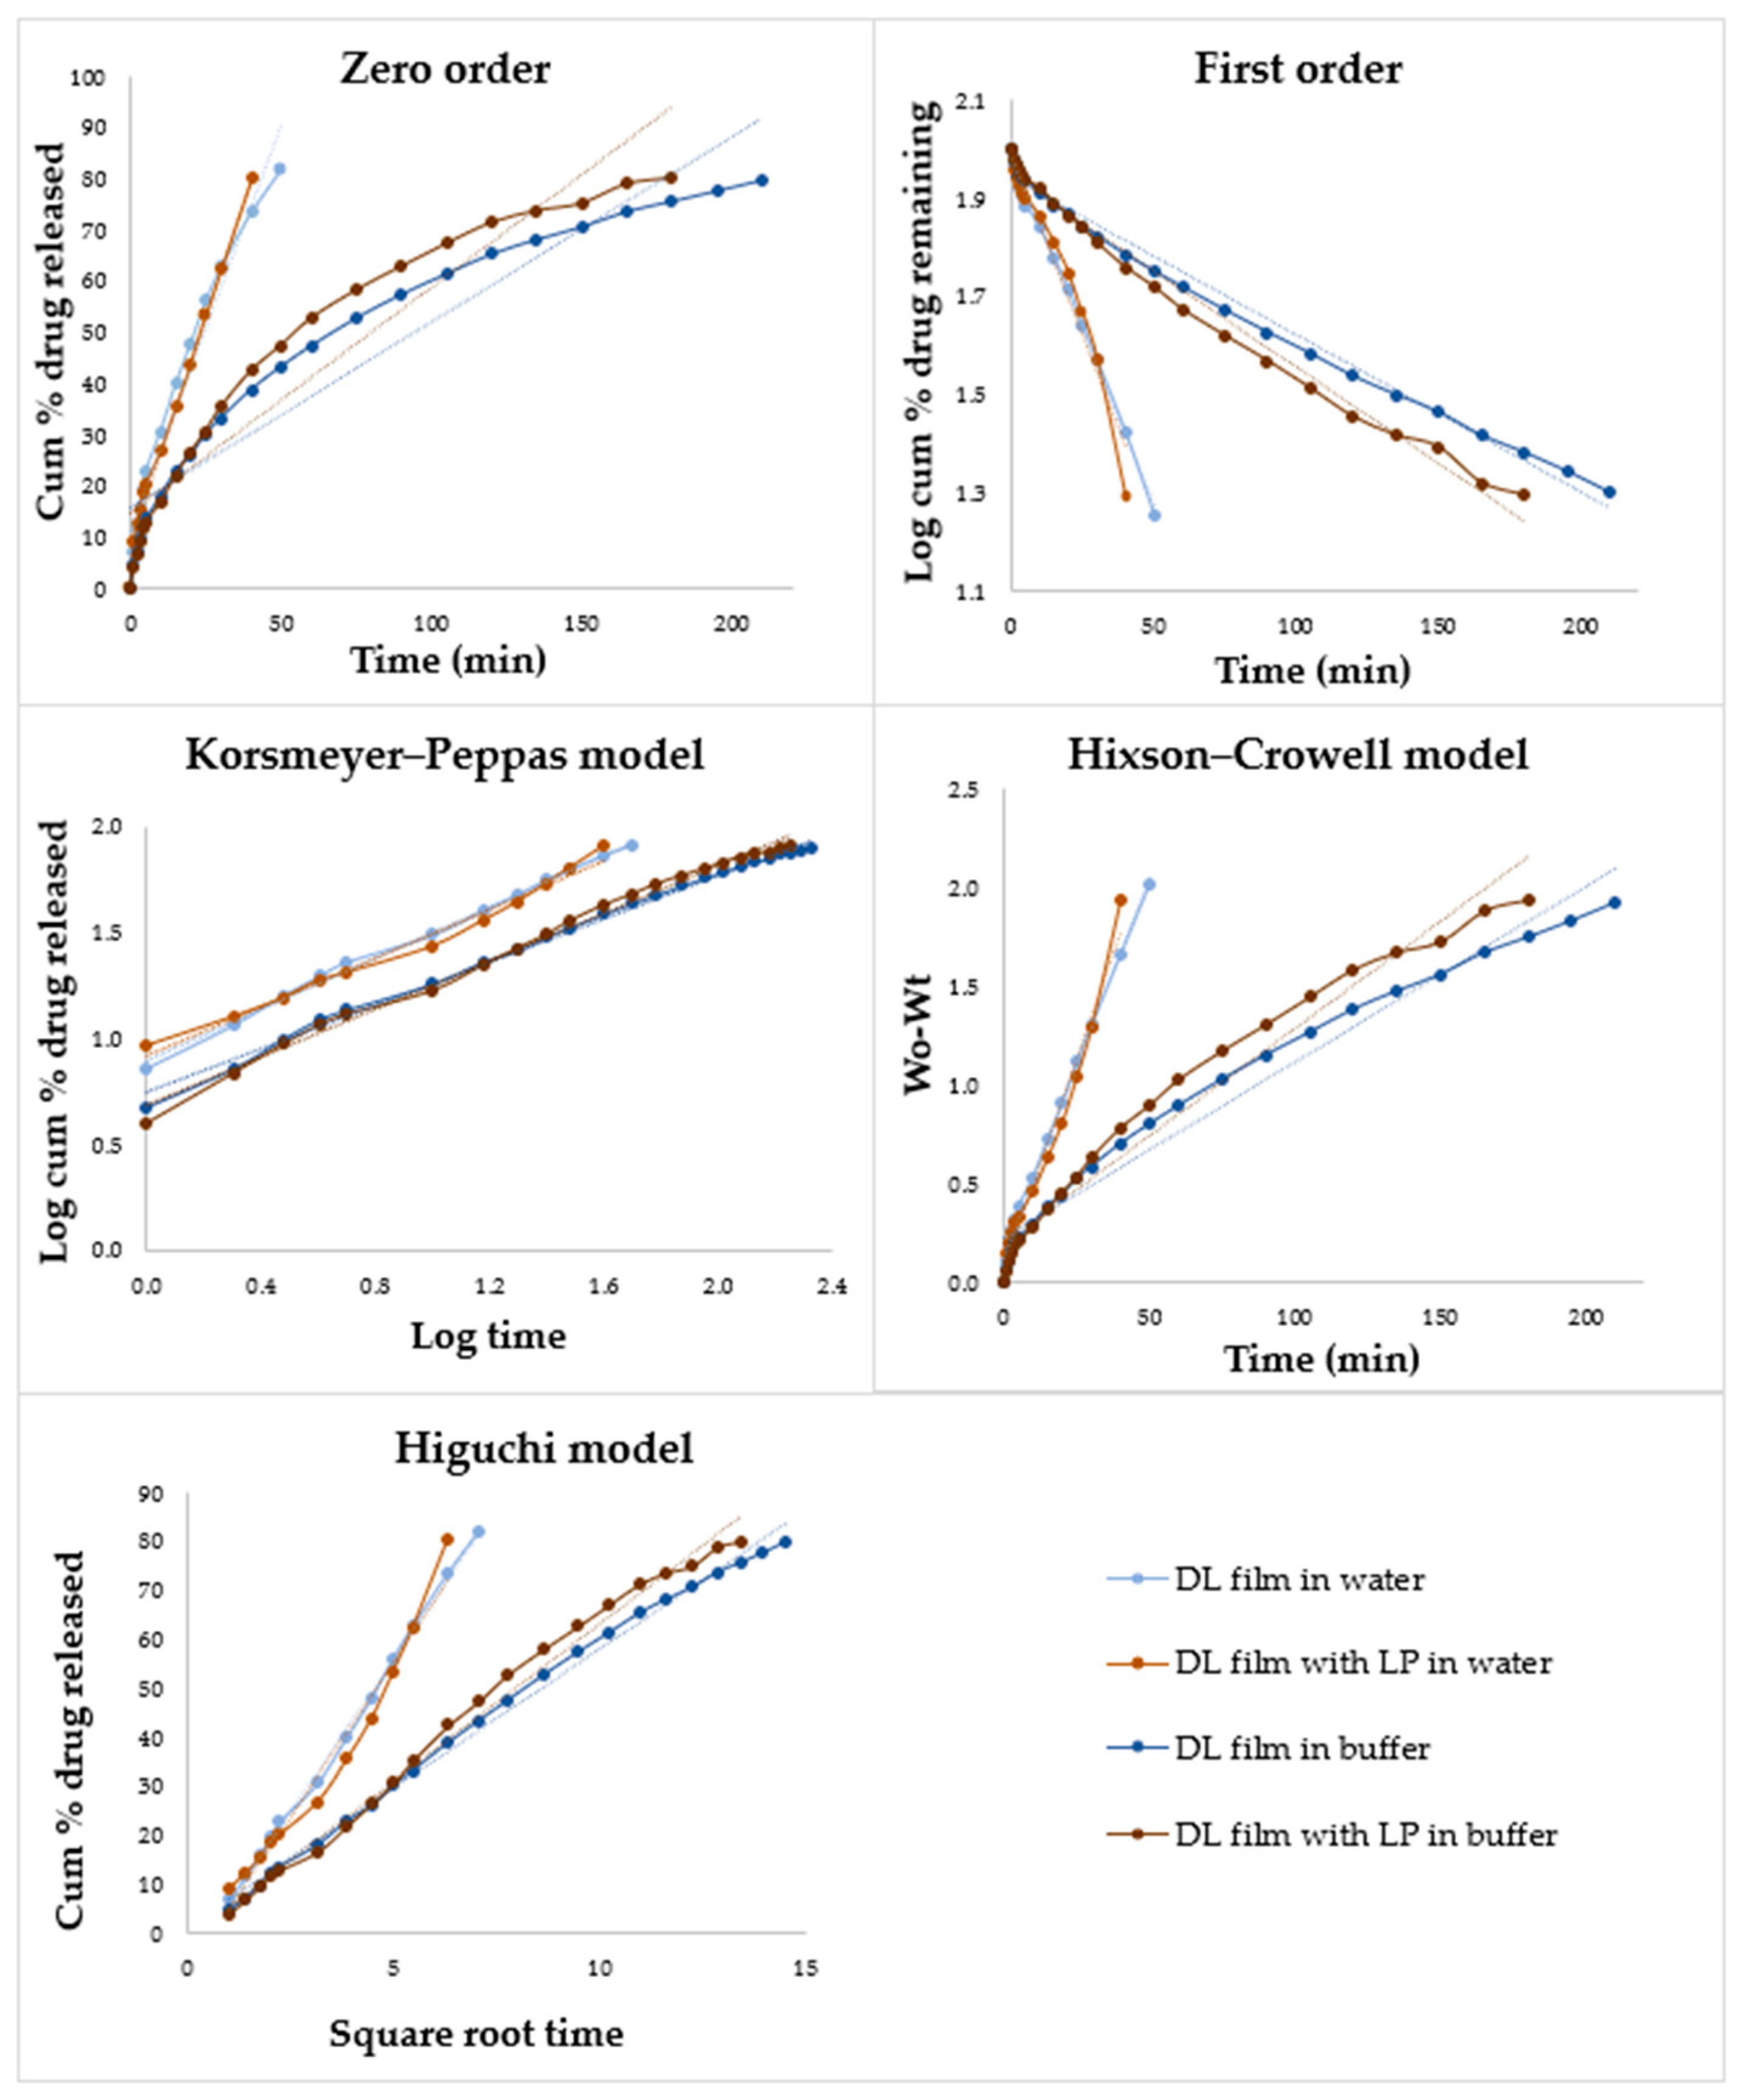
4.9. In Vitro Dissolution
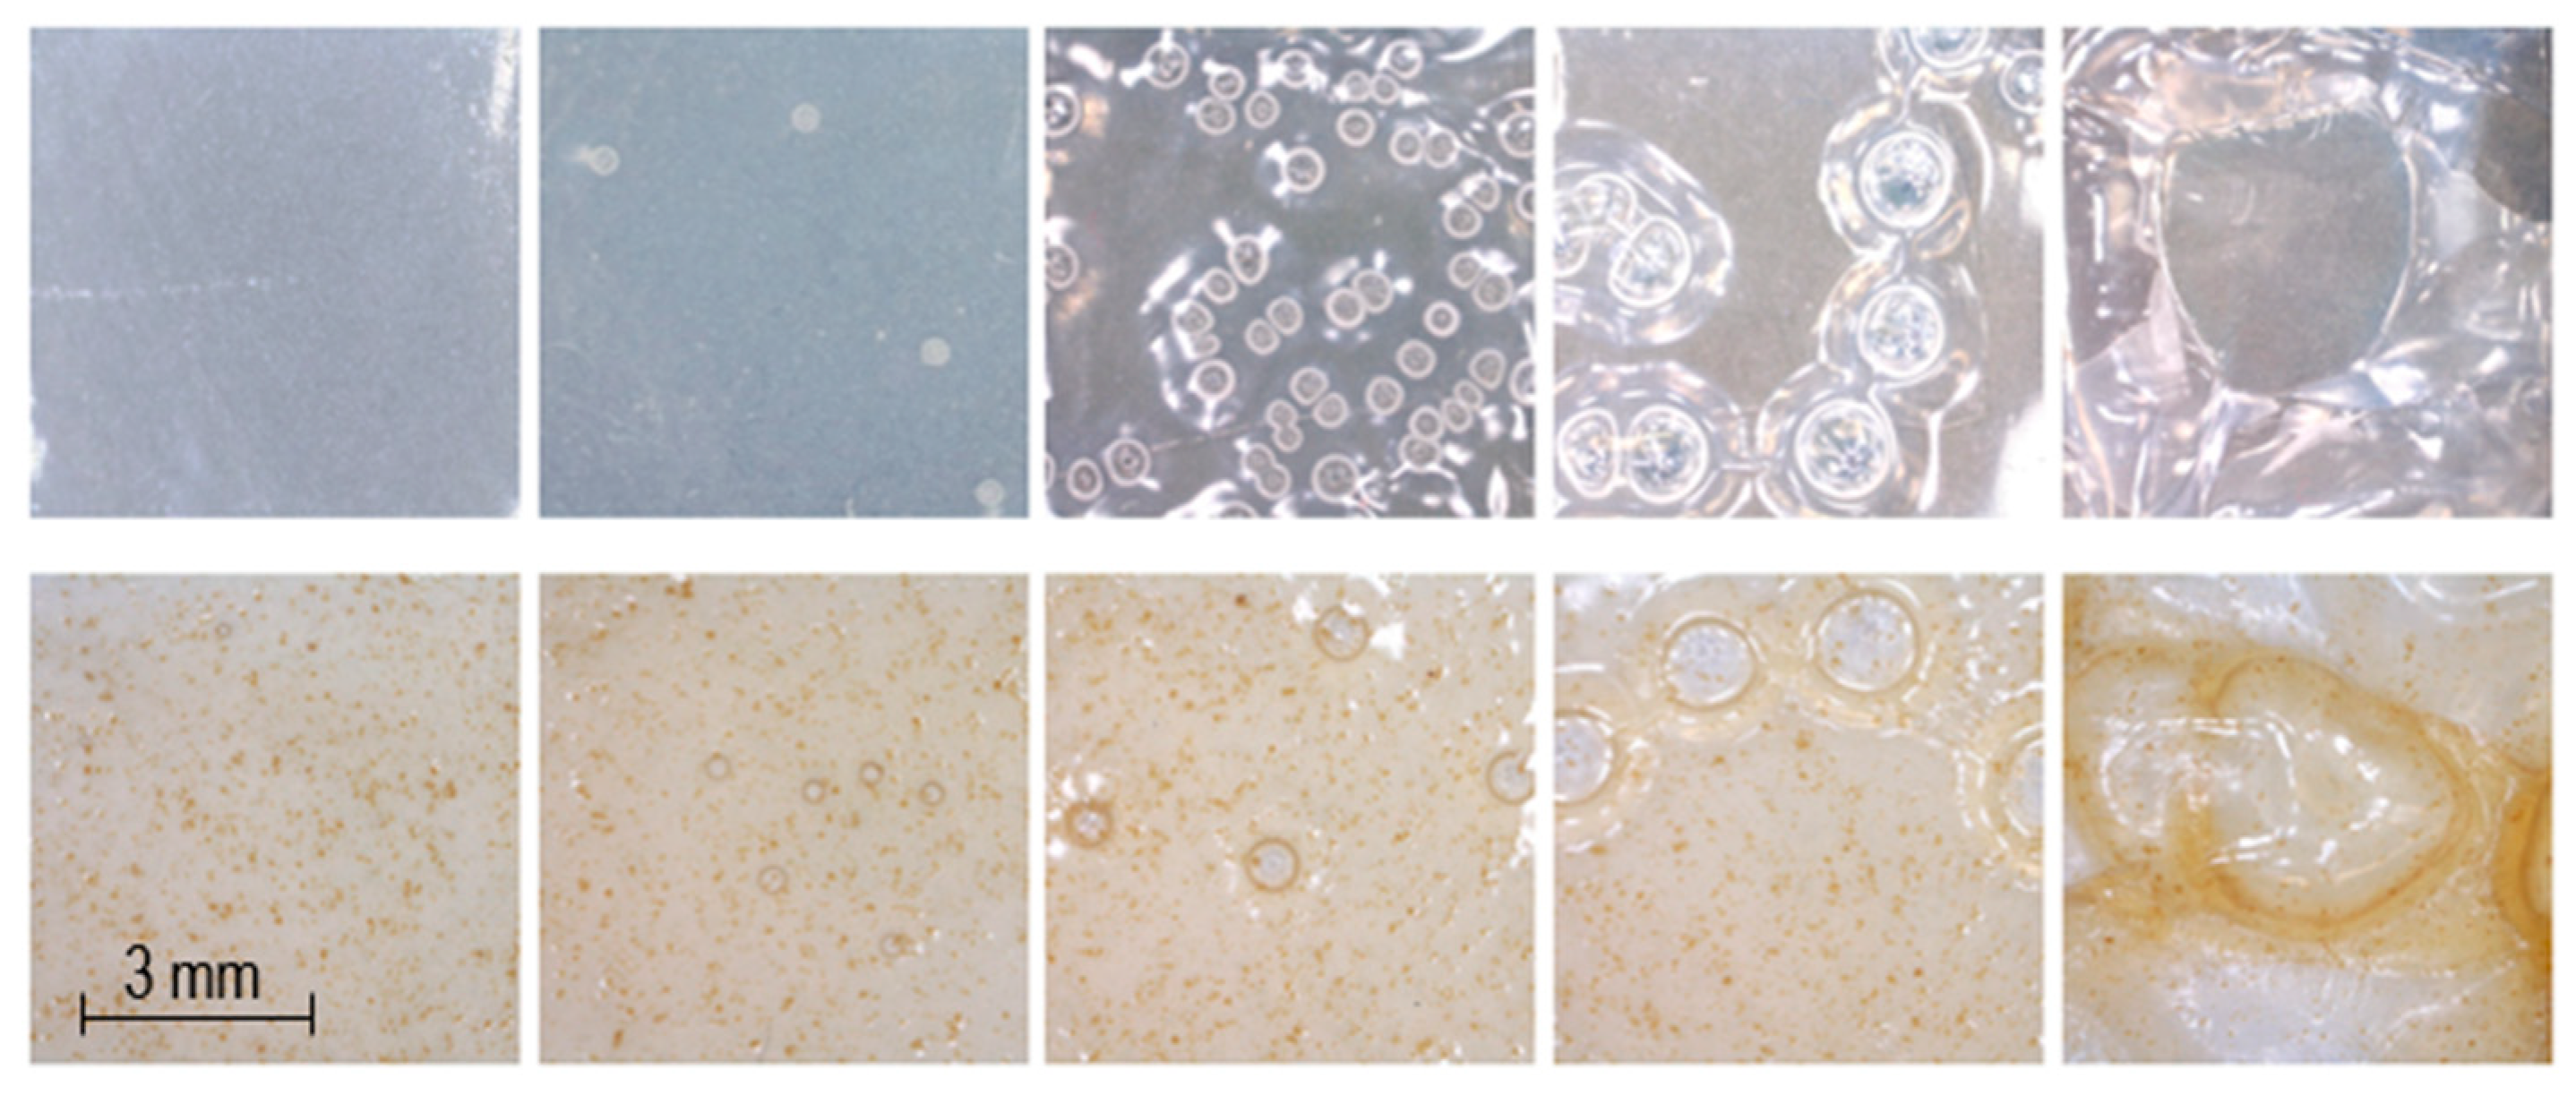
4.10. Drying Time
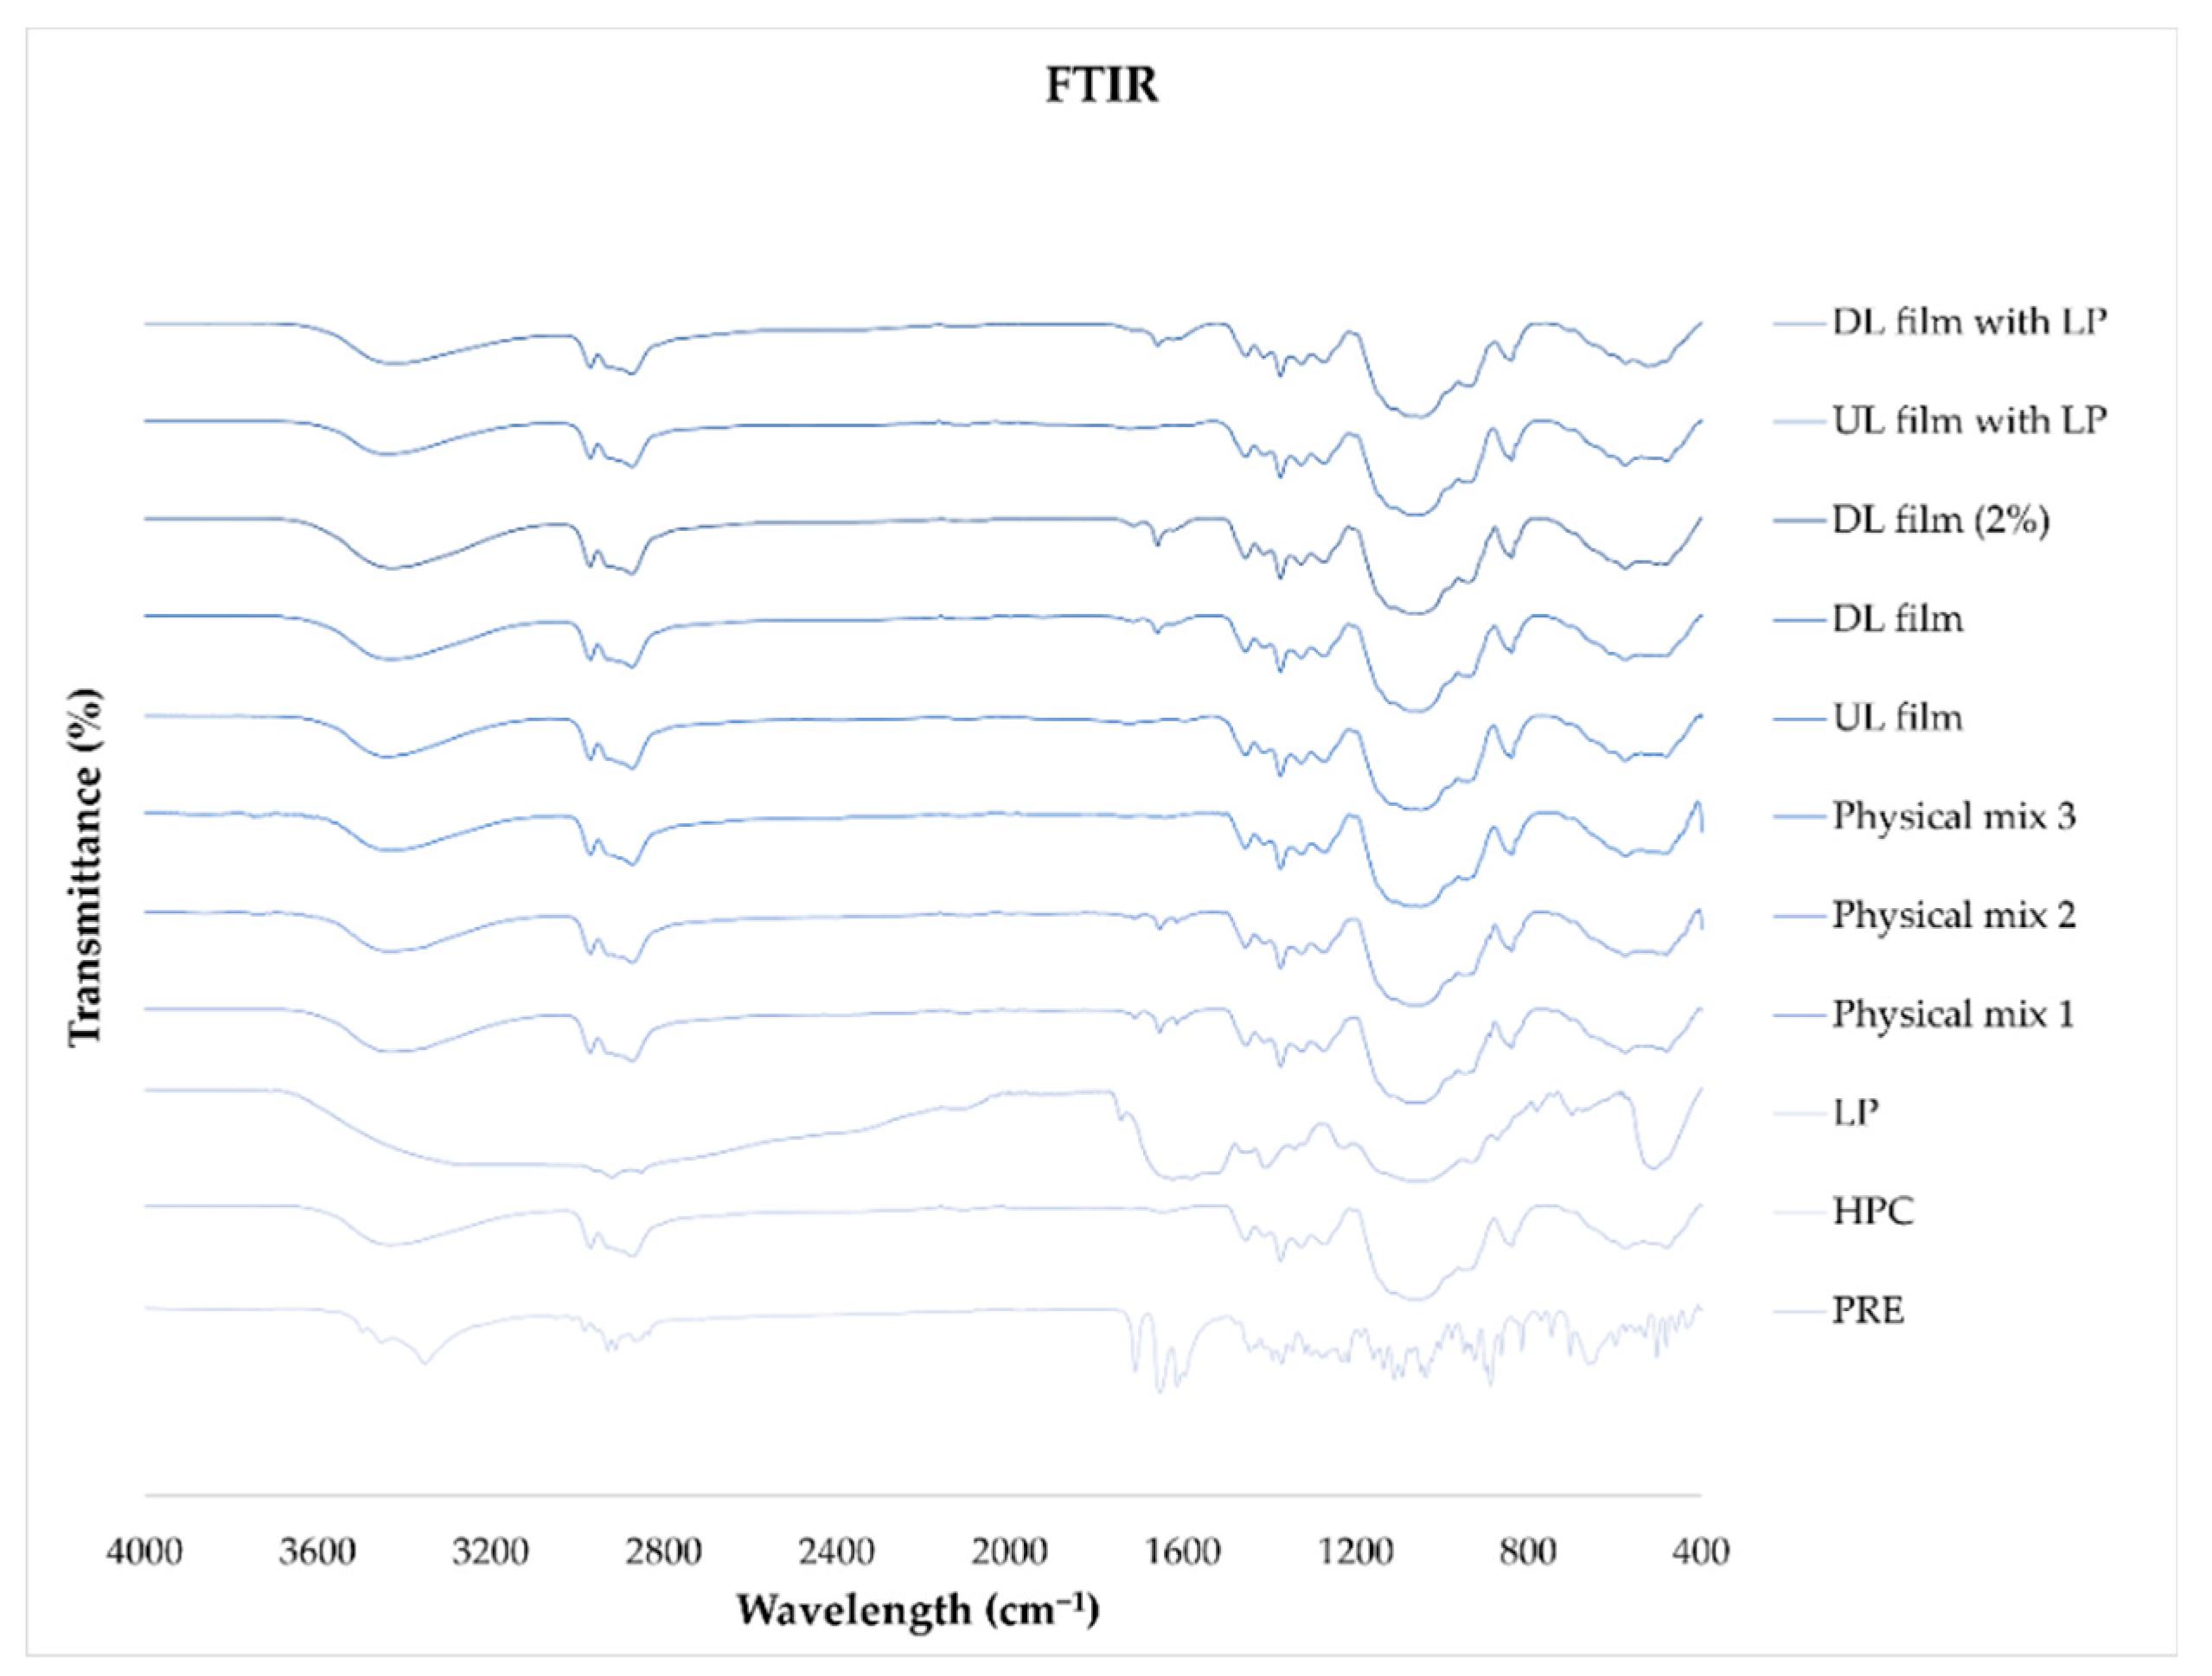
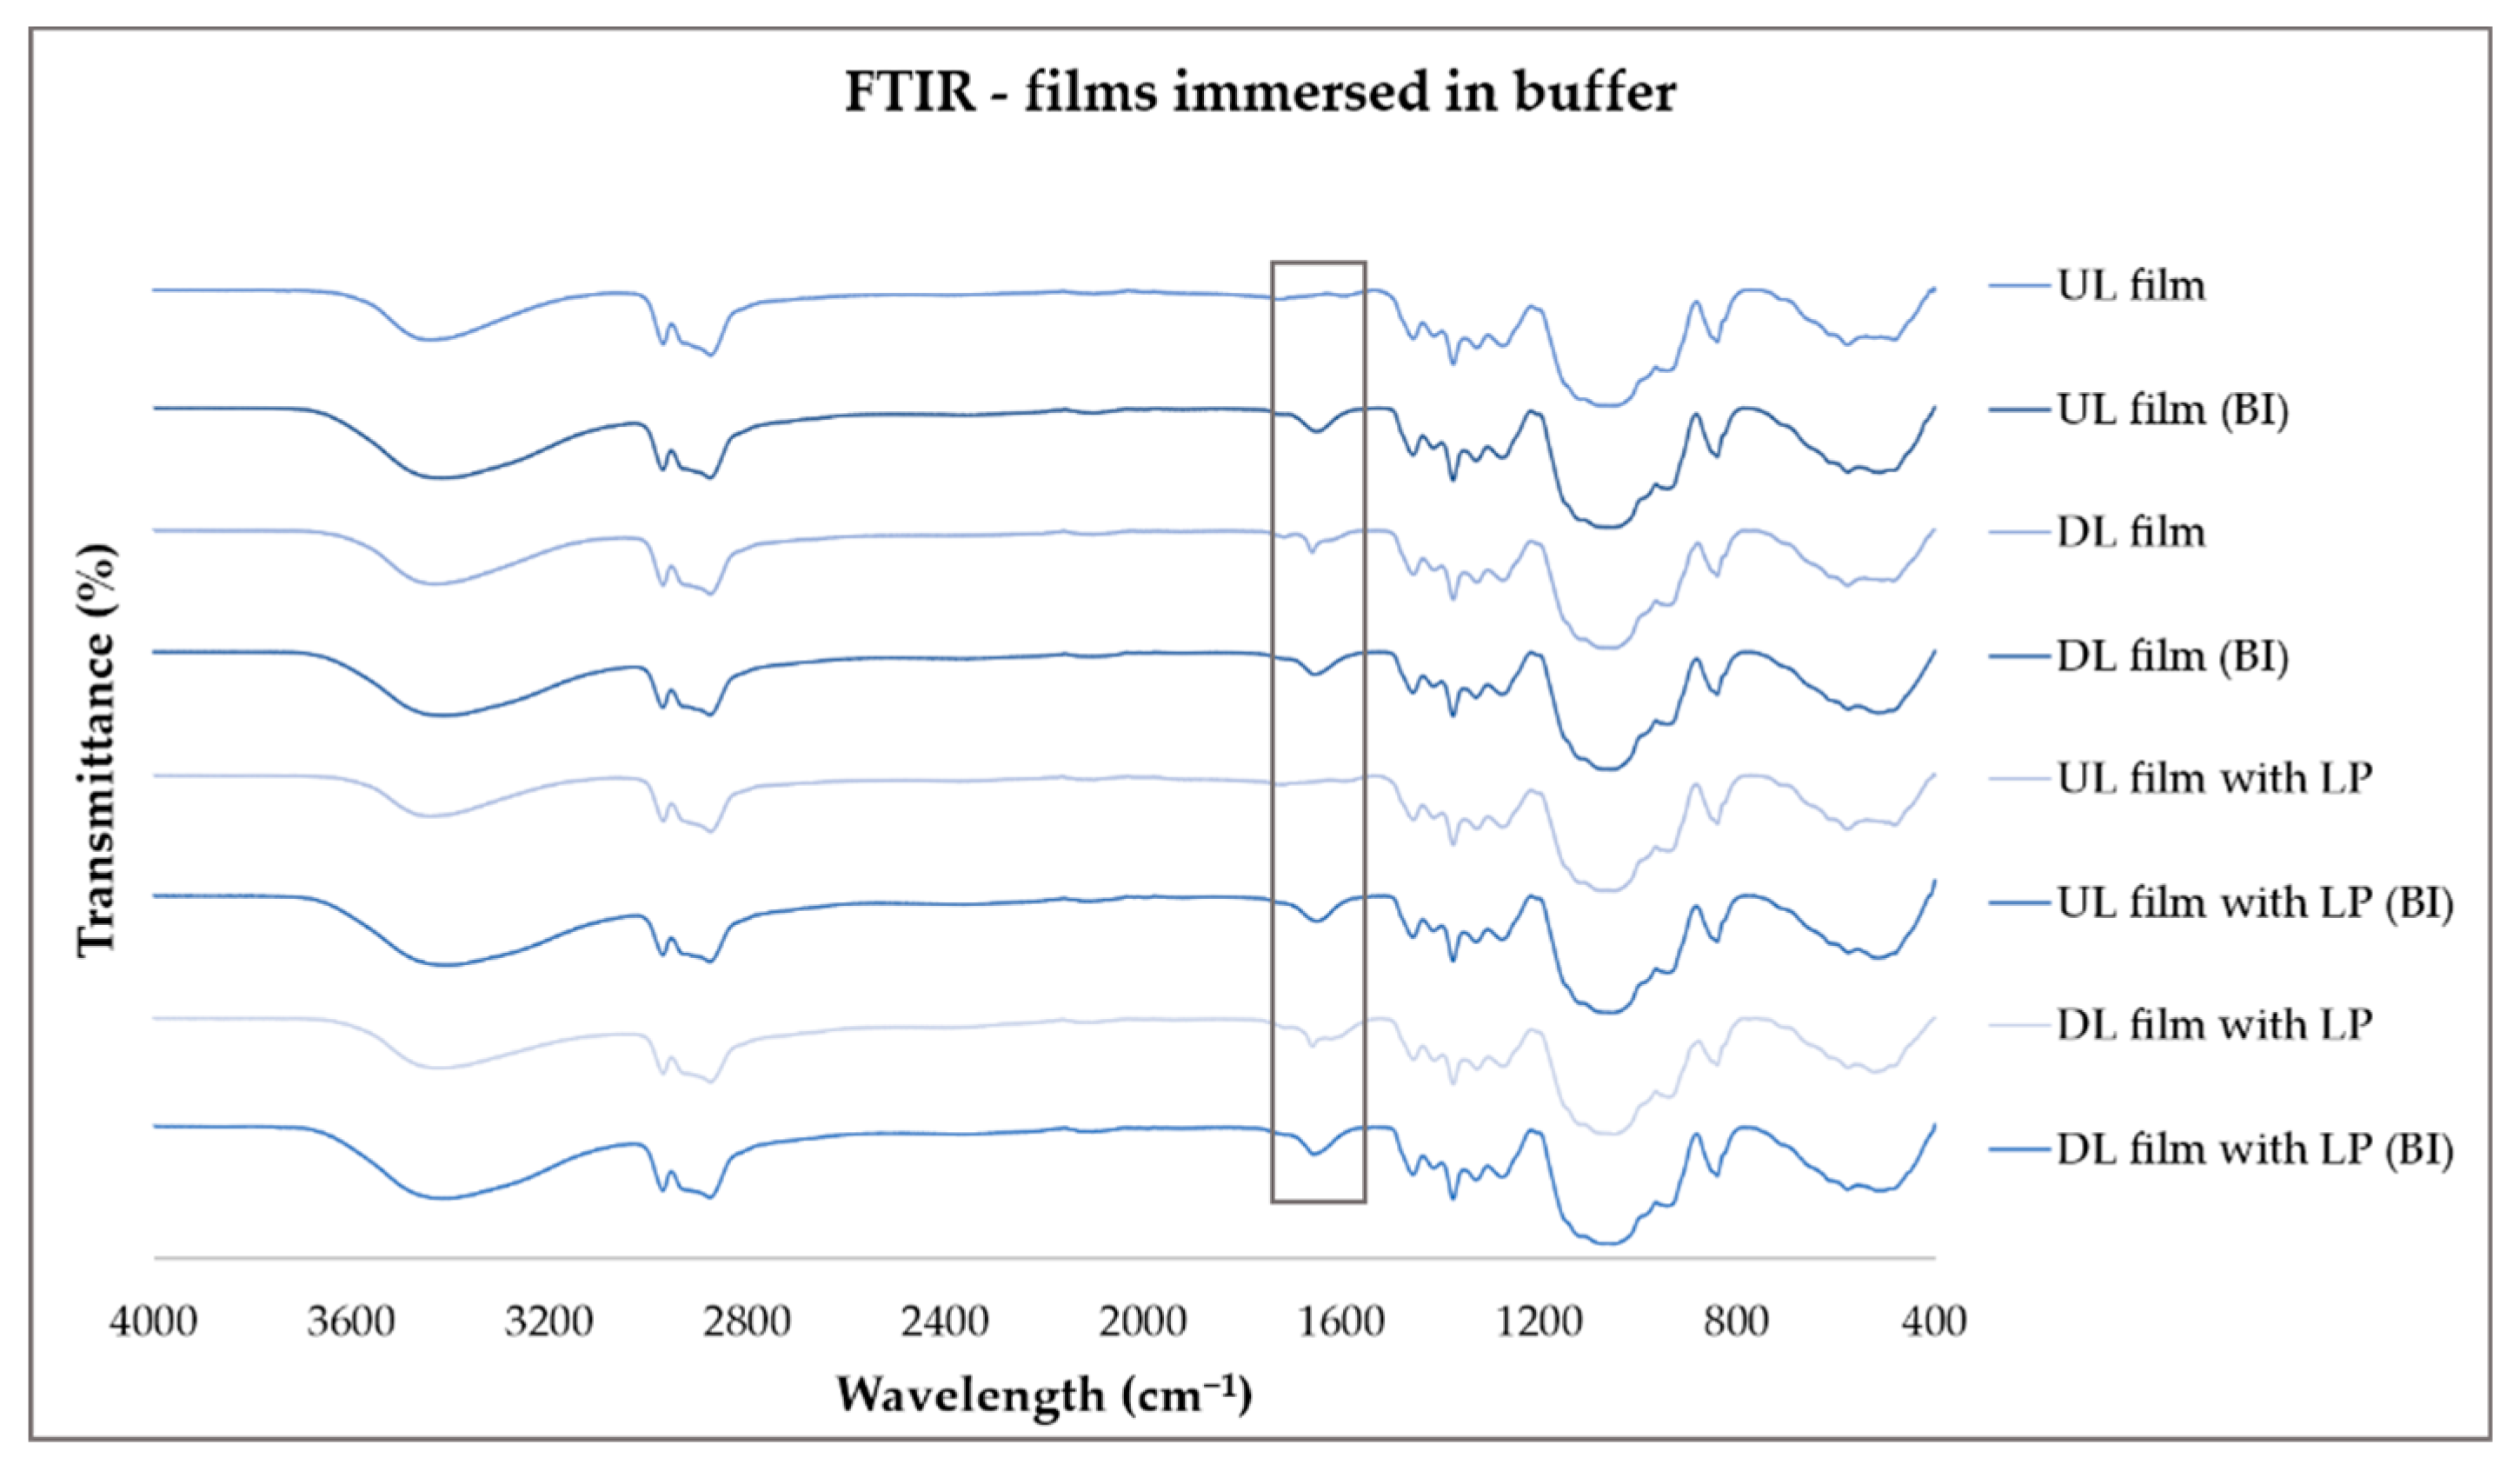
4.11. ATR-FTIR
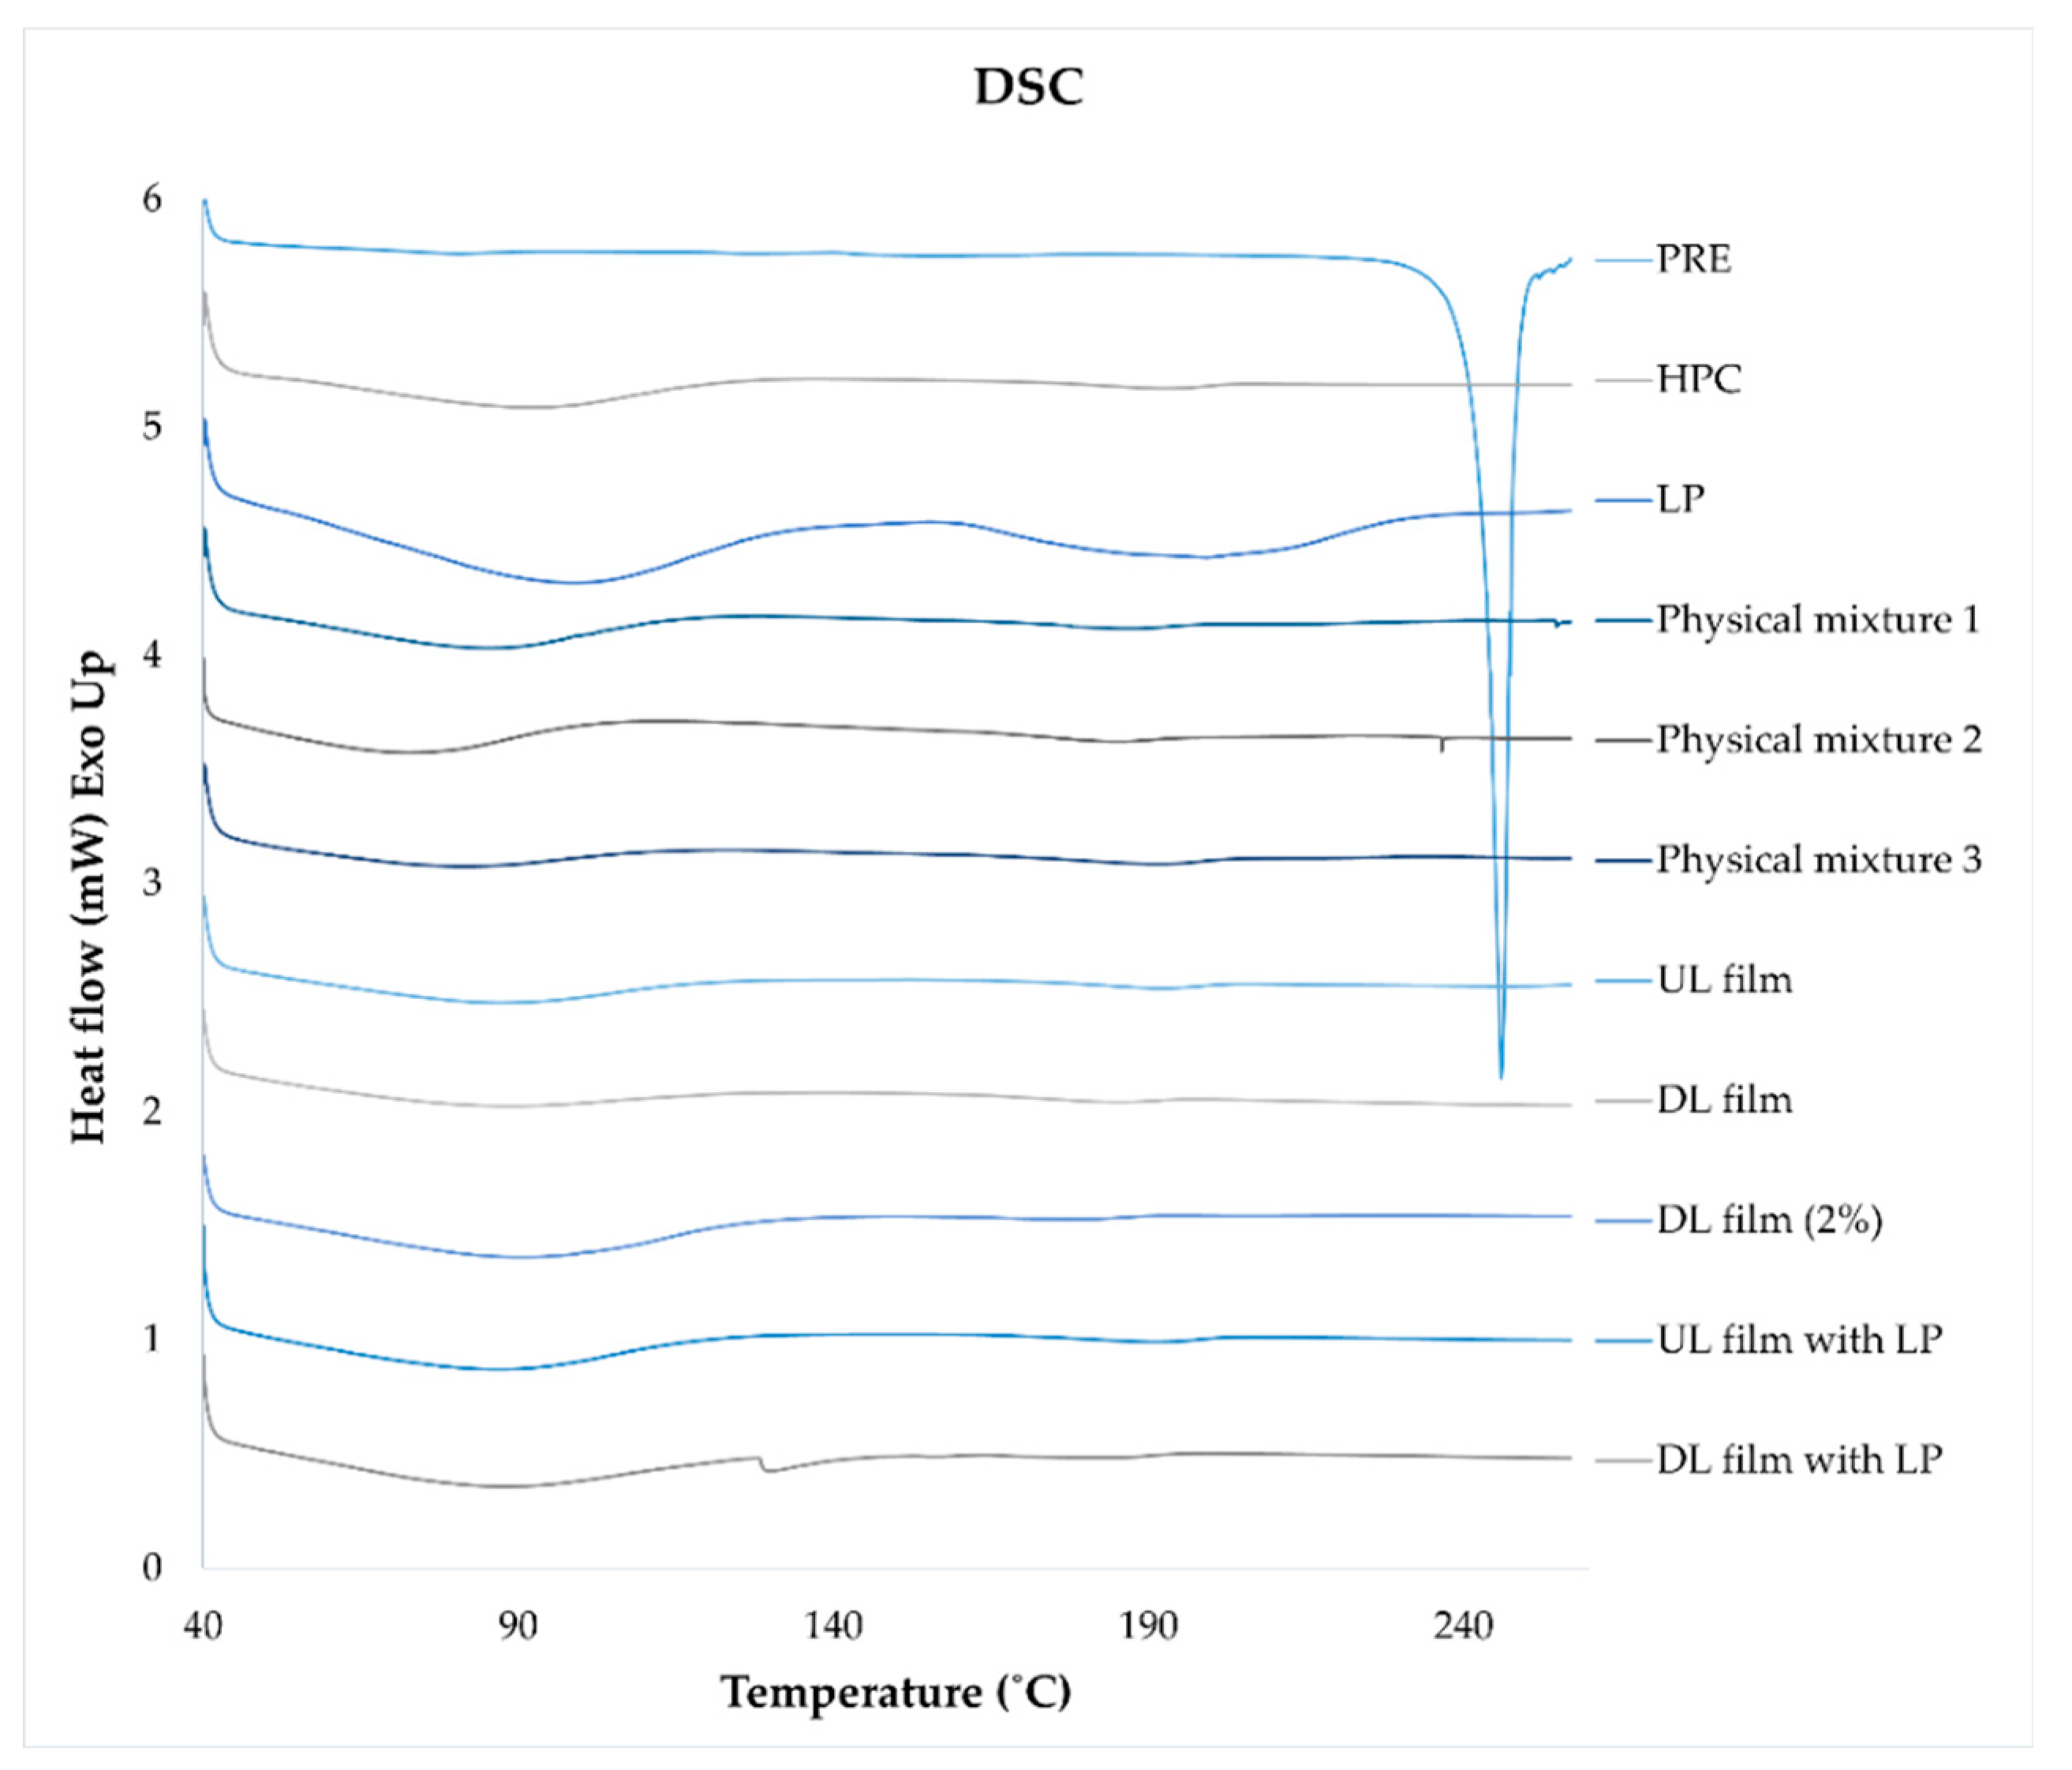
4.12. DSC
5. Conclusions
Author Contributions
Funding
Acknowledgments
Conflicts of Interest
References
- Davidson, G. Veterinary compounding: Regulation, challenges, and resources. Pharmaceutics 2017, 9, 5. [Google Scholar] [CrossRef] [PubMed] [Green Version]
- European Pharmacopoeia Commission. Pharmaceutical preparations. In European Pharmacopoeia; European Directorate for the Quality of Medicines (EDQM): Strasbourg, France, 2020; pp. 880–882. [Google Scholar]
- Missouri Board of Pharmacy, Annual Reports from 2006–2019. Available online: https://pr.mo.gov/pharmacists-annual-reports.asp (accessed on 19 September 2020).
- Bramwell, B.; Pharm, B.S.; Williams, L.A. Recommended Tips for Treating Veterinary Patients. Int. J. Pharm. Compd. 2009, 13, 390–391. [Google Scholar] [PubMed]
- Lowe, A.D.; Campbell, K.L.; Graves, T. Glucocorticoids in the cat. Vet. Dermatol. 2008, 19, 340–347. [Google Scholar] [CrossRef] [PubMed]
- Wening, K.; Breitkreutz, J. Oral drug delivery in personalized medicine: Unmet needs and novel approaches. Int. J. Pharm. 2011, 404, 1–9. [Google Scholar] [CrossRef]
- Sandler, N.; Preis, M. Printed Drug-Delivery Systems for Improved Patient Treatment. Trends Pharmacol. Sci. 2016, 37, 1070–1080. [Google Scholar] [CrossRef]
- Goyanes, A.; Buanz, A.B.M.; Hatton, G.B.; Gaisford, S.; Basit, A.W. 3D printing of modified-release aminosalicylate (4-ASA and 5-ASA) tablets. Eur. J. Pharm. Biopharm. 2015, 89, 157–162. [Google Scholar] [CrossRef]
- Öblom, H.; Zhang, J.; Pimparade, M.; Speer, I.; Preis, M.; Repka, M.; Sandler, N. 3D-Printed Isoniazid Tablets for the Treatment and Prevention of Tuberculosis—Personalized Dosing and Drug Release. AAPS PharmSciTech 2019, 20, 52. [Google Scholar] [CrossRef] [Green Version]
- Goyanes, A.; Robles Martinez, P.; Buanz, A.; Basit, A.W.; Gaisford, S. Effect of geometry on drug release from 3D printed tablets. Int. J. Pharm. 2015, 494, 657–663. [Google Scholar] [CrossRef]
- Yu, D.-G.; Branford-White, C.; Ma, Z.H.; Zhu, L.M.; Li, X.Y.; Yang, X.L. Novel drug delivery devices for providing linear release profiles fabricated by 3DP. Int. J. Pharm. 2009, 370, 160–166. [Google Scholar] [CrossRef]
- Yu, D.-G.; Branford-White, C.; Yang, Y.-C.; Zhu, L.-M.; Welbeck, E.W.; Yang, X.-L. A novel fast disintegrating tablet fabricated by three-dimensional printing. Drug Dev. Ind. Pharm. 2009, 35, 1530–1536. [Google Scholar] [CrossRef]
- Khaled, S.A.; Burley, J.C.; Alexander, M.R.; Yang, J.; Roberts, C.J. 3D printing of five-in-one dose combination polypill with defined immediate and sustained release profiles. J. Control. Release 2015, 217, 308–314. [Google Scholar] [CrossRef] [PubMed]
- Khaled, S.A.; Burley, J.C.; Alexander, M.R.; Roberts, C.J. Desktop 3D printing of controlled release pharmaceutical bilayer tablets. Int. J. Pharm. 2014, 461, 105–111. [Google Scholar] [CrossRef] [PubMed]
- Öblom, H.; Sjöholm, E.; Rautamo, M.; Sandler, N. Towards printed pediatric medicines in hospital pharmacies: Comparison of 2d and 3d-printed orodispersiblewarfarin films with conventional oral powders in unit dose sachets. Pharmaceutics 2019, 11, 334. [Google Scholar] [CrossRef] [PubMed] [Green Version]
- Sjöholm, E.; Sandler, N. Additive manufacturing of personalized orodispersible warfarin films. Int. J. Pharm. 2019, 564, 117–123. [Google Scholar] [CrossRef]
- Vithani, K.; Goyanes, A.; Jannin, V.; Basit, A.W.; Gaisford, S.; Boyd, B.J. A Proof of Concept for 3D Printing of Solid Lipid-Based Formulations of Poorly Water-Soluble Drugs to Control Formulation Dispersion Kinetics. Pharm. Res. 2019, 36, 102. [Google Scholar] [CrossRef]
- Seoane-Viaño, I.; Ong, J.J.; Luzardo-Álvarez, A.; González-Barcia, M.; Basit, A.W.; Otero-Espinar, F.J.; Goyanes, A. 3D printed tacrolimus suppositories for the treatment of ulcerative colitis. Asian J. Pharm. Sci. 2020. [Google Scholar] [CrossRef]
- Gyles, C. 3D printing comes to veterinary medicine. Can. Vet. J. 2019, 60, 1033–1034. [Google Scholar]
- Meléndez, P.A.; Kane, K.M.; Ashvar, C.S.; Albrecht, M.; Smith, P.A. Thermal inkjet application in the preparation of oral dosage forms: Dispensing of prednisolone solutions and polymorphic characterization by solid-state spectroscopic techniques. J. Pharm. Sci. 2008, 97, 2619–2636. [Google Scholar] [CrossRef]
- Vakili, H.; Wickström, H.; Desai, D.; Preis, M.; Sandler, N. Application of a handheld NIR spectrometer in prediction of drug content in inkjet printed orodispersible formulations containing prednisolone and levothyroxine. Int. J. Pharm. 2017, 524, 414–423. [Google Scholar] [CrossRef]
- Farto-Vaamonde, X.; Auriemma, G.; Aquino, R.P.; Concheiro, A.; Alvarez-Lorenzo, C. Post-manufacture loading of filaments and 3D printed PLA scaffolds with prednisolone and dexamethasone for tissue regeneration applications. Eur. J. Pharm. Biopharm. 2019, 141, 100–110. [Google Scholar] [CrossRef]
- Skowyra, J.; Pietrzak, K.; Alhnan, M.A. Fabrication of extended-release patient-tailored prednisolone tablets via fused deposition modelling (FDM) 3D printing. Eur. J. Pharm. Sci. 2015, 68, 11–17. [Google Scholar] [CrossRef] [PubMed]
- Vithani, K.; Goyanes, A.; Jannin, V.; Basit, A.W.; Gaisford, S.; Boyd, B.J. An Overview of 3D Printing Technologies for Soft Materials and Potential Opportunities for Lipid-based Drug Delivery Systems. Pharm. Res. 2019, 36. [Google Scholar] [CrossRef] [PubMed] [Green Version]
- Handbook of Pharmaceutical Excipients, 6th ed.; Rowe, R.C.; Sheskey, P.J.; Quinn, M.E. (Eds.) Pharmaceutical Press: London, UK, 2009. [Google Scholar]
- European Pharmacopoeia Commission. 2.9.6. Uniformity of content of single-dose preparations. In European Pharmacopoeia; European Directorate for the Quality of Medicines (EDQM): Strasbourg, France, 2020; p. 336. [Google Scholar]
- European Pharmacopoeia Commission. 2.9.40. Uniformity of dosage units. In European Pharmacopoeia; European Directorate for the Quality of Medicines (EDQM): Strasbourg, France, 2020; pp. 398–400. [Google Scholar]
- Preis, M.; Woertz, C.; Kleinebudde, P.; Org Breitkreutz, J. Oromucosal film preparations: Classification and characterization methods. Expert Opin. Drug Deliv. 2013, 10, 1303–1307. [Google Scholar] [CrossRef] [PubMed]
- Visser, J.C.; Woerdenbag, H.J.; Crediet, S.; Gerrits, E.; Lesschen, M.A.; Hinrichs, W.L.J.; Breitkreutz, J.; Frijlink, H.W. Orodispersible films in individualized pharmacotherapy: The development of a formulation for pharmacy preparations. Int. J. Pharm. 2015, 478, 155–163. [Google Scholar] [CrossRef]
- Lir, I.; Haber, M.; Dodiuk-Kenig, H. Skin surface model material as a substrate for adhesion-to-skin testing. J. Adhes. Sci. Technol. 2007, 21, 1497–1512. [Google Scholar] [CrossRef]
- Tejada, G.; Barrera, M.G.; Piccirilli, G.N.; Sortino, M.; Frattini, A.; Salomón, C.J.; Lamas, M.C.; Leonardi, D. Development and Evaluation of Buccal Films Based on Chitosan for the Potential Treatment of Oral Candidiasis. AAPS PharmSciTech 2017, 18, 936–946. [Google Scholar] [CrossRef]
- Steiner, D.; Finke, J.H.; Kwade, A. Efficient production of nanoparticle-loaded orodispersible films by process integration in a stirred media mill. Int. J. Pharm. 2016, 511, 804–813. [Google Scholar] [CrossRef]
- European Pharmacopoeia Commission. 2.9.3. Dissolution test for solid dosage forms. In European Pharmacopoeia; European Directorate for the Quality of Medicines (EDQM): Strasbourg, France, 2020; pp. 326–333. [Google Scholar]
- Basak, S.C.; Kumar, K.S.; Ramalingam, M. Design and release characteristics of sustained release tablet containing metformin HCl. Rev. Bras. Ciencias Farm. J. Pharm. Sci. 2008, 44, 477–483. [Google Scholar] [CrossRef]
- Keshawy, M.; El-Moghny, T.A.; Abdul-Raheim, A.R.M.; Kabel, K.I.; El-Hamouly, S.H. Synthesis and characterization of oil sorbent based on Hydroxypropyl Cellulose Acrylate. Egypt. J. Pet. 2013, 22, 539–548. [Google Scholar] [CrossRef] [Green Version]
- Zema, L.; Melocchi, A.; Maroni, A.; Gazzaniga, A. Three-Dimensional Printing of Medicinal Products and the Challenge of Personalized Therapy. J. Pharm. Sci. 2017, 106, 1697–1705. [Google Scholar] [CrossRef] [Green Version]
- Szakonyi, G.; Zelkó, R. The effect of water on the solid state characteristics of pharmaceutical excipients: Molecular mechanisms, measurement techniques, and quality aspects of final dosage form. Int. J. Pharm. Investig. 2012, 2, 18–25. [Google Scholar] [CrossRef] [PubMed] [Green Version]
- Koland, M.; Charyulu, R.N.; Prabhu, P. Mucoadhesive films of losartan potassium for buccal delivery: Design and characterization. Indian J. Pharm. Educ. Res. 2010, 44, 315–323. [Google Scholar]
- European Pharmacopoeia Commission. Dosage forms. In European Pharmacopoeia; European Directorate for the Quality of Medicines (EDQM): Strasbourg, France, 2020; pp. 903–943. [Google Scholar]
- Elmeshad, A.N.; El Hagrasy, A.S. Characterization and optimization of orodispersible mosapride film formulations. AAPS PharmSciTech 2011, 12, 1384–1392. [Google Scholar] [CrossRef] [PubMed] [Green Version]
- Foo, W.C.; Khong, Y.M.; Gokhale, R.; Chan, S.Y. A novel unit-dose approach for the pharmaceutical compounding of an orodispersible film. Int. J. Pharm. 2018, 539, 165–174. [Google Scholar] [CrossRef] [PubMed]
- Nair, A.B.; Kumria, R.; Harsha, S.; Attimarad, M.; Al-Dhubiab, B.E.; Alhaider, I.A. In vitro techniques to evaluate buccal films. J. Control. Release 2013, 166, 10–21. [Google Scholar] [CrossRef]
- Pechová, V.; Gajdziok, J.; Muselík, J.; Vetchý, D. Development of Orodispersible Films Containing Benzydamine Hydrochloride Using a Modified Solvent Casting Method. AAPS PharmSciTech 2018, 19, 2509–2518. [Google Scholar] [CrossRef]
- Woertz, C.; Preis, M.; Breitkreutz, J.; Kleinebudde, P. Assessment of test methods evaluating mucoadhesive polymers and dosage forms: An overview. Eur. J. Pharm. Biopharm. 2013, 85, 843–853. [Google Scholar] [CrossRef]
- Thabet, Y.; Lunter, D.; Breitkreutz, J. Continuous manufacturing and analytical characterization of fixed-dose, multilayer orodispersible films. Eur. J. Pharm. Sci. 2018, 117, 236–244. [Google Scholar] [CrossRef]
- Klančar, U.; Baumgartner, S.; Legen, I.; Smrdel, P.; Kampuš, N.J.; Krajcar, D.; Markun, B.; Kočevar, K. Determining the Polymer Threshold Amount for Achieving Robust Drug Release from HPMC and HPC Matrix Tablets Containing a High-Dose BCS Class I Model Drug: In Vitro and In Vivo Studies. AAPS PharmSciTech 2015, 16, 398–406. [Google Scholar] [CrossRef] [Green Version]
- Palanisamy, M.; Khanam, J. Solid dispersion of prednisolone: Solid state characterization and improvement of dissolution profile. Drug Dev. Ind. Pharm. 2011, 37, 373–386. [Google Scholar] [CrossRef]
- Nguyen, M.N.U.; Van Vo, T.; Tran, P.H.L.; Tran, T.T.D. Zein-based solid dispersion for potential application in targeted delivery. J. Pharm. Investig. 2017, 47, 357–364. [Google Scholar] [CrossRef]
- Reddy, K.S.; Prabhakar, M.N.; Rao, K.M.; Suhasini, D.M.; Subha, M.C.S.; Rao, K.C. Development and Characterization of Hydroxy Propyl Cellulose/Poly(vinyl alcohol) Blends and Their Physico-Chemical Studies. Indian J. Adv. Chem. Sci. 2013, 2, 38–45. [Google Scholar]
- Eguchi, N.; Kawabata, K.; Goto, H. Electrochemical Polymerization of 4,4-Dimethyl-2,2’-Bithiophene in Concentrated Polymer Liquid Crystal Solution. J. Mater. Sci. Chem. Eng. 2017, 5, 64–70. [Google Scholar] [CrossRef] [Green Version]
- da Silva Peixoto, T.; Yamashita, F.; Bilck, A.P.; Carvalho, G.M.; Grossmann, M.V.E. Crosslinking starch/oat hull mixtures for use in composites with PLA. Polimeros 2019, 29, 1–8. [Google Scholar] [CrossRef] [Green Version]
- Rials, T.G.; Glasser, W.G. Thermal and dynamic mechanical properties of hydroxypropyl cellulose films. J. Appl. Polym. Sci. 1988, 36, 749–758. [Google Scholar] [CrossRef]
- Veiga, M.D.; Cadorniga, R.; Lozana, R. Thermal Study of Prednisolone Polymorphs. Thermochim. Acta 1985, 96, 111–115. [Google Scholar] [CrossRef]


| Year | Tests Performed | Unsatisfactory Percentage (%) | Potency Range (%) |
|---|---|---|---|
| 2019 | 55 | 36.4 | 53.7–193.9 |
| 2018 | 72 | 23.6 | 64.4–175.3 |
| 2017 | 80 | 27.5 | 66.0–235.2 |
| 2016 | 83 | 22.9 | 37.6–155.8 |
| 2015 | 58 | 22.4 | 13.4–258.0 |
| 2014 | 70 | 18.6 | 64.6–156.7 |
| 2013 | 56 | 12.5 | 3.3–226.6 |
| 2012 | 63 | 11.1 | 3.3–226.6 |
| 2011 | 158 | 17.1 | 8.3–196.1 |
| 2010 | 225 | 15.1 | 28.0–197.2 |
| 2009 | 242 | 11.6 | 0.0–145.2 |
| 2008 | 186 | 24.7 | 21.3–373.7 |
| 2007 | 213 | 23.9 | 21.2–450.4 |
| 2006 | 274 | 25.2 | 0.0–259.0 |
| Solution | PRE (%) | LP (%) | HPC (%) | Solvent |
|---|---|---|---|---|
| UL solution | - | - | 25 | 1:1 MQ:EtOH (v/v) |
| DL solution | 1 | - | 25 | 1:1 MQ:EtOH (v/v) |
| UL solution with LP | - | 1 | 24 | 1:1 MQ:EtOH (v/v) |
| DL solution with LP | 1 | 1 | 24 | 1:1 MQ:EtOH (v/v) |
| 2% DL solution | 2 | - | 25 | 1:1 MQ:EtOH (v/v) |
| UL nonprintable solution | - | 1 | 25 | 1:1 MQ:EtOH (v/v) |
| DL nonprintable solution | 1 | 1 | 25 | 1:1 MQ:EtOH (v/v) |
| Sample | Weight (mg) | Thickness (mm) | Drug Amount (mg) | Max Dev (%) | AV |
|---|---|---|---|---|---|
| Bocusini batch 1.1 | 60.8 ± 11.4 | 0.23 ± 0.04 | 5.3 ± 0.8 | −34.8b ** | 44.7d |
| Bocusini batch 1.2 | 66.4 ± 9.7 | 0.24 ± 0.03 | 5.8 ± 0.6 | −21.4a * | 43.8d |
| Bocusini batch 2.1 | 68.2 ± 8.6 | 0.24 ± 0.03 | 6.0 ± 0.7 | −19.4a * | 52.6d |
| Bocusini batch 2.2 | 69.8 ± 9.1 | 0.25 ± 0.02 | 6.0 ± 0.9 | −26.5b * | 63.4d |
| Bocusini batch 3.1 | 87.7 ± 5.3 | 0.30 ± 0.01 | 7.4 ± 0.4 | 33.0b *** | 65.2d |
| Bocusini batch 3.2 | 71.9 ± 9.1 | 0.26 ± 0.02 | 6.3 ± 0.7 | 15.5e ** | 55.8d |
| Bocusini batch 1 AVG | 63.6 ± 10.5 | 0.23 ± 0.03 | 5.5 ± 0.7 | −34.8b *** | 44.8d |
| Bocusini batch 2 AVG | 69.0 ± 8.5 | 0.25 ± 0.02 | 6.0 ± 0.8 | −26.5b ** | 56.4d |
| Bocusini batch 3 AVG | 79.8 ± 10.9 | 0.28 ± 0.03 | 6.8 ± 0.8 | 33.0b *** | 72.2d |
| Bocusini AVG | 70.8 ± 11.9 | 0.26 ± 0.04 | 6.1 ± 0.9 | −34.8b *** | 65.0d |
| Biobot batch 1.1 | 65.1 ± 0.1 | 0.25 ± 0.01 | 4.9 ± 0.1 | 6.6a | 4.6c |
| Biobot batch 1.2 | 65.1 ± 0.3 | 0.26 ± 0.01 | 4.8 ± 0.1 | 3.1a | 6.2c |
| Biobot batch 2.1 | 63.4 ± 0.2 | 0.24 ± 0.01 | 4.7 ± 0.1 | 2.4a | 6.6c |
| Biobot batch 2.2 | 60.9 ± 1.2 | 0.24 ± 0.01 | 4.4 ± 0.1 | −8.4a | 13.9c |
| Biobot batch 3.1 | 63.3 ± 0.1 | 0.25 ± 0.01 | 4.7 ± 0.1 | 2.0a | 8.4c |
| Biobot batch 3.2 | 63.1 ± 0.2 | 0.23 ± 0.01 | 4.6 ± 0.1 | −5.5a | 12.2c |
| Biobot batch 1 AVG | 65.1 ± 0.2 | 0.25 ± 0.01 | 4.8 ± 0.1 | 6.6a | 6.5c |
| Biobot batch 2 AVG | 62.2 ± 1.6 | 0.24 ± 0.01 | 4.6 ± 0.2 | −8.4a | 15.0c |
| Biobot batch 3 AVG | 63.2 ± 0.2 | 0.24 ± 0.01 | 4.6 ± 0.1 | −5.5a | 11.2c |
| Biobot AVG | 63.5 ± 1.5 | 0.24 ± 0.01 | 4.7 ± 0.2 | −8.4a | 12.6c |
| Zmorph batch 1.1 | 63.4 ± 5.2 | 0.23 ± 0.01 | 4.7 ± 0.5 | −23.2b *** | 28.7d |
| Zmorph batch 1.2 | 74.9 ± 2.5 | 0.28 ± 0.02 | 5.4 ± 0.1 | 4.9a | 13.9c |
| Zmorph batch 2.1 | 65.6 ± 1.5 | 0.25 ± 0.01 | 4.8 ± 0.2 | −15.1a * | 9.3c |
| Zmorph batch 2.2 | 67.8 ± 4.0 | 0.25 ± 0.01 | 5.1 ± 0.3 | −15.9a * | 14.8c |
| Zmorph batch 3.1 | 86.8 ± 5.9 | 0.33 ± 0.07 | 6.5 ± 0.4 | 30.1b *** | 47.2d |
| Zmorph batch 3.2 | 75.7 ± 6.4 | 0.30 ± 0.03 | 5.6 ± 0.4 | 15.1b * | 31.9d |
| Zmorph batch 1 AVG | 69.2 ± 7.2 | 0.25 ± 0.03 | 5.0 ± 0.5 | −23.2b *** | 25.7d |
| Zmorph batch 2 AVG | 66.7 ± 3.1 | 0.25 ± 0.01 | 4.9 ± 0.2 | −15.9e ** | 12.2c |
| Zmorph batch 3 AVG | 81.3 ± 8.2 | 0.31 ± 0.05 | 6.0 ± 0.6 | 30.1b *** | 48.8d |
| Zmorph AVG | 72.4 ± 9.1 | 0.27 ± 0.04 | 5.4 ± 0.7 | 30.1b *** | 38.7d |
| Film Size (mm) | Weight (mg) | Thickness (mm) | Drug Amount (mg) |
|---|---|---|---|
| 10 × 15 × 1 | 79.1 ± 1.3 | 0.32 ± 0.01 | 2.7 ± 0.1 |
| 15 × 15 × 1 | 98.6 ± 1.0 | 0.30 ± 0.01 | 4.1 ± 0.1 |
| 20 × 15 × 1 | 122.1 ± 0.6 | 0.27 ± 0.01 | 5.4 ± 0.1 |
| 25 × 15 × 1 | 147.6 ± 3.4 | 0.27 ± 0.02 | 6.3 ± 0.1 |
| 30 × 15 × 1 | 173.2 ± 2.3 | 0.27 ± 0.02 | 7.3 ± 0.1 |
| Mechanical Test | UL Film | DL Film | UL Film with LP | DL Film with LP |
|---|---|---|---|---|
| Puncture test | ||||
| Burst strength (N) | 42.4 ± 1.0 | 35.3 ± 0.7 | 29.1 ± 0.8 | 26.0 ± 1.2 |
| Distance at burst (mm) | 3.6 ± 0.2 | 3.6 ± 0.2 | 3.1 ± 0.1 | 3.2 ± 0.1 |
| Tensile test | ||||
| Maximum tensile force (N) | 33.9 ± 1.7 | 28.8 ± 1.4 | 28.0 ± 0.4 | 21.8 ± 0.4 |
| Elongation of break (mm) | 15.6 ± 4.2 | 14.1 ± 2.8 | 12.1 ± 1.7 | 10.3 ± 1.1 |
| Percentage of extension (%) | 19.5 ± 5.3 | 17.6 ± 3.5 | 15.1 ± 2.2 | 12.9 ± 1.4 |
| Folding endurance | ||||
| No. of folds until cracked | 27 ± 2.6 | 40 ± 0.0 | 6 ± 0.0 | 0 ± 0.0 |
| No. of folds until broken | 31.7 ± 2.9 | 46.0 ± 1.0 | 8.0 ± 0.0 | 8.0 ± 1.0 |
| Sample | Adhesiveness (N) | Work of Adhesion (N.s) | Travel (mm) |
|---|---|---|---|
| UL film | 0.15 ± 0.02 | 1.26 ± 0.31 | 1.96 ± 0.35 |
| DL film | 0.12 ± 0.01 | 0.89 ± 0.12 | 1.65 ± 0.57 |
| UL film with LP | 0.14 ± 0.03 | 1.07 ± 0.17 | 1.72 ± 0.24 |
| DL film with LP | 0.21 ± 0.06 | 1.54 ± 0.71 | 1.62 ± 0.53 |
| Formulation | Zero Order 1 R2 | First Order 2 R2 | Higuchi 3 R2 | Hixson 4 R2 | Kors–Peppas 5 R2 | N |
|---|---|---|---|---|---|---|
| DL film in water | 0.9563 | 0.9958 | 0.9975 | 0.9939 | 0.9961 | 0.595 |
| DL film with LP in water | 0.9857 | 0.9544 | 0.9658 | 0.978 | 0.9852 | 0.580 |
| DL film in buffer | 0.9105 | 0.9873 | 0.9951 | 0.9687 | 0.995 | 0.518 |
| DL film with LP in buffer | 0.9072 | 0.9855 | 0.9917 | 0.9659 | 0.9928 | 0.588 |
Publisher’s Note: MDPI stays neutral with regard to jurisdictional claims in published maps and institutional affiliations. |
© 2020 by the authors. Licensee MDPI, Basel, Switzerland. This article is an open access article distributed under the terms and conditions of the Creative Commons Attribution (CC BY) license (http://creativecommons.org/licenses/by/4.0/).
Share and Cite
Sjöholm, E.; Mathiyalagan, R.; Rajan Prakash, D.; Lindfors, L.; Wang, Q.; Wang, X.; Ojala, S.; Sandler, N. 3D-Printed Veterinary Dosage Forms—A Comparative Study of Three Semi-Solid Extrusion 3D Printers. Pharmaceutics 2020, 12, 1239. https://doi.org/10.3390/pharmaceutics12121239
Sjöholm E, Mathiyalagan R, Rajan Prakash D, Lindfors L, Wang Q, Wang X, Ojala S, Sandler N. 3D-Printed Veterinary Dosage Forms—A Comparative Study of Three Semi-Solid Extrusion 3D Printers. Pharmaceutics. 2020; 12(12):1239. https://doi.org/10.3390/pharmaceutics12121239
Chicago/Turabian StyleSjöholm, Erica, Rathna Mathiyalagan, Dhayakumar Rajan Prakash, Lisa Lindfors, Qingbo Wang, Xiaoju Wang, Samuli Ojala, and Niklas Sandler. 2020. "3D-Printed Veterinary Dosage Forms—A Comparative Study of Three Semi-Solid Extrusion 3D Printers" Pharmaceutics 12, no. 12: 1239. https://doi.org/10.3390/pharmaceutics12121239
APA StyleSjöholm, E., Mathiyalagan, R., Rajan Prakash, D., Lindfors, L., Wang, Q., Wang, X., Ojala, S., & Sandler, N. (2020). 3D-Printed Veterinary Dosage Forms—A Comparative Study of Three Semi-Solid Extrusion 3D Printers. Pharmaceutics, 12(12), 1239. https://doi.org/10.3390/pharmaceutics12121239