1. Introduction
Despite the recent innovations in drug delivery, oral administration remains the major route of drug administration. Understanding the drug absorption and metabolism in the intestine is thus essential for drug development. To date, several in vitro or ex vivo models are available for the evaluation of drug absorption and metabolism in human intestine. The Caco-2 cell culture model, e.g., is considered the gold standard in vitro model for studies of drug absorption, although there are limitations of this model with regards to drug metabolism [
1,
2]. Although a number of drug metabolizing enzymes (DME) have been identified in Caco-2 cells, including UDP glucuronosyltransferases (UGT) [
3] and carboxylesterases (CES) [
4], cytochrome P450 3A4 (CYP3A4), the major drug metabolizing enzyme in human intestine and liver is missing in Caco-2 cells [
5]. Alternatively, sections of human intestinal tissue or mucosal biopsy mounted in Ussing chamber can be used to study drug absorption and metabolism in human intestine [
6]. The advantage of this method is the combined measurement of permeability/active transport and metabolism. However, throughput, cost and availability of human tissues limit the routine use of this model. In order to integrate CYP3A4 activities into Caco-2 model, Takenaka et al. co-expressed recombinant human CYP3A4 and NADPH-CYP P450 reductase in Caco-2 cells [
7]. Although a good correlation between extraction ratios observed in vitro and the gastro-intestinal (GI) extraction ratios in human could be observed for a number of reference compounds, the in vitro model tend to underestimate the GI extraction, indicating a rather low CYP3A4 activity in the model. Since CYP3A4 activities are readily detected in microsomes prepared from liver or intestine, Gertz et al. used another approach to improve the predictivity of firstpass extraction in human by combining the metabolic clearance of CYP3A4 compounds measured in human intestinal microsomes and the permeability data from Caco-2 or MDCK-MDR1 assay [
8]. A clear disadvantage of this approach is that two separate in vitro measurements are needed. In recent years, new in vitro models for human intestine like microfluidic tissue-on-chip [
9] or organoids [
10] are emerging. These models have been shown as useful models for testing compound toxicity in GI tract or as disease models [
9,
10]. As an ADME model for human gut, however, a tissue model on a Transwell basis would be more favorable because the equipment for Caco-2 permeability assay could be easily adapted to the new model and would enable the measurement of transcellular permeability and transport in the new model. Two such models have been published recently with basic characterization regarding drug transporters and DMEs: The EpiIntestinal microtissues provided by MatTek [
11] and the 3D bioprinted human intestinal tissues provided by Organovo [
12]. Due to the earlier availability and easier accessibility we decided to evaluate the EpiIntestinal model as an ADME tool in more detail. The aim of the present study is the in-depth characterization of the EpiIntestinal microtissues as a model for the investigation of activities of drug transporters and DME and for the prediction of GI firstpass availability in human.
2. Materials and Methods
2.1. Material
All marketed drugs used in this manuscript and the metabolites and the deuterated standards thereof are purchased from commercial providers (Sigma, LKT laboratories, Roche, BD Gentest, Toronto Research, Cerilliant or Syncom). Dabigatran etexilate and its metabolites BIBR 951, BIBR 953, BIBR 1087 and internal research compounds of Boehringer Ingelheim are provided by the internal compound management.
2.2. Cell Culture
Caco-2 cells were obtained from Leibniz Institute DSMZ-German Collection of Microorganisms and Cell Cultures (Braunschweig, Germany) and cultured in DMEM containing 10% FCS, 1% NEAA, 2 mM Glutamin, 100 U/mL Penicillin and 100 µg/mL Streptomycin. Caco-2 cells were seeded either onto 24-well Transwell inserts (Corning, #3379) for bidirectional permeability assays or onto 96-well Transwell inserts (Corning #3391) for the screening of DME activities at a density of 160,000 cells/cm2 and cultured for 3 weeks, with media change on every second day. EpiIntestinal microtissues were obtained from MatTek (Bratislav, Slovakia) and cultured according to the manufacturer’s instruction (24-well format for bidirectional permeability assays and GI firstpass availability assays and 96-well format for screening of DME activities).
2.3. Bidirectional Permeability Assay
Bidirectional permeability assays were performed as described previously [
13,
14]. Briefly, compounds were diluted in transport buffer (128.13 mM NaCl, 5.36 mM KCl, 1 mM MgSO
4, 1.8 mM CaCl
2, 4.17 mM NaHCO
3, 1.19 mM Na
2HPO
4, 0.41 mM NaH
2PO
4, 15 mM 2-[4-(2-hydroxyethyl)piperazin-1-yl]ethanesulfonic acid (HEPES), 20 mM glucose, pH 7.4) containing 0.25% bovine serum albumin to a final concentration of 10 µM and added to the apical or basal compartment. In indicated experiments, inhibitors were added to both compartments. Cells were incubated with the compounds for up to 2 h. Samples from the opposite compartment were taken at different timepoints. Compound concentrations in the samples were determined by HPLC-MS/MS (standard equipment: HPLC series 1000 or higher from Agilent, Santa Clara, CA, USA, and mass spectrometers API 4000 or higher from AB Sciex, Toronto, ON, Canada). Prior to bioanalysis samples were spiked with internal standard solution and diluted with acetonitrile (ACN) for protein precipitation. Measurement was operated in multiple reaction monitoring (MRM) mode. Quantification was performed using external calibration. Apparent permeability coefficients in the apical to basal direction (
Papp,AB) and in the basal to apical direction (
Papp,BA) and efflux were calculated as follows
where
Q is the amount of compound recovered in the receiver compartment after the incubation time
t,
C0 the initial compound concentration given to the donor compartment, and s the surface area of the Transwell inserts. Efflux ratio is calculated as the quotient of
Papp,BA to
Papp,AB. As quality controls, one reference P-gp substrate (apafant) and one low permeable compound (BI internal reference,
Papp ≈ 3 × 10
−7 cm/s, no efflux) is included in every assay plate. In addition, Transepithelial electrical resistance (TEER) values are measured for each plate before the permeability assay and total recovery in donor and receiver compartments was determined for each compound. All these parameters (efflux of apafant,
Papp values of the low permeable compound, TEER values, and total recovery) are used to ensure the quality of the assays.
2.4. Measurement of DME Activities in EpiIntestinal and Caco-2
For measurements of DME activities in EpiIntestinal microtissues and Caco-2 cells, both were cultured in 96-well Transwell inserts. Drugs (
Table 1) were dissolved in the respective solvent at 200x concentration and diluted in a pre-warmed transport buffer. Diluted substrate solution was applied to the apical (100 µL) and basal (250 µL) compartment of the Transwell and incubated at 37 °C and 5% CO
2 and 60 rpm continuous shaking. DME activities were determined by monitoring metabolite formation in basal compartment over time (0, 0.5, 1, 2, 3 and 4 h) with LC-MS/MS. For LC-MS/MS, an HTS-xt PAL autosampler (CTC Analytics), LC 1290 infinity G4220A (Agilent Technologies), column oven (Agilent Technologies) and 6500 TripleQuad (AB Sciex) were used. Chromatographic separation of samples was performed on YMC Triart C18 (1.9 µm, 30 × 2 mm; YMC Europe, Dinslaken, Germany) LC analytical column. Quantification of all metabolites listed in
Table 1 was achieved by the use of calibration curves for the individual metabolites with appropriate concentration ranges.
A total of 10 µL of the incubation sample were diluted with 90 µL of water containing 10–20% ACN or methanol, 0.1% formic acid and the respective internal standard. To analyze the intracellular metabolite concentration, cells on Transwell inserts were washed twice with ice-cold PBS and stored at −80 °C for 20 min. Afterwards, 150 µL 50% ACN diluted with transport buffer was added to the cells and incubated at room temperature for 30 min. Cell lysate was transferred to a fresh 96-well plate and centrifuged at 4 °C, 4000 rpm for 10 min. Subsequently, 10 µL of the supernatant were diluted with 90 µl water containing 10–20% ACN or methanol, 0.1% formic acid and the respective internal standard. A total of 2 µL sample was injected into the LC-MS/MS system operated with an electrospray ionization source.
2.5. CES-Mediated Metabolism of Dabigatran Etexilate
CES-mediated metabolism of dabigatran etexilate was measured in cryopreserved human hepatocytes (BioIVT, West Sussex, UK) and cryopreserved human intestinal mucosa (in vitro ADMET laboratories, Columbia, MD, USA) in suspension and in Caco-2 cells and EpiIntestinal microtissues grown on Transwell inserts. Dabigatran etexilate was diluted in culture media for the respective cells or tissues. The final concentrations of dabigatran etexilate were selected in an earlier experiment to ensure reasonable turnover of the compound within the incubation time: 2 µM for hepatocytes and intestinal mucosa, 10 µM for Caco-2 and EpiIntestinal microtissues. In the experiments with Transwell inserts, dabigatran etexilate was given to the apical compartments, metabolites were measured in the basal (receiver) compartments. Concentrations of the metabolites were determined by HPLC-MS/MS (
Section 2.3).
2.6. Metabolite Identification
Raloxifene or ezetimibe (10 µM) in culture media was added to the apical compartment of EpiIntestinal microtissues or incubated with cryopreserved human intestinal mucosa (HIM). Samples from basal compartment of EpiIntestinal microtissues or lysates of the incubation mixture with mucosa were prepared for metabolite identification as follows: samples were mixed with the same amount of 0.1% formic acid in ACN and subsequently evaporated and resuspended in water containing 25% methanol and 0.1% formic acid. Analysis was performed on a LC-MS system containing a Vanquish UPLC (ThermoFisher Scientific, San Jose, CA, USA) coupled to an Orbitrap FusionTribrid high resolution mass spectrometer (ThermoFisher Scientific). Structure elucidation was based on exact mass measurements in combination with the interpretation of fragment spectra.
2.7. Measurement of Intestinal First-Pass Availability in EpiIntestinal Microtissues and Caco-2
Compounds were diluted in culture media to a final concentration of 10 µM and added to the apical (donor) compartment (total volume: 100 µL for EpiIntestinal and 200 µL for Caco-2). After the incubation at 37 °C for 2, 4, 6, and 24 h, samples (50 µL) were taken from the basal (receiver) compartment (total volume: 5000 µL for EpiIntestinal and 800 µL for Caco-2). After the last timepoint, samples from the donor compartments and the cell lysates were also collected. Compound concentrations in the samples were determined by HPLC-MS/MS (
Section 2.3).
GI first-pass availability of the tested compounds was expressed as fraction (%) of the total amount of a compound added to the donor compartment recovered in the receiver compartment.
2.8. Calculation of Fa × Fg in Human
The first-pass GI availability (
Fa × Fg) of selected drugs was calculated using the equation:
where
F is the total oral availability,
Fa the fraction absorbed,
Fg the intestinal availability and
Fh the hepatic availability. The hepatic availability
Fg can be estimated with the equation:
where
CLh is the hepatic clearance of a drug and
QH the hepatic blood flow in human (20.7 mL/min/kg). The hepatic clearance
CLh is calculated with the equation:
where
CLb is the blood clearance of a drug and
fe the fraction of renal excretion. Blood
CLb can be converted from plasma clearance
CLp with the blood-to-plasma ratio
RB:
A set of 12 marketed drugs are selected for the evaluation of EpiIntestinal microtissues. The clinical data for the calculation of
Fa ×
Fg are summarized in
Table 2.
4. Discussion
At present, the Caco-2 cell culture model is the most accepted in vitro model in the pharmaceutical industry for the estimation of drug absorption in human intestine. The lack of the major drug metabolizing enzyme CYP3A4, however, hampers the use of this model for the holistic understanding of drug absorption and metabolism during the first-pass GI transition. Recently, Ayehunie et al. described a new organotypic 3D human intestine model, the EpiIntestinal microtissues, with combined barrier/drug transproter functions and DME activities [
11]. In this work, we could confirm the intact barrier function of the EpiIntestinal microtissues with transepithelial electrical resistance (TEER) measurement and with the permeability data of reference drugs and in-house compounds (data not shown). However, our data did not agree with the conclusion by Ayehunie et al. that rosuvastatin is a P-gp substrate. In our opinion, the discordance was mainly due to the different interpretation of the inhibition by Elacridar. Elacridar (GF120918) is a nonselective inhibitor for both BCRP [
31] and P-gp [
32]. At the concentration of 10 µM used by Ayehunie et al., a strong inhibition of both BCRP and P-gp can be expected. Thus, the inhibition of rosuvastatin efflux by Elacridar cannot be unequivocally attributed to P-gp inhibition. In contrast, the inhibitors we were using in this study are selective [
31,
33]. Our in-house evaluation showed that, at the concentrations we were using here (5 µM zosuquidar and 3 µM Ko-143), differential inhibition of P-gp and BCRP can be achieved. As shown in
Table 3, only Ko-143 reduced in Caco-2 and EpiIntestinal rosuvastatin efflux strongly. Involvement of multiple transporters has been reported in the hepatobiliary transport of rosuvastatin, including OATP1B1, OATP1B3, OATP2B1, MRP2 (ABCC2), MDR1 P-gp (ABCB1), and BCRP (ABCG2) [
34]. Except OATP1B1 and OATB1B3, all other transporters are expressed also in human intestine and Caco-2 cells [
35,
36,
37]. In the clinic, however, only BCRP interaction has been related to increased bioavailability of rosuvastatin [
38]. Our results here are in agreement with the clinical observation.
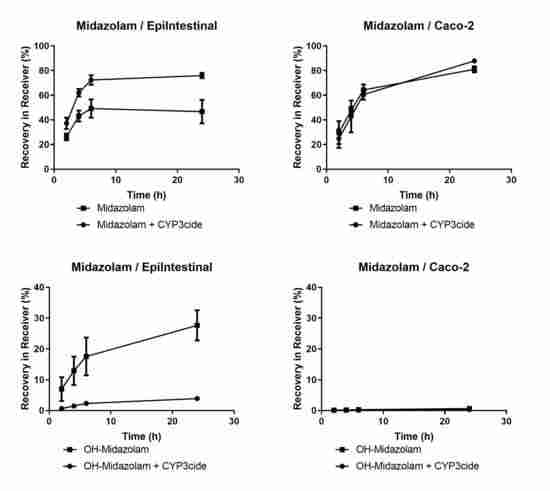
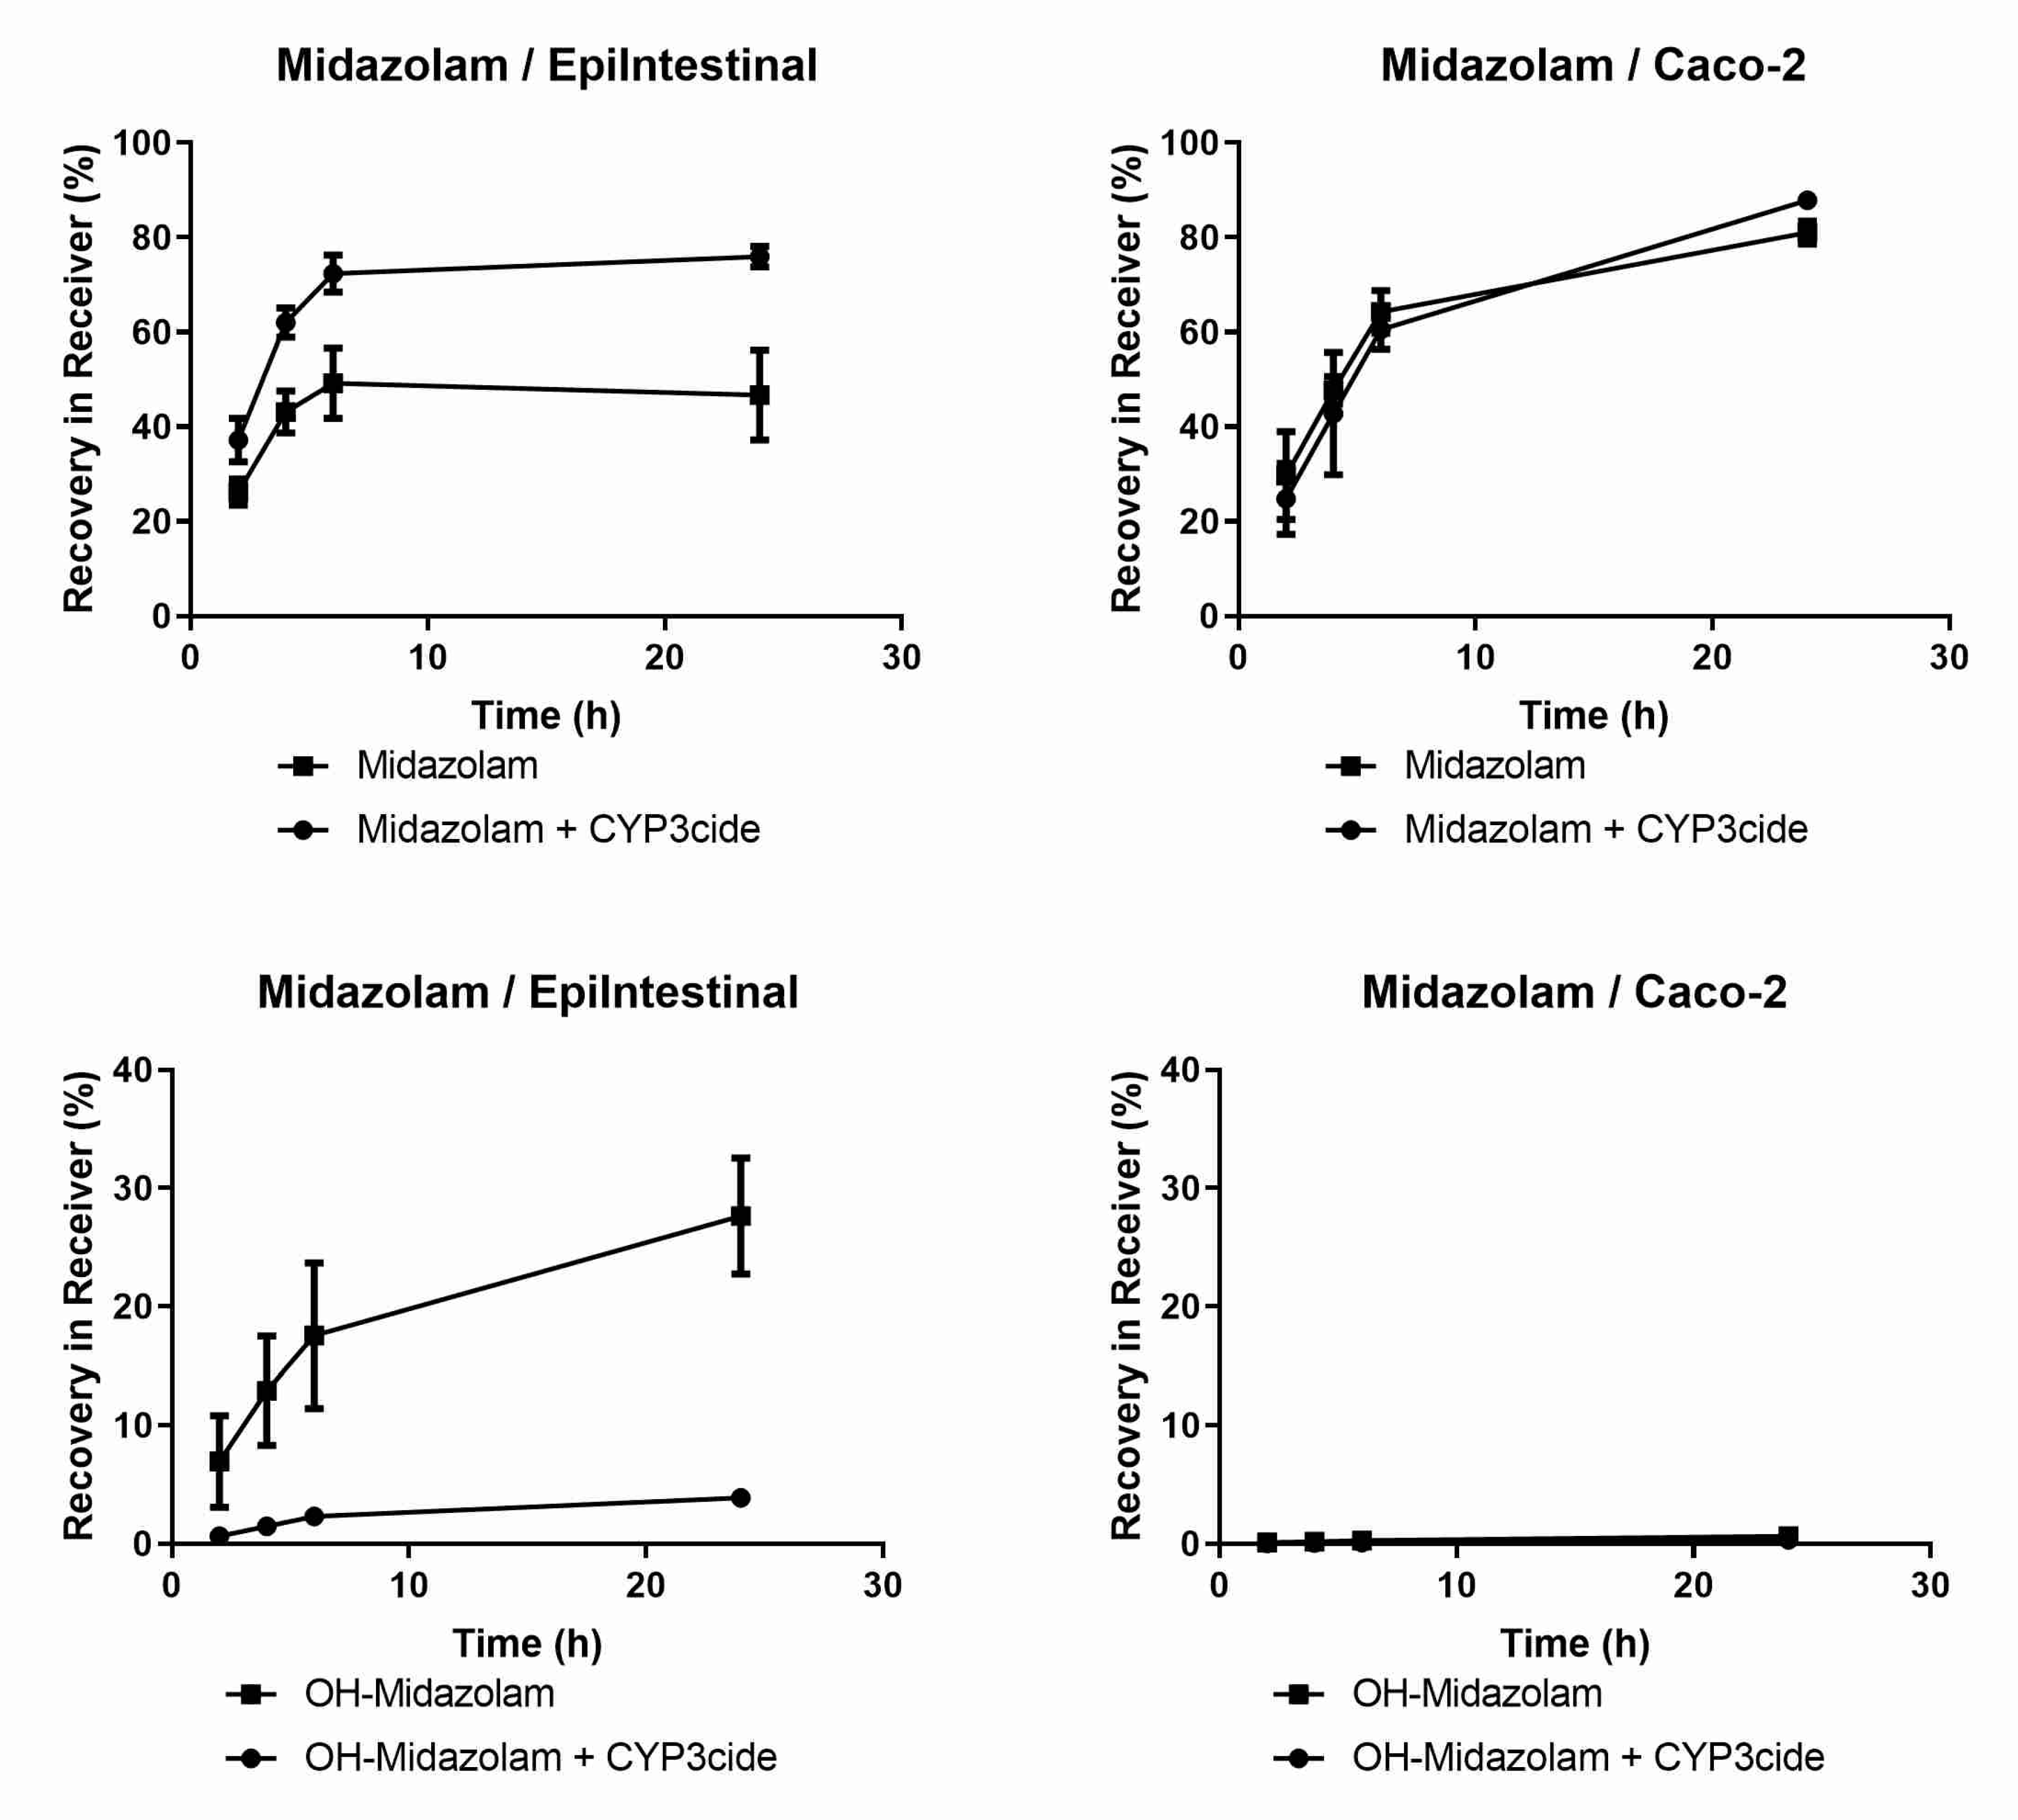
EpiIntestinal microtissues are an improved in vitro model for the intestinal barrier function. A clear advantage of this model over the Caco-2 cellular model is the physiologically relevant activities of CYP3A4 (
Figure 1 and
Table 4), which accounts for about 80% of total CYP content in human small intestine [
39]. We could also detect activities of CYP2B6, CYP2C8, CYP2C9, 2C19, 2D6 and 2J2 in EpiIntestinal microtissues (
Table 4), as reported for human intestine [
39]. CYP1A2 activity, which is very low in human intestine, were detected in both in vitro models, with Caco-2 showing seven-fold higher activity (
Table 4), suggesting that EpiIntestinal microtissues are closer to human intestine. Moreover, enzymes involved in phase 2 biotransformation (UGTs and SULTs) and carboxylesterases are present in EpiIntestinal microtissues at substantial levels (
Table 4 and
Table 5,
Figure 3). It is important to note that we measured the respective metabolites of the tested reference drugs both in supernatant and in cell lysate. With the exception of amodiaquine and astemizole, the intracellular accumulation of metabolites was rather low. Since the intracellular accumulation of all measured metabolites is comparable in Caco-2 cells and in EpiIntestinal microtissues, we do not expect a bias in the relative comparison of enzyme activities between Caco-2 and EpiIntesitnal by measuring the metabolite in supernatant only (as shown in
Table 4). In the case of carboxylesterase activities, we could demonstrate that EpiIntestinal microtissues are closer to human intestinal mucosa compared to Caco-2 cells, which resemble rather hepatocytes regarding relative CES1/CES2 activities. Because of the rather comprehensive expression of DMEs, EpiIntestinal microtissues can serve as a useful tool for the identification of intestine-specific metabolites, as we demonstrated with raloxifene and ezetimibe (
Table 6). One surprising finding was the identification of sulfation of raloxifene not only in EpiIntestinal microtissue, but also in primary human intestinal mucosa. Mono- and diglucuronides were found in human plasma as major metabolites after oral administration; no other metabolites were identified (Prescription information for Evista, Eli Lilly). However, raloxifene was identified as a substrate for various SULTs and the sulfation of raloxifene occurs during incubation with cytosols from human liver and intestine [
40,
41] and in Caco-2 cells [
42]. Moreover, raloxifene is reported to be a potent competitive inhibitor of sulfotransferase 2A1 (SULT2A1) with a K
i value very similar to its K
m value for SULT2A1 [
41,
43]. The sulfation of raloxifene we observed in EpiIntestinal microtissues was in line with the reported in vitro data in the literature and was obviously not due to a biased expression of SULTs in this model. A possible explanation for the missing raloxifene sulfate in human plasma could be a strong first-pass hepatic extraction and the subsequent excretion of the sulfate into bile.
Although cryopreserved primary human enterocytes and human intestinal mucosa are now available for the investigation of intestinal drug metabolism [
44,
45], the advantage of EpiIntestinal microtissues is the presence of both intact barrier function and comprehensive DME activities. The combined barrier function and DME activities in EpiIntestinal microtissues make it possible to evaluate intestinal first-pass availability (
Fa ×
Fg) in humans in a single experiment. Indeed, the in vitro intestinal availability of 12 marketed drugs in EpiIntestinal microtissues (% recovery in receiver compartment) is in good agreement with
Fa ×
Fg calculated from the clinical pharmacokinetic data of these drugs (
Table 6). It is important to note that the in vitro availability in our model was obtained after an incubation time of 24 h, while the drug absorption in human intestine is usually completed after a few hours. The longer incubation time in the in vitro model can be mainly attributed to the higher ratio of drug amounts applied to the microtissues (1 nmol) to the surface area of the microtissues (0.6 cm
2). The human small intestine mucosa, in contrast, has a surface area of 30 m
2 [
46]. The ratio of drug amounts to surface area is much lower. It would be interesting to compare human intestine tissues mounted in Ussing chambers with the EpiIntestinal microstissues in this regard. One would assume that the primary tissues would perform at least similarly to the EpiIntestinal model, and the low availability of suitable human tissues would limit the broader use of the primary materials in drug screening. There is however one caveat for using the EpiIntestinal model in this regard: the data are only meaningful if the quantities of DMEs and drug transporters in the model are comparable to the human intestine. Investigation into the expression of DMEs and drug transporters in EpiIntestinal microtissues is currently ongoing (transcriptomics) or planned (proteomics).
Although the EpiIntestinal microtissues provide a number of advantages compared to the currently available tools like Caco-2 cells, primary human enterocytes, or human intestinal mucosa, there are some limitations with regard to the use of the model in drug screening. One of the limitations is the unknown donor variability. According to the manufacturer, the microtissues we tested to date were derived from one single donor. For various reasons, we have not been able to get access to microtissues derived from other donors from the manufacturer to date. For drugs involving highly polymorphic metabolizing enzymes, data from a single donor are certainly not representative for the patient population. Therefore, it will be very important to investigate this model further in this regard in the future. Another limitation of this model is the static incubation conditions. Under physiological conditions, both the content in the intestine lumen and the blood at the basal side are under constant flow. The blood flow, for example, can reduce the diffusion of the drugs back into the enterocytes and thus limit the “recycling” of the drugs between blood and intestinal mucosa. Under static conditions, however, the recycling of the drugs might lead to an underestimation of the availability of the drugs, especially for those with extensive metabolic clearance in the intestinal mucosa. Due to the strong dilution effect in the apical-to-basal direction (100 vs. 5000 µL media volume in the apical and the basal compartment, respectively) we consider the effect of recycling, even under the static incubation, to be rather low. We tried to mimic the blood flow by replacing a large part of the media in the basal compartment with fresh media at the indicated sampling time points. The results were comparable to the static incubation (data not shown). Nevertheless, the integration of this model into a microfluidic system might still be interesting because this will make the combination with other organ models (e.g., liver-on-chip) possible.
In summary, our data here demonstrate that the EpiIntestinal microtissues are a useful tool for understanding drug absorption and metabolism in human intestine. The easy access of the model makes it very attractive for drug screening in the drug discovery process. It can also be used for the mechanistic understanding of intestinal drug–drug interaction or for the identification of intestine-specific metabolites.


