3.1. UV Measurements
As the primary event of a phototoxic reaction, the substance is excited by the absorption of photon energy, and the photoexcited chemical can then react with other substances through energy transfer and/or radical reactions, possibly leading to phototoxicity [
3,
22]. Therefore, a UV/Vis spectral analysis is recommended by the official guidelines as the first step of photosafety testing in the pharmaceutical industry [
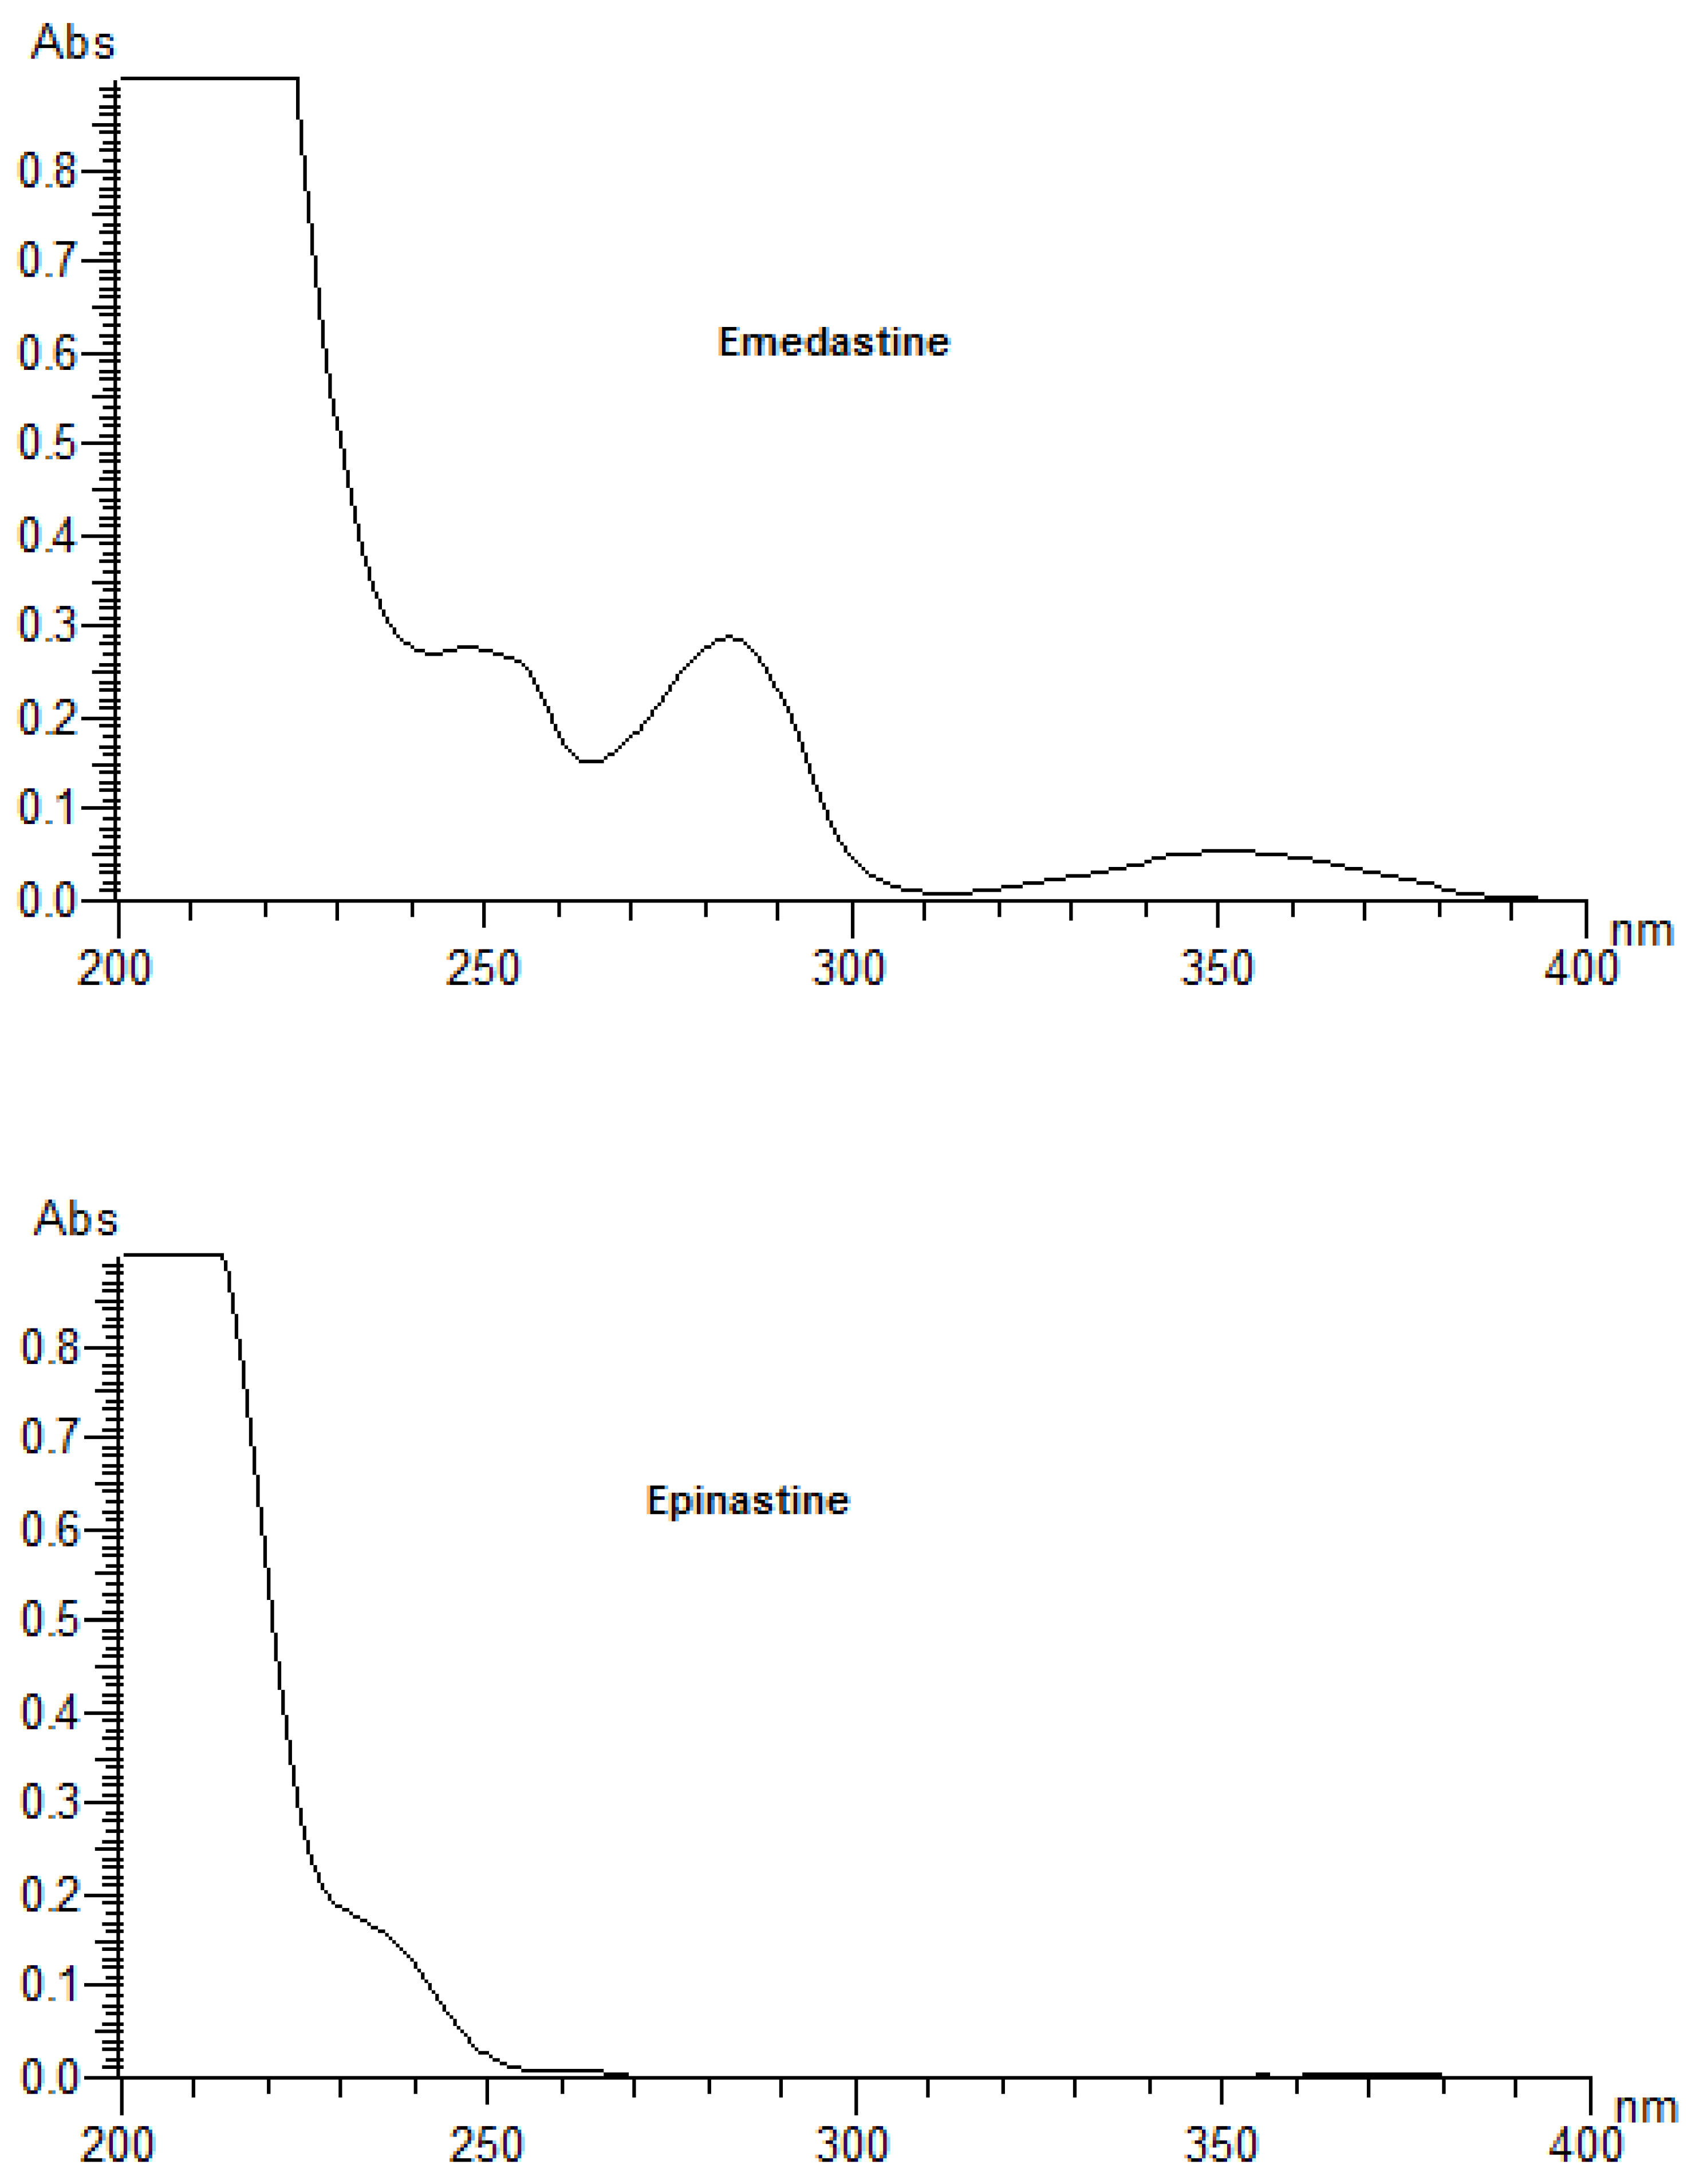
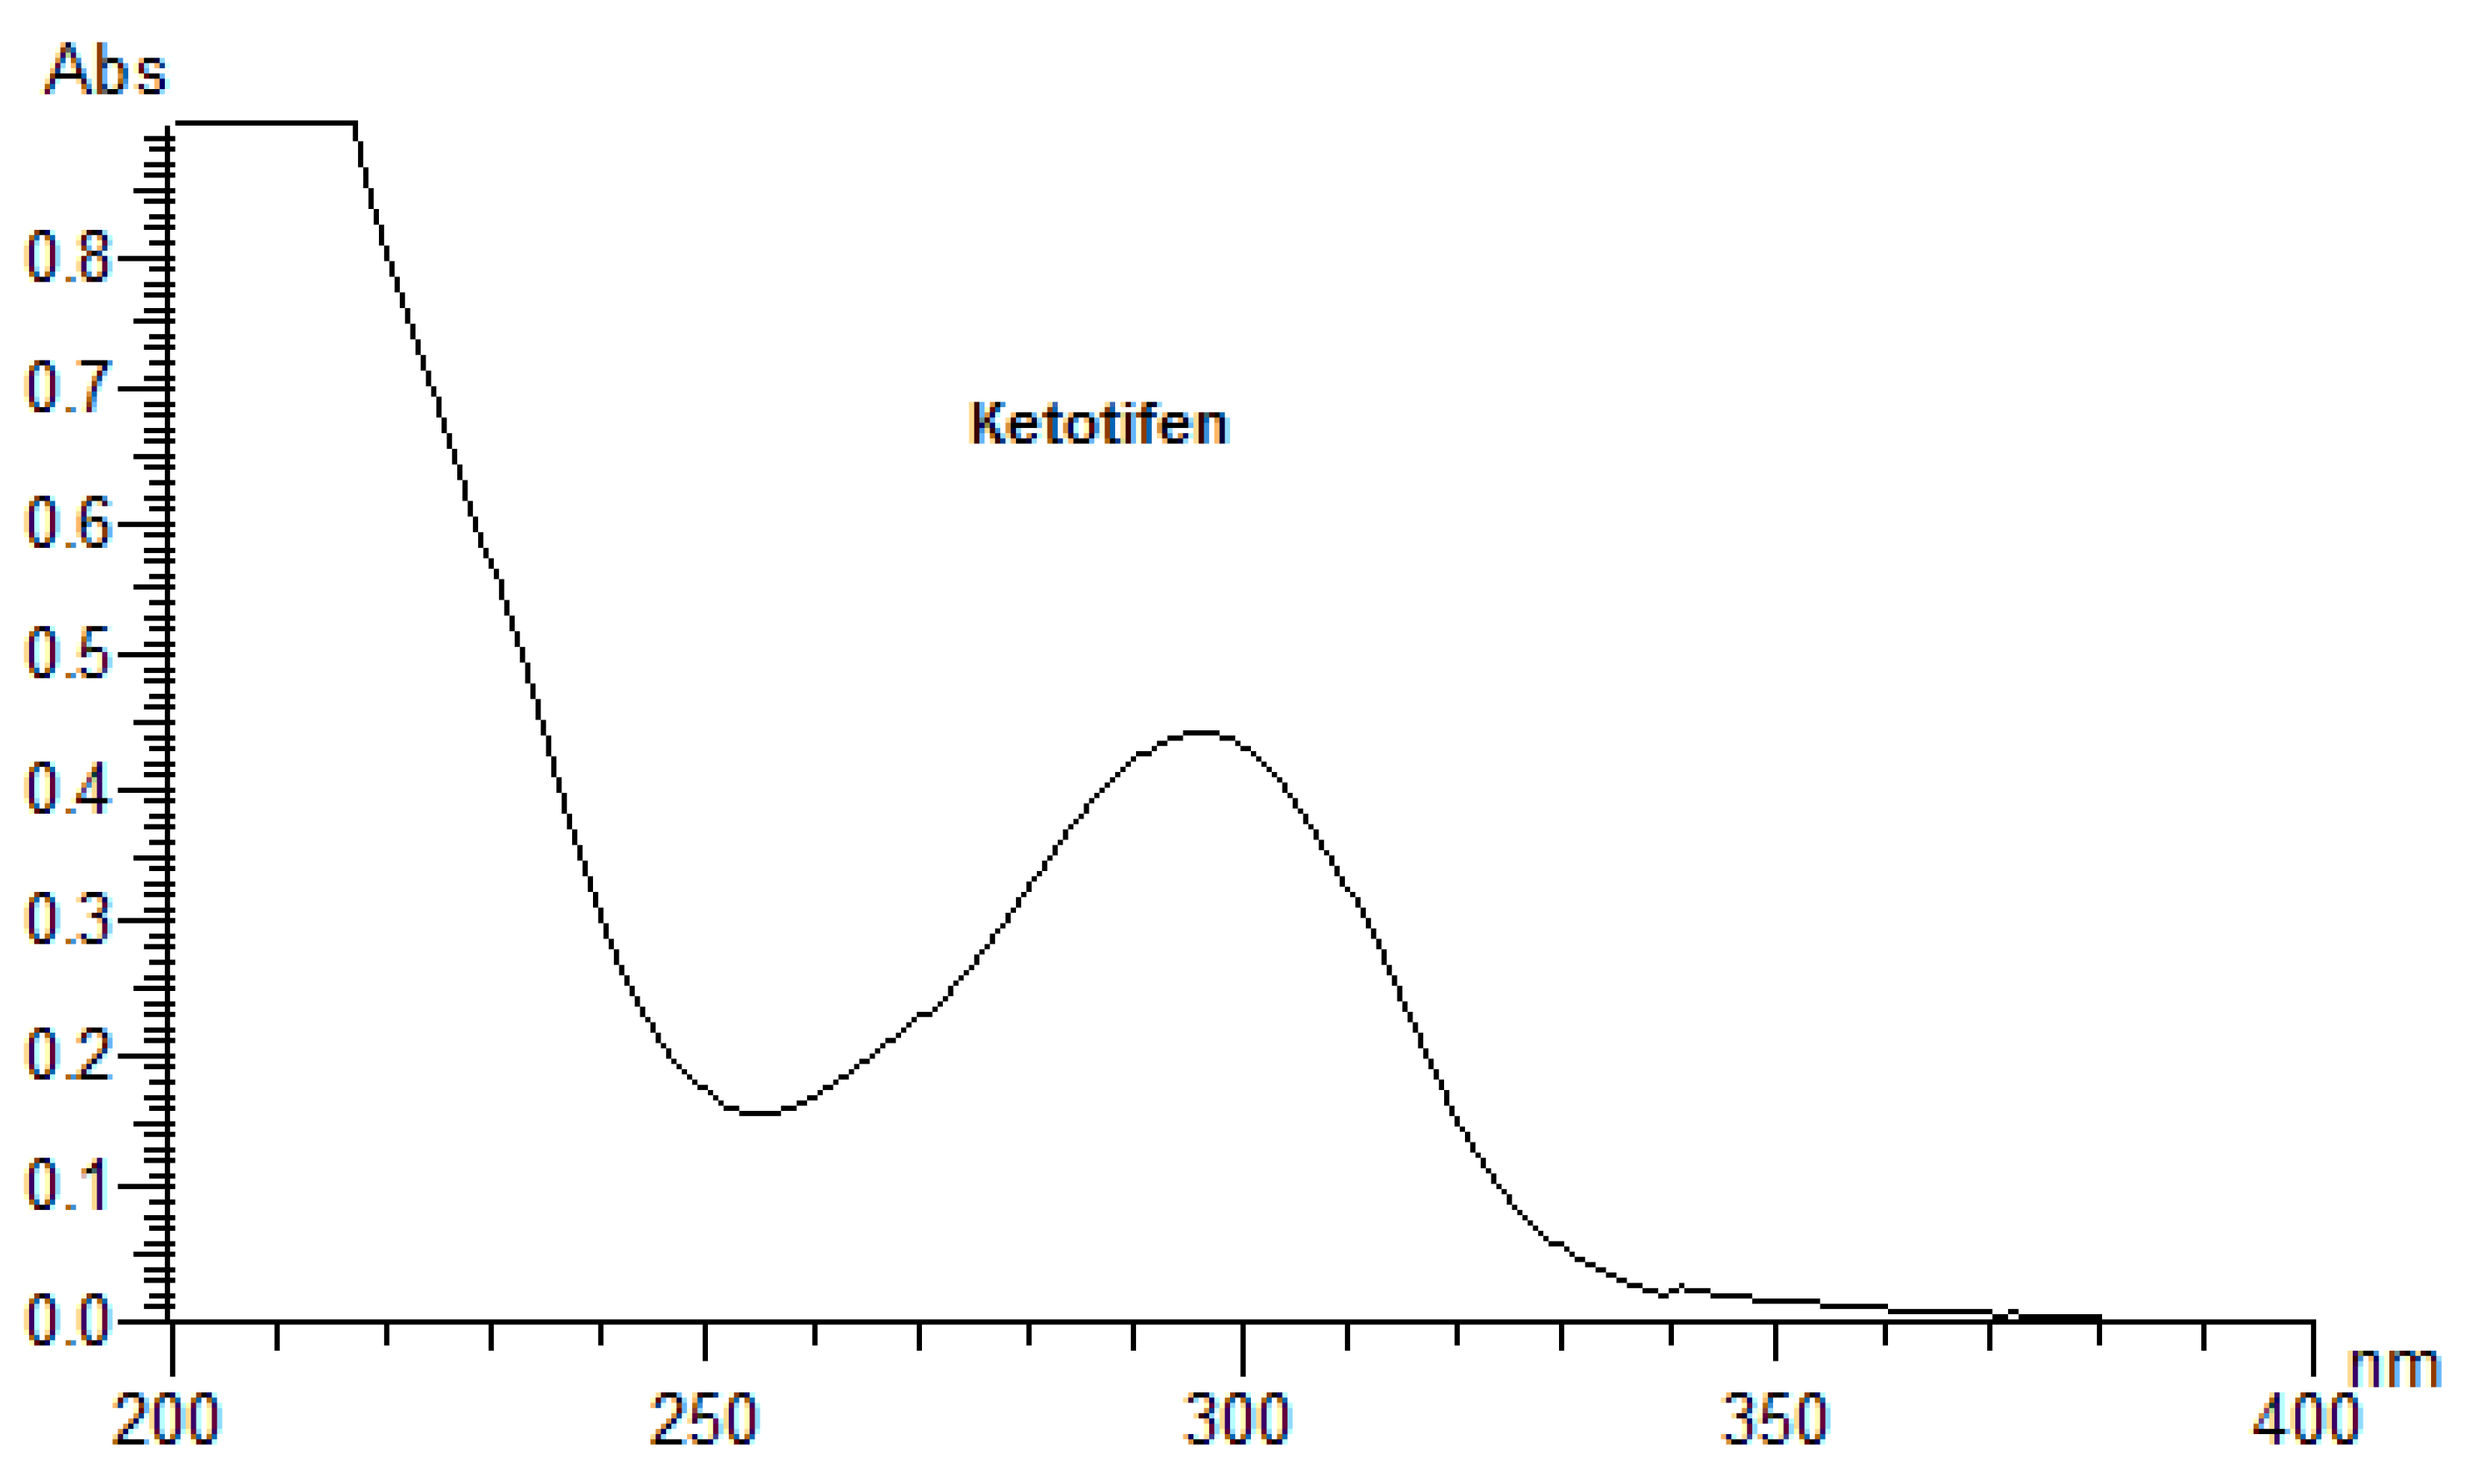
24]. A UV/Vis spectral analysis to clarify the potent photoreactivity of EME, EPI, and KET was carried out over the range of 200–700 nm. According to the spectral patterns of each drug, intense UV absorption was observed within the tested range (
Figure 2). What is more, EME and KET showed at least one peak near or above 290 nm, partly overlapping with the sunlight spectrum, with MEC values greater than 10,000 L/(mol·cm). The UV absorption spectrum of EME was characterized by strong bands around 210, 255, and 290 nm. For the lowest energy band at 286 nm, the MEC value was calculated as 10,962 L/(mol·cm). EPI was shown to absorb appreciably over the range of 200–240 nm, while above 240 nm, the absorbance decreased gradually to 300 nm. The UV absorption spectrum of KET was characterized by two sharp peaks around 210 and 300 nm. For the lowest energy band at 296 nm, the MEC value was calculated as 15,617 L/(mol·cm). On the basis of these results, EME and KET were recognized as probably being excitative by sunlight and photoreactive, as well as potentially phototoxic [
23].
3.3. Percentage of Degradation of EME, EPI, and KET
The photodegradation of EME, EPI, and KET was estimated with our HPLC methods, after exposing the drugs to UV/Vis light with energies equal to 18,902, 37,804, 56,706, 75,608, and 94,510 kJ/m
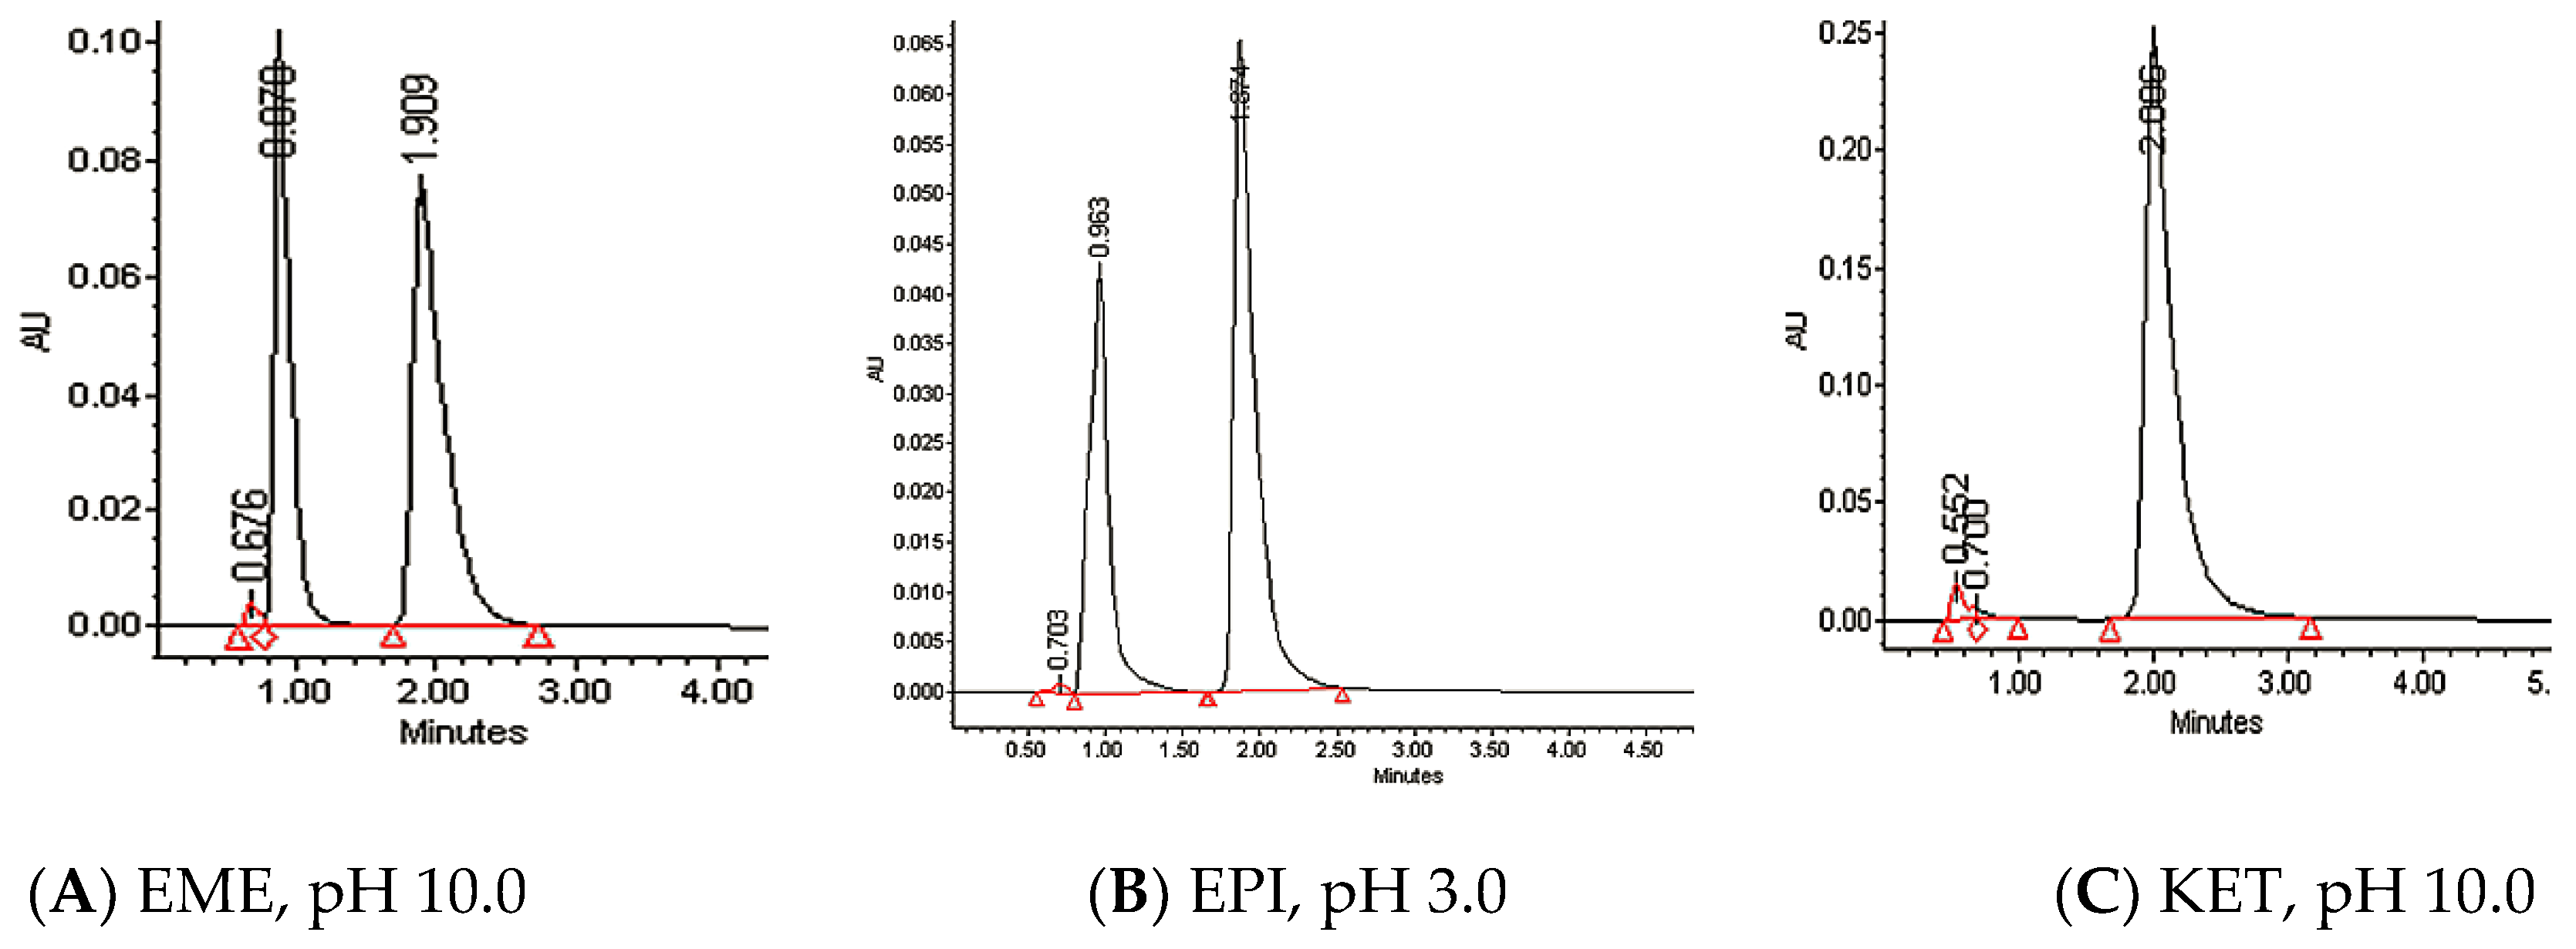
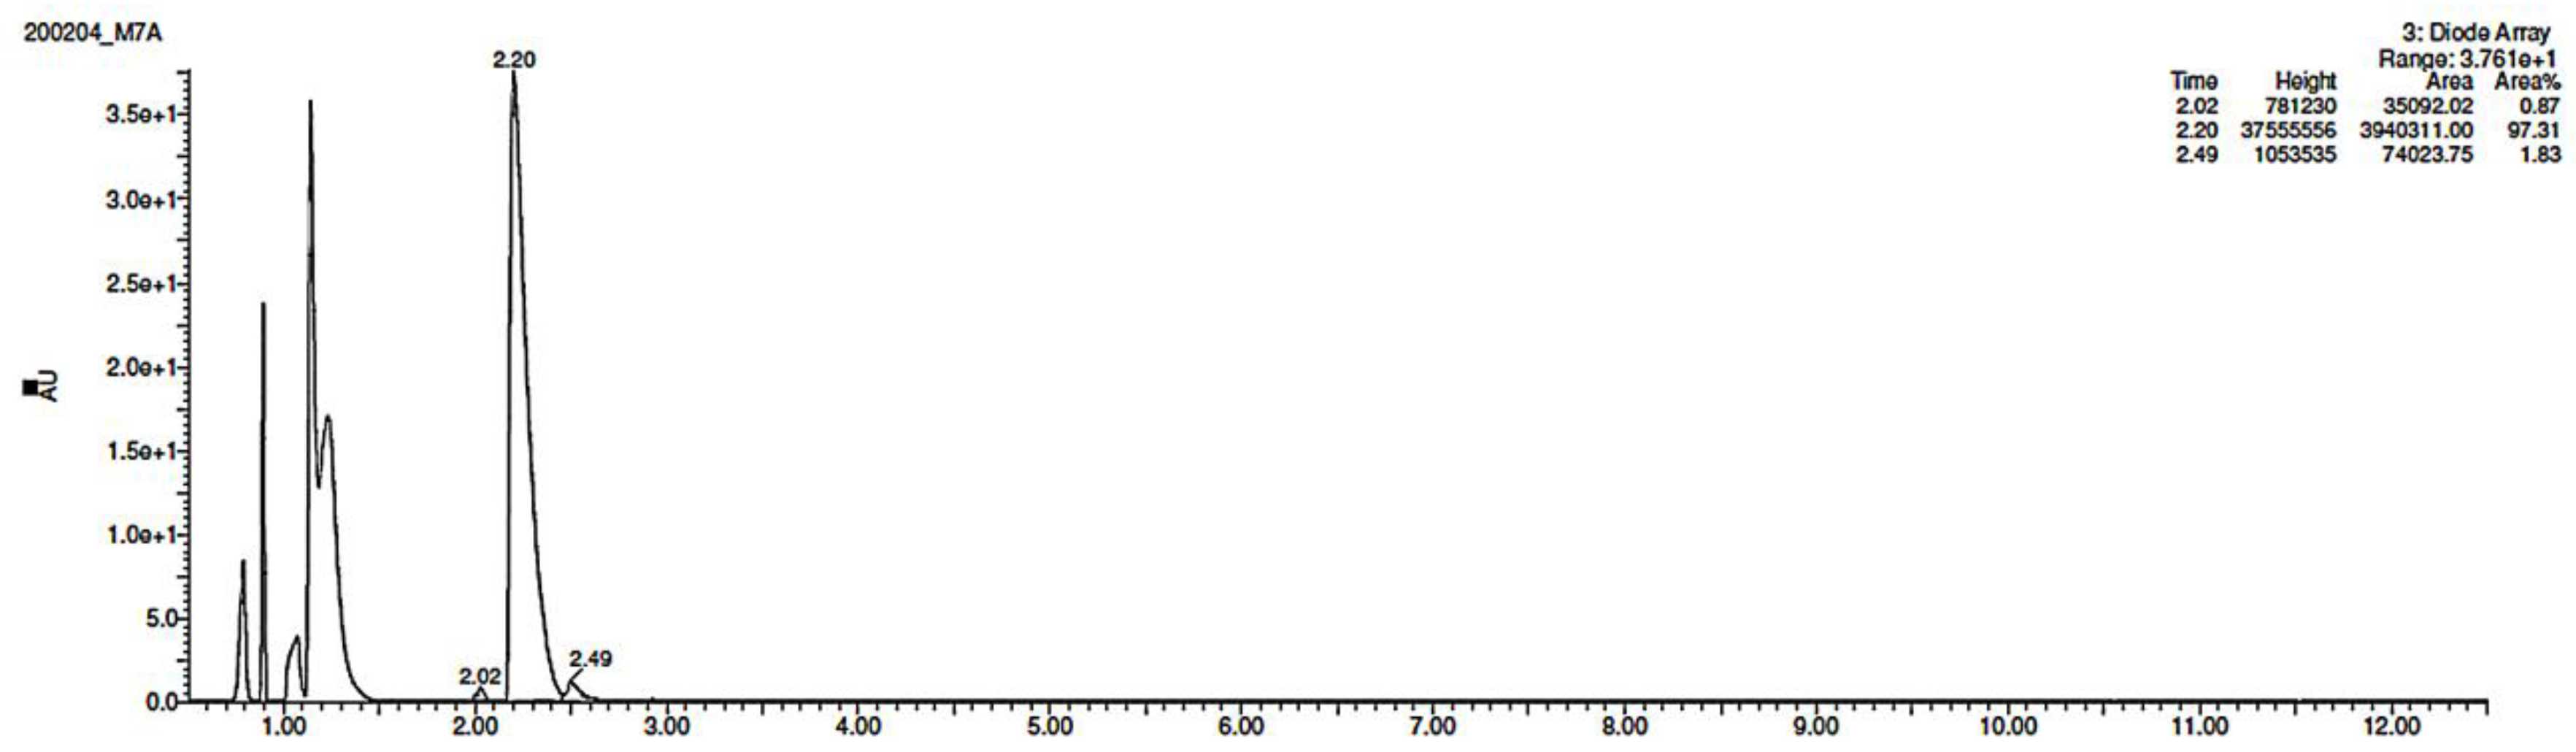
2 (exposure for 7, 14, 21, 28, and 35 h, respectively). As a result, EME was observed to be photolabile in a wide pH range, with a degradation value of 32.38–41.52% after the maximal irradiation. The chromatogram shows a decrease of the peak corresponding to the non-degraded EME (t
R 0.88 min). However, the appearance of any new peaks was not detected at 280 nm (
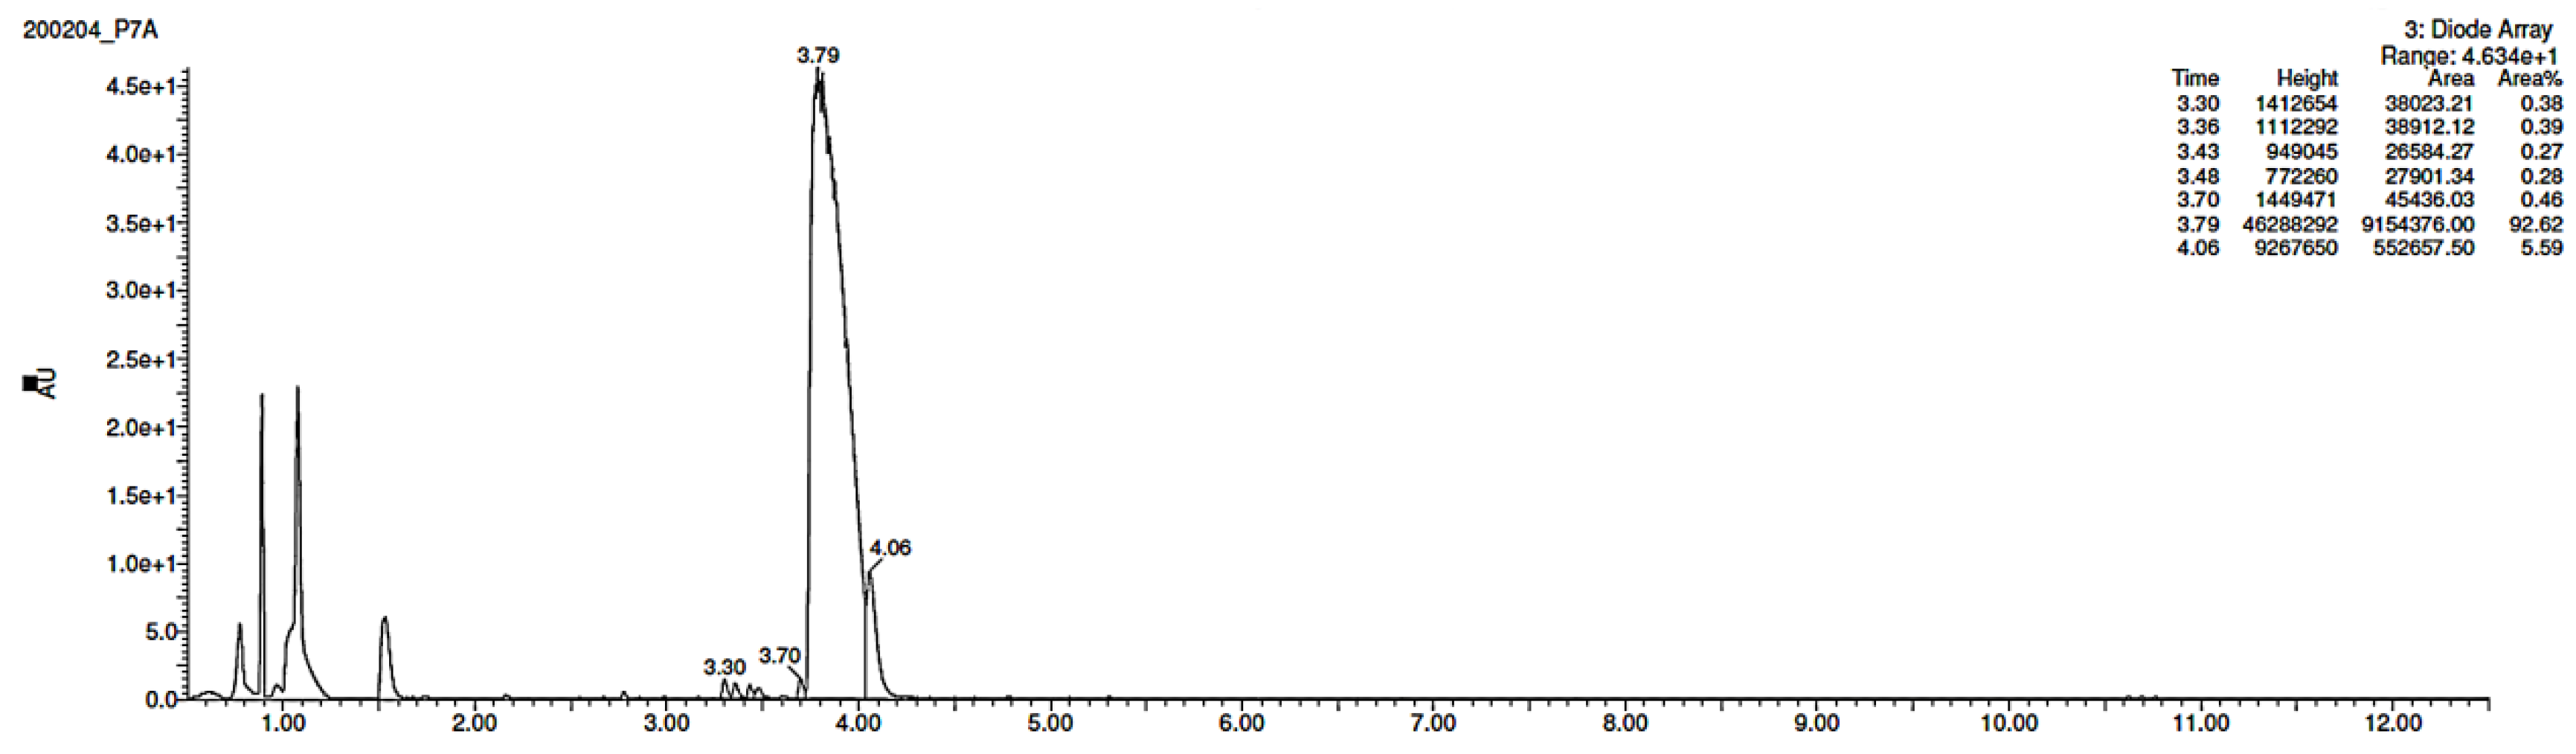
Figure 3A). As far as EPI is concerned, the photodegradation was lower, achieving 8.10–19.10% with the pH decreasing from 10 to 3 after the highest irradiation (94,510 kJ/m
2), without a corresponding rise in the peaks of degradation products in respective chromatograms (
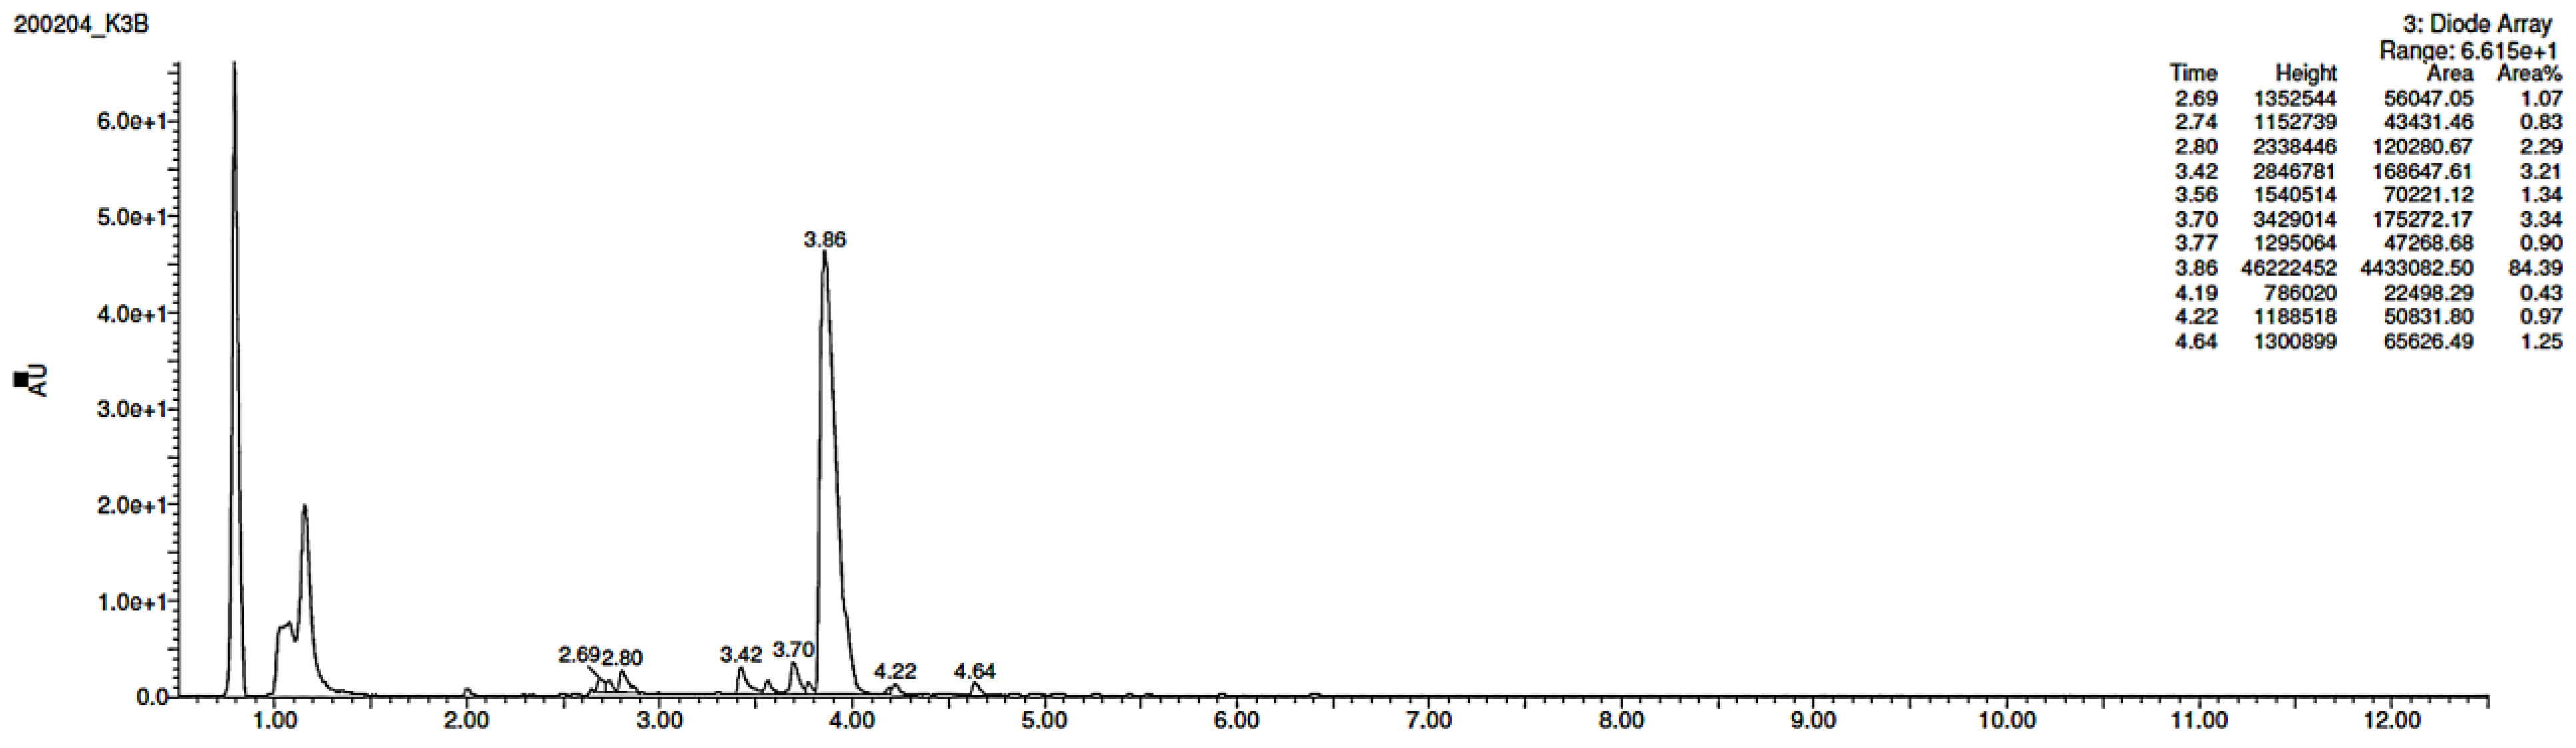
Figure 3B). When KET was irradiated with the maximal dose of light, it degraded to 14.64% at pH 3.0 and to 19.28% at pH 7.0. However, almost 100% degradation of KET was observed at pH 10.0 after a much lower dose of energy of 37,804 kJ/m
2. The respective chromatogram shows the disappearance of the peak corresponding to unmodified KET (t
R 0.88 min), as well as the appearance of several new peaks of degradation products (
Figure 3C).
It is well-known that the photodegradation of drugs is significantly affected by the pH of the environment because the changes in pH can promote or inhibit photolysis [
26]. In addition, the intermediates and final products that are generated in the wake of these photochemical reactions may also change the pH of the environment. Moreover, the drug may be more stable in its ionized or non-ionized form and may undergo specific acid-base catalysis in aqueous solutions [
26,
27].
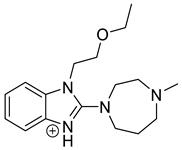
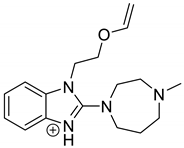
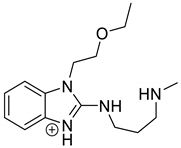
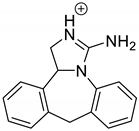
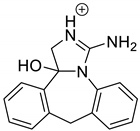
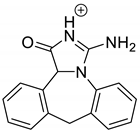
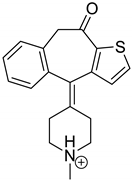
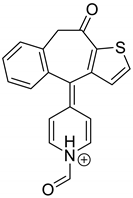
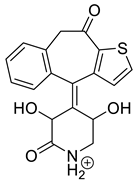
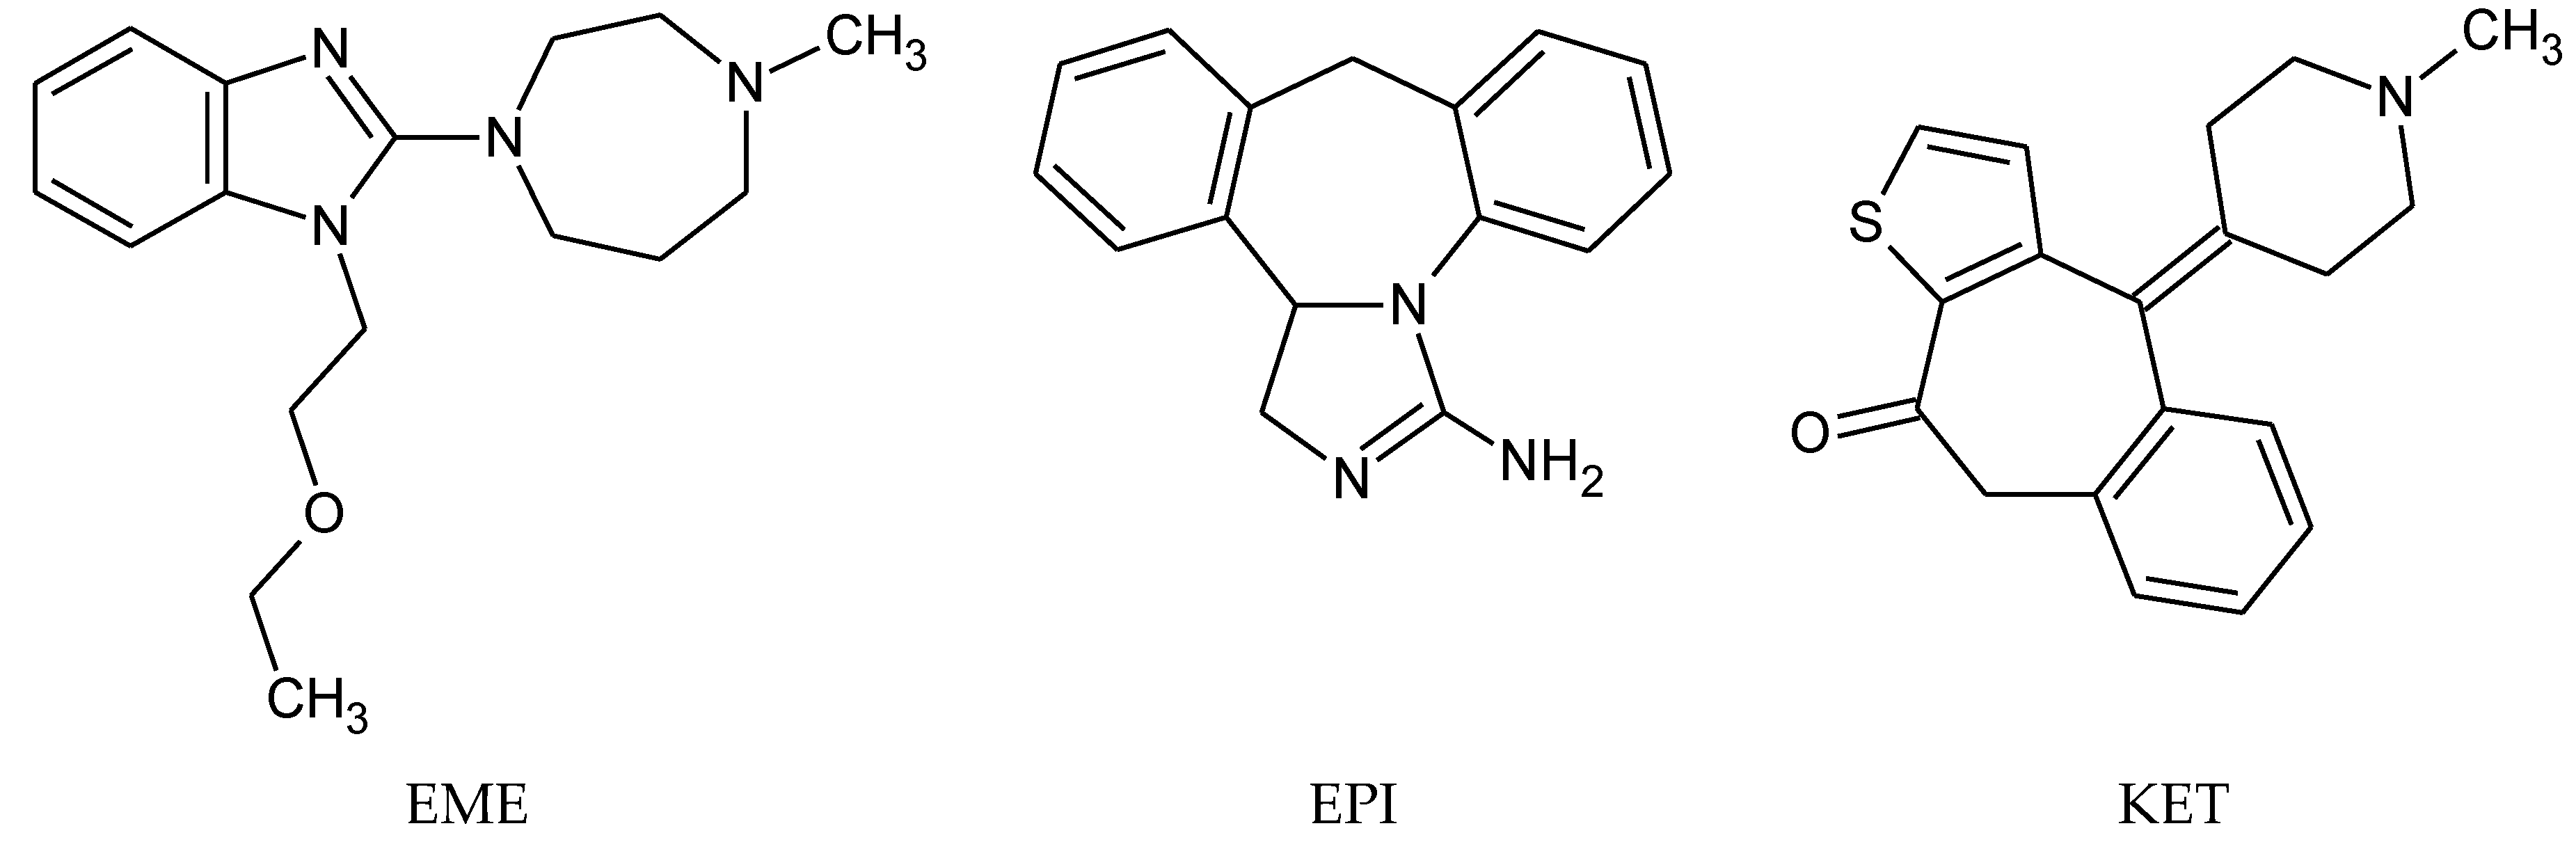
The drugs analyzed in this study are all weak bases with a pKa value of 8.68 for EME (the substituted diazepine ring), 8.77 for EPI (due to primary amine group substituted in the imidazo [1,5-a]azepine structure), and 8.43 for KET (the substituted piperidine ring) [
28,
29,
30] (
Figure 1). However, they differ as far as their percentage degradation in specific pH is concerned. Alkaline conditions showed a higher degradation efficiency and the maximum degradation for EME and KET was obtained at pH 10.0, where they were electrically neutral. On the other hand, a different trend in the case of EPI was observed and the maximum degradation occurred at pH 3.0, where its primary amine group was protonated (
Table 2).
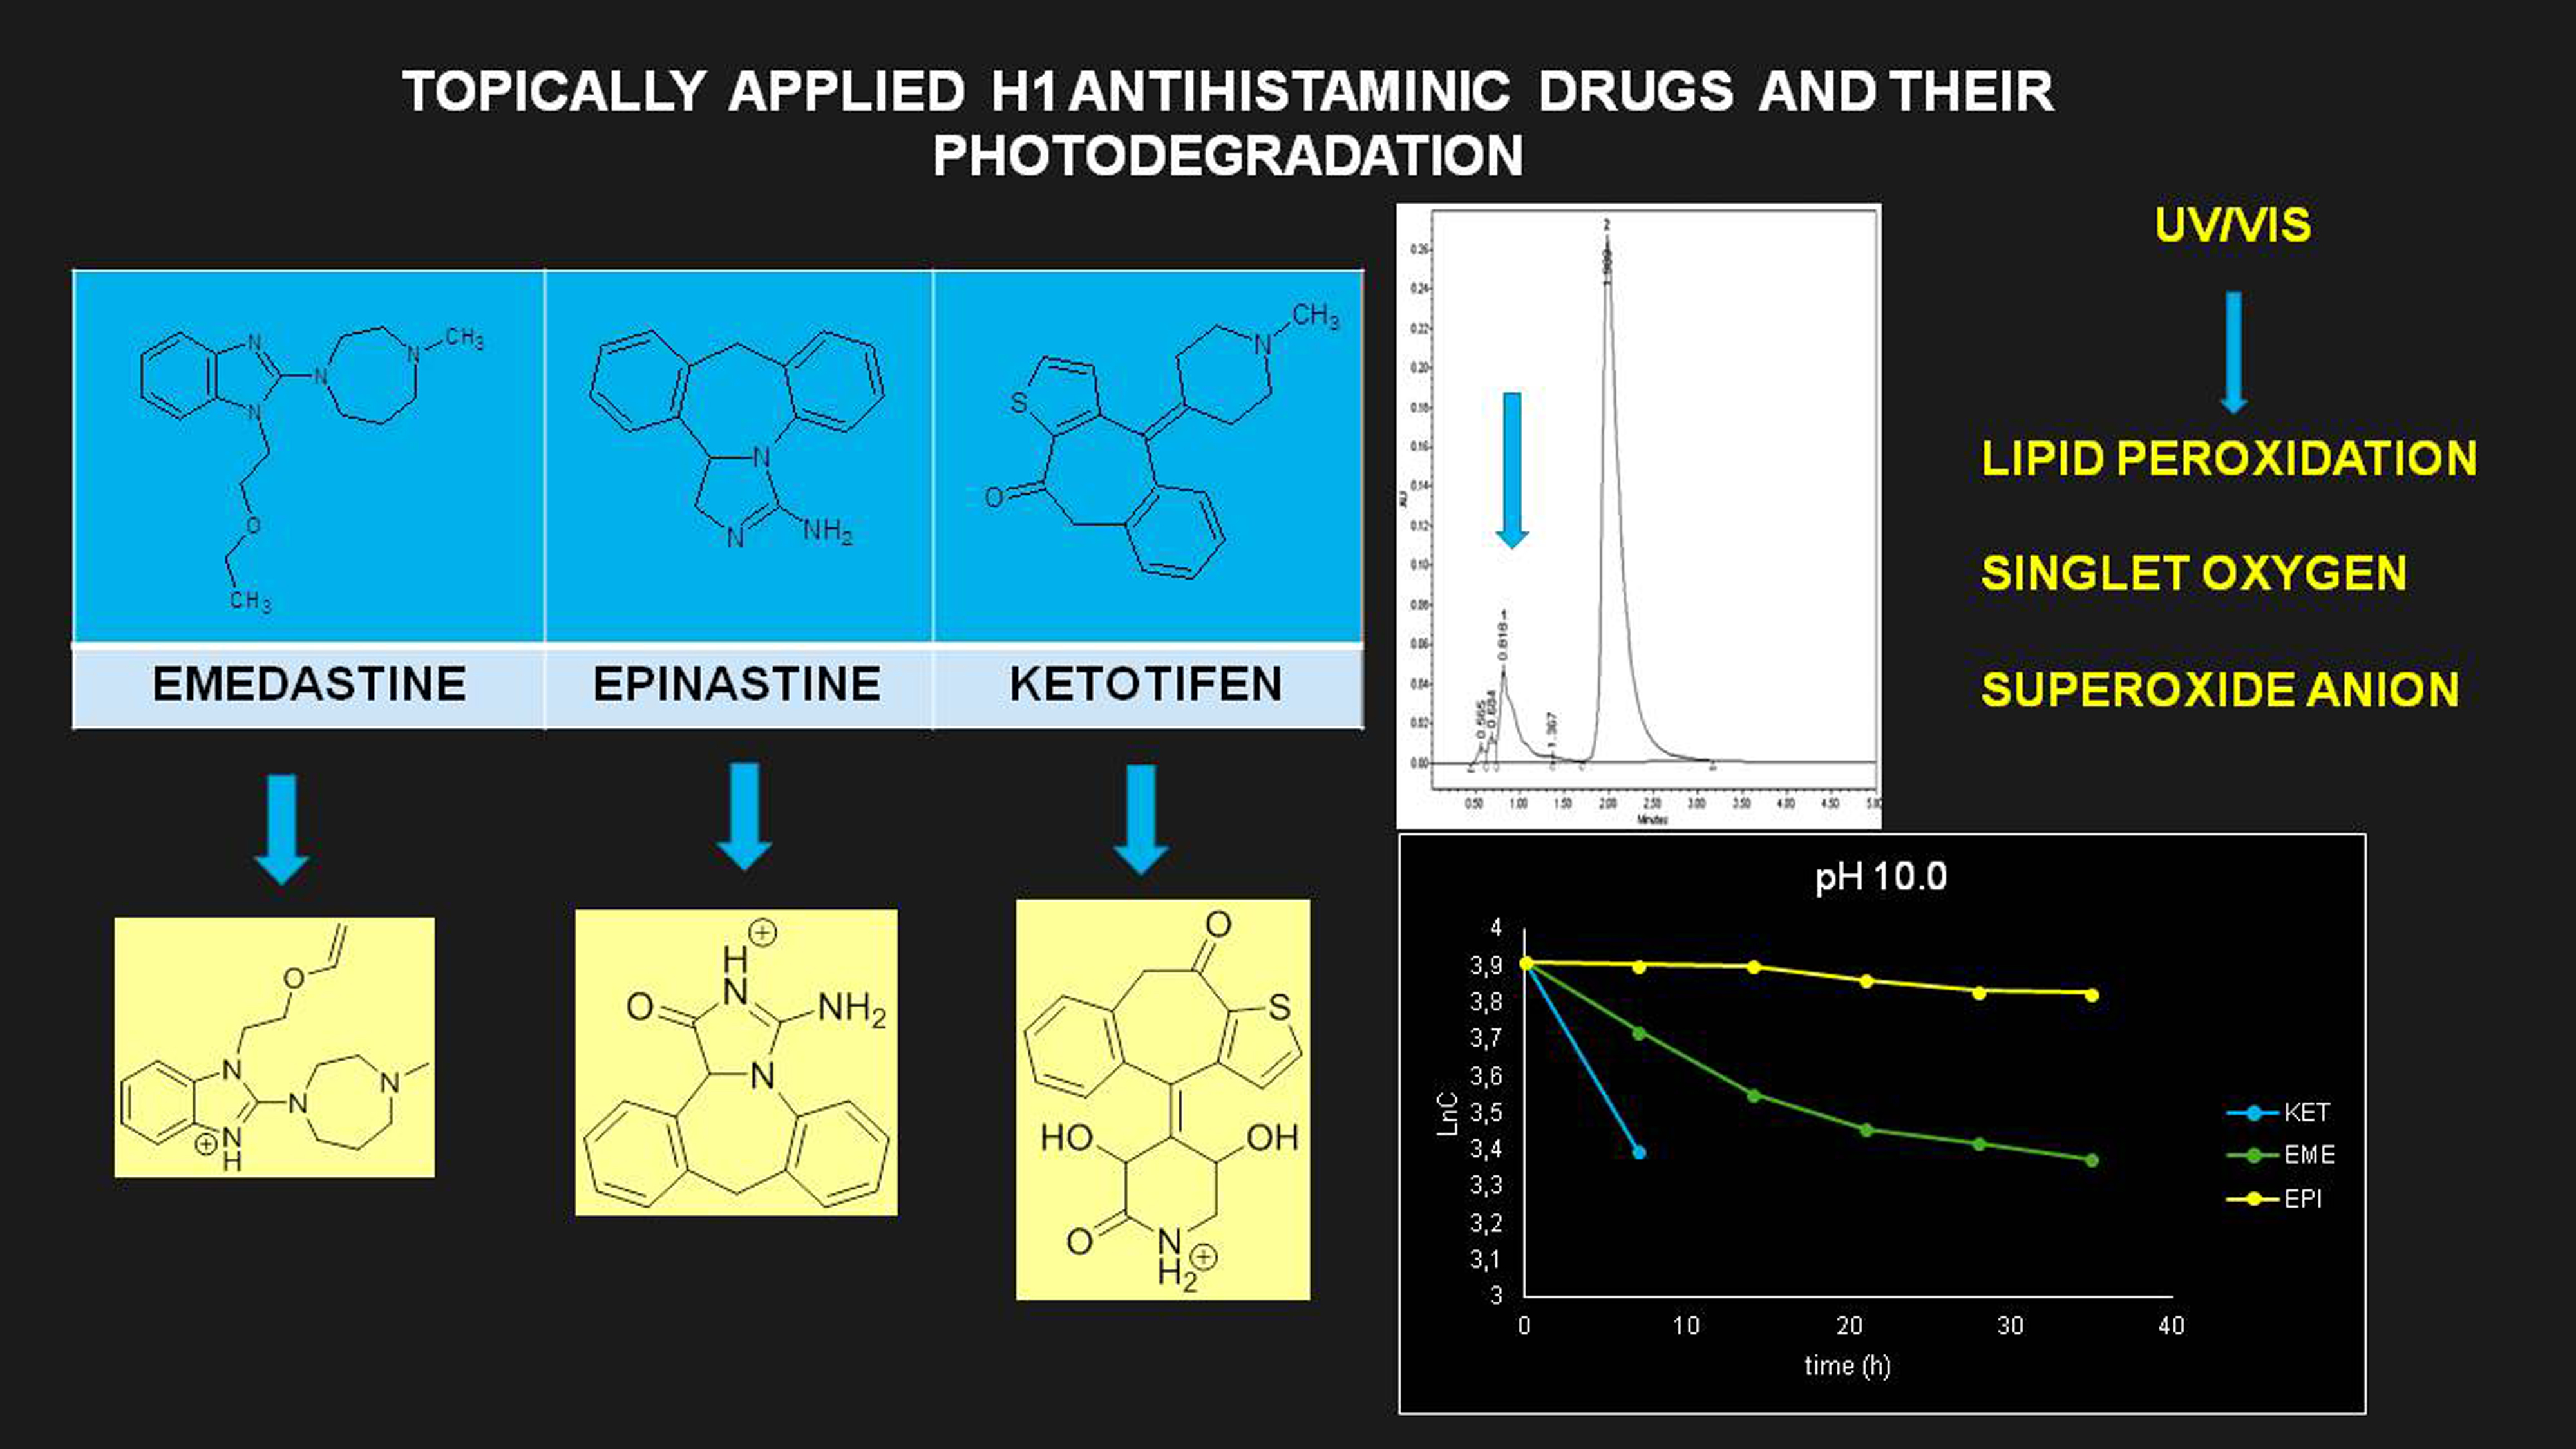
3.4. Kinetics of Degradation
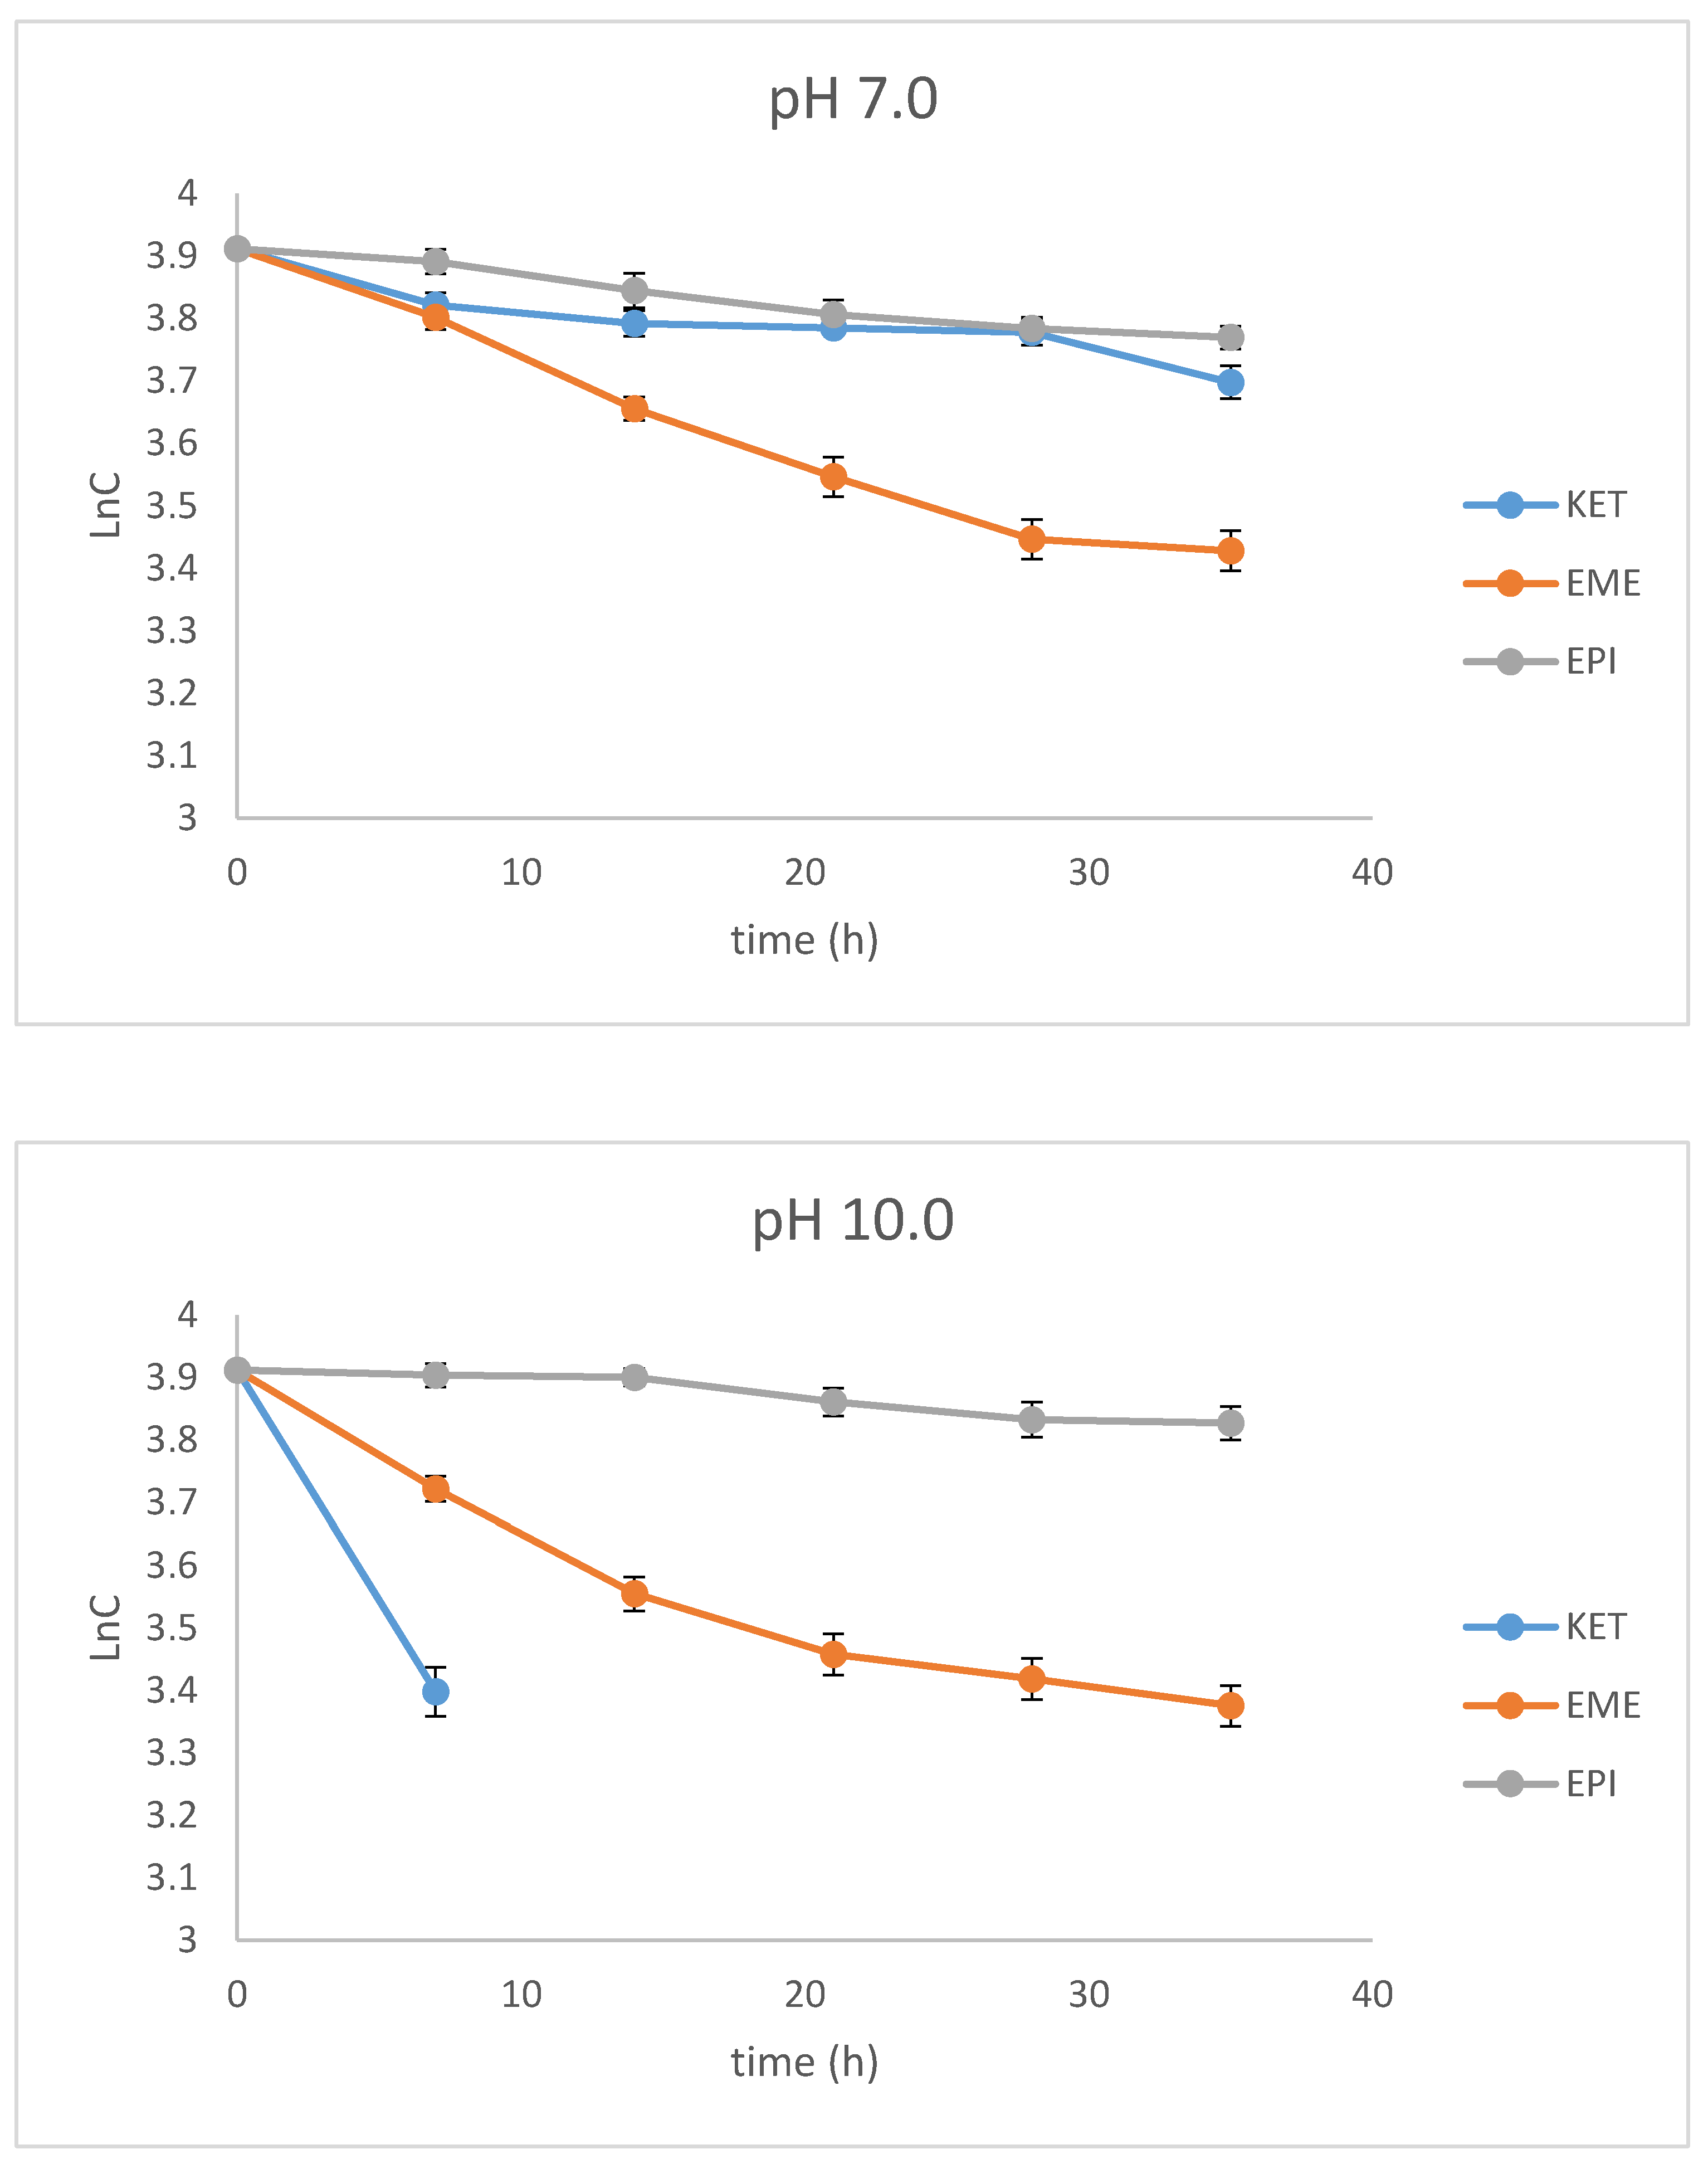
Our study showed stronger correlations for the plots of logarithms of the concentration of non-degraded drugs than for the plots of the concentration of non-degraded drugs versus time of degradation, confirming pseudo first-order kinetics for their degradation, with all r values above 0.9. From these regression equations, further kinetic parameters were calculated, i.e., the degradation rate constant (k), degradation time of the 10% substance (t
0.1), and degradation time of the 50% substance (t
0.5) (
Table 2).
As far as the photodegradation of EME is concerned, the calculated t
0.5 values were 28.12 h at pH 3.0, 21.04 h at pH 7.0, and 19.92 h at pH 10.0, confirming its lowest stability in alkaline conditions. At the same time, EPI was shown to be less sensitive to UV/Vis light, with a percentage of degradation below 20%, even after the maximal dose of light. The calculated t
0.5 values for EPI were 55.72 h at pH 3.0, 68.39 h at pH 7.0, and 107.5 h at pH 10.0, confirming its lowest stability in acidic conditions. As far as KET is concerned, the calculated t
0.5 values dropped dramatically from 65.42 at pH 3.0 to 13.03 h at pH 7.0. What is more, the drug was completely degraded in pH 10.0, confirming its lowest stability in alkaline medium. The percentage degradation, as well as kinetic parameters for EME, EPI, and KET, are shown in
Table 2. In turn, the pseudo first-order profiles of degradation of EME, EPI, and KET in solutions of different pH values are shown in
Figure 4.
Because of the limited data from the literature concerning the photodegradation of EME, we could not conduct any detailed comparisons. As far as EPI is concerned, it was previously shown to be photostable in a solid state [
13], whereas a 2% degradation value was observed for a methanolic solution [
12]. However, no results on its degradation in solutions of different pH values and its degradation kinetics have been published so far. In terms of KET, only one similar study has been reported, in which KET was shown to be more stable than other benzocycloheptane antihistaminic agents [
31]. In our study, KET was shown to be moderately sensitive to light at pH 3.0 and 7.0, and extremely sensitive at pH 10.0. Therefore, our results showed that EME and KET are sensitive to light in a wide pH range, which could be essential for manufacturing and protecting their formulations, especially in solutions. What is more, choosing the optimal excipients for their ocular drops becomes an important issue. As was described above, there are no articles in the literature concerning the kinetics of degradation with respect to EME, EPI, and KET. Therefore, the results presented here supplement the literary resources in this area.
3.5. LC/MS
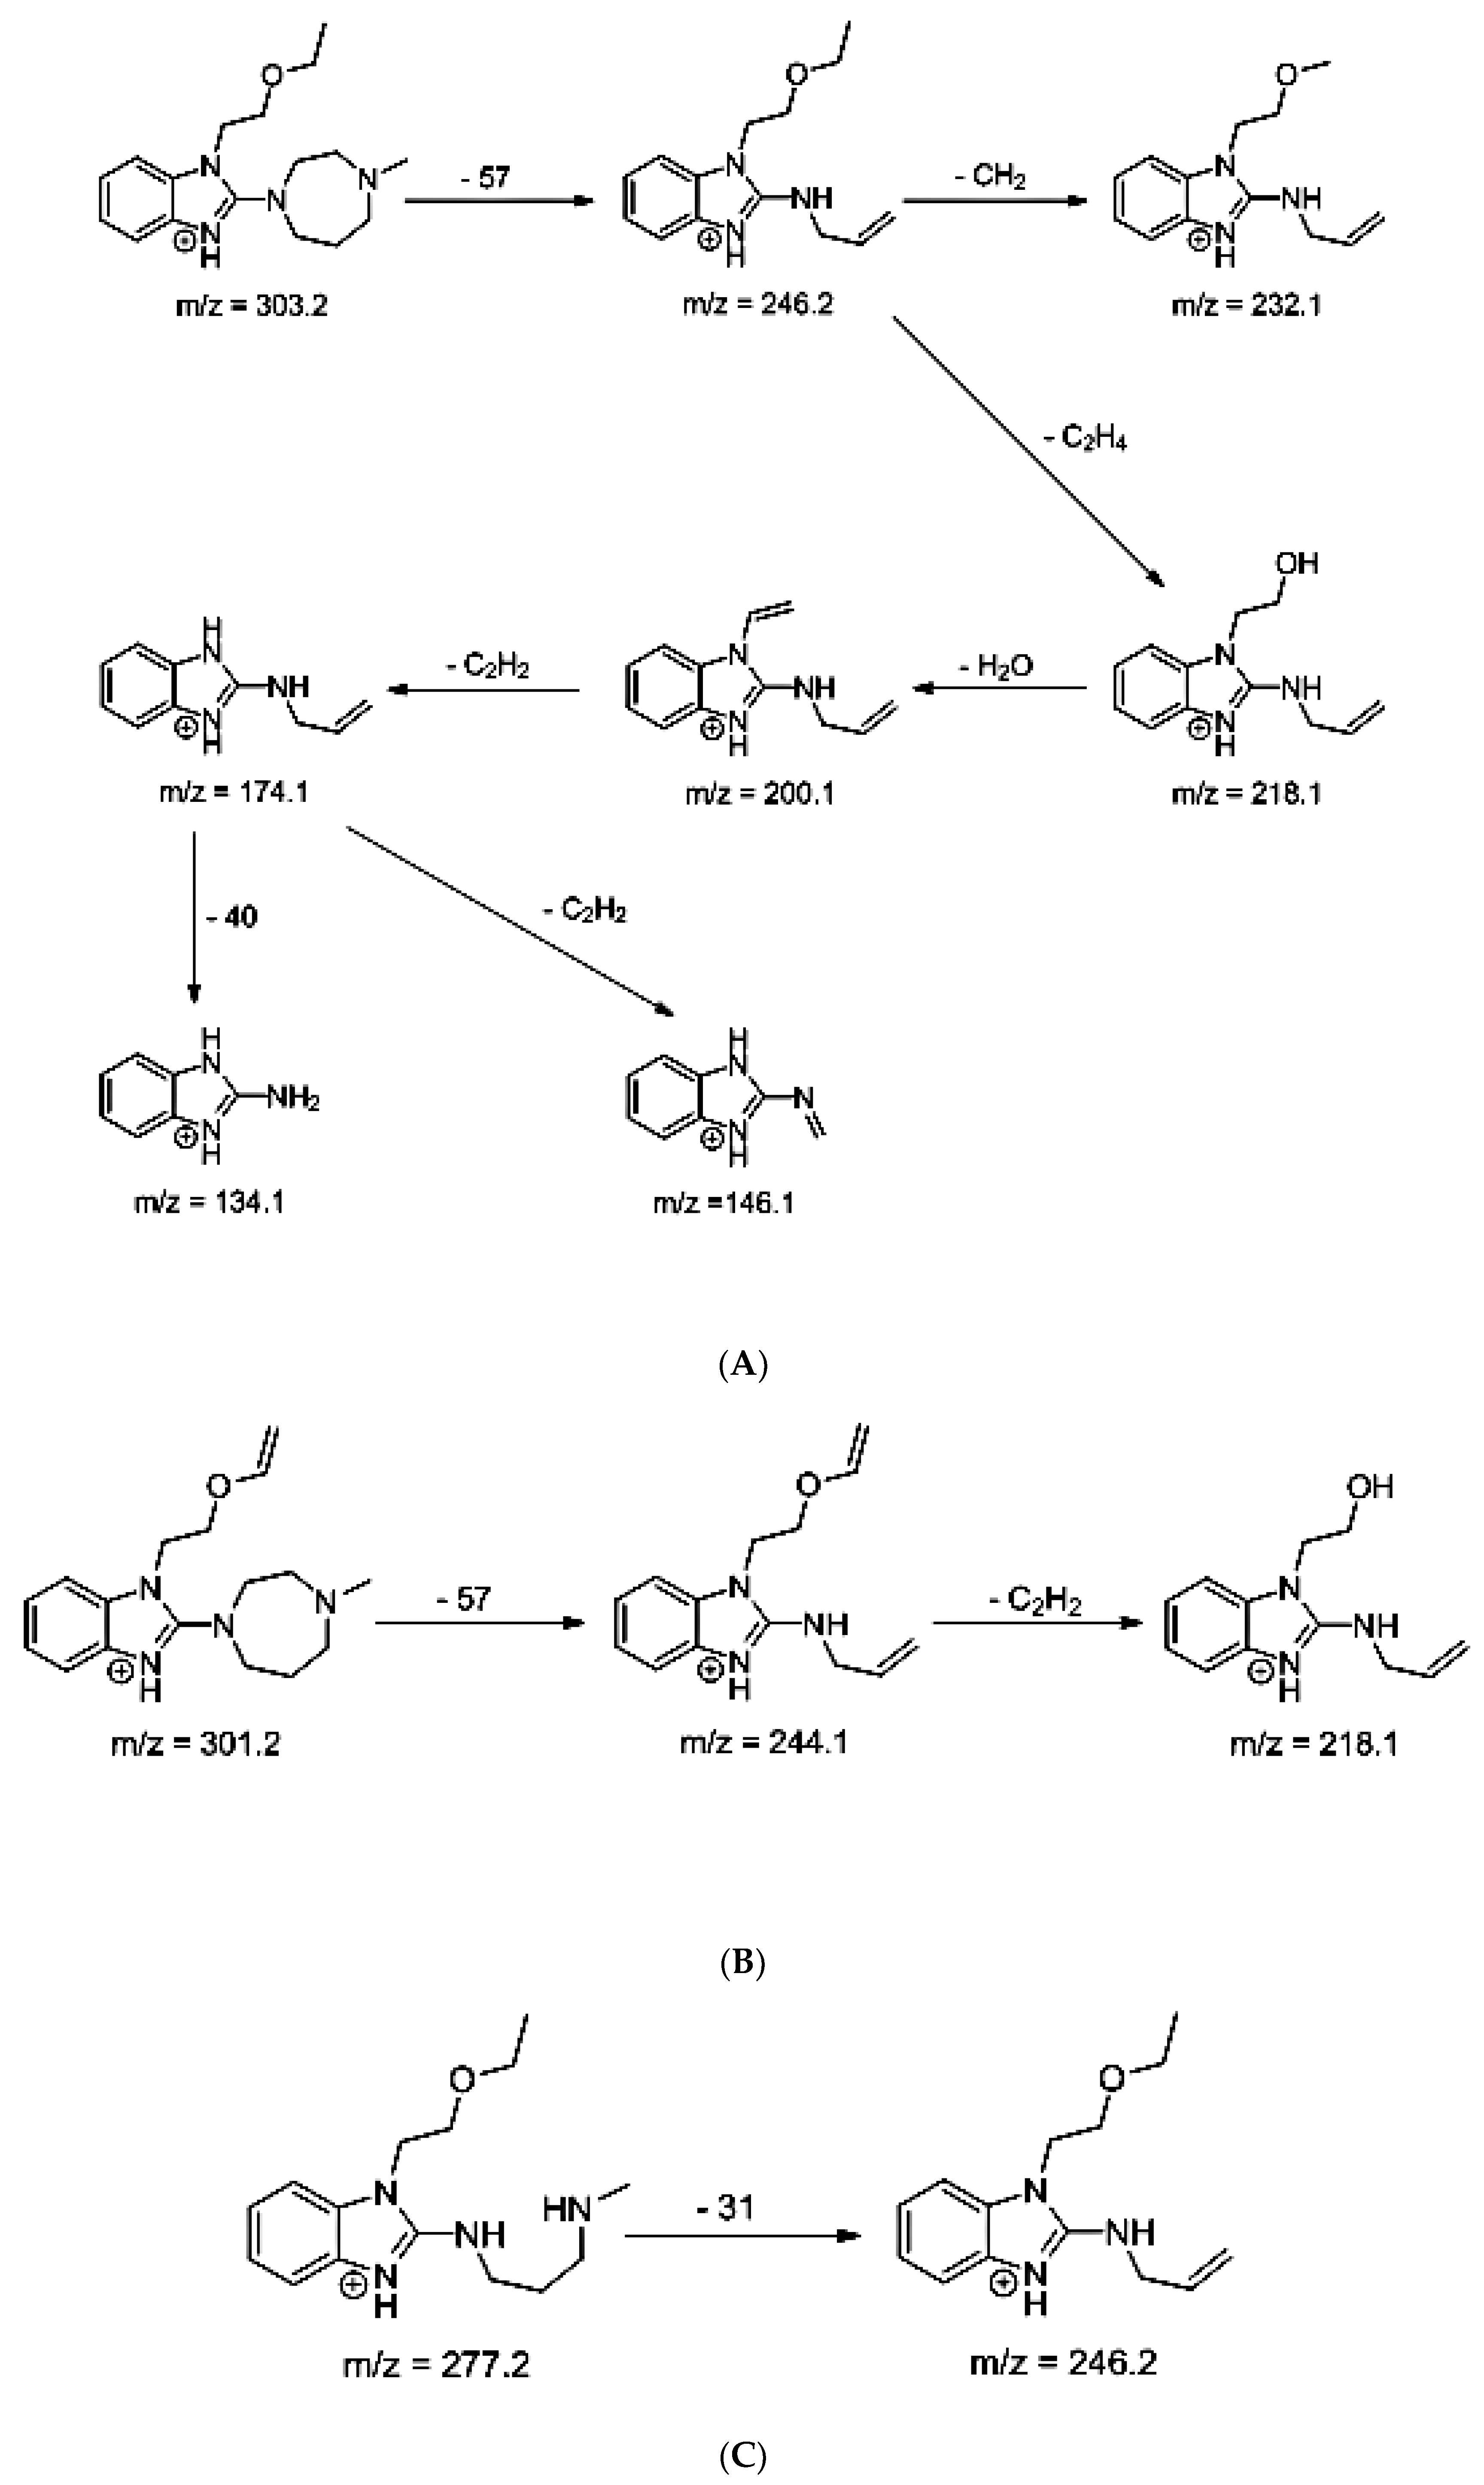
The identification of photodegradation products (Ps) of EME, EPI, and KET was performed on the basis of our UPLC/MS analysis and supported with fragmentation patterns obtained from MS/MS experiments. A protonated molecule [M + H]
+ of
m/z 303.2 was observed in the full scan mass spectra of EME (
Table 3). Its MS/MS showed the product ion at
m/z 246.2 that followed a parallel fragmentation pathway to form ions at
m/z 232.1 and 218.1. The subsequent step in the fragmentation pathway of EME was the loss of the water moiety from
m/z 218.1, which resulted in the formation of a fragment with
m/z 200.1. Following this, the last fragment formed an ion at
m/z 174.1 that followed a parallel fragmentation to form two ions at
m/z 146.1 and 134.1. All of these steps in the fragmentation pathway of EME are shown in
Figure 5A. As was discussed above, EME was observed to be photolabile, with 32.38%, 38.34%, and 41.52% degradation at pH 3.0, 7.0, and 10.0, respectively. The degradation process at pH 3.0 was found to affect the ethoxy moiety, leading to the product EME-P1 with
m/z 301.2 via hydroxylation and dehydration, while the fragment ions formed from EME P-1 were
m/z 244.1, 218.1, and 146.1 (
Figure 5B). In addition, the degradation at pH 3.0, 7.0, and 10.0 was shown to affect the 1,4-diazepine ring of EME, leading to its opening and to the product EME-P2 with
m/z 277.2, with subsequent fragment ions at
m/z 246.2, 218.1, 200.1, 174.1, 146.1, and 134.1 (
Figure 5C). It is worth mentioning that the EME-P2 product was described in European Pharmacopoeia as Impurity F [
19]. A respective UPLC chromatogram of EME and its degradation products is shown in
Figure 6.
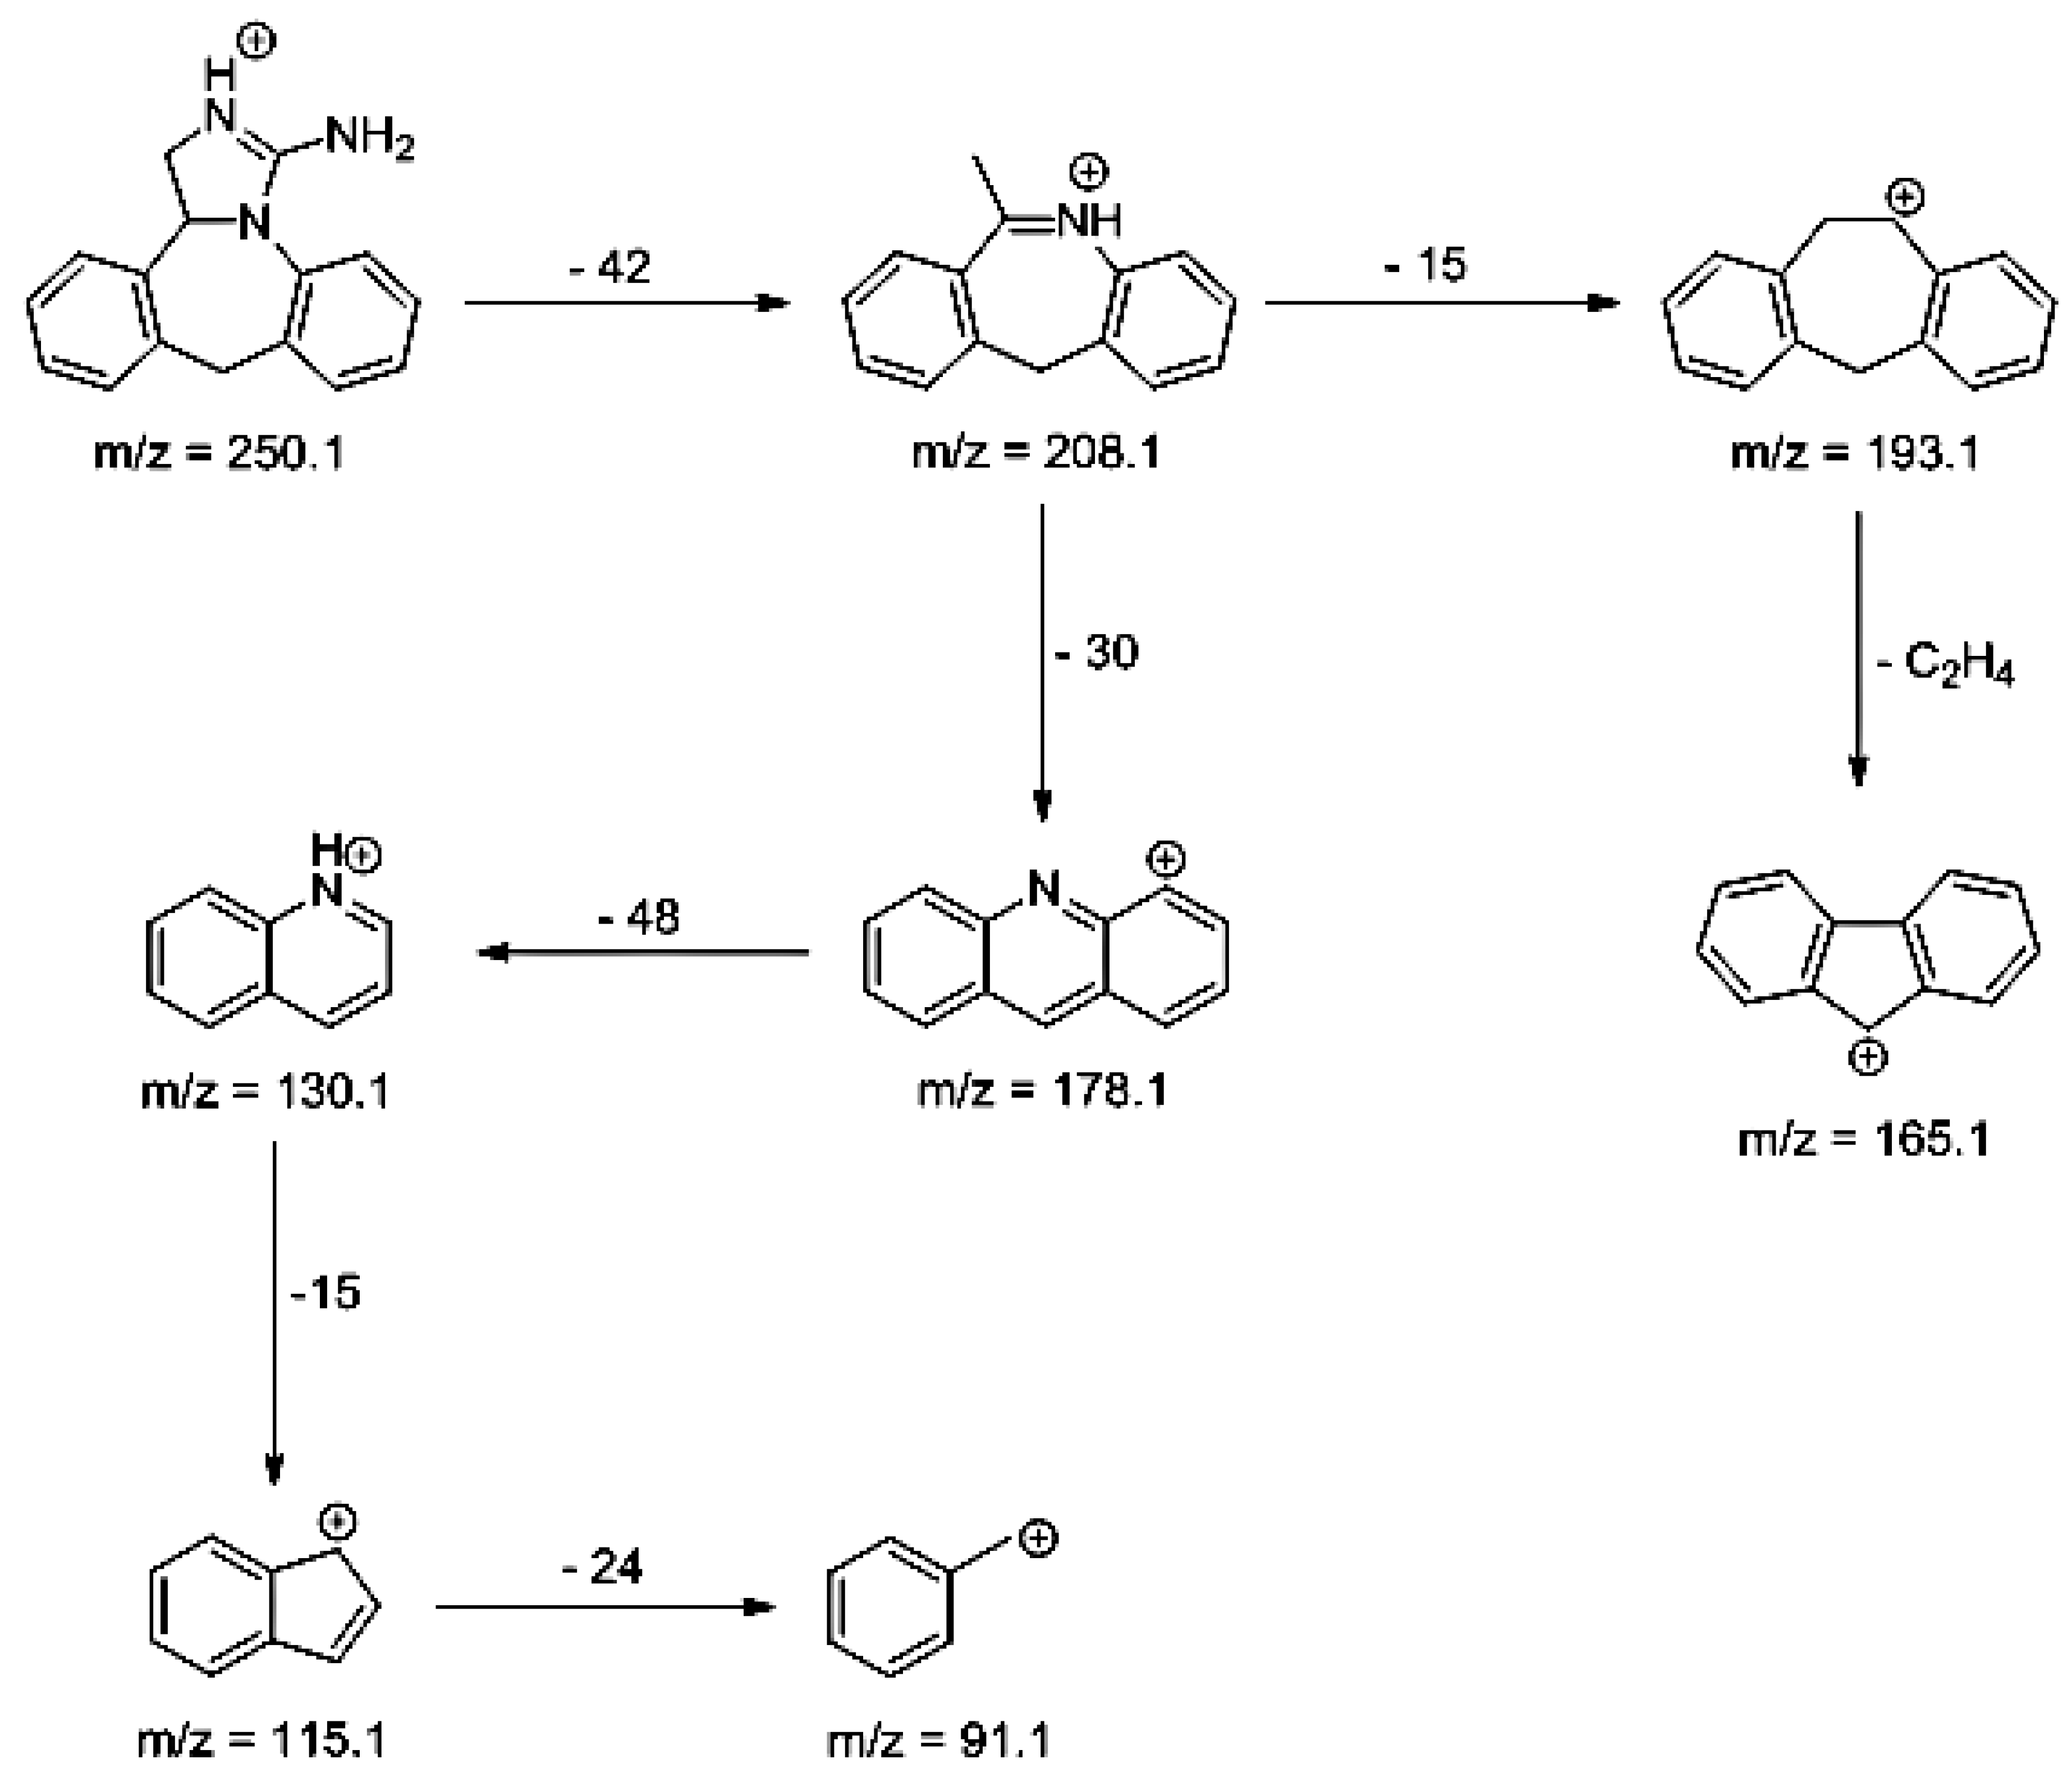
As far as EPI is concerned, a protonated molecule [M + H]
+ of
m/z 250.1 was observed in the full scan mass spectra (
Table 4). Its MS/MS showed the product ion at
m/z 208.1 that followed a parallel fragmentation to form ions at
m/z 193.1 and 178.1. Next, the last fragment formed ions at
m/z 130.1, 115.1, and 91.1. The subsequent steps in the fragmentation pathway of EPI, including the formation of other minor fragments, are depicted in
Figure 7. The photodegradation of EPI achieved 8.10–19.10%, while the pH of the buffer decreased from 10 to 3. At pH 3.0, degradation was found to affect the imidazoline ring, leading to its oxidation, as was observed for the products EPI-P1, EPI-P2, and EPI-P3. The major ions formed during their MS/MS were
m/z 248.1, 204.1, 178.1, and 127.1 (EPI-P1); 246.1, 204.1, and 178.1 (EPI-P2); and 204.1, 178.1, and 127.1 (EPI-P3). Further degradation of EPI led to imidazole ring opening, as was observed for the product EPI-P4 with the fragment ions at
m/z 237.1, 210.1, and 192.1. It was interesting to observe that EPI-P3 and EPI-P4 were detected both at pH 3.0, where the highest degradation of EPI occurred (19.10%), as well as at pH 10.0, where degradation was relatively low (8.10%). At the same time, the EPI-P3 was described in European Pharmacopoeia as Impurity A [
19]. The fragmentation patterns of EPI-Ps 1–4 are shown in
Figure 8A–D, while their UPLC chromatogram is shown in
Figure 9.
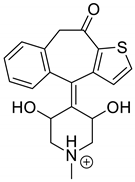
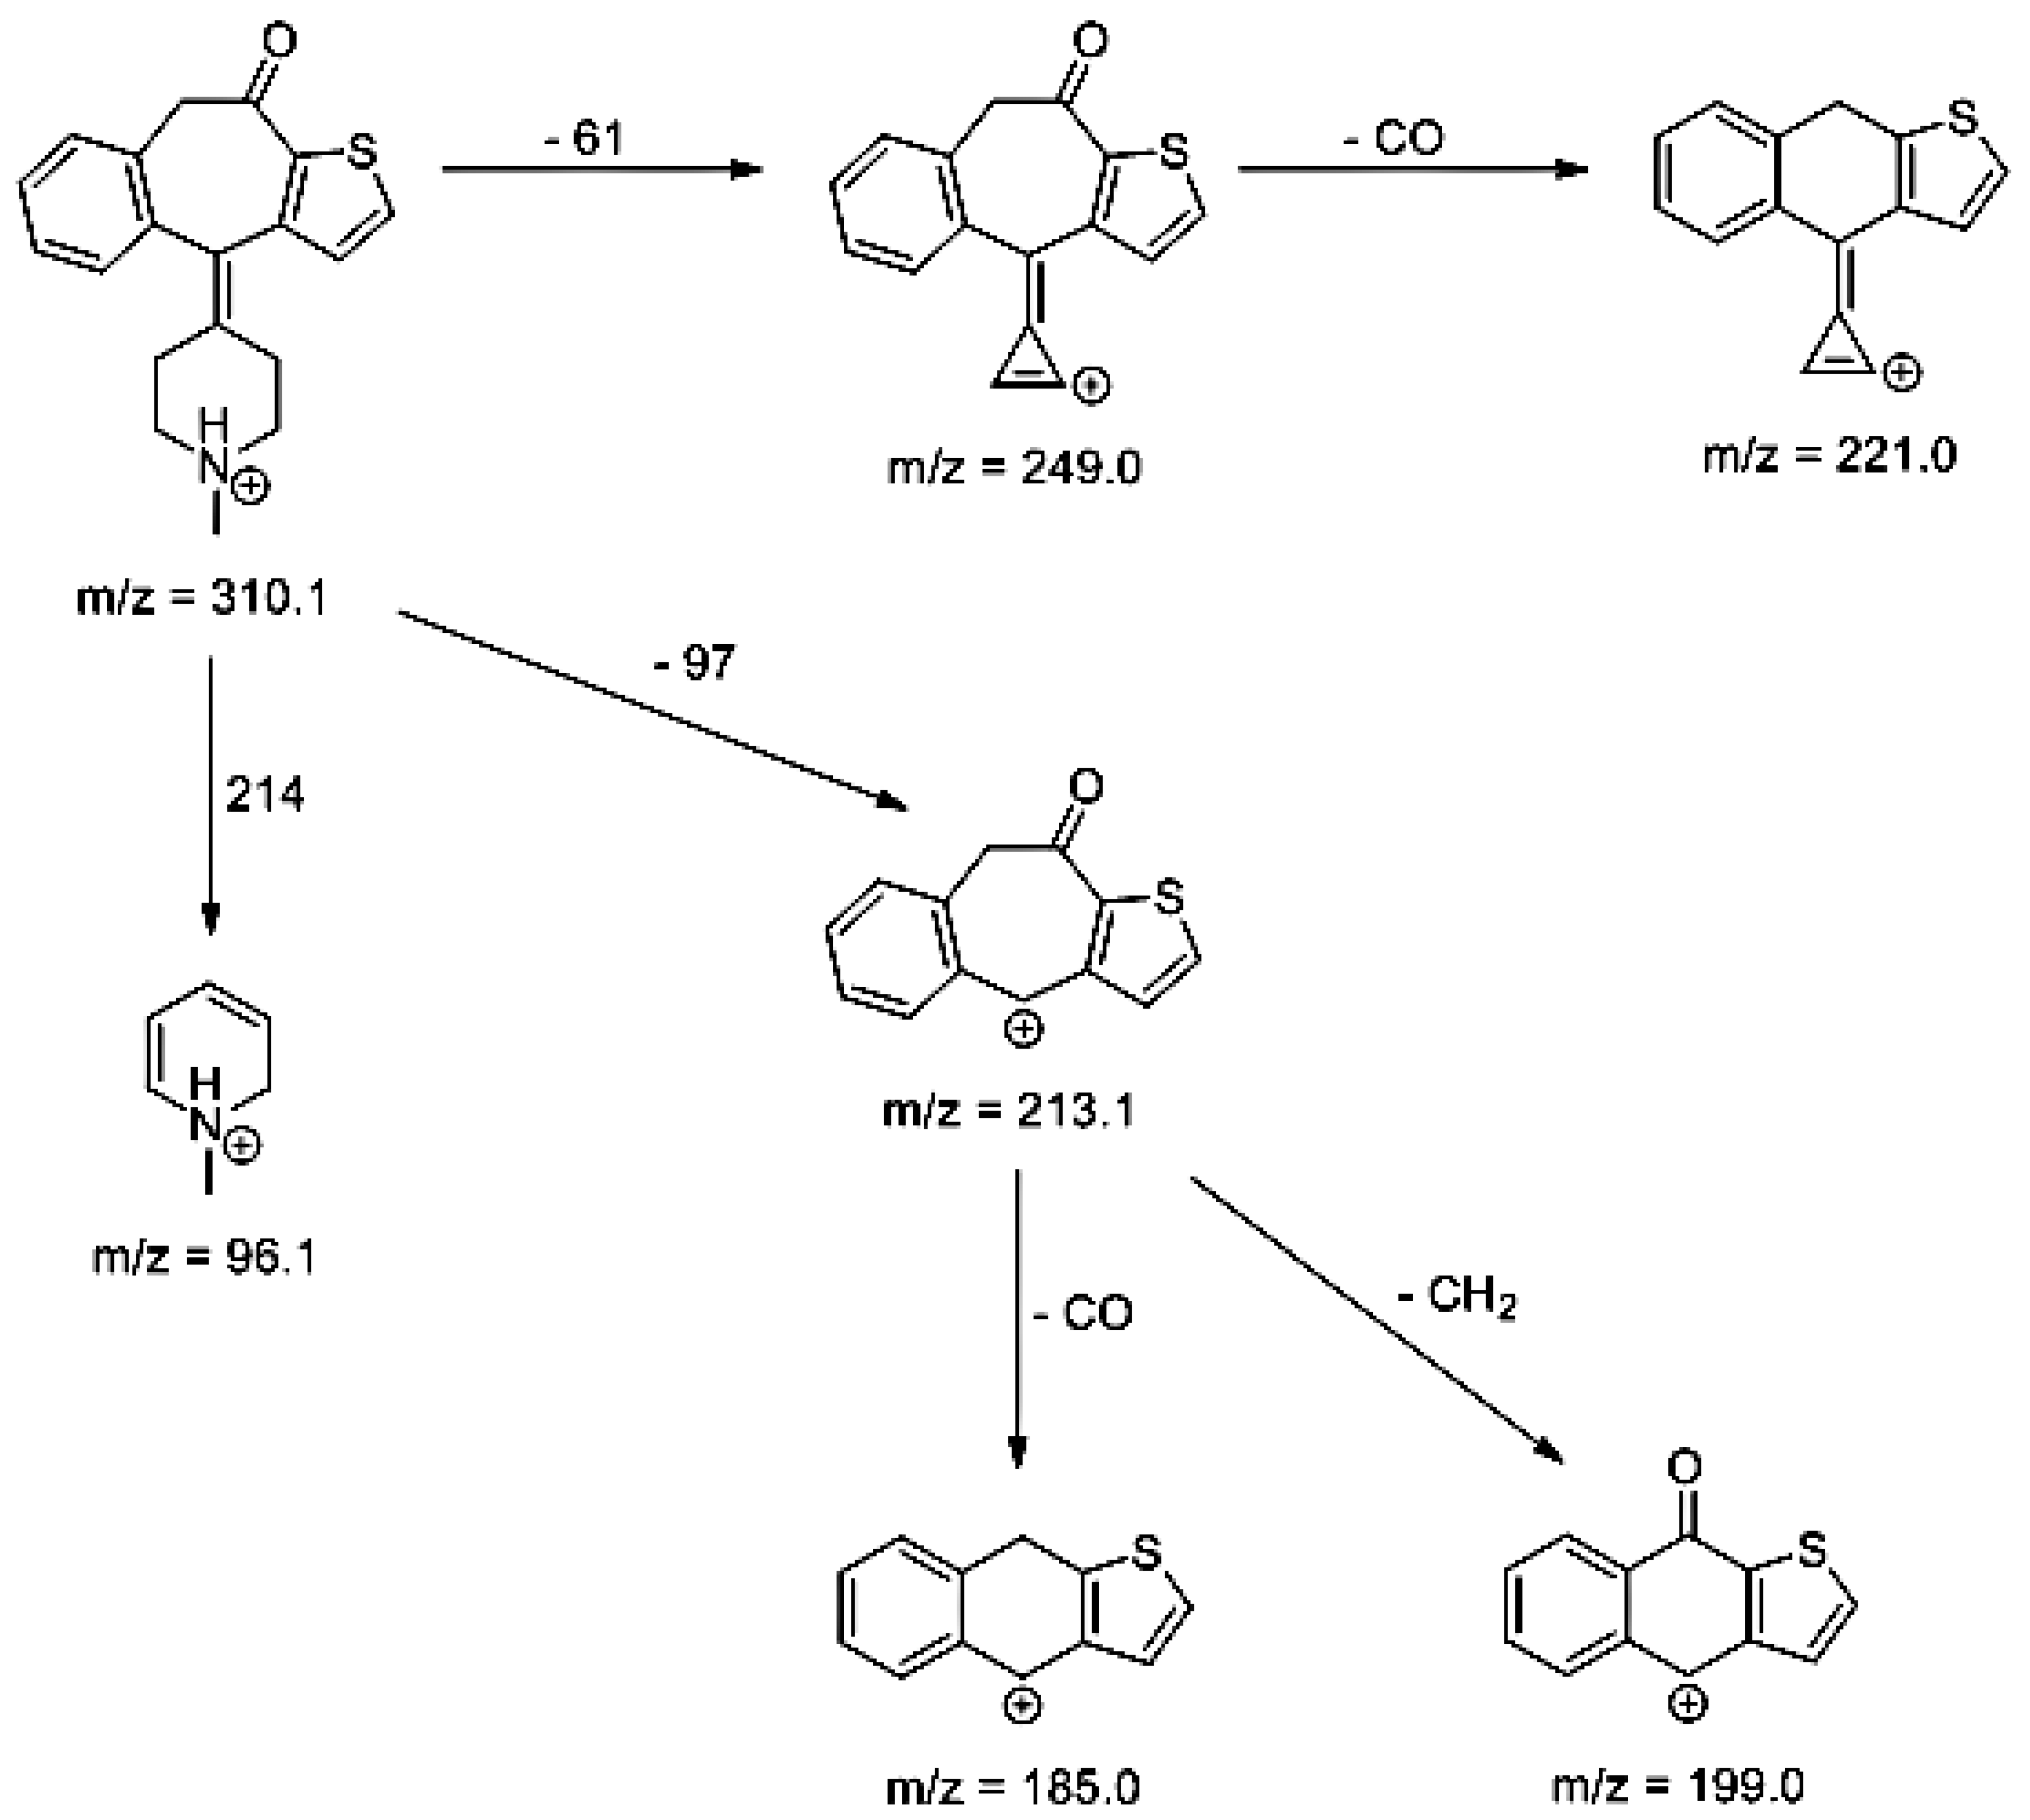
Lastly, KET showed a protonated molecule [M + H]
+ at
m/z 310.1 in the full scan mass spectra, while its MS/MS displayed product ions at
m/z 249.0, 213.1, and 96.1 (
Table 5). The subsequent steps in the fragmentation pathway of KET are shown in
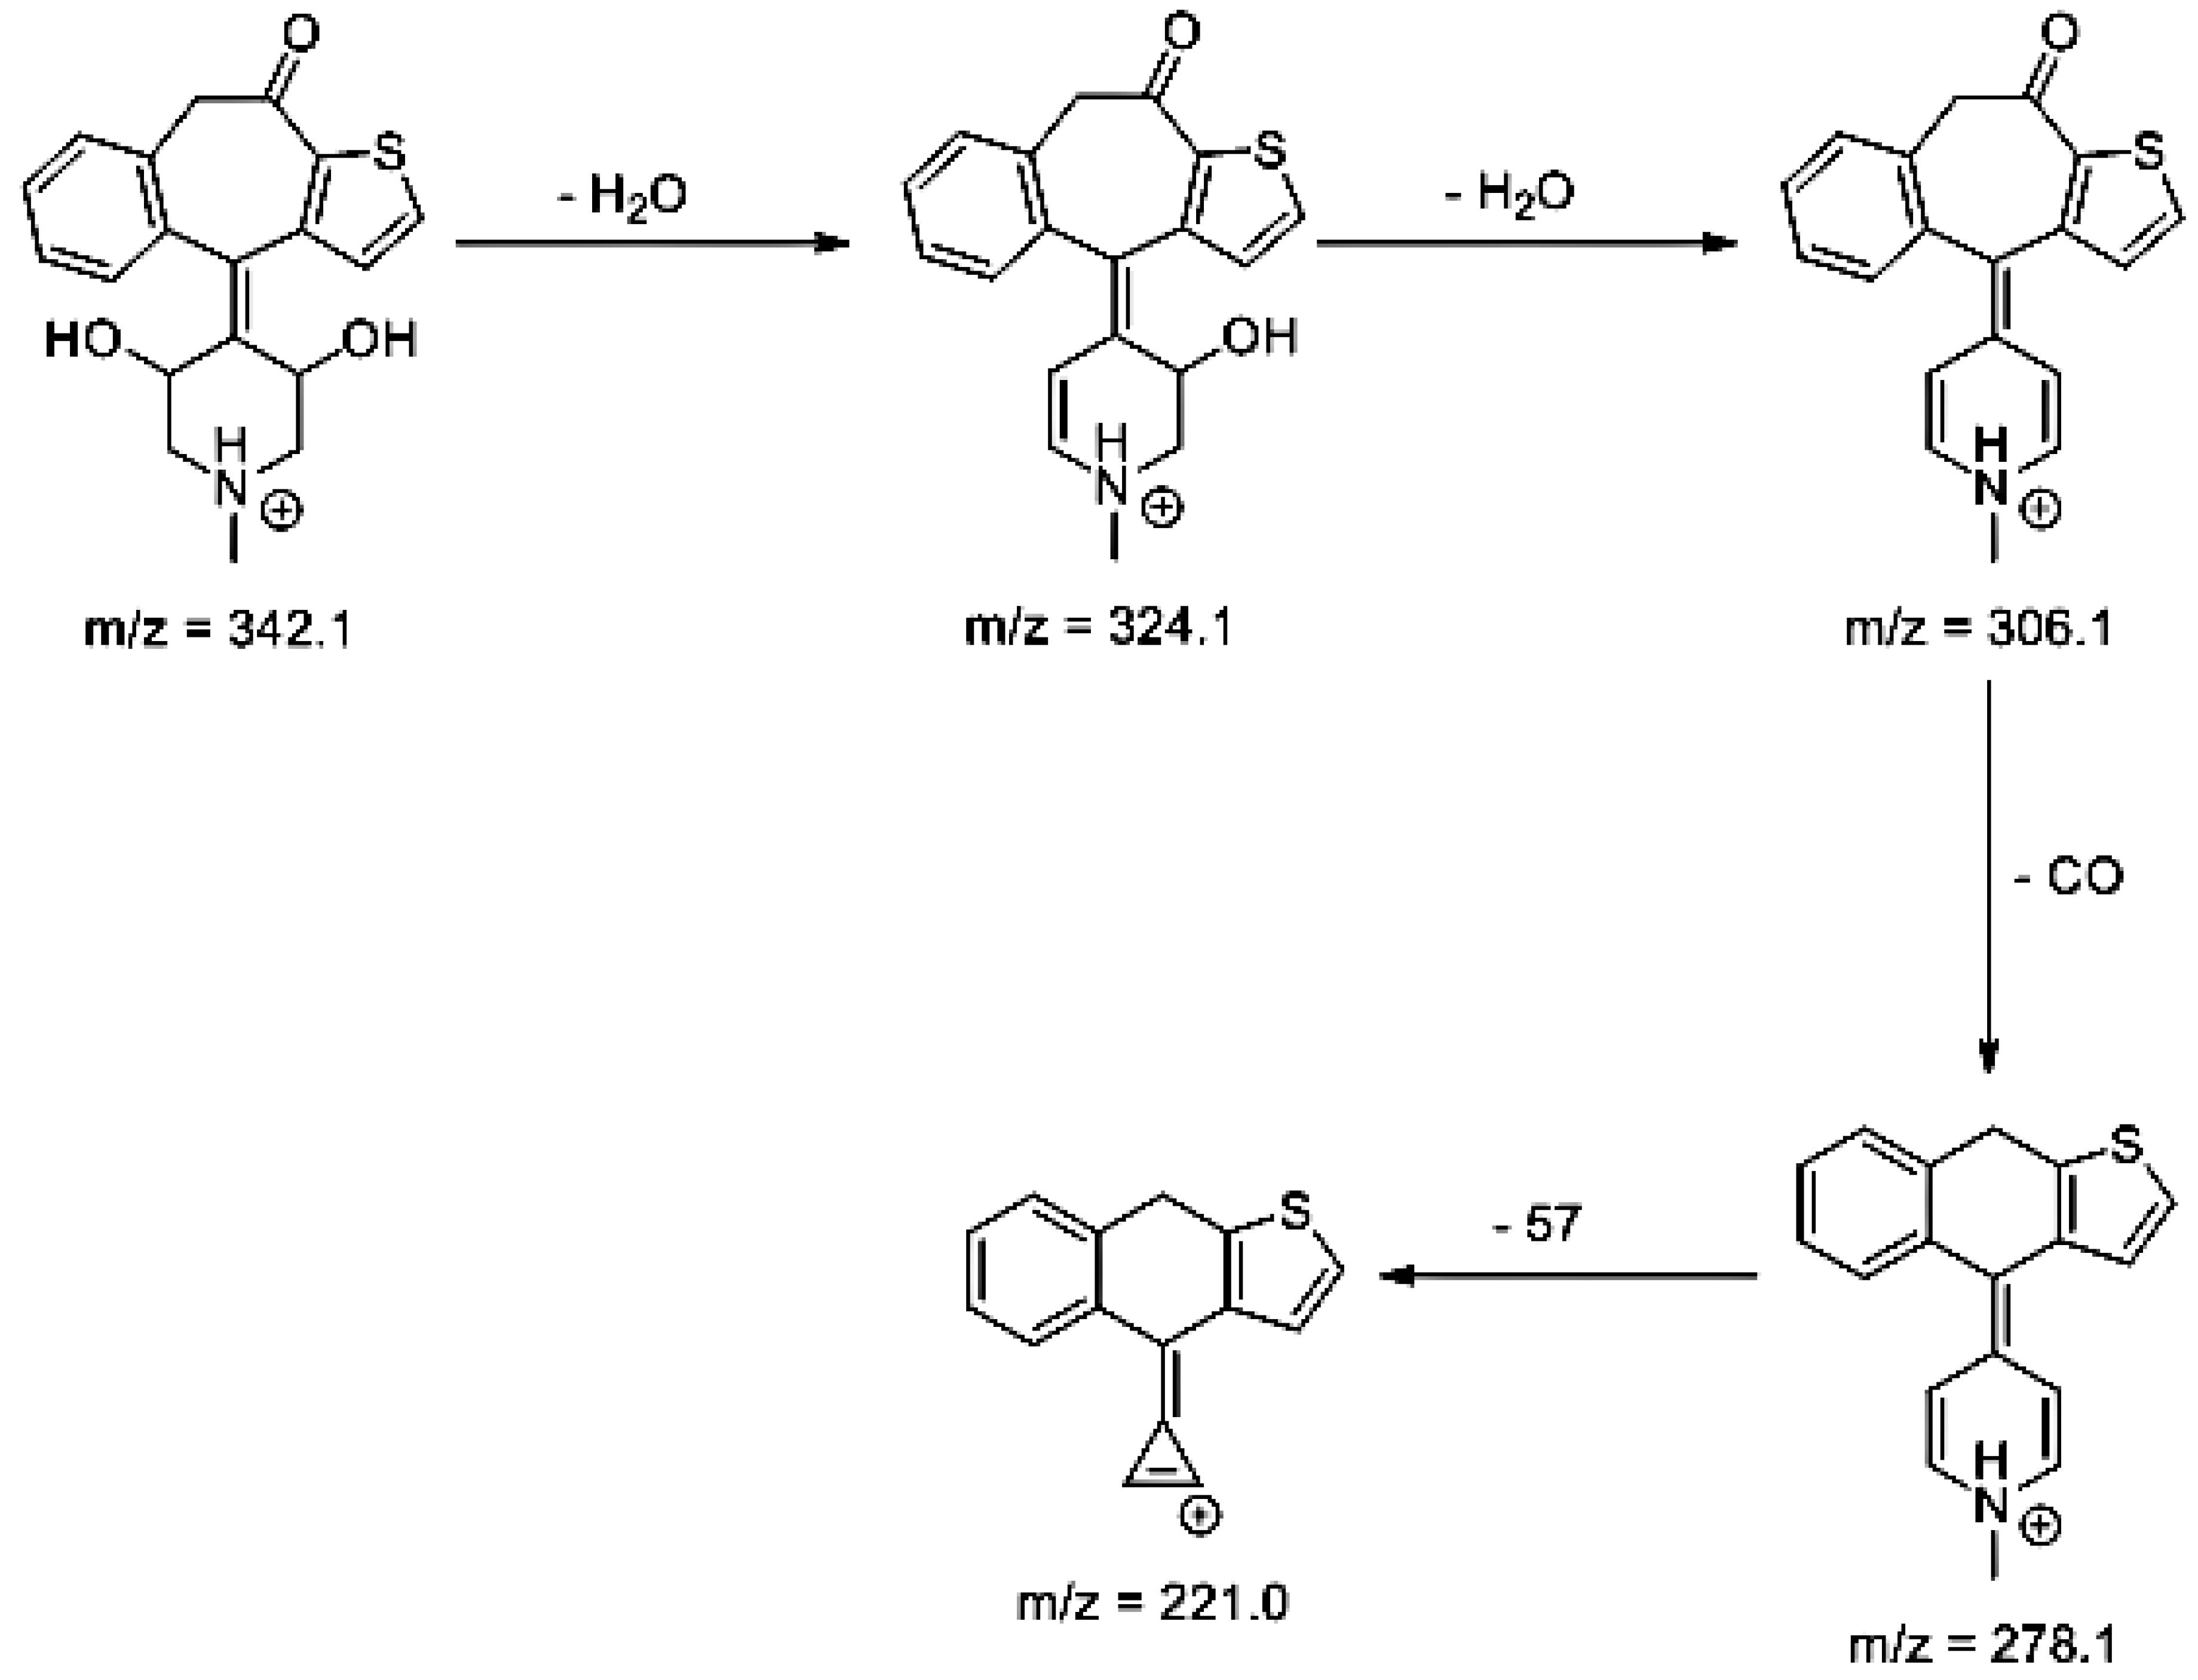
Figure 10. The drug was degraded in 14.64% at pH 3.0 and in 19.28% at pH 7.0. What is more, almost 100% degradation of KET was observed at pH 10.0. In all pH conditions degradation was found to affect the piperidine ring, leading to all of the identified products, i.e., KET-P1, KET-P2, and KET-P3, via its oxidation. Additionally, oxidation of the methyl substituent to a formyl moiety was observed at pH 3.0 (KET-P2) and demethylation of the nitrogen atom of the piperidine moiety was observed at pH 7.0 (KET-P3). The major ions formed during their MS/MS were
m/z 324.1, 306.1, 278.1, and 221.0 (KET-P1); 292.1, 263.2, 275.1, and 221.0 (KET-P2); and 324.1, 306.1 278.1, 250.1, and 221.0 (KET-P3). The respective fragmentation patterns and corresponding UPLC chromatogram are shown in
Figure 11,
Figure 12,
Figure 13 and
Figure 14.
3.6. ROS Assays
In the present experiments, the samples of EME, EPI, and KET were irradiated for 15, 30, and 45 min, and for 1, 3, and 7 h, which corresponded to energies equal to 675, 1350, 2025, 2700, 8100, and 18,902 kJ/m
2. Bearing in mind that the indicator setting value of 250 W/m
2 for 1 h achieved an intensity of UVA from 6.5 to 7.9 J/cm
2 for our CPS Plus chamber, the selected light energies comprised the range of 5–20 J/cm
2, which is recommended in all phototoxicity assays [
20,
22,
23]. To better verify our results, quinine and benzocaine were included in our ROS experiments as a positive and negative control, respectively.
As a starting point to evaluate the phototoxic potential of EME, EPI, and KET, the photosensitized lipid peroxidation was monitored using linoleic acid as a substrate. It is known from the literature that phototoxic drugs accelerate the peroxidation of lipids upon exposure to UV/Vis radiation [
22]. In addition, lipid peroxidation in the cellular membrane is considered to be one of the major mechanisms in drug-induced photoirritation [
22].
In the present study, lipid peroxidation was monitored as TBARs determination with MDA as a standard. The linearity between the level of MDA and the absorbance at 532 nm due to the product of MDA with TBA was investigated. The regression line equation calculated by the least squares method was y = 1.1287 ± 0.0056x + 0.0261 ± 0.0011, with a coefficient of correlation of r = 0.9997 ± 0.0005 (mean ± SD,
n = 5). On the basis of the above calibration equation, the number of TBARs generated under the irradiation of linoleic acid in the absence or presence of EME, EPI, and KET was determined. It was clearly shown that the peroxidation of linoleic acid was at the level of the control group when the drugs were absent. However, irradiation of the substrate in the presence of EME and KET produced a much larger number of TBARs. What is more, the results obtained for KET were similar to those of quinine, which is known to be a highly photoreactive substance. In contrast, the addition of EPI to linoleic acid increased peroxidation to a lesser extent, although the content of TBARs was higher than in the presence of benzocaine (a negative control) (
Table 6). At the same time, the obtained results were correlated with high values of MEC for EME and KET at wavelengths near 290 nm. Therefore, EME and especially KET can be considered to have a potent photoirritancy in vitro, on the basis of their ability to enhance the peroxidation of linoleic acid [
22].
According to the official guidelines [
20,
22], the phototoxic potential of drugs can be elucidated by monitoring ROS generation under exposure to UV/Vis radiation, as SO (type 2 photochemical reaction) and SA (type 1 photochemical reaction) generation. In our experiments, each drug was judged to be photoreactive when (a) SO values of 25 or more and SA values of 70 or more were measured; (b) SO values of less than 25, but SA values of 70 or more, were measured; and (c) SO values of 25 or more and SA values of less than 70 were measured. When SO values were lower than 25 and SA values were between 20 and 70, the drug was judged as weakly photoreactive [
22]. According to these criteria and the standard intensity of UVA from 6.5 to 7.9 J/cm
2, corresponding to 2700 kJ/m
2, EME and KET were identified as phototoxic drugs by mechanisms including ROS generation (SO > 25 and SA > 70). In contrast, EPI was judged as weakly photoreactive (SO < 25 and 20 > SA < 70) (
Table 6). Therefore, EME and KET would have substantial photoreactivity and could potentially cause phototoxic reactions in vivo, upon exposure to sunlight. The obtained results clearly show the necessity for further experiments concerning the phototoxicity of EME and KET, especially considering that they are more vulnerable to degradation when applied topically [
8].
Almost all antihistamines have been reported in the literature as causing hypersensitivity reactions, including their topical formulations. Shakouri and Bahna [
32] published a comprehensive review on antihistaminic allergies reported between 1949 and 2013. More than one hundred cases were identified, which included urticaria, angioedema, anaphylaxis, fixed drug eruptions, allergic contact, and photosensitive dermatitis, as well as generalized nonspecific rashes [
32,
33]. Therefore, our observations in vitro could be in agreement with the phototoxicity data from these clinical studies [
33].
Among different types of products, the stability of ophthalmic pharmaceuticals is the most important, since eyes are very sensitive. They are easily irritated if the composition of the ophthalmic pharmaceutical is not adequate [
34]. Therefore, ophthalmic pharmaceuticals must be suitably compounded and packaged for their application to the eye [
5]. The pH value is often the stability-controlling factor for many products, but it must be within a certain range because of the bioavailability of the drug [
34]. Our results clearly show the need for optimal pH selection for EME and KET, bearing in mind both of the questions presented above.

 ,
, 


