1. Introduction
Platelets are major drug targets in case of thromboembolic disorders. Pharmacological inhibition of platelet aggregation is necessary for preventing complications after an acute coronary syndrome (ACS) and the formation and progression of thrombotic processes. Adenosine diphosphate (ADP) is an important signal molecule for platelet function, which is involved in their physiological and pathological responses [
1]. The inhibition of ADP-induced platelet aggregation is an effective approach for treating thrombotic events in clinical practice. ADP binds to purinergic receptors P2Y1 and P2Y12 which are seven-transmembrane (7TM) G-protein-coupled receptor (GPCR) located in the platelet cell membrane [
2]. These receptors can be activated by extracellular nucleotides and trigger the completion of the platelet aggregation [
3,
4]. Therefore, ADP receptors are nowadays considered as the main targets for antiplatelet agents [
5]. The P2Y12 receptor is abundantly expressed in the platelet membrane [
6] and is a key player in primary hemostasis and arterial thrombosis, which makes it one of the most prominent drug targets for the inhibition of platelet aggregation [
5,
6].
Currently, two classes of P2Y12 antagonists have been developed and approved by the FDA as antiplatelet agents, namely the irreversible thienopyridines and the reversible ATP analogues. Thienopyridine compounds such as ticlopidine, clopidogrel, and prasugrel irreversibly inhibit P2Y12 receptor [
7]. They are prodrugs that must be metabolized in the liver [
8]. The active metabolite of clopidogrel and prasugrel covalently binds to cysteine residues of P2Y12 precluding the binding of ADP [
9,
10]. Reversible P2Y12 receptor antagonists are modeled after ATP as a scaffold [
11]. Ticagrelor is the compound from this group that is widely used in clinical practice [
11,
12]. It binds to the receptor directly without the need for hepatic bioactivation [
13], which results in a faster onset of action, less interindividual variation in effectiveness, and greater control of platelet aggregation inhibition [
14]. It is reported that the primary metabolite of ticagrelor is also active with potency equal to the parent compound [
12].
Limitations of existing drugs, such as a very long half-life of clopidogrel and adverse effects of ticagrelor [
11,
15], indicate that there is an unfulfilled demand for a new generation of P2Y12 inhibitors. Unfortunately, ligand recognition and the function of P2Y12 remain poorly understood at the molecular level due to unclear or even conflicting structure–activity relationship (SAR) data [
16,
17], which hampers the development of new inhibitors. It is well known that the lipids regulate the location and activity of many membrane proteins as well as forming lipid microdomains that control the localization and interactions of proteins involved in cell signaling [
18,
19]. Being an integral membrane protein, P2Y12 receptor is also likely to be influenced and regulated by its lipid environment. Particularly, the impact of ticagrelor on the lipid composition of platelet plasma membrane [
20] and the role of cholesterol on the activation of P2Y12 receptor was recently studied [
21]. It was shown that the location of P2Y12 in ordered lipid microdomains (“rafts”) is required during ADP-mediated platelet activation [
21]. Moreover, the active metabolite of clopidogrel breaks up the homooligomers of P2Y12 receptor into non-functional dimers and monomers that are located outside of lipid rafts [
10]. The effect of ADP and ticagrelor on the detergent-resistant membrane (DRM) was also examined recently [
22].
Experimental studies of the influence of lipid environment on membrane proteins are complex, tedious, and time consuming, which recently boosted the development of computational approaches to this problem. In the case of P2Y12, early numerical studies [
23,
24] were pushed forward by resolution of the crystallographic structures of the P2Y12 complexed with the full agonist 2-methylthioadenosine-5′-diphosphate (2MeSADP, PDB ID: 4PXZ), with the partial agonist 2-methylthio-adenosine-5′-triphosphate (2MeSATP, PDB ID: 4PY0) [
25] and with the antagonist ethyl 6-(4-((benzylsulfonyl)carbamoyl)piperidine-1-yl)-5-cyano-2-methylnicotinate (AZD1283, PDB ID: 4NTJ) [
25]. These structures differ substantially by the conformation of transmembrane helix 6 (TM6). In the agonist-bound 4PXZ, this helix is bent inwards toward the active site (this structure will be referred as “closed” hereafter). In antagonist-bound 4NTJ, this helix is straight, and the active site is significantly more exposed (this structure will be called “open” hereafter). These large-scale rearrangements in the highly malleable extracellular regions are required to allow agonist accessing the binding pocket. The previous structural and docking studies [
26] were not able to provide valuable insight into the pharmacology and mechanisms of action of agonists and different classes of antagonists because they were performed before these structural differences become known. For instance, ticagrelor could not be docked into a pose similar to one of 2MeS-ADP because the presence of bulky N6 substituents would cause a steric clash with the helixes V and VI [
26].
Recently, an extensive molecular docking study of the major classes of substances, previously reported as P2Y12 ligands, was performed [
27]. The authors tried to rationalize the main SAR findings previously reported for each class of the ligands. It was shown that antagonists such as ureas, sulfonylureas, sulfonamides, anthraquinones, and glutamic acid piperazines docked readily to the antagonist-bound P2Y12 structure, while various nucleotide derivatives docked readily to the agonist-bound structure. However, they were unable to dock ticagrelor to the agonist-bound P2Y12 structure. The “hybrid” receptor resembling the agonist-bound P2Y12 except for the top portion of TM6, which was taken from the antagonist-bound P2Y12 structure, was necessary for successful ticagrelor docking. This example shows the limitations of available P2Y12 models and emphasizes a need for more elaborate computational studies, which take into account protein mobility and conformational changes in its native membrane environment.
In the present study, we propose the most realistic computational model of P2Y12 available to date. First, we consider the receptor in its native lipid bilayer environment. The dynamics of the receptor is investigated as a function of bilayer composition. Phosphatidylcholine (PC), sphingomyelin (SM), and SM/cholesterol mixture (referred as “raft” hereafter) environments are studied. Second, both agonist and antagonist-bound crystal structures are used as initial conformations in each lipid environment. Third, an extensive ensemble docking analysis is made on a representative set of simulation snapshots extracted from equilibrated molecular dynamics (MD) trajectories, which takes into account both the local flexibility of the binding site and the large-scale protein motions. This methodology was already used with great success for the proteins with complex internal dynamics, such as STAT1/STAT3 [
28,
29] and human serum albumin [
30,
31].
We demonstrate that the lipid environment imposes significant constraints into the dynamics and internal flexibility of P2Y12, which in turn influences its binding to a variety of ligands. In general, the more ordered the lipid environment, the higher the binding propensity of P2Y12 to all studied ligands. The bulky nucleotide ligands, such as ticagrelor, can access the binding pockets of both agonist and antagonist-bound P2Y12 conformations with the help of internal protein dynamics.
3. Results and Discussion
3.1. Protein Structure and Flexibility
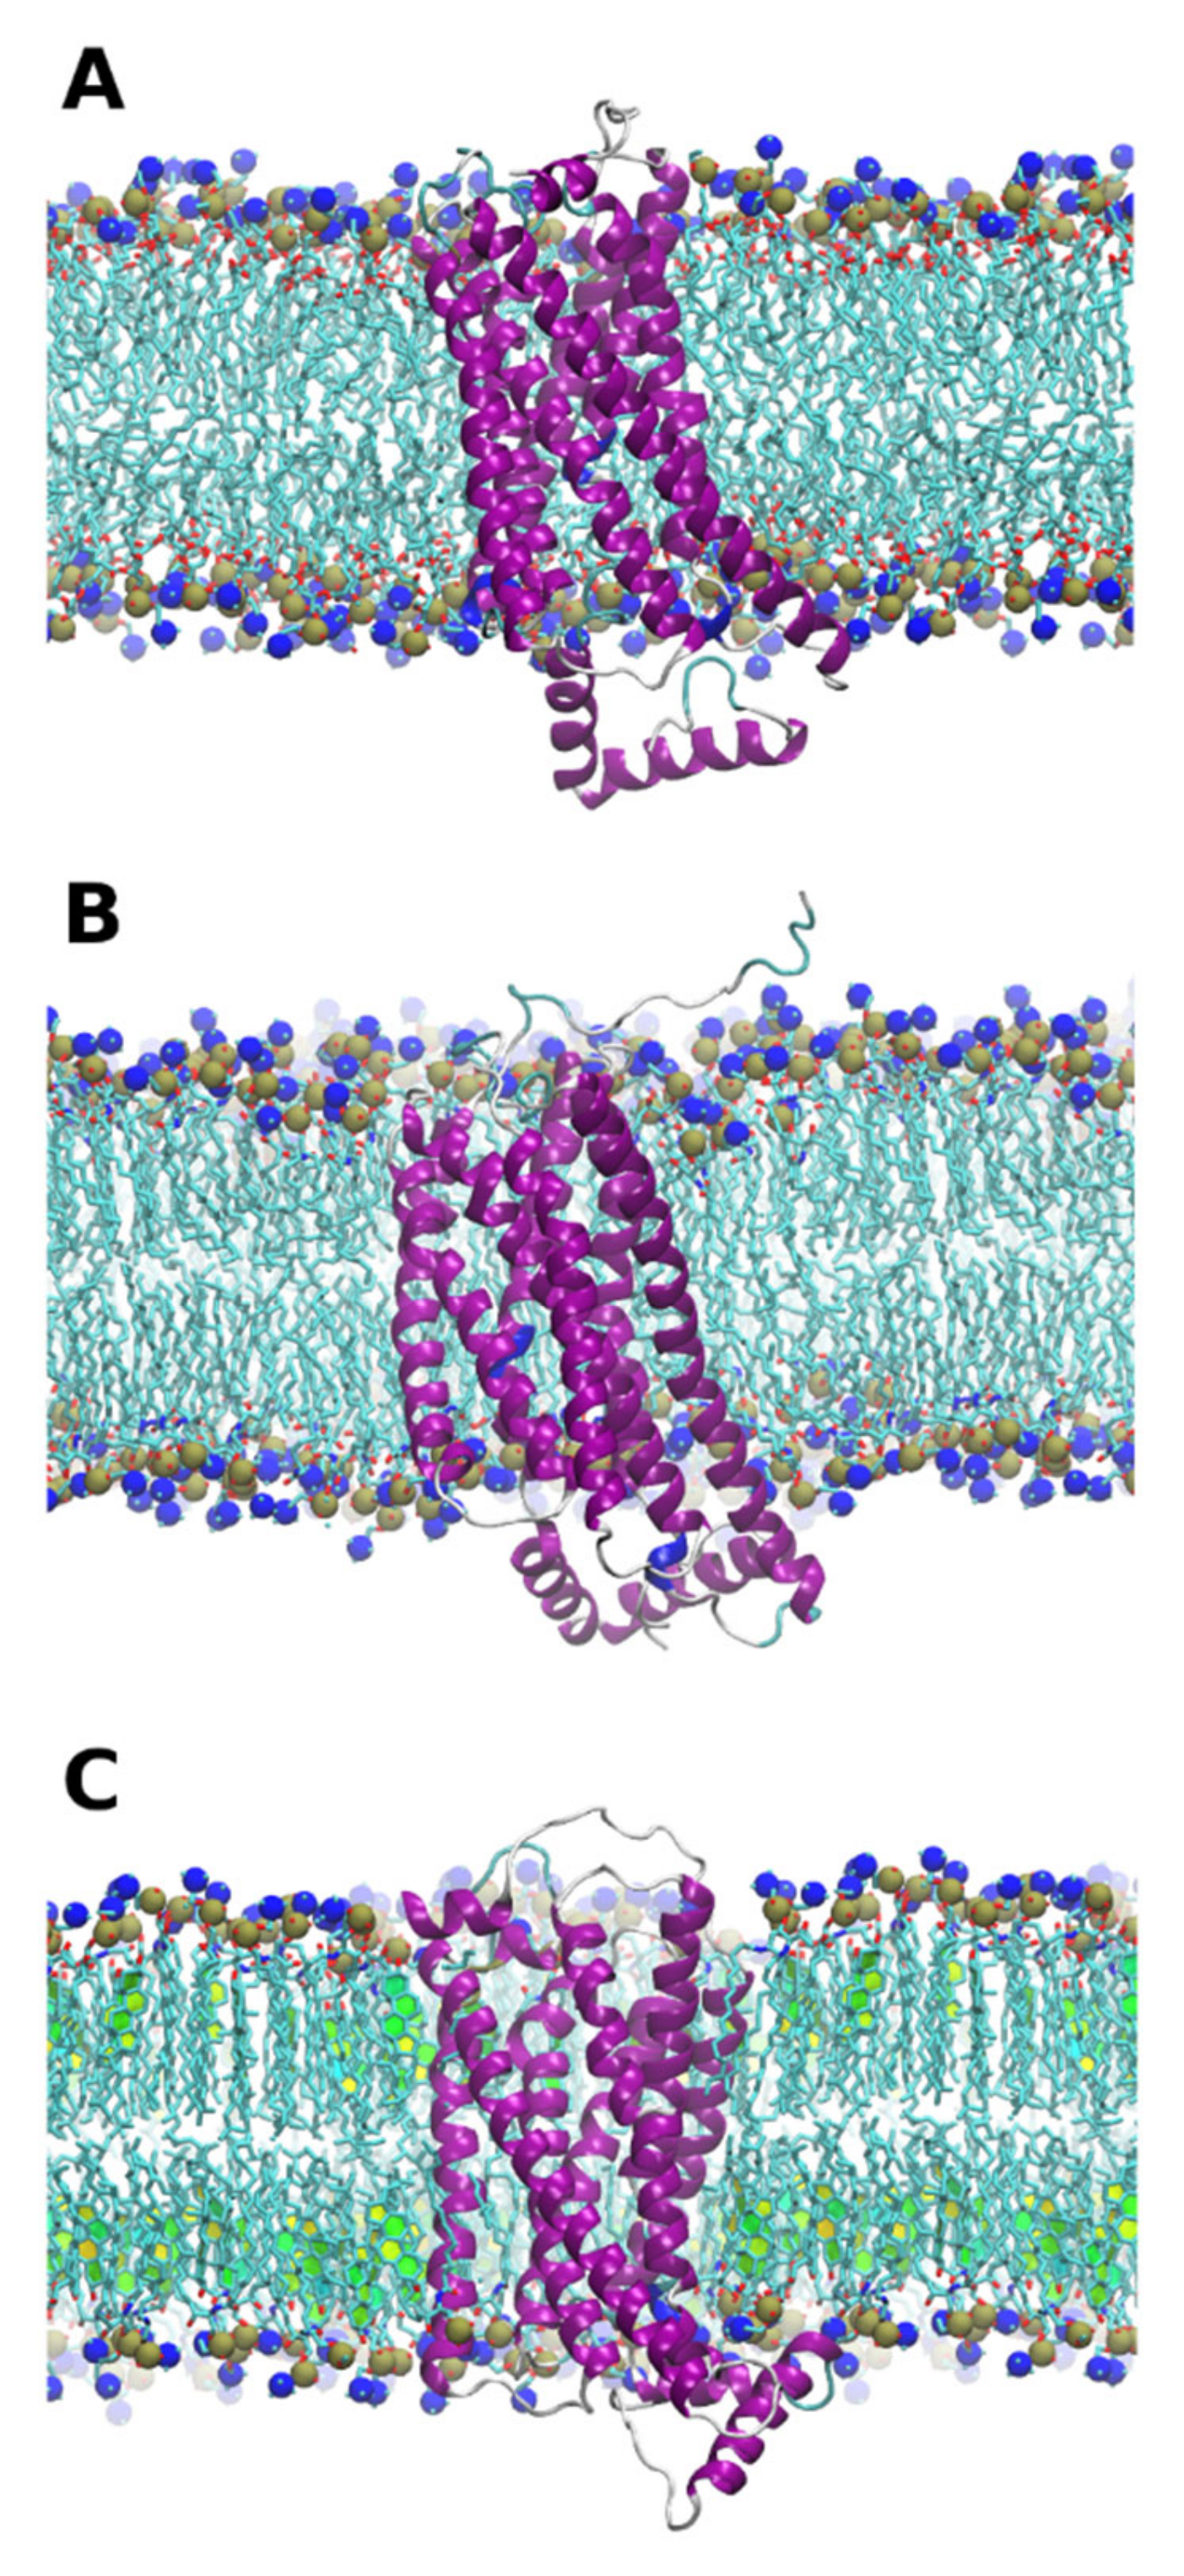
Both open and closed forms of the protein were found to be stable in all membrane environments (
Figure 1). However, some differences are worth to be noted, as evident from the analysis of RMSD plots (
Supplementary Figure S1).
First, the equilibration of the protein was significantly longer for the open form than for the closed one. It took up to 400 ns for the open structure in a raft environment. In contrast, the closed form equilibrated in only 200 ns in all three membrane environments. This suggests that the closed crystal structure is closer to equilibrium conformation in a native membrane environment than the open one. Second, the final RMSD for the transmembrane region is less than ≈0.3 nm in the closed form and less than ≈0.5 nm in the open form. These are rather small values for a protein of this size. This means that the structure of the transmembrane part of the protein is in general quite rigid and is not prone to dramatic conformational changes in the course of simulations. The same trend is observed for the active site of the protein, which suggests that the dynamic of the active site is not significantly different from the rest of the protein. The protein termini (residues 1–19 and 301–342), which are exposed to aqueous solution, fluctuate randomly and interact with the membrane transiently. The interaction energies of N and C-terminal regions of the protein with the membranes are shown in
Figure S2. The C-terminal domain of P2Y12 binds much stronger to the POPC membrane in both closed and open protein forms in comparison to other membrane compositions. Due to limited sampling, it is not possible to deduce whether this observation is a random coincidence or a systematic effect, but it does not correlate with the overall protein flexibility, behavior of its active site, or the binding propensity of the ligands. Thus, our simulations provide no evidence of a possible direct or indirect influence of the protein termini on the ligand binding and the flexibility of the transmembrane region of P2Y12. Despite overall stability, the protein structure is by no means “frozen” and exhibits enough local conformational mobility as it is evident from the root mean square fluctuations per residue (RMSF), which was computed for the last 50 ns of production trajectories (
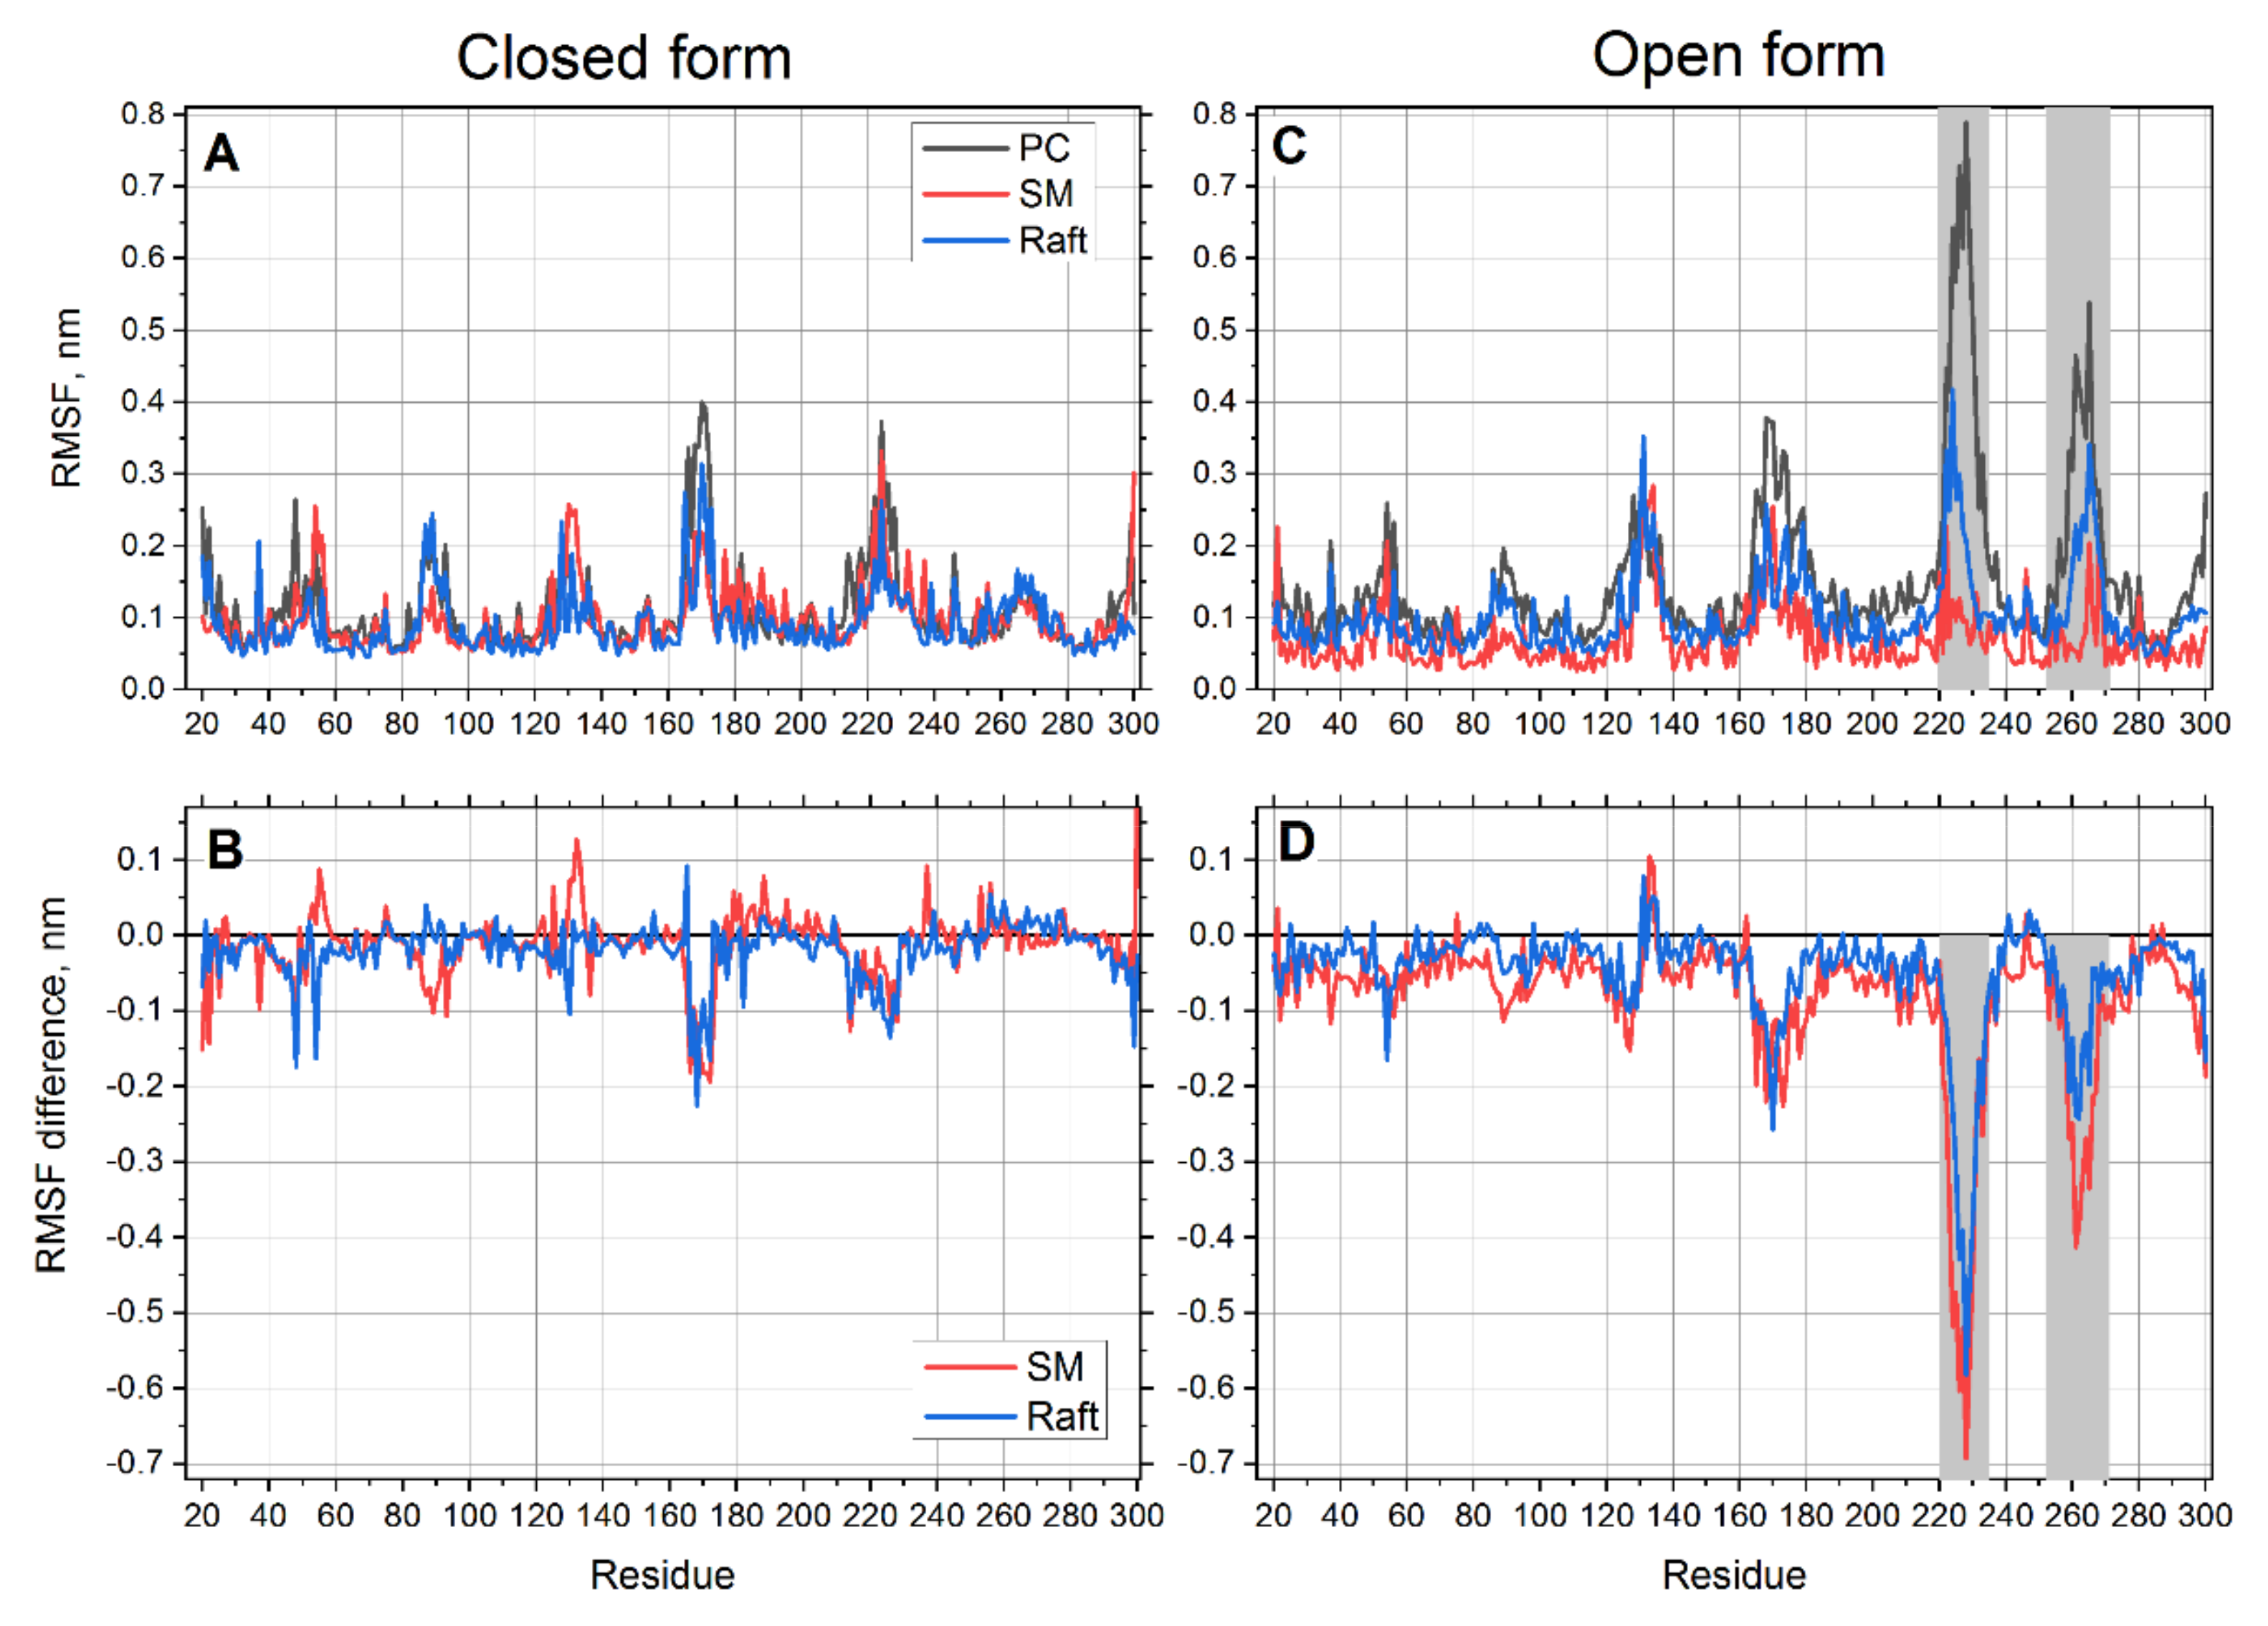
Figure 2).
The pattern of root mean square fluctuations (RMSFs) in the closed form of the receptor is very similar in all lipid environments (
Figure 2A). However, some notable differences could be better visualized on a difference plot, where the data in the PC membrane are used as a reference. The differences of RMSFs in SM and raft membranes from the PC reference are plotted in
Figure 2B. It is clearly seen that the RMSFs in both SM and raft membranes are slightly smaller than those in the PC membrane (the values are mostly negative). This trend is more pronounced for the raft mixture. This shows that the closed form is more rigid in the SM and raft environments.
The fluctuations of the open form are more interesting. This structure appears as rigid as the closed one except for two distinct regions (residues 252–269 and 220–235), which are much more flexible than the rest of the protein (
Figure 2C). Interestingly, the first region 252–269 corresponds exactly to the transmembrane helix 6 (TM6). This finding corroborates well with the fact that the most noticeable difference between open and closed crystal structures is observed for TM6 [
25,
26] The other region 220–235 corresponds to the protruding loop on the intracellular side of the protein (
Figure 3). Another interesting feature is that flexibility of these two regions in the open form of the receptor varies according to the lipid environment (
Figure 2C,D). The protein is found to be the most flexible in PC membrane and significantly less flexible in SM and raft membranes. The smallest flexibility is observed in the SM membrane but not in the cholesterol enriched membrane. This correlates with much smaller RMSD and much faster equilibration of the open form of protein in the SM membrane (
Figure 2A,B). The drastic decrease of flexibility in SM is more than three times more pronounced than in the case of the closed form of receptor in the regions 220–235 and 252–269 (
Figure 2D).
Figure 3 visualizes these regions in the aligned crystal structures of the closed and open forms of the receptor.
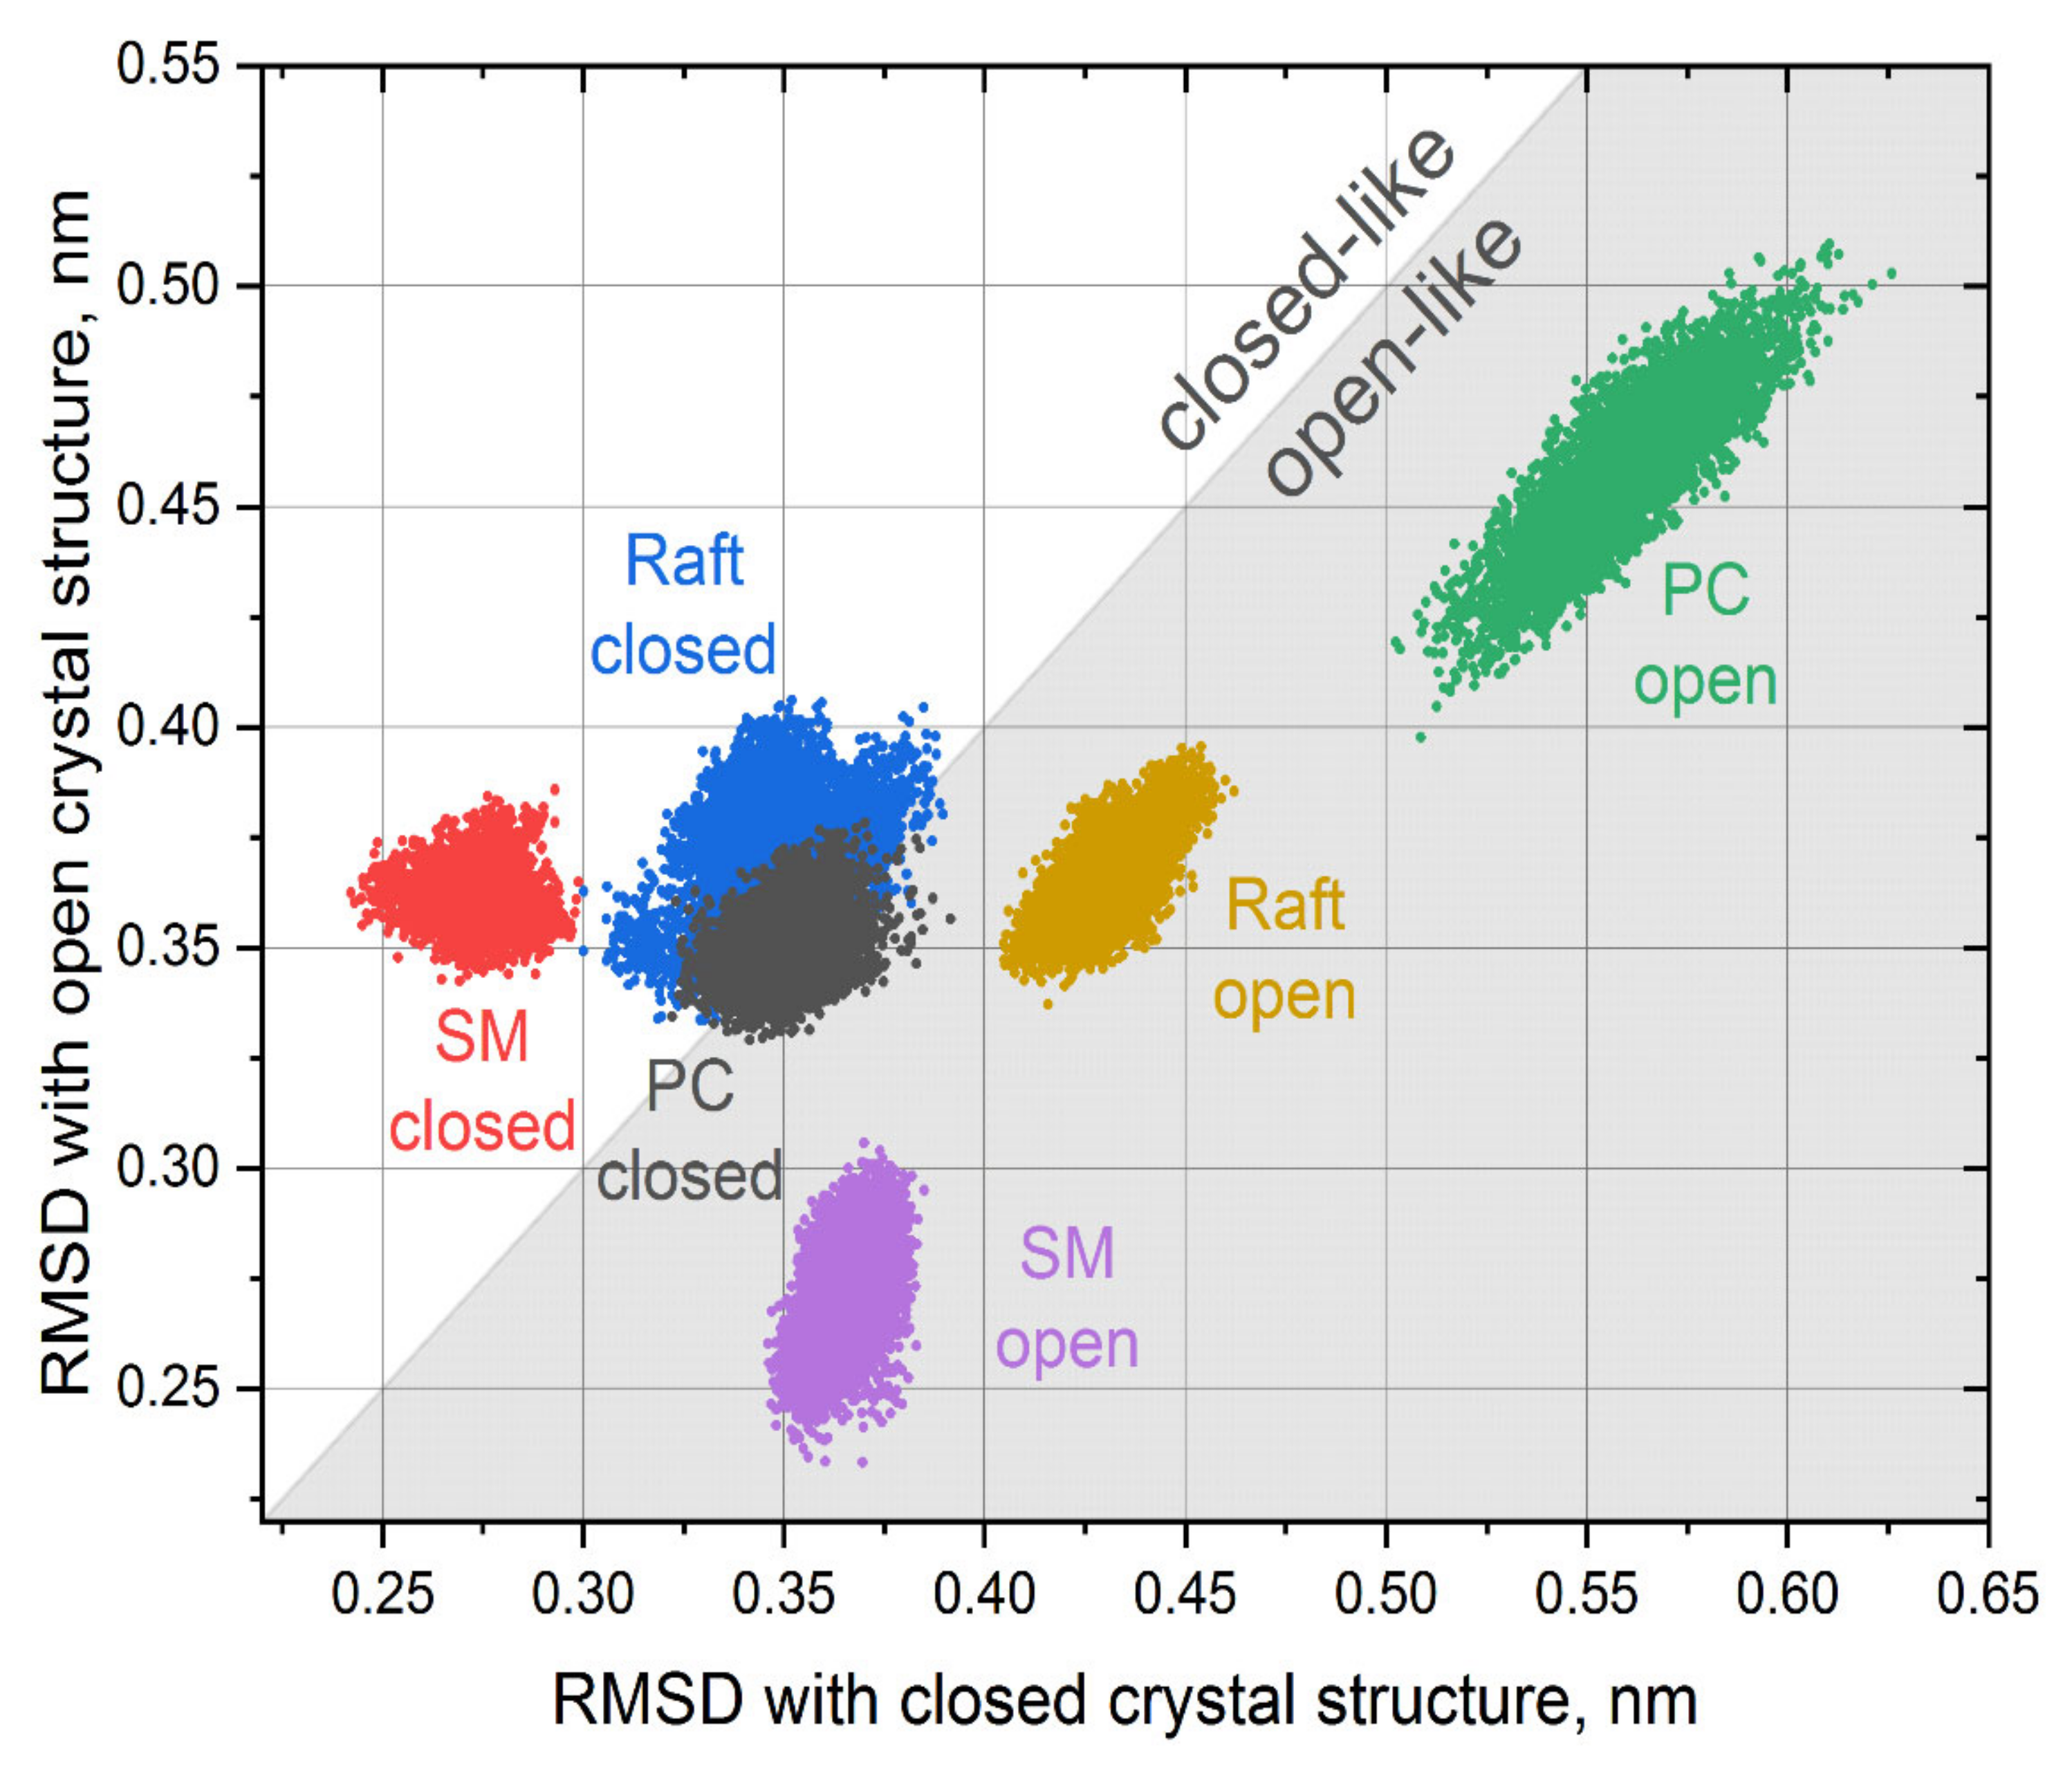
We performed an in-depth analysis of the conformational mobility of TM6 by computing the RMSD of the region 252–269 with both closed and open crystal structures of P2Y12 after alignment on the rest of the membrane core of the protein (residues 20–300). Only equilibrated parts of the trajectories were used for analysis. The results are shown in
Figure 4.
The conformation of TM6 helix was stable in all simulations experiencing only slight fluctuations, which is obvious from well-localized clouds of points corresponding to each trajectory. In the simulations that started from the closed structure, the orientation of the TM6 helix evolved significantly in the cases of PC and raft environments and stabilized in very similar intermediate conformations between closed and open crystal structure (overlapping gray and blue clouds in
Figure 4 are close the diagonal). In the case of the SM environment, the conformation of TM6 remained closer to initial closed structure (red cloud in
Figure 4) and is distinct from the other two environments.
The behavior of the TM6 in the simulations, which started from the open structure, differs significantly. Each environment possesses its own unique conformation of the TM6, which are quite different from each other. In the case of the PC environment, the conformation of the MT6 drifted quite far away from both closed and open structures (green cloud in
Figure 4). In the cases of raft and SM environments, the deviations from the crystal structures are smaller. It is interesting that both clouds corresponding to SM environments (red and pink) are almost perfectly symmetric in respect to the diagonal, and the TM6 conformation in this environment remains close to initial ones (either closed or open). This suggests that the protein is the most rigid and less prone to conformational changes in the SM environment, which is in agreement with RMSF data in
Figure 2.
We did not see any spontaneous transitions between open-like and closed-like conformations of the TM6 in our simulations. However, we observed the multitude of its conformations, which strongly depend on initial conditions and the lipid environment. This allows us to speculate that the TM6 may behave as a flexible “gate”, especially in a less ordered lipid environment, which allows a large conformational mobility of P2Y12. The time scale of these gating motions is likely to be far beyond the length of trajectories in this study and requires extensive dedicated simulations to be detected directly.
We also analyzed the dynamics of the P2Y12 binding pocket directly by means of the principal components analysis. The three top principal components corresponding to the largest eigenvalues were computed for each system. All atoms of the residues contributing to the binding pocket were used after aligning trajectory frames to the average conformation of the P2Y12 transmembrane core. The normalized overlaps between the covariance matrices were computed between different simulated systems (
Supplementary Table S2). There is no significant overlap of the top principal components in any pair of simulated systems—all normalized overlaps are in the range 0.2–0.33 (one means that the principal components are identical, while zero means that they are completely different). There is no clear correlation between the principal component overlaps and the fluidity of the membrane environment or initial protein form. Thus, our relatively short simulations do not allow mapping the influence of the membrane environment directly onto the motions of the protein binding pocket. Much longer simulations, which sample characteristic motions of the pocket better, may succeed in this.
It is possible to conclude that the decrease of membrane fluidity and increase of the membrane ordering leads to a general decrease of the protein flexibility. This effect is much more pronounced for the open form of the protein. Particularly, the flexibility of TM6 (residues 252–269), which is responsible for the key structural differences between open and closed states, decreases up to 40% in an SM environment and up to 25% in a raft environment. The flexibility of the intracellular loop region 220–235 decreases up to 70% in the SM environment and up to 60% in the raft environment. This points out the importance of the lipid environment on the flexibility of this protein. It also proves that the models of P2Y12, which do not take into account of their lipid environment, could lead to artifacts.
3.2. Docking Results
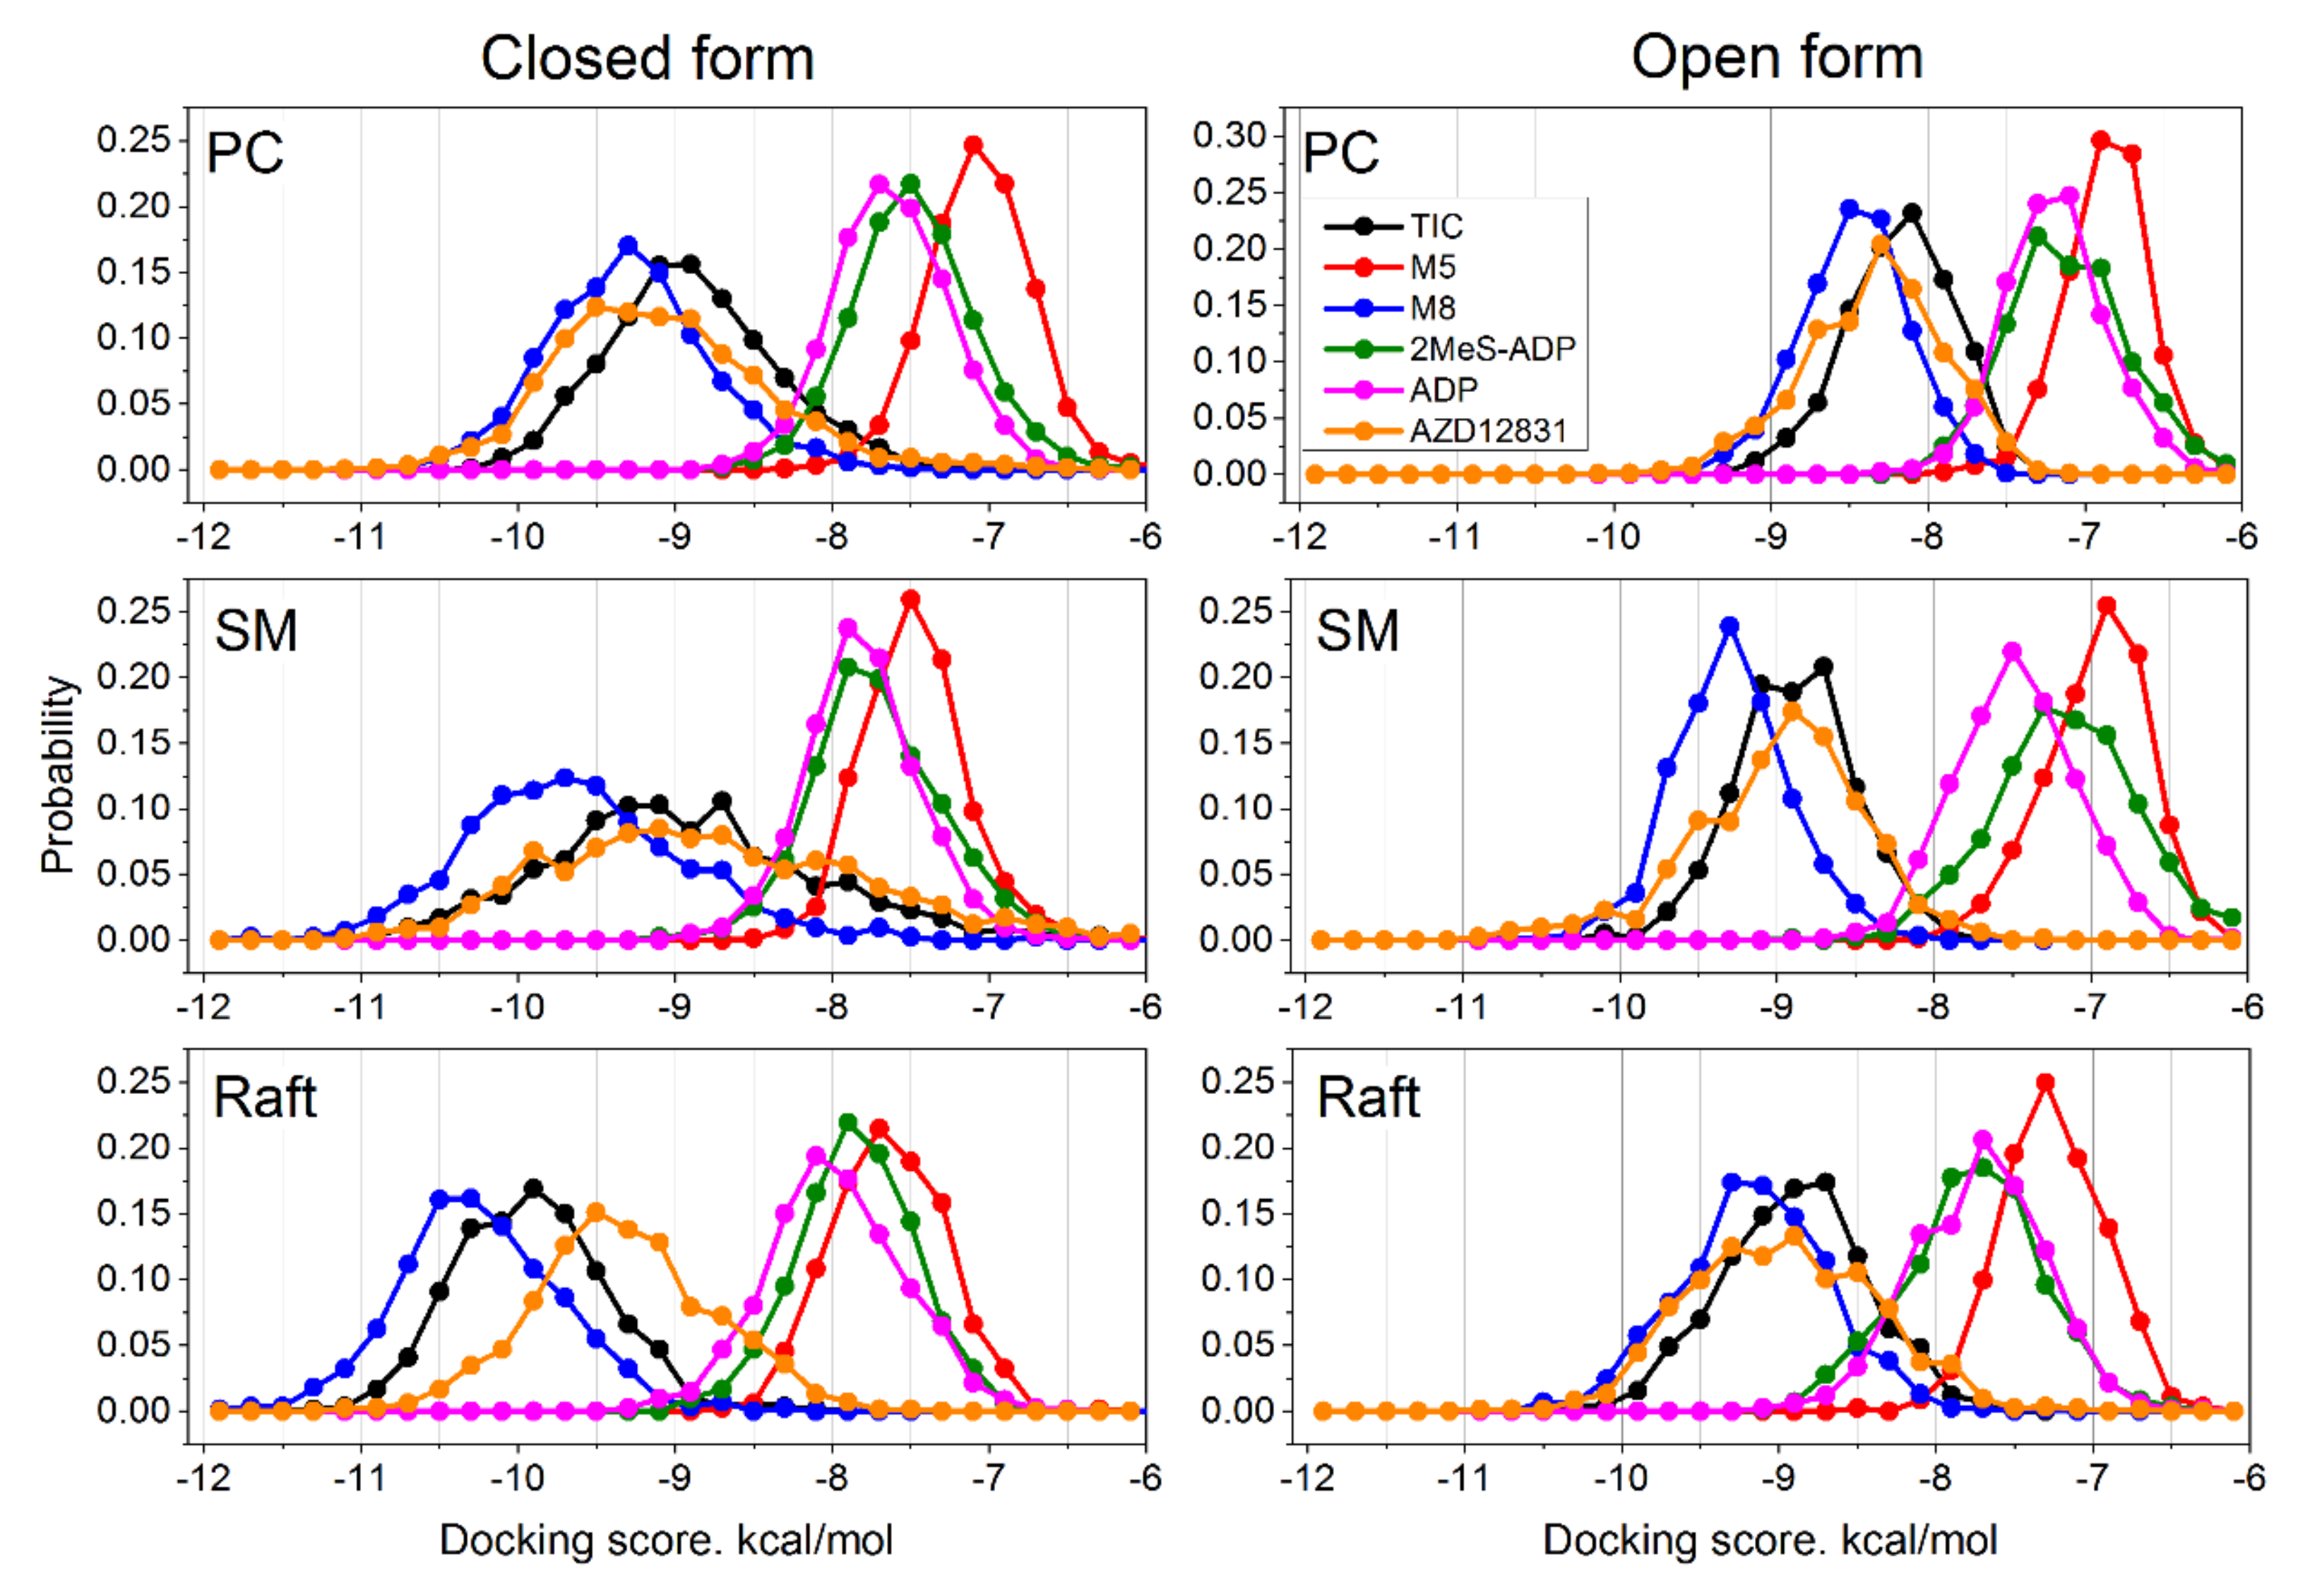
The ensemble docking utilized in this study allowed us to sample multiple conformations of the protein for each ligand. It takes into account changes of the protein flexibility in each of the studied lipid environments. The distributions of obtained docking scores are shown in
Figure 5.
The first remarkable feature is the binding scores of TIC and its metabolites. It is clearly seen that the active metabolite M8 shows stronger binding than pristine TIC (the distribution is shifted to the left) in all membranes and in both protein conformations. The other metabolite M5 shows dramatically worse binding than TIC (the distribution is shifted to the right substantially). The difference between the peaks of TIC and M8 distributions is ≈0.3–0.5 kcal/mol, while the difference between TIC and M5 is ≈2–2.5 kcal/mol in all membranes. This feature corroborates well with the experimental data, which show that the primary metabolite of ticagrelor (M8) is also active with potency equal to the parent compound [
12].
The specific agonist 2MeS-ADP binds a bit worse than pristine ADP in most cases; the difference between them varies from zero to ≈0.5 kcal/mol. This difference is systematic and thus unlikely to be an artifact of our docking methodology, but its relevance for the real receptor is not clear. The binding energy of the AZD1283 antagonist varies from one system to the other but remains comparable to or slightly better than that of TIC and much better than that of ADP. One notable exception is the raft membrane in closed form, where AZD1283 binds ≈0.5 kcal/mol weaker than TIC.
In general, the binding scores of TIC, its active metabolite M8, and AZD1283 are better than those of ADP, which means that these compounds could serve as concurrent antagonists. This correlates well with the experimentally observed action of these compounds. There is a strong and systematic influence of the lipid environment on the ligand binding—the binding of all ligands becomes stronger as the membrane rigidity increases.
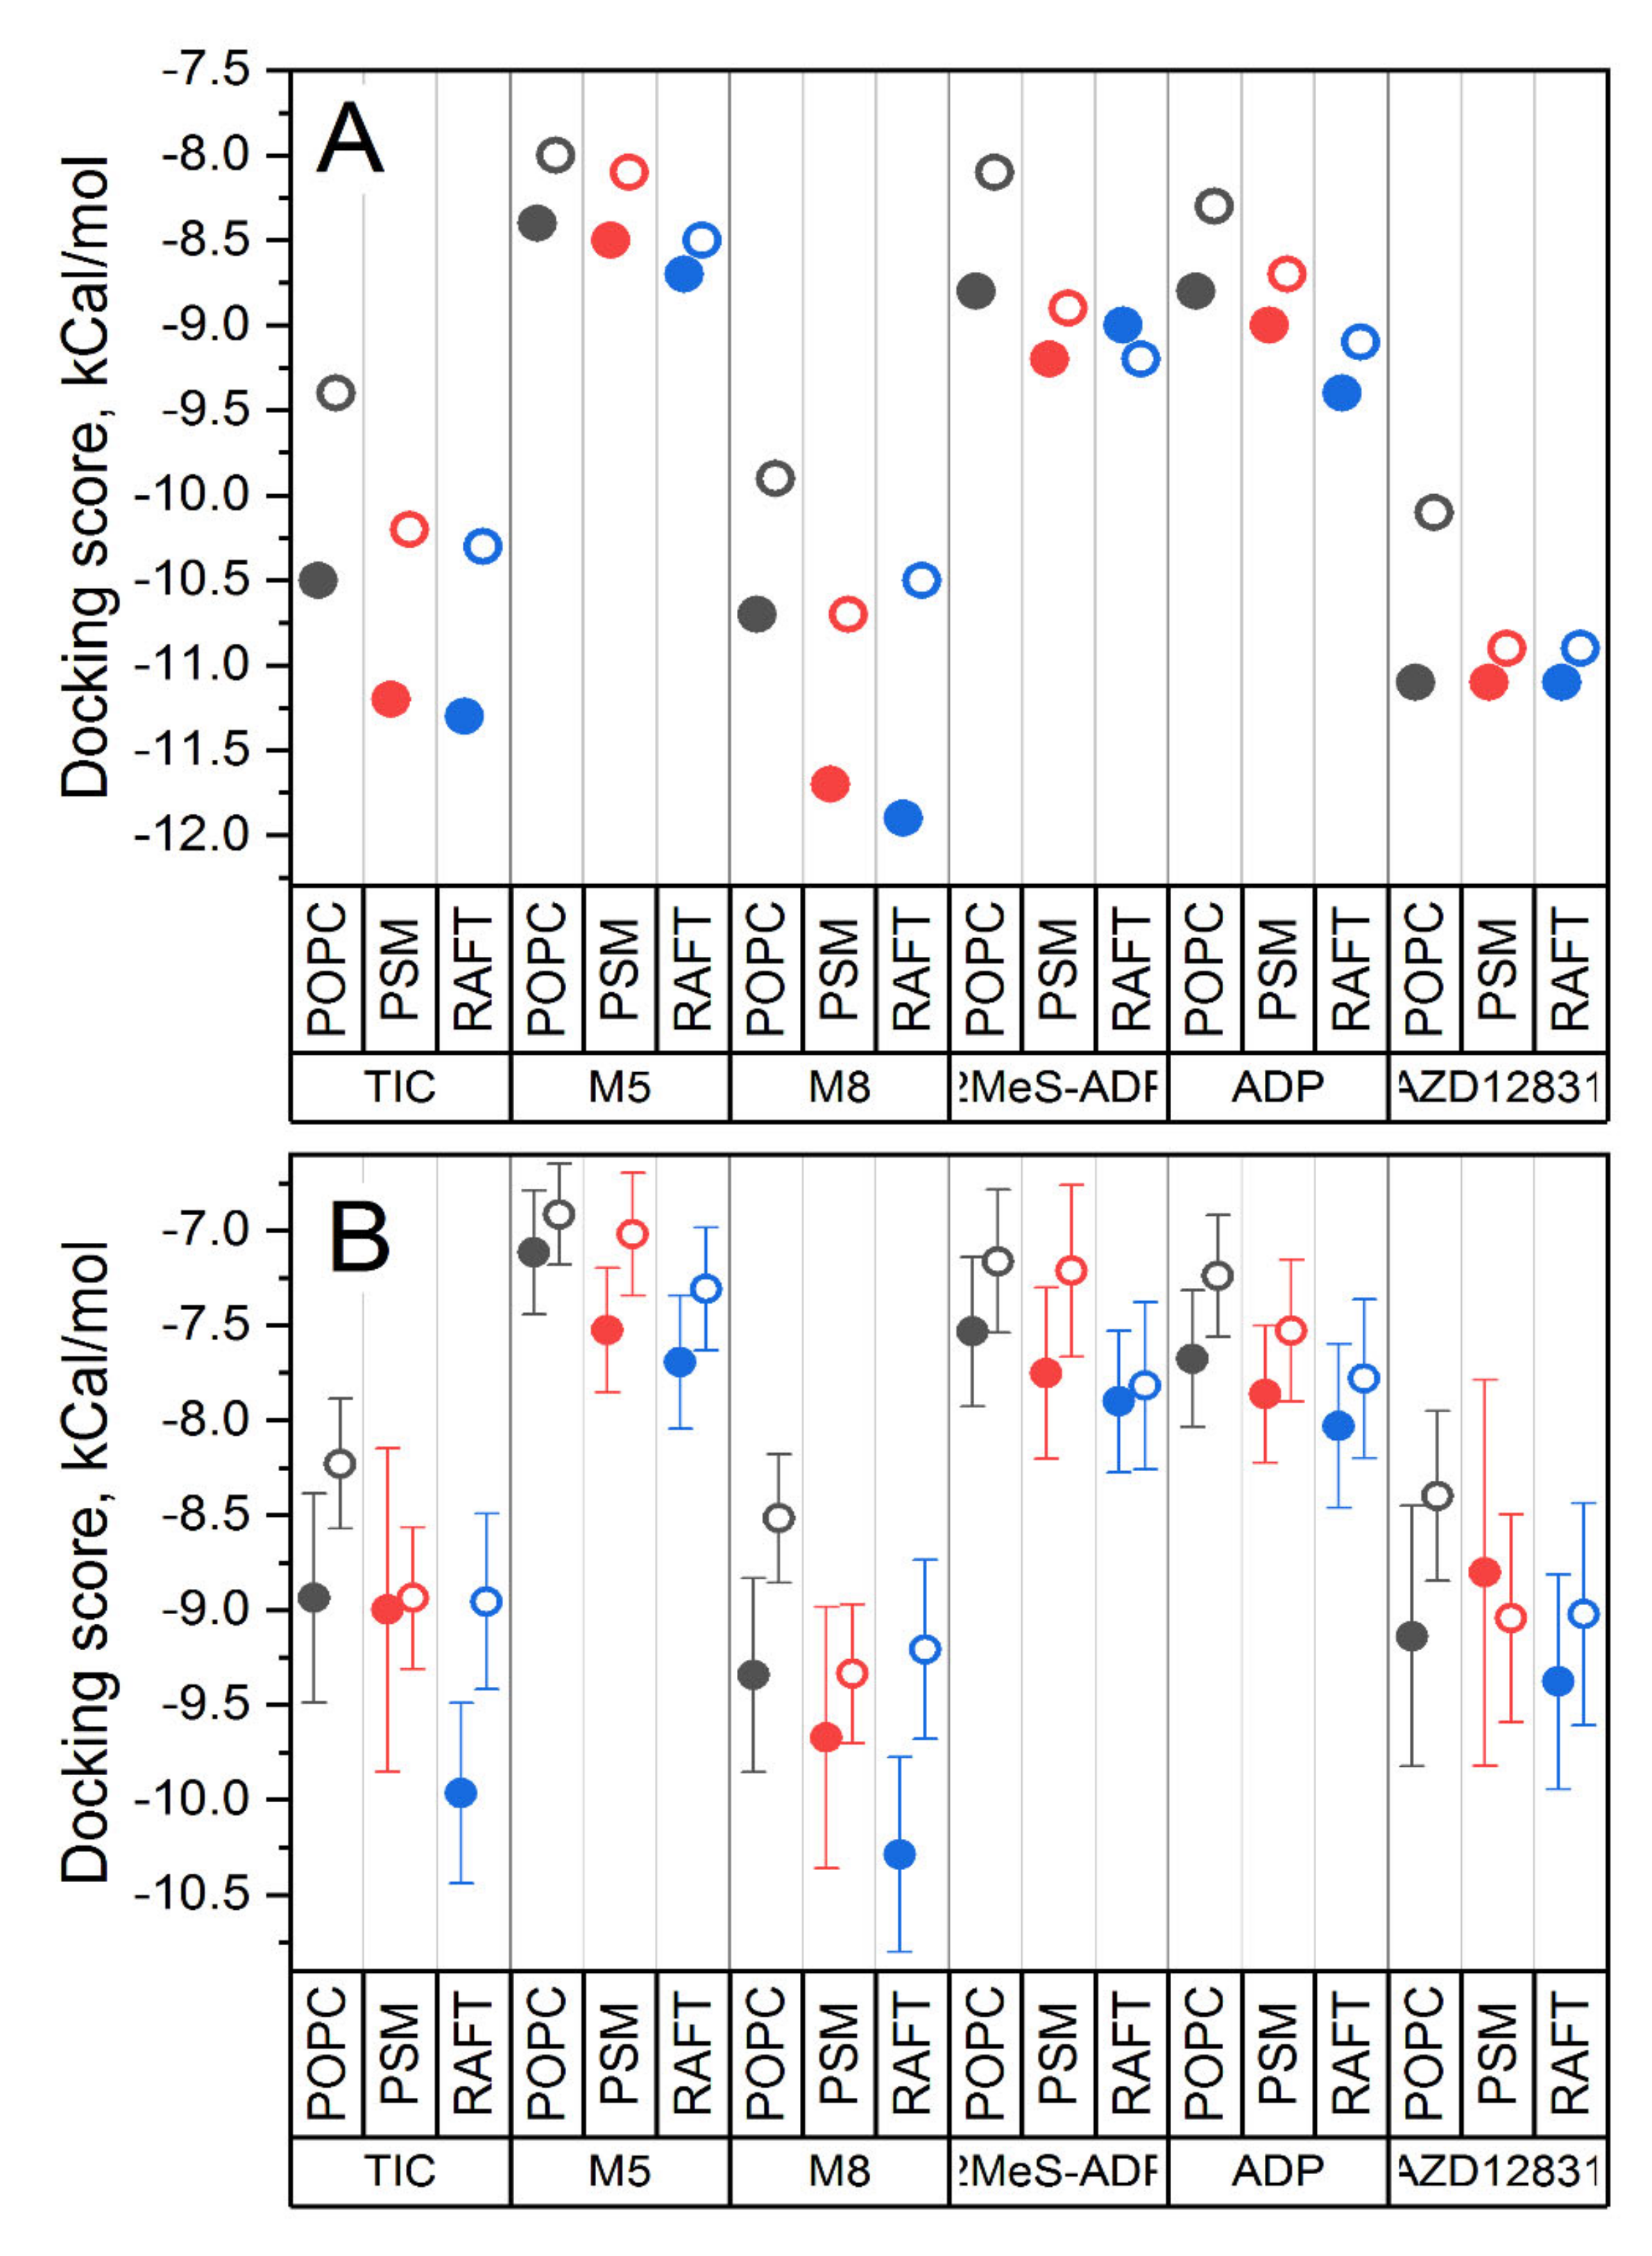
Figure 6 shows the best and average binding scores for all studied systems. The binding becomes stronger in a raw PC → SM → raft, i.e., with the increase of membrane rigidity.
Another systematic trend concerns the comparison of binding with respect to the two forms of the receptor. In general, the binding of all ligands to the closed form of protein (solid symbols in
Figure 6) is stronger in comparison to the open one (open symbols). This effect is especially pronounced for ticagrelor and its metabolites M5 and M8 and the least pronounced for AZD1283. This is in striking contrast to the results of previous docking studies, where the static crystal structures of P2Y12 were used [
27]. In these studies, the docking of ticagrelor and similar compounds with bulky N6 substituents to the closed form of protein was not successful. It was suggested that the binding pocket in the closed crystal structure is too small to fit ticagrelor and its homologues because the bulky N6 substituent clashes sterically with inwardly tilted TM6.
This demonstrates that accounting for internal protein dynamics, modulated by its lipid environment, is crucial for correct assessment of the ligand binding to P2Y12.
3.3. Docking to The Crystal Structures vs Ensemble Docking
The striking discrepancy between our ensemble docking results and the previous rigid docking studies stimulated us to perform an in-depth comparison between these two techniques. We performed docking to the crystal structures of closed (4PXZ:A) and open (4NTJ:A) forms of P2Y12 using the same setup as for the ensemble docking. The results are shown in
Table 2.
The best docking scores for the crystal structures differ dramatically from the results obtained in ensemble docking. In the case of crystal structures, the binding to open form is stronger for all ligands, while for ensemble docking, the trend is strictly opposite, and the binding to closed form is stronger. The pattern of binding scores for different ligands is strikingly different as well for the closed form. Particularly M8 and AZD12831 bind substantially weaker than TIC in the crystal structures. In ensemble docking, the situation is again the opposite: M8 and AZD12831 bind stronger than TIC.
In the case of the open form of protein, the differences between ensemble docking and the docking to crystal structure are less pronounced, and the trends for different ligands are much more consistent.
In the closed form of the protein, the volume of the binding pocket is restricted by the TM6 helix, which is kinked inwards and may impose steric restraints on the ligands. The static crystal structure is especially unfortunate in terms of such restraints. The ligands do not fit well into the pocket and exhibit weak binding. MD simulations allow equilibrating positions of TM6 side chains and to sample different orientations of this helix (see
Figure 4), including those that are free from the steric clashes with the ligands. As a result, the ensemble docking reveals favorable docking poses with much better binding scores and demonstrates completely different trends among the ligands.
These observations emphasize the fact that collecting statistics over many protein conformations in ensemble docking allows comparing docking score distributions as a whole, which leads to reliable and unambiguous results. The dynamics of the protein, particularly its flexibility and fluctuations, are affected dramatically by the lipid environment. Such dynamical effect could never be correctly rendered by the docking to single protein conformation. Docking to the single crystal structures of P2Y12 should be avoided because it produces incorrect and misleading results, as it is evident from
Table 2.
3.4. Comparison of the Binding Sites
Due to the large number of docking simulations, we can estimate the probability of each ligand to be in contact with particular protein residues. The results of this analysis are shown in
Supplementary Figure S3.
The pattern of binding probabilities changes with lipid environment and the protein form, but these changes are surprisingly similar for different ligands despite their different chemical nature. Detailed analysis of observed fine differences between the ligands is beyond the scope of this work.
The number of residues with high binding propensity is significantly larger in a PC environment in comparison to SM and raft environments. Particularly, in the closed form of protein in the PC environment, there are two additional groups of residues with high binding probability: 111–115 and 197,201,240,248 respectively. In the open form of protein in the PC environment, there is another additional group: 154,155,157. The raft environment exhibits two residues with high binding propensity, which are absent in other environments: 88 for closed and 18 for open form, respectively.
However, these results should be interpreted with caution because they could be biased by the limited sampling in the particular MD trajectory. Ideally, multiple independent MD and ensemble docking simulations should be performed in each lipid environment, but this requires a prohibitively large amount of time and computational resources.
Comparison with crystallographic structures show that there is a partial match between the residues with highest binding probability in our simulations and the binding pockets in closed and open crystal structures, which correspond to the complexes of P2Y12 with the agonist 2MeS-ADP and the antagonist AZD1283, respectively. In the closed structure, the residues reported to bind with 2MeS-ADP are 19, 93, 97*, 101*, 102, 105,106, 109, 152, 155*, 156, 159, 163, 175*, 179, 187*, 190*, 191, 194*, 256, 259*, 263, and 280* (the matching residues in our docking simulations are marked by asteriscs). In the open structure, the residues reported to bind with AZD1283 are 101*, 102, 105, 106, 109, 152, 155*, 156, 159, 187*, 190*, 191, 194*, 195, 252, 255*, 256, 259*, 260, 276*, 279*, 280*, and 283.
Spatial locations of the binding pockets for 2MeS-ADP and AZD1283 in our simulations are similar to ones present in the crystal structures, but there is no exact correspondence, as it is evident from
Figure 7. Different sets of residues that are involved in ligand binding are observed in each lipid environment.


