
Development of an Improved Method for the Determination of Iodine/β-Cyclodextrin by Means of HPLC-UV: Validation and the Thyroid-Stimulating Activity Revealed by In Vivo Studies

 ,
,  , ,
, , 
Abstract
:1. Introduction
2. Materials and Methods
2.1. Materials
2.2. Synthesis of Iodine–β-Cyclodextrin Complex
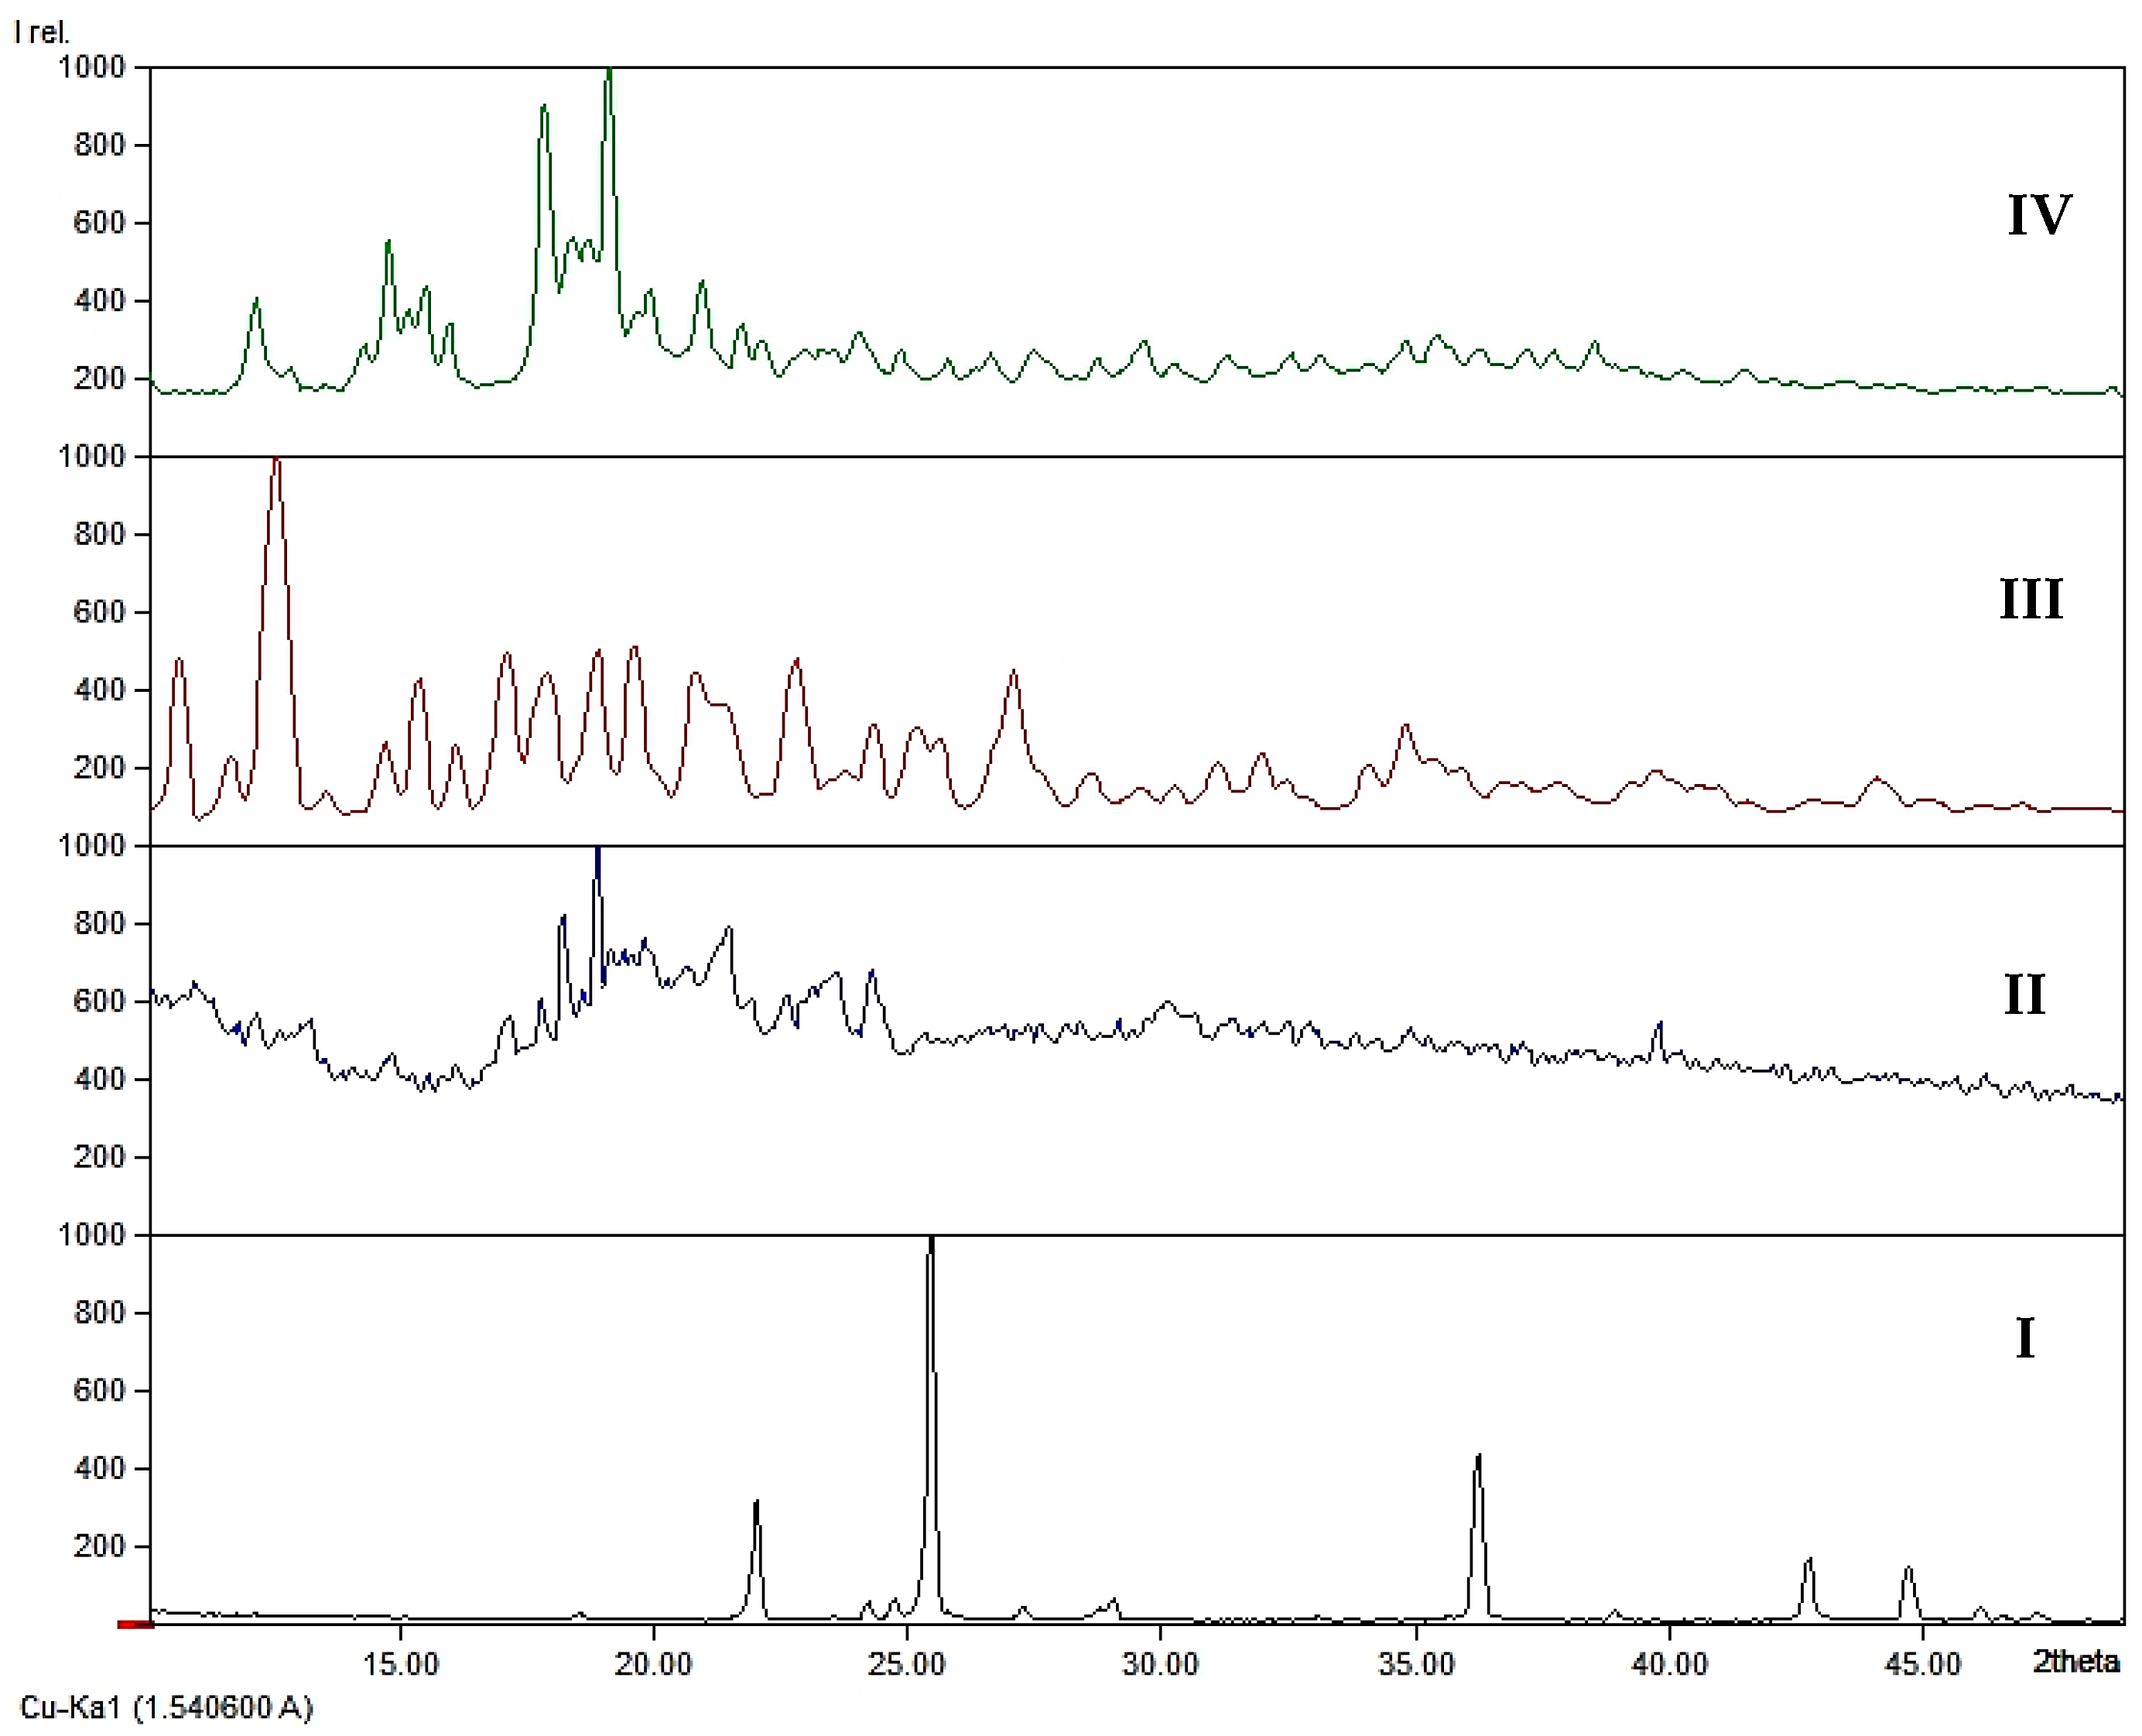
2.3. Powder X-ray Diffraction (XRD) Investigation
2.4. HPLC Analysis
2.5. Preparation of Solutions
2.5.1. Preparation of Standard Solutions of KI
2.5.2. Preparation of Sample Solution
2.5.3. Preparation of Iodine/β-CD Sample Solution to Quantify Total Amount of Iodine
2.5.4. Preparation of 0.04 M Solution of Sodium Thiosulfate
2.6. Thyroid-Stimulating Activity
2.6.1. Animals
2.6.2. Experimental Design
2.6.3. Measurement of Serum TSH, T3 and T4
2.7. Statistical Analysis
3. Results and Discussion
3.1. Results of XRD Analysis
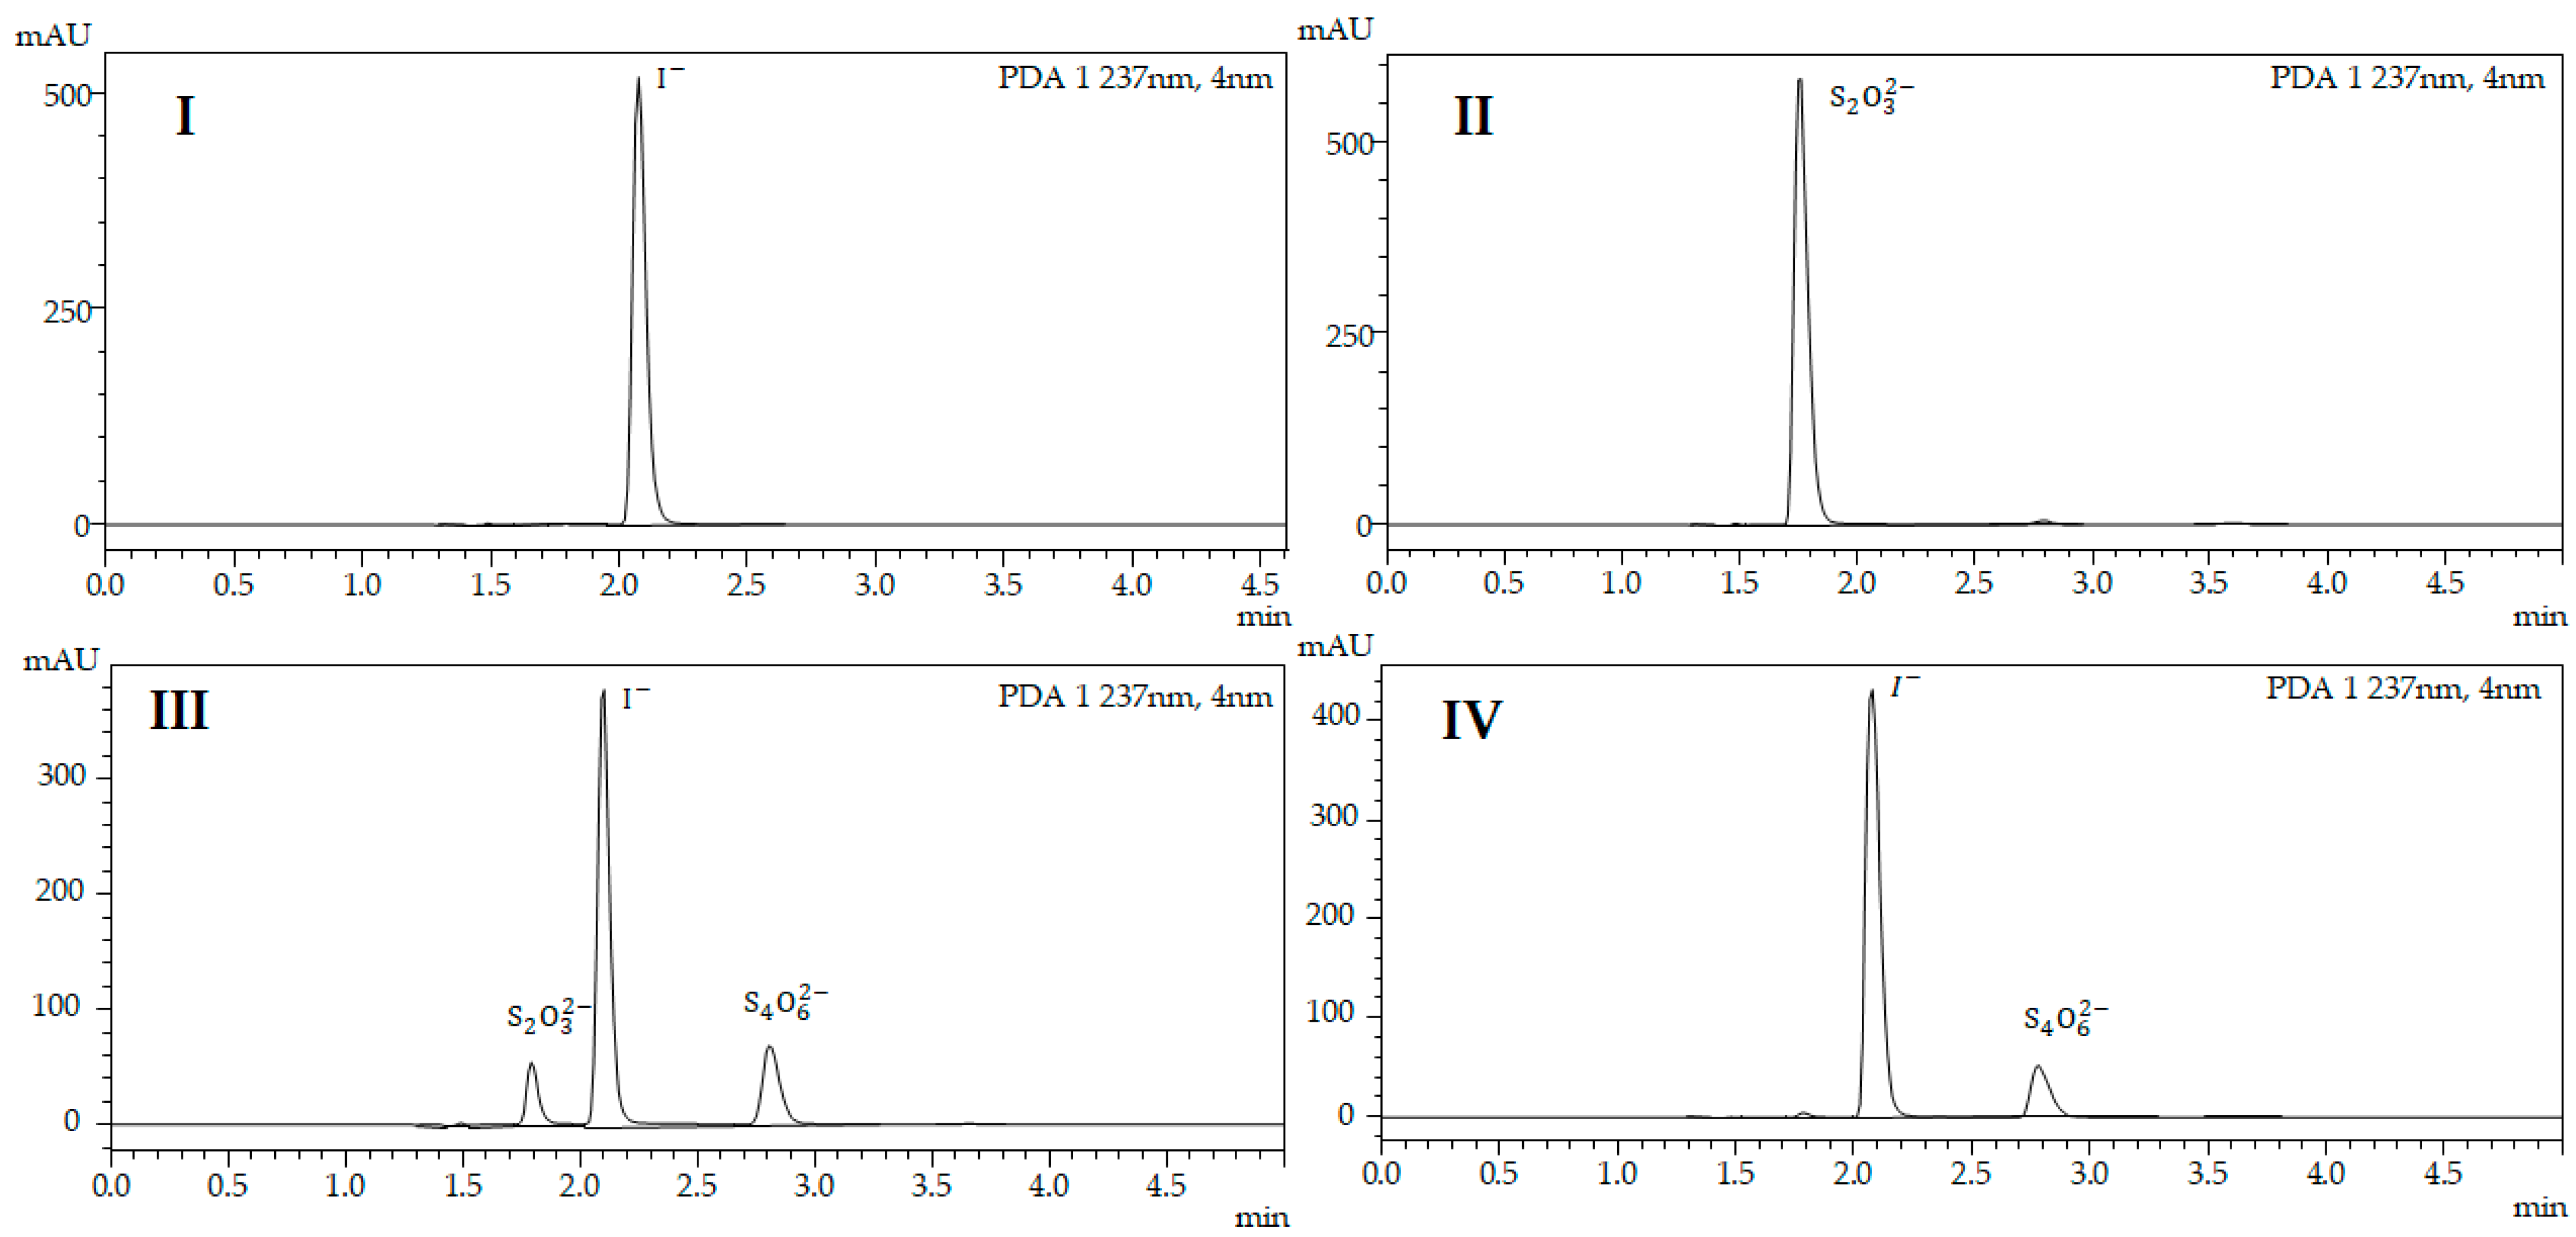
3.2. Results of HPLC Analysis
3.2.1. Development of HPLC Method to Quantify Total Amount of Iodine in Iodine/β-CD Complex
3.2.2. Results of HPLC Analysis to Determine Total Amount of Iodine in the Complex
3.3. Studying the Yield of the Transfer of Iodine Species to Iodide
3.4. Method Validation
3.4.1. Specificity
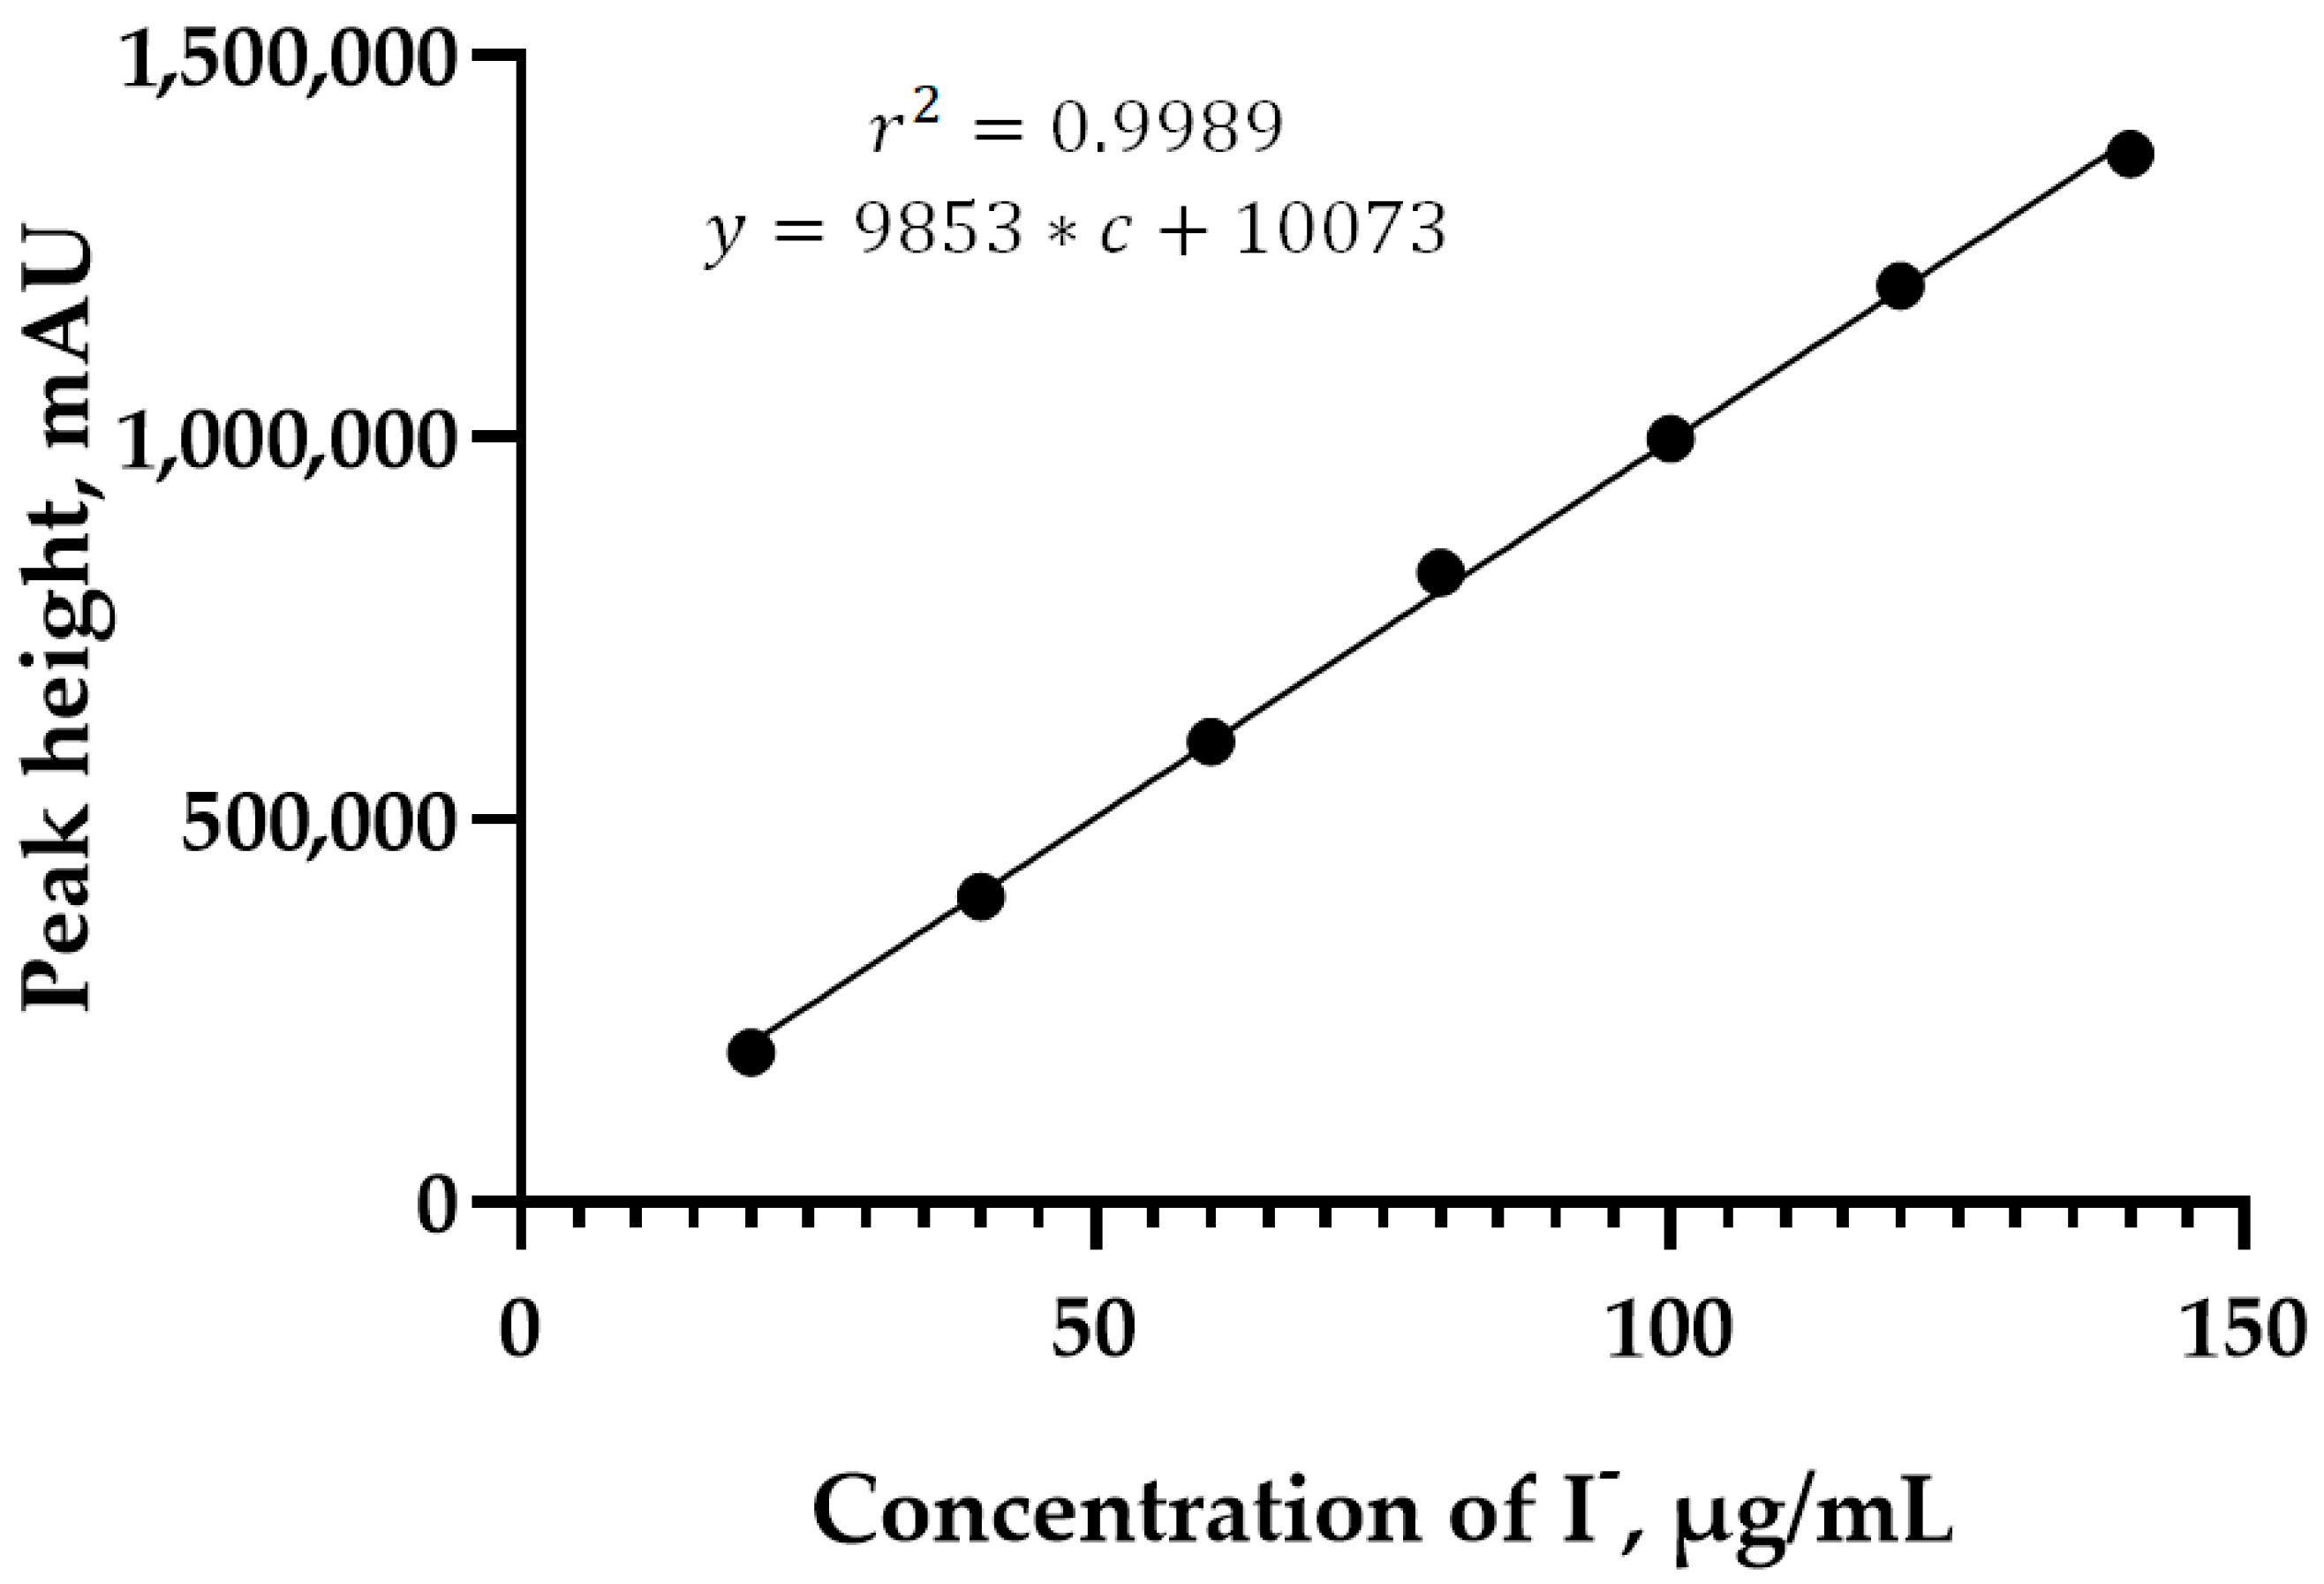
3.4.2. Linearity
3.4.3. Limit of Detection and Limit of Quantitation
3.4.4. Accuracy
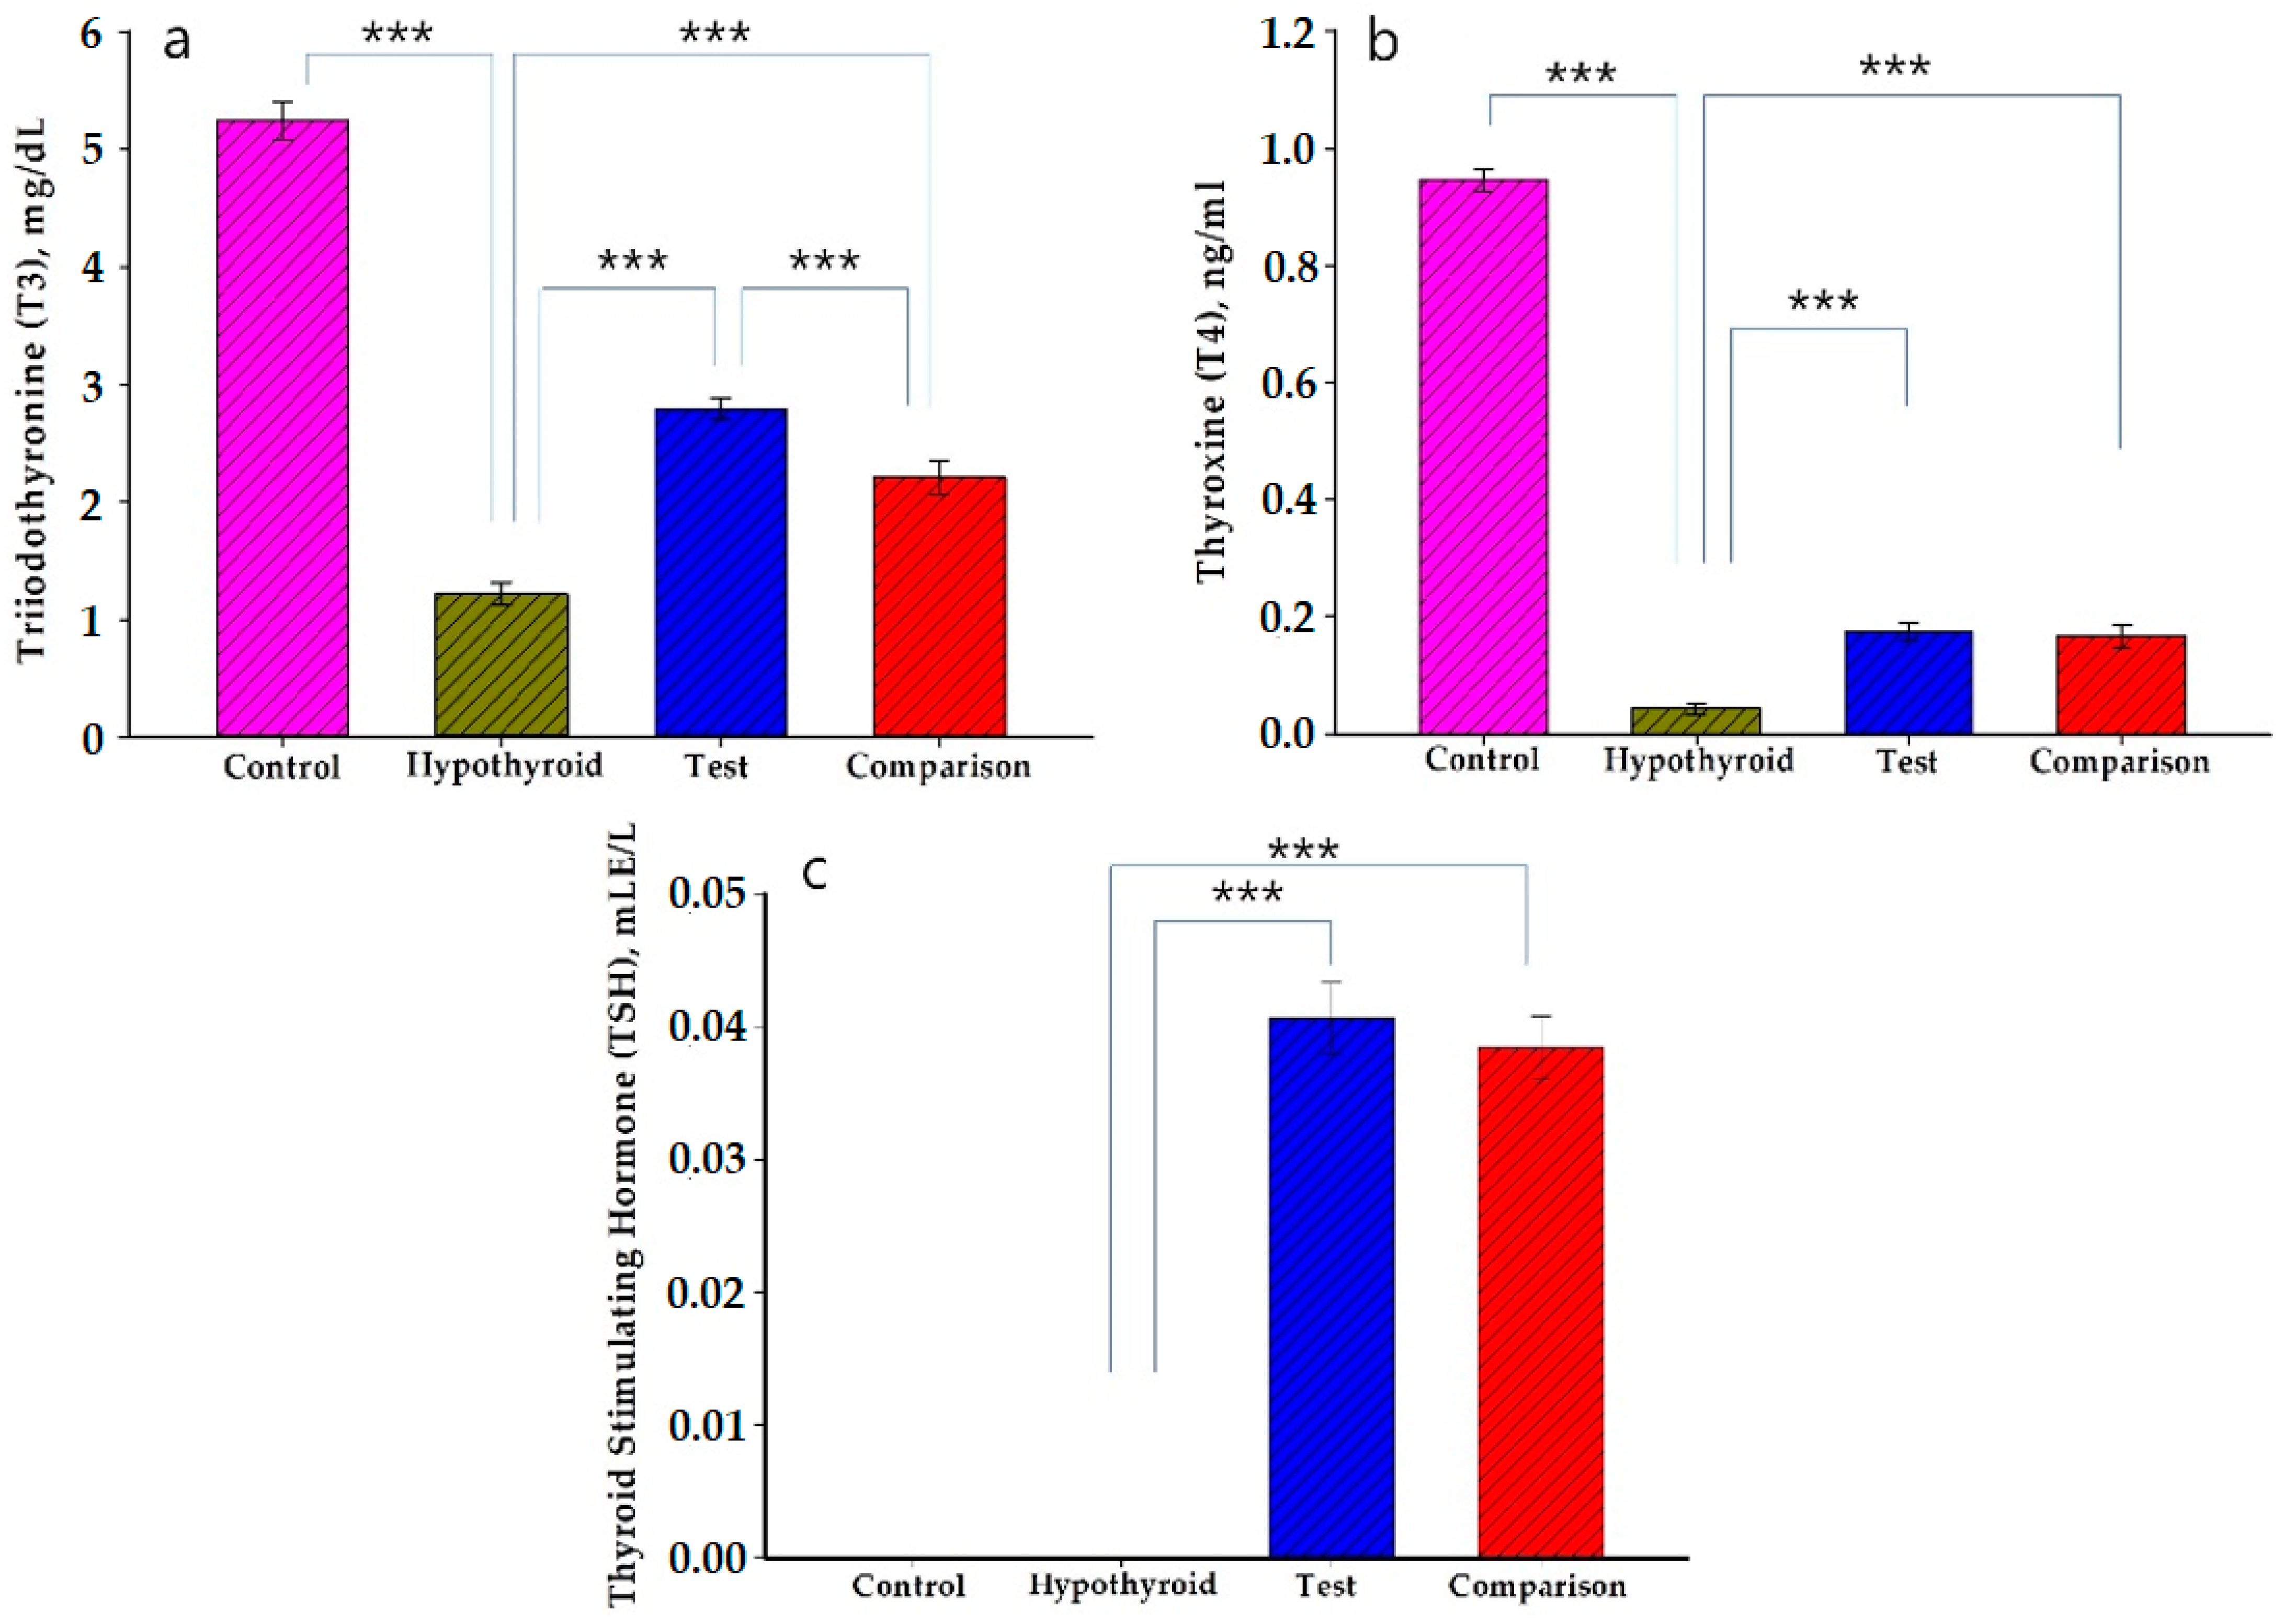
3.5. Results of Thyroid-Stimulating Activity and Discussions
4. Conclusions
Author Contributions
Funding
Institutional Review Board Statement
Data Availability Statement
Acknowledgments
Conflicts of Interest
References
- WHO. Assessment of Iodine Deficiency Disorders and Monitoring Their Elimination: A Guide for Programme Managers; World Health Organization: Geneva, Switzerland, 2007. [Google Scholar]
- Zimmermann, M.B.; Jooste, P.L.; Pandav, C.S. Iodine-deficiency disorders. Lancet 2008, 372, 1251–1262. [Google Scholar] [CrossRef]
- Moini, J.; Pereira, K.; Samsam, M. Epidemiology of Thyroid Disorders; Elsevier: Amsterdam, The Netherlands, 2020. [Google Scholar]
- Zimmermann, M.B. Iodine and iodine deficiency disorders. In Present Knowledge in Nutrition; Wiley-Blackwell: Oxford, UK, 2012; pp. 554–567. [Google Scholar]
- Pearce, E.N. Iodine Deficiency Disorders and Their Elimination; Springer: Berlin/Heidelberg, Germany, 2017. [Google Scholar]
- O’Kane, S.M.; Mulhern, M.S.; Pourshahidi, L.K.; Strain, J.J.; Yeates, A.J. Micronutrients, iodine status and concentrations of thyroid hormones: A systematic review. Nutr. Rev. 2018, 76, 418–431. [Google Scholar] [CrossRef]
- Spitzweg, C.; Joba, W.; Morris, J.C.; Heufelder, A.E. Regulation of sodium iodide symporter gene expression in FRTL-5 rat thyroid cells. Thyroid 1999, 9, 821–830. [Google Scholar] [CrossRef] [PubMed]
- Minns, J.W.; Khan, A. α-Cyclodextrin-I3-host− guest complex in aqueous solution: Theoretical and experimental studies. J. Phys. Chem. A 2002, 106, 6421–6425. [Google Scholar] [CrossRef]
- Harada, A. Cyclodextrin-based molecular machines. Acc. Chem. Res. 2001, 34, 456–464. [Google Scholar] [CrossRef] [PubMed]
- Zhang, J.; Ma, P.X. Cyclodextrin-based supramolecular systems for drug delivery: Recent progress and future perspective. Adv. Drug Deliv. Rev. 2013, 65, 1215–1233. [Google Scholar] [CrossRef] [PubMed] [Green Version]
- Crini, G. A history of cyclodextrins. Chem. Rev. 2014, 114, 10940–10975. [Google Scholar] [CrossRef]
- Szejtli, J. Past, present and futute of cyclodextrin research. Pure Appl. Chem. 2004, 76, 1825–1845. [Google Scholar] [CrossRef] [Green Version]
- Szejtli, J. Introduction and general overview of cyclodextrin chemistry. Chem. Rev. 1998, 98, 1743–1754. [Google Scholar] [CrossRef]
- Connors, K.A. The Stability of Cyclodextrin Complexes in Solution. Chem. Rev. 1997, 97, 1325–1358. [Google Scholar] [CrossRef]
- Jambhekar, S.S.; Breen, P. Cyclodextrins in pharmaceutical formulations I: Structure and physicochemical properties, formation of complexes, and types of complex. Drug Discov. Today 2016, 21, 356–362. [Google Scholar] [CrossRef]
- Mura, P. Analytical techniques for characterization of cyclodextrin complexes in aqueous solution: A review. J. Pharm. Biomed. Anal. 2014, 101, 238–250. [Google Scholar] [CrossRef]
- Mura, P. Analytical techniques for characterization of cyclodextrin complexes in the solid state: A review. J. Pharm. Biomed. Anal. 2015, 113, 226–238. [Google Scholar] [CrossRef] [PubMed]
- Munaf, E.; Takeuchi, T.; Miwa, T. Visualization of cyclodextrins via complexation with iodine in microcolumn liquid chromatography. Anal. Chim. Acta 2000, 418, 175–179. [Google Scholar] [CrossRef]
- Brewster, M.E.; Loftsson, T. Cyclodextrins as pharmaceutical solubilizers. Adv. Drug Deliv. Rev. 2007, 59, 645–666. [Google Scholar] [CrossRef] [PubMed]
- Redenti, E.; Szente, L.; Szejtli, J. Cyclodextrin complexes of salts of acidic drugs. Thermodynamic properties, structural features, and pharmaceutical applications. J. Pharm. Sci. 2001, 90, 979–986. [Google Scholar] [CrossRef] [PubMed]
- Saokham, P.; Muankaew, C.; Jansook, P.; Loftsson, T. Solubility of Cyclodextrins and Drug/Cyclodextrin Complexes. Molecules 2018, 23, 1161. [Google Scholar] [CrossRef] [Green Version]
- Neoh, T.L.; Noda, Y.; Yoshii, H.; Furuta, T. Release characteristics of iodine encapsulated in cyclodextrins. J. Incl. Phenom. Macrocycl. Chem. 2006, 56, 117–123. [Google Scholar] [CrossRef]
- Juhola, A. Iodine adsorption and structure of activated carbons. Carbon 1975, 13, 437–442. [Google Scholar] [CrossRef]
- Noltemeyer, M.; Saenger, W. X-ray studies of linear polyiodide chains in α-cyclodextrin channels and a model for the starch-iodine complex. Nature 1976, 259, 629–632. [Google Scholar] [CrossRef]
- Betzel, C.; Hingerty, B.; Noltemeyer, M.; Weber, G.; Saenger, W.; Hamilton, J.A. (β-Cyclodextrin)2·KI7·9 H2O. Spatial fitting of a polyiodide chain to a given matrix. J. Incl. Phenom. 1983, 1, 181–191. [Google Scholar] [CrossRef]
- Wang, T.; Li, B.; Feng, Y.; Guo, Q. Preparation, quantitive analysis and bacteriostasis of solid state iodine inclusion complex with β-cyclodextrin. J. Incl. Phenom. Macrocycl. Chem. 2011, 69, 255–262. [Google Scholar] [CrossRef]
- Polumbryk, M.; Kravchenko, V.; Pasichnyi, V.; Omelchenko, C.; Pachitskaya, I. The effect of intake of sausages fortified with β-CD-I2 complex on iodine status and thyroid function: A preliminary study. J. Trace Elem. Med. Biol. 2019, 51, 159–163. [Google Scholar] [CrossRef]
- Sharipov, A.T.; Boboev, Z.D.; Fazliev, S.A.; Aminov, S.N. Standartization of the iodine-β-cyclodextrine substance. Pharm. J. 2017, 2, 59–63. [Google Scholar]
- Argumedo, G.S.; Sanz, C.R.; Olguin, H.J. Experimental Models of Developmental Hypothyroidism. Horm. Metab. Res. 2012, 44, 79–85. [Google Scholar] [CrossRef] [PubMed]
- Isman, C.A.; Yegen, B.C.; Alican, I. Methimazole-induced hypothyroidism in rats ameliorates oxidative injury in experimental colitis. J. Endocrinol. 2003, 177, 471–476. [Google Scholar] [CrossRef] [PubMed] [Green Version]
- Saenger, W. Cyclodextrin inclusion compounds in research and industry. Angew. Chem. Int. Ed. Engl. 1980, 19, 344–362. [Google Scholar] [CrossRef]
- Chai, X.N.; Ludwig, F.A.; Müglitz, A.; Schaefer, M.; Yin, H.Y.; Brust, P.; Regenthal, R.; Krügel, U. Validation of an LC-MS/MS Method to Quantify the New TRPC6 Inhibitor SH045 (Larixyl N-methylcarbamate) and Its Application in an Exploratory Pharmacokinetic Study in Mice. Pharmaceuticals 2021, 14, 259. [Google Scholar] [CrossRef]
- Kim, U.-J.; Kannan, K. Method for the determination of iodide in dried blood spots from newborns by high performance liquid chromatography tandem mass spectrometry. Anal. Chem. 2018, 90, 3291–3298. [Google Scholar] [CrossRef]
- Miralles-Cardiel, E.; Silva-Abreu, M.; Calpena, A.C.; Casals, I. Development and Validation of an HPLC–MS/MS Method for Pioglitazone from Nanocarriers Quantitation in Ex Vivo and In Vivo Ocular Tissues. Pharmaceutics 2021, 13, 650. [Google Scholar] [CrossRef]
- Pirahanchi, Y.; Toro, F.; Jialal, I. Physiology, Thyroid Stimulating Hormone; StatPearls: Treasure Island, FL, USA, 2021. [Google Scholar]

| No. | Sample Mass, g | Peak Height of Iodide in the Chromatograms, mAU | Amount of Iodine Species in Iodine/β-CD, % (n = 5) | RSD, % | |||
|---|---|---|---|---|---|---|---|
| Before Reduction | After Reduction | Before Reduction (Iodide Ions Only) | After Reduction (Total Iodine Species) | Before Reduction | After Reduction | ||
| 1 | 0.0099 | 754,002 ± 6667 | 377,259 ± 5870 | 7.88 ± 0.07 | 19.91 ± 0.31 | 0.88 | 1.56 |
| 2 | 0.0099 | 756,404 ± 9077 | 376,903 ± 4453 | 8.03 ± 0.10 | 20.51 ± 0.24 | 1.20 | 1.18 |
| 3 | 0.0102 | 755,549 ± 7322 | 383,274 ± 5519 | 7.92 ± 0.08 | 19.61 ± 0.28 | 0.97 | 1.44 |
| 4 | 0.0105 | 755,656 ± 11,502 | 371,153 ± 7215 | 7.77 ± 0.12 | 19.46 ± 0.38 | 1.52 | 1.94 |
| 5 | 0.0098 | 755,650 ± 10,327 | 374,972 ± 4798 | 7.81 ± 0.11 | 20.07 ± 0.26 | 1.37 | 1.28 |
| No. | 0.05 M Iodine Solution Volume, mL (K = 0.998) | Volume of Added 0.1 M Thiosulfate Solution, mL (K = 1.002) | Amount of Iodine, mg/mL | Yield, % | Average Yield, % | |
|---|---|---|---|---|---|---|
| Calculated | Found | |||||
| 1 | 10.0 mL | 10.0 mL | 0.12675 | 0.1258 | 99.25 | 99.56 ± 0.27 |
| 2 | 10.0 mL | 10.2 mL | 0.12675 | 0.1263 | 99.64 | |
| 3 | 10.0 mL | 10.5 mL | 0.12675 | 0.1259 | 99.33 | |
| 4 | 10.0 mL | 15.0 mL | 0.12675 | 0.1264 | 99.72 | |
| 5 | 10.0 mL | 20.0 mL | 0.12675 | 0.2660 | 99.88 | |
| No | Concentration of KI, µg/mL | Peak Height, mAU |
|---|---|---|
| 1 | 20 | 196,075 ± 6766 |
| 2 | 40 | 399,471 ± 7397 |
| 3 | 60 | 602,044 ± 9254 |
| 4 | 80 | 822,947 ± 10,521 |
| 5 | 100 | 998,702 ± 16,791 |
| 6 | 120 | 1,198,334 ± 10,341 |
| 7 | 140 | 1,370,453 ± 12,195 |
| Parameters | Value |
|---|---|
| Linear Range (µg/mL) | 20–140 |
| 0.9989 | |
| Accuracy (%) | 98.41–102.87% |
| RSD (%) (overall) | 1.33% |
| LOD | 1.24 |
| LOQ | 4.14 |
Publisher’s Note: MDPI stays neutral with regard to jurisdictional claims in published maps and institutional affiliations. |
© 2021 by the authors. Licensee MDPI, Basel, Switzerland. This article is an open access article distributed under the terms and conditions of the Creative Commons Attribution (CC BY) license (https://creativecommons.org/licenses/by/4.0/).
Share and Cite
Sharipov, A.; Boboev, Z.; Fazliev, S.; Gulyamov, S.; Yunuskhodjayev, A.; Razzokov, J. Development of an Improved Method for the Determination of Iodine/β-Cyclodextrin by Means of HPLC-UV: Validation and the Thyroid-Stimulating Activity Revealed by In Vivo Studies. Pharmaceutics 2021, 13, 955. https://doi.org/10.3390/pharmaceutics13070955
Sharipov A, Boboev Z, Fazliev S, Gulyamov S, Yunuskhodjayev A, Razzokov J. Development of an Improved Method for the Determination of Iodine/β-Cyclodextrin by Means of HPLC-UV: Validation and the Thyroid-Stimulating Activity Revealed by In Vivo Studies. Pharmaceutics. 2021; 13(7):955. https://doi.org/10.3390/pharmaceutics13070955
Chicago/Turabian StyleSharipov, Avez, Zufar Boboev, Sunnatullo Fazliev, Shokhid Gulyamov, Akhmatkhodja Yunuskhodjayev, and Jamoliddin Razzokov. 2021. "Development of an Improved Method for the Determination of Iodine/β-Cyclodextrin by Means of HPLC-UV: Validation and the Thyroid-Stimulating Activity Revealed by In Vivo Studies" Pharmaceutics 13, no. 7: 955. https://doi.org/10.3390/pharmaceutics13070955
APA StyleSharipov, A., Boboev, Z., Fazliev, S., Gulyamov, S., Yunuskhodjayev, A., & Razzokov, J. (2021). Development of an Improved Method for the Determination of Iodine/β-Cyclodextrin by Means of HPLC-UV: Validation and the Thyroid-Stimulating Activity Revealed by In Vivo Studies. Pharmaceutics, 13(7), 955. https://doi.org/10.3390/pharmaceutics13070955