1. Introduction
Antibiotic treatment is commonly used to eradicate bacterial infections in critically ill patients admitted to the intensive care unit. Ciprofloxacin is a wide-spectrum antibiotic that is commonly prescribed for various infections either in monotherapy or in combination with other antibiotics [
1]. Its bactericidal action is distinguished by an activity primarily against Gram-negative aerobic bacteria, of which
Pseudomonas aeruginosa and
Enterobacterales are the most clinically important [
2]. Specific pharmacokinetic/pharmacodynamic (PK/PD) target for ciprofloxacin is defined as the ratio of the 24 h area under the concentration-time curve (AUC
24) over the minimum inhibitory concentration (MIC), where the MIC is determined as the lowest concentration of an antibiotic that prevents visible growth of bacteria in vitro [
3]. Generally, attaining the PK/PD target of AUC
24/MIC ≥ 125 should be predictive of sufficient anti-infective treatment. Nonetheless, AUC
24/MIC ≥ 125 is usually not attained in critically ill patients treated with the standard recommended doses of ciprofloxacin (200–1500 mg/day), as shown in previous studies [
4,
5,
6].
Both population and individual PK analyses are well-established and recognized types of PK explorations with distinct features that may lead to the preference for one procedure over another. In a population PK analysis performed using non-linear mixed-effects modeling (NLME), data of all patients included in the study are analyzed at the same time, providing estimates of population parameter values and inter- and intra-individual variability [
7]. There are several advantages of the population PK analysis, such as the possibility to analyze sparse and unbalanced data, identification and quantification of predictive covariates, and ability to distinguish between inter- and intra-individual variability, or residual unexplained variability [
7]. On the other hand, individual PK explorations are generally conducted to describe PK parameters and determine the most prominent factors with the highest potential to affect drug exposures. Although this individual approach leaves many possible sources of variability unexplored, the most important ones are generally better captured in a limited-sample-size population, provided a sufficient number of samples is obtained.
There is a high heterogeneity in the group of critically ill patients regarding the patients’ age, comorbidities, disease severity, pathogens and loci of infections [
4,
8]. Various pathophysiological factors in these patients usually lead to alteration of PK of the drugs. Altered PK of a drug may result in an inadequate exposure, causing insufficient bacterial eradication, an increased risk of antibiotic resistance, and surplus morbidity and mortality [
9]. Therefore, detailed understanding of the PK of an individual antibiotic drug is necessary for its dosing optimization. Volume of distribution (Vd) can be increased due to the reduced protein binding, systemic inflammatory response syndrome (SIRS), and capillary leak [
10]. Additionally, the elimination rate can be impaired or augmented, depending on the clinical condition of the patient [
10]. SIRS can downregulate CYP enzymes, and this may lead to reduced clearance (CL) of drugs cleared by these enzymes [
10]. On the other hand, CL of an antibiotic can be enhanced in sepsis, burn injury, or by concomitant use of inotropic agents [
10].
Our hypothesis was that there might be a context-sensitive pharmacokinetic profile of ciprofloxacin as a result of complex instability of factors affecting ciprofloxacin PK in critically ill patients at the beginning of treatment, compared to likely more-stabilized conditions after 3 days of treatment.
The aim of this prospective study was therefore to evaluate the pharmacokinetics of ciprofloxacin dosed within first 36 h (early phase) and after 3 days of treatment (delayed phase). The secondary aim of the study was to evaluate possible dosing implications of the observed PK differences between the early and delayed phases to achieve a PK/PD target for ciprofloxacin of AUC24/MIC ≥ 125.
2. Materials and Methods
2.1. Study Design
This was a prospective, open-label (laboratory-blinded) pharmacokinetic study in adult patients treated with intravenous ciprofloxacin admitted to the Department of Anesthesiology and Intensive Care Medicine, Second Faculty of Medicine, Charles University in Prague, and Motol University Hospital between February 2019 and June 2020. The study was approved by the local Ethics Committee under No. EK 1492/18 on 2 January 2019 and was conducted in compliance with the Declaration of Helsinki. Written informed consent was obtained from all subjects before undertaking any study-related procedures. The study was registered in EudraCT under No. 2019-003732-24.
Ciprofloxacin was administered according to the standard clinical care in 30 min intravenous infusions of 400 or 600 mg every 8 or 12 h. The choice of dosing regimen was at the discretion of the clinician. Blood samples for the PK analysis were taken at 1, 4, and 7.5 or 11.5 h following completion of the infusion (the last sample was taken as a trough, depending on the dosing interval). This concentration-time profile was collected twice during the therapy—at the early phase (within 36 h after initiation of ciprofloxacin dosing) and at the delayed phase (72–96 h after initiation of ciprofloxacin dosing). Patients from whom at least one complete concentration-time profile was not collected were excluded from the study. Blood samples (5 mL) were collected via cannula into serum collecting tubes without clot activator and immediately placed in the cold. Samples were then centrifuged at 4500× g for 10 min at 4 °C, and serum aliquots were stored at −80 °C until analysis.
The following demographic, laboratory, and clinical features of patients were recorded as a potential covariates of ciprofloxacin pharmacokinetics: sex, age, body weight, height, smoking status, total bilirubin, serum creatinine, fluid balance, and co-medication with norepinephrine and furosemide. All clinical and laboratory parameters were determined separately on each sampling day. Hence, actual values were used for PK analysis both in the early and delayed phase.
Creatinine clearance (CL
CR) was measured using serum creatinine (enzymatic assay) and 24 h urine output. CL
CR was calculated using the traditional equation CL
CR = U
CR × V/S
CR, where U
CR is urine creatinine level (µmol/L), V is the urinary flow rate (mL/s), and S
CR is the serum level of creatinine (µmol/L) [
11].
Glomerular filtration rate was also estimated using Chronic Kidney Disease Epidemiology Collaboration (CKD-EPI), Modification of Diet in Renal Disease (MDRD), Cockroft–Gault (C-G), and revised Lund–Malmö (L-M) formulas [
12,
13,
14,
15].
For each patient, body surface area (BSA) according to the DuBois formula and lean body mass (LBM) according to the Boer formula were calculated [
16,
17].
2.2. Bioanalytical Assay
Acetonitrile (ACN) and methanol (MeOH) (all LC-MS grade) were obtained from Honeywell (Charlotte, NC, USA). Ammonium acetate, formic acid, and ammonia solution 25% (all LC-MS grade) were supplied by Fluka (Buchs, Switzerland). Ultra-pure water was produced by a Smart2Pure system (Thermo Fisher Scientific, Waltham, MA, USA). Charcoal-stripped fetal bovine serum and ciprofloxacin (≥98%) were purchased from Sigma-Aldrich (Saint Louis, MO, USA), and internal standard ciprofloxacin-d8 (IS) from TRC (Totonto, ON, Canada). Standard stock solutions were prepared in water/acetic acid (60/40 v/v) at a concentration of 1 mg/mL and stored at −20 °C.
For serum samples, protein precipitation was used. Several procedures and reagents were tested; e.g., ACN, ACN/MeOH, and ACN/formic acid mixtures in several ratios. For the final procedure, 10 µL of IS solution (5 µg/mL) was added to 100 µL of serum and vortexed. Then, 200 µL of ice-cold mixture of ACN with 0.1% of formic acid was added and vortexed for 5 min. The procedure was repeated with another 200 uL of ACN/formic acid. The mixture was centrifuged at 13,000× g for 15 min, then 400 µL of the supernatant was evaporated and reconstituted in 500 µL of 10% methanol. All samples were prepared in triplicate.
The same procedure was used for the calibration curve; 100 µL of stripped bovine serum was spiked with ciprofloxacin standard solution to construct a calibration curve with the final range of 0.1–750 ng/mL.
For the UHPLC-MS/MS analysis, an Agilent 1290 Infinity UHPLC system coupled with an Agilent 6460 Triple quadrupole mass spectrometer (Agilent Technologies, Inc., Santa Clara, CA, USA) was used. Chromatographic separation was performed on a Kinetex EVO C18 column (2.1 × 50 mm; 1.7 µm) equipped with a guard column (both Phenomenex, Torrance, CA, USA). The mobile phases for gradient elution were ammonium acetate in water (0.5 mM) with ammonia solution, pH adjusted to 10.5 (A) and methanol (B). The flow rate was 0.45 mL/min and column temperature 30 °C. Gradient elution was carried out as follows: 0 min, 90:10 (A:B); 2 min, 60:40; 3.5 min, 0:100; 4.5 min, 0:100; 4.7 min, 90:10; 6.5 min, 90:10.
The MS/MS apparatus was operated in positive mode. The applied conditions of the electrospray ion source were: drying gas temperature 300 °C; drying gas flow 13 L/min; sheath gas temperature 350 °C; sheath gas flow 11 L/min; nebulizer pressure 40 psi; nozzle voltage 0 V; capillary voltage 2500 V. Multiple reaction monitoring (MRM) mode was used for the detection. Two transitions of m/z were used: 332.14 → 314.1 and 231 for ciprofloxacin and 340.19 → 322.2 and 235 for ciprofloxacin-d8.
An Agilent Mass Hunter (Agilent Technologies, Inc., Santa Clara, CA, USA) was used for data acquisition and quantification of samples.
2.3. Primary PK Analysis
Individual ciprofloxacin pharmacokinetic parameters—Vd, CL, and elimination half-life (t
1/2)—were calculated in a one-compartmental pharmacokinetic model with first-order elimination kinetics based on individual demographic and clinical data and observed ciprofloxacin serum levels using MWPharm
++ software version 1.8.2 (MediWare, Prague, Czech Republic). The ciprofloxacin PK data derived from Drusano et al. was used for an a priori estimation of the concentration-time profile in each patient [
18]. These estimated PK profile curves were a posteriori individualized to maximize fitting with observed concentration points in each patient. The fitting was performed using Bayesian method separately for both the early and delayed phase concentrations set. The goodness of fit was expressed using weighted sum of squares and root mean square values.
Subsequently, a Mann–Whitney U-test and linear regression model were used to evaluate the relationships between ciprofloxacin individual PK parameters with categorical and continuous variables, respectively. PK parameters and measured CLCR obtained from early and delayed concentration-time profiles were compared using a Mann–Whitney U-test (for this analysis, only patients with both complete phase profiles were included). GraphPad Prism software version 8.2.1 (GraphPad Inc., La Jolla, CA, USA) was used for all comparisons, and p-levels < 0.05 were considered as statistically significant.
2.4. Population PK Analysis
Population PK analysis was performed using NONMEM version 7.3.0 (ICON Development Solutions, Ellicott City, MD, USA) and PsN v3.4.2 [
19,
20] both running under Pirana 2.9.0 [
21]. Modeling was carried out using the first-order conditional estimation method with interaction (FOCE-I). R 3.3.2 was used for the visualization of the data and model diagnostics.
Model development was performed in three steps:
- (1)
Development of structural and statistical model
For the structural model, one- and two-compartment models were tested to describe the distribution of ciprofloxacin. First-order clearance of ciprofloxacin was assumed. Log-normally distributed inter-individual variability terms with estimated variance were tested on each PK parameter. As change in the clinical status of the patients between the early phase and delayed phase of ciprofloxacin treatment was expected, inter-occasional variability was also tested. Proportional, additive, and combination error models were tested for the residual error model.
- (2)
Covariate analysis
The following variables were tested as covariates (characteristics predictive of inter-individual variability):
Body weight, height, LBM, BSA, serum level of bilirubin, CLCR, age, daily fluid balance, and doses of concomitantly used drugs (noradrenalin and furosemide) were tested as continuous covariates;
Smoking status (smoker/non-smoker), concomitant therapy with continuous veno-venous hemodialysis—CVVHD (on CVVHD/off CVVHD) and sex were tested as categorical covariates.
A stepwise covariate modeling procedure was performed. Continuous covariates were tested in linear and power functions. Categorical covariates were tested by estimating the parameter value for one category as a fraction of the parameter value for the other category. For model selection, a decrease in objective function value (OFV) of more than 3.84 points between nested models (p < 0.01) was considered statistically significant, assuming a χ2 distribution. Additional criteria for model selection were relative standard error (RSE) of the estimates of structural model parameters <30%, physiological plausibility of the obtained parameter values, and absence of bias in goodness-of-fit (GOF) plots.
- (3)
Validation of the final model
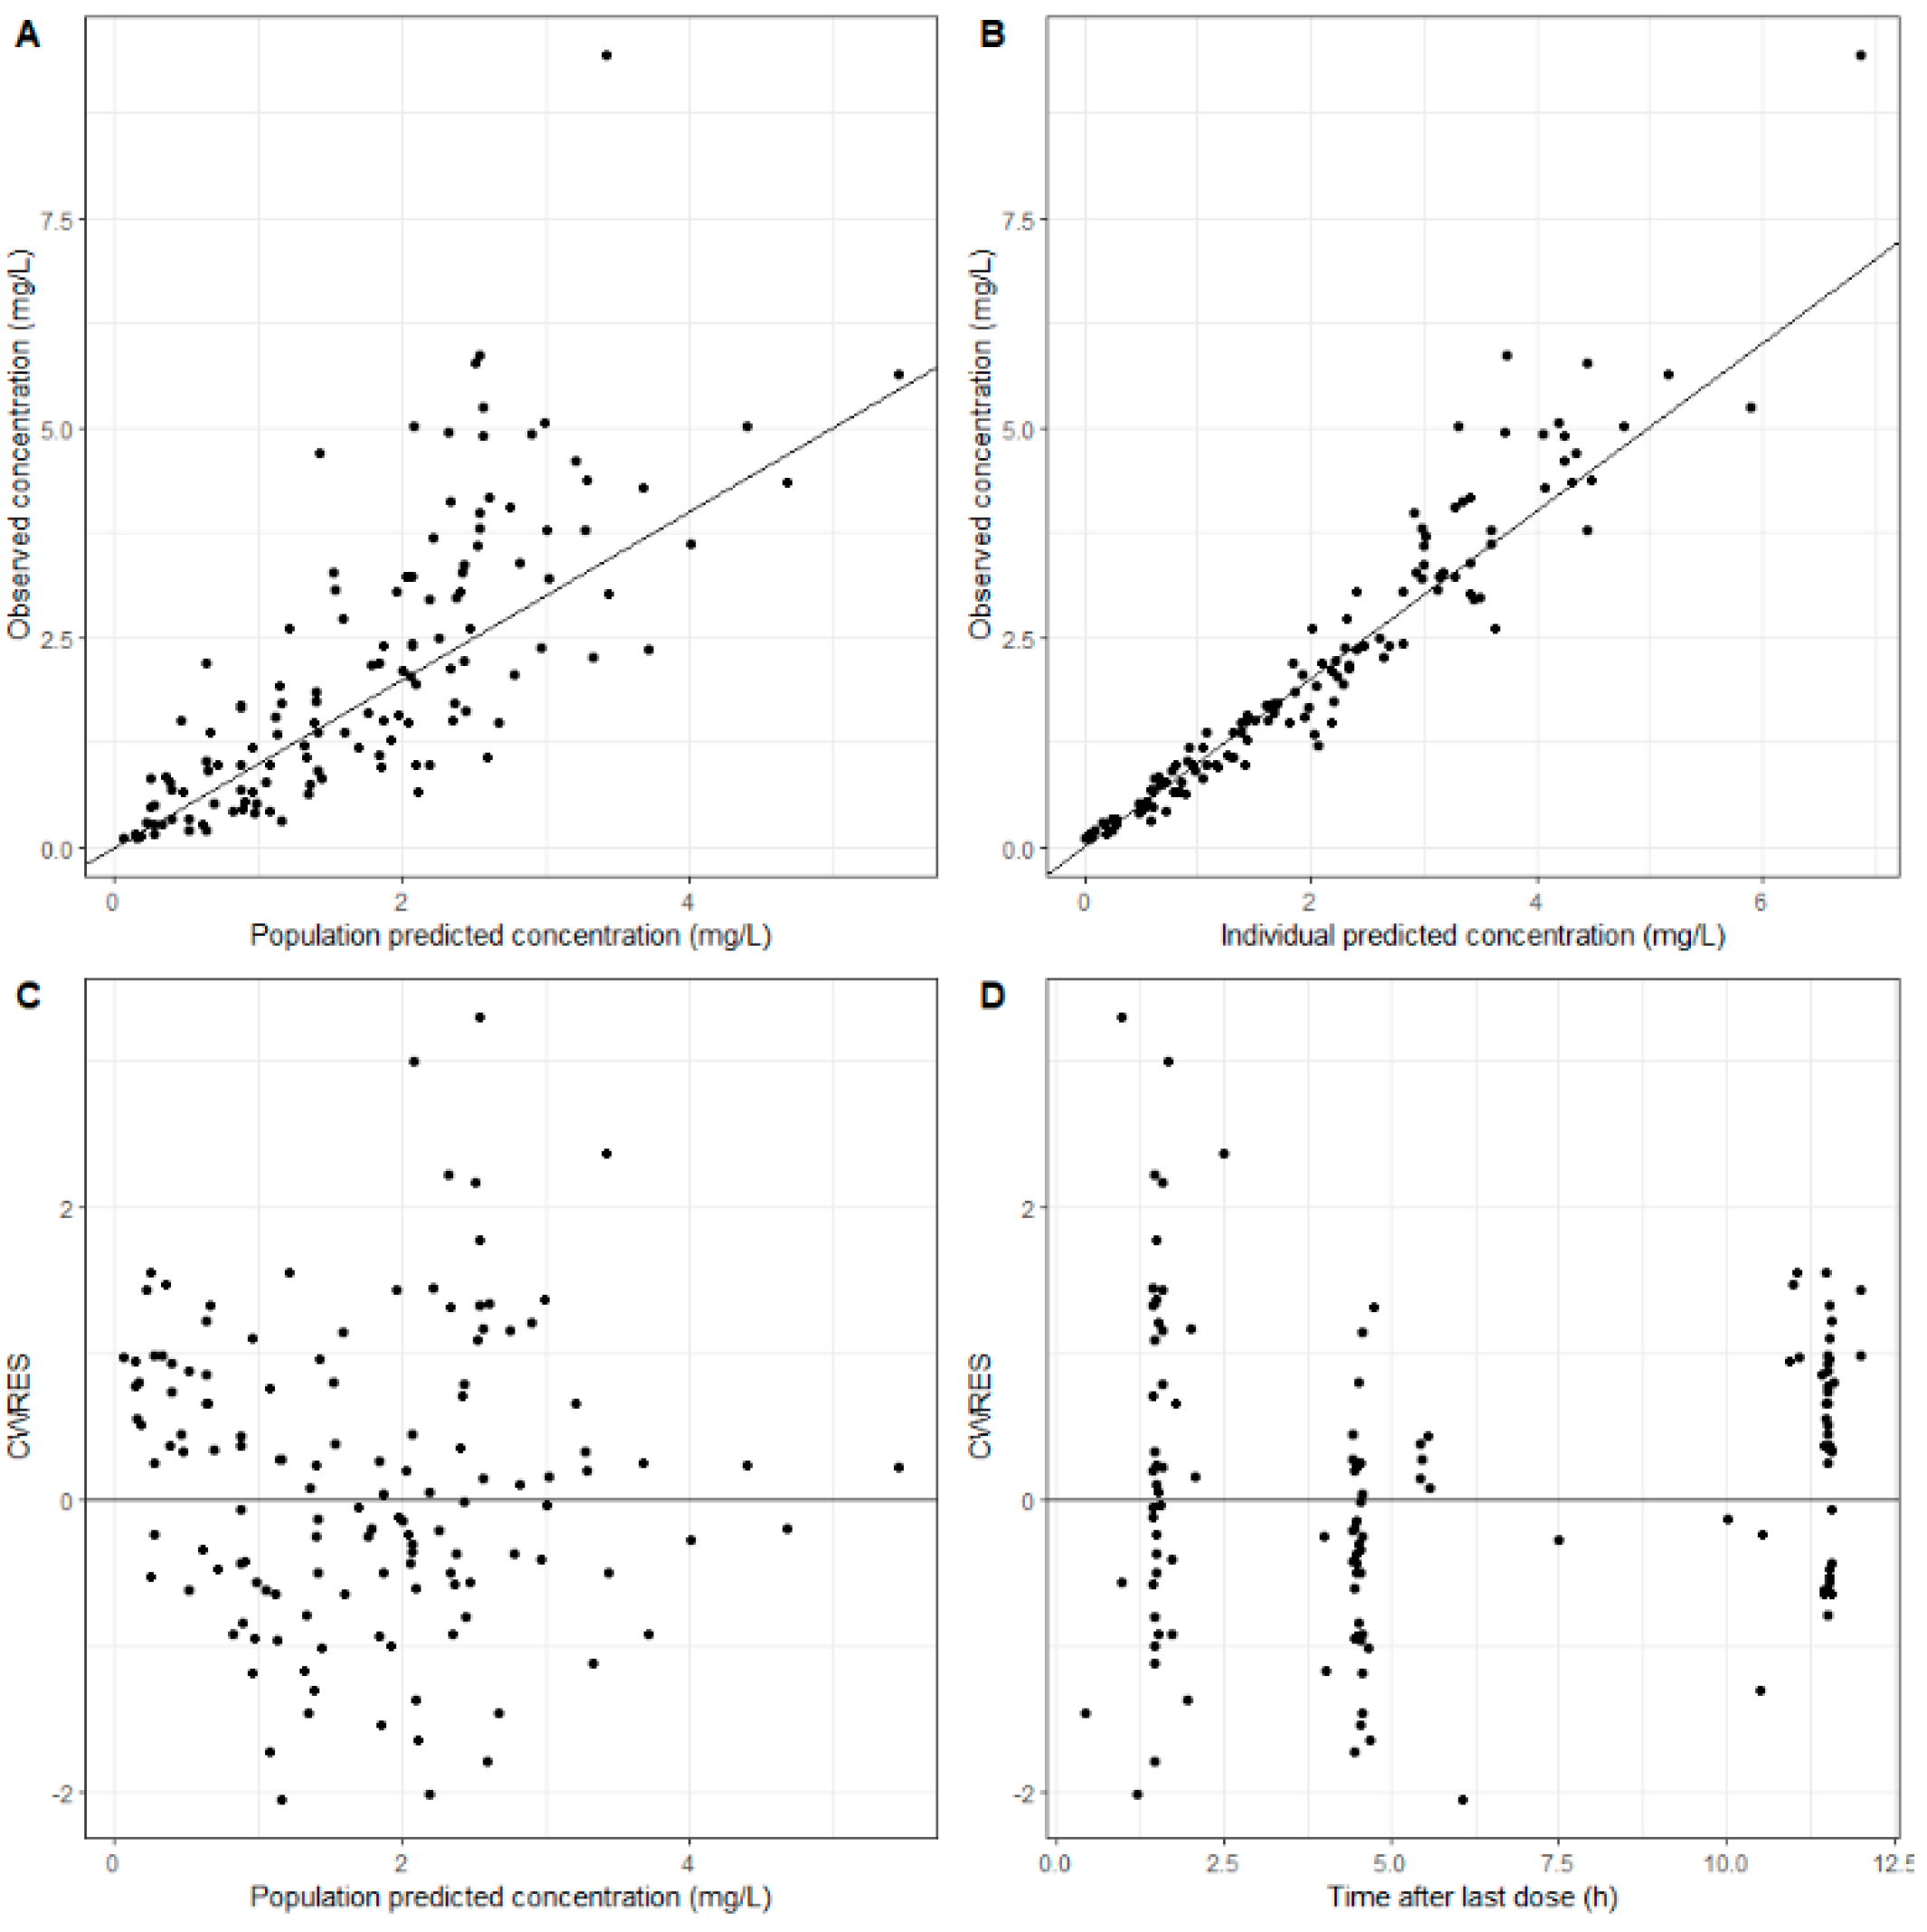
To evaluate the stability of the model, a bootstrap analysis was performed. In this procedure, 1000 replicates of the original data were generated, and the parameter estimates for each of the 1000 samples were re-estimated by NONMEM in the final model. The median and 95% confidence intervals (CI) obtained for each parameter estimated for bootstrap samples were compared with the estimates in the final model. The predictive properties of the structural and statistical model were validated using normalized prediction distribution errors (NPDEs). For this, the dataset was simulated 1000 times, after which the observed concentrations were compared to the range of simulated values using the NPDE package developed for R [
22]. Additionally, a visual predictive check (VPC) was performed to evaluate the predictive accuracy of the final model [
23]. For this, 1000 replicates of the original dataset were simulated using the final model parameter estimates, and the simulated distribution was compared with that from the observed data. The 95% CIs for the 10th, 50th, and 90th percentiles of the simulations were calculated from all replicates and presented graphically.
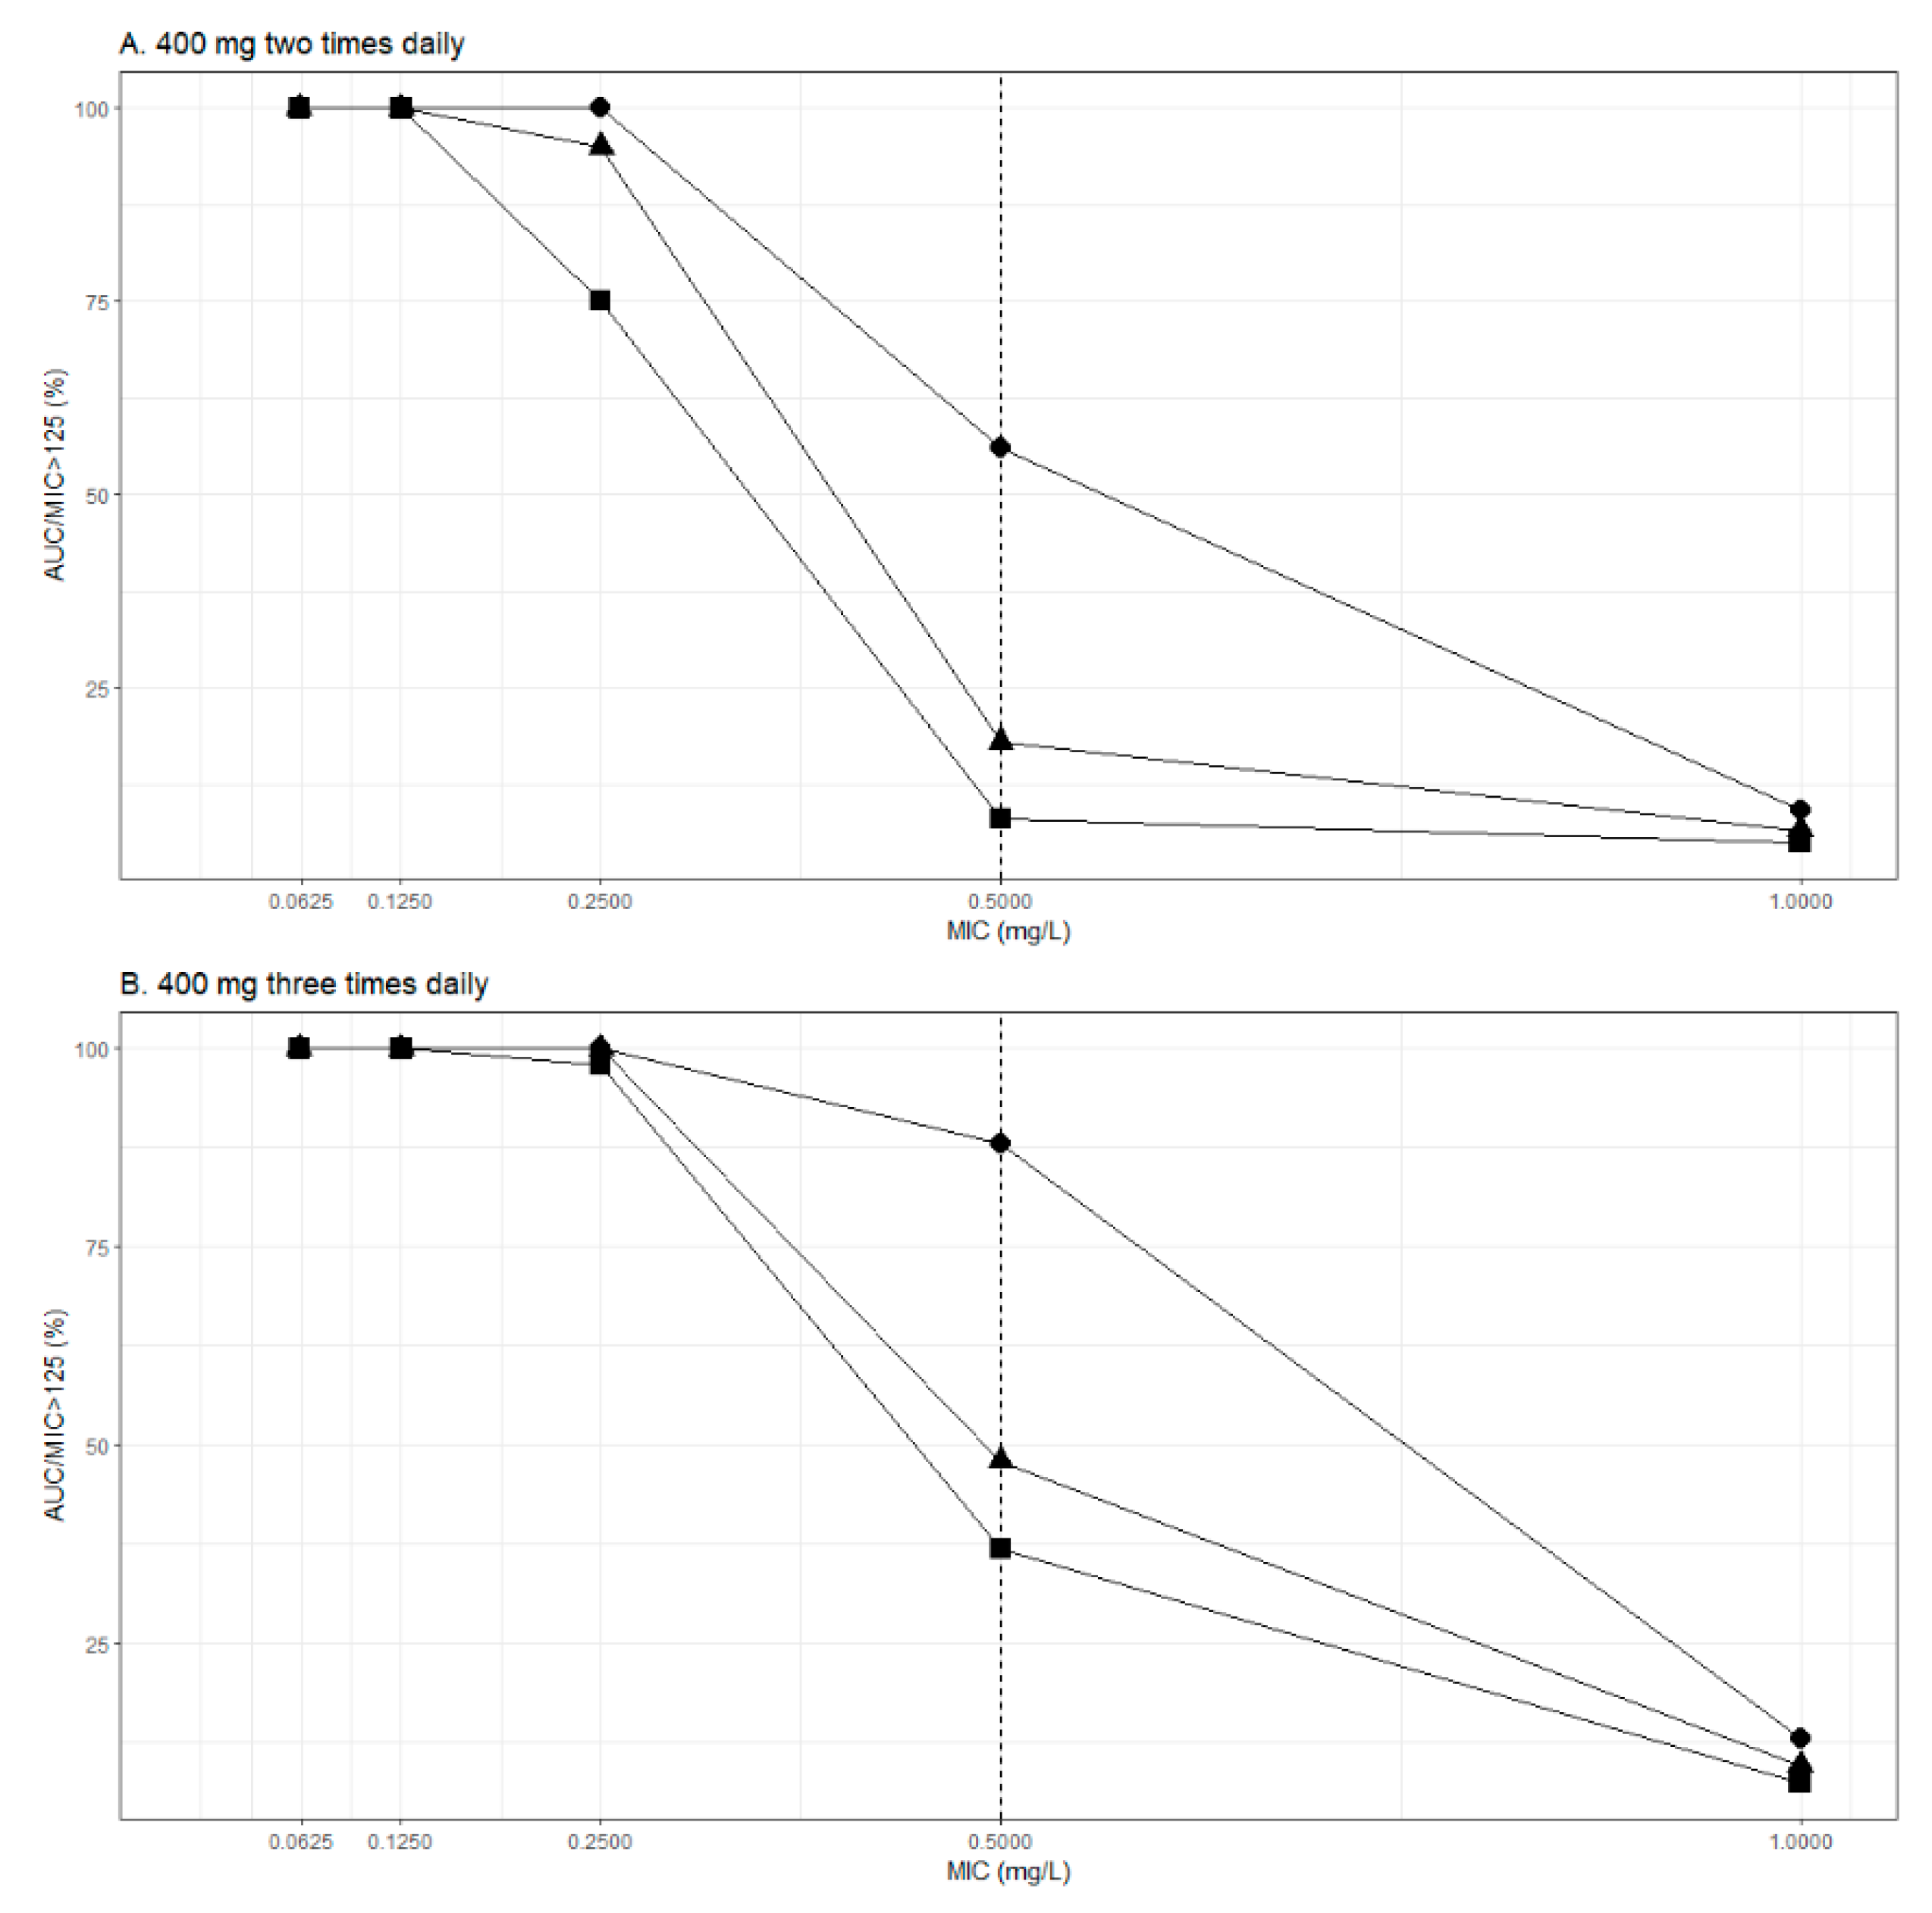
Monte Carlo Simulations
Monte Carlo simulations (n = 1000) were performed to assess the probability of target attainment (PTA) of the PK/PD target for ciprofloxacin (AUC/MIC ratio > 125) for various MICs (0.0625 to 1 mg/L). Standard dosing regimens consisting of 400 mg b.i.d. and t.i.d were simulated for different levels of CLCR (0.5, 1, 1.5 mL/s). Dosing regimen was regarded to be successful if the PTA was >100%.
4. Discussion
Variability in the clinical status of the patients between the early phase and delayed phase of ciprofloxacin treatment was expected, therefore inter-occasion variability was tested. However, no significant differences of ciprofloxacin PK parameters between the early and delayed phases of treatment was observed. Similarly, inter-occasion variability tested as a third level of random effects in the population PK analysis, and it was not significant. Since shifts in body fluid have been implicated as a major cause of alteration in distribution [
24], it can be assumed that especially Vd of hydrophilic drugs may be altered. Ciprofloxacin is lipophilic, and as such it is likely to be less susceptible to changes in distribution during critical illness; however, our study could not precisely describe the distribution phase. Substantial changes in functional of eliminating organs resulting in significant variability of a drug CL are also common in critically ill patients [
24]. In our study population, we consistently observed higher spread (both increase and decrease) of renal-function status in the early phase in comparison with the delayed phase. However, median CL
CR values were without statistically significant difference (
p = 0.5189) in both phases, and thus no significant difference in ciprofloxacin CL between the early and delayed phase was also noted.
In a recent position paper, individualized antibiotic dosing was unambiguously recommended for aminoglycosides, glycopeptides, beta-lactams, and linezolid, while for ciprofloxacin (fluoroquinolones), the therapeutic drug monitoring was neither recommended nor discouraged [
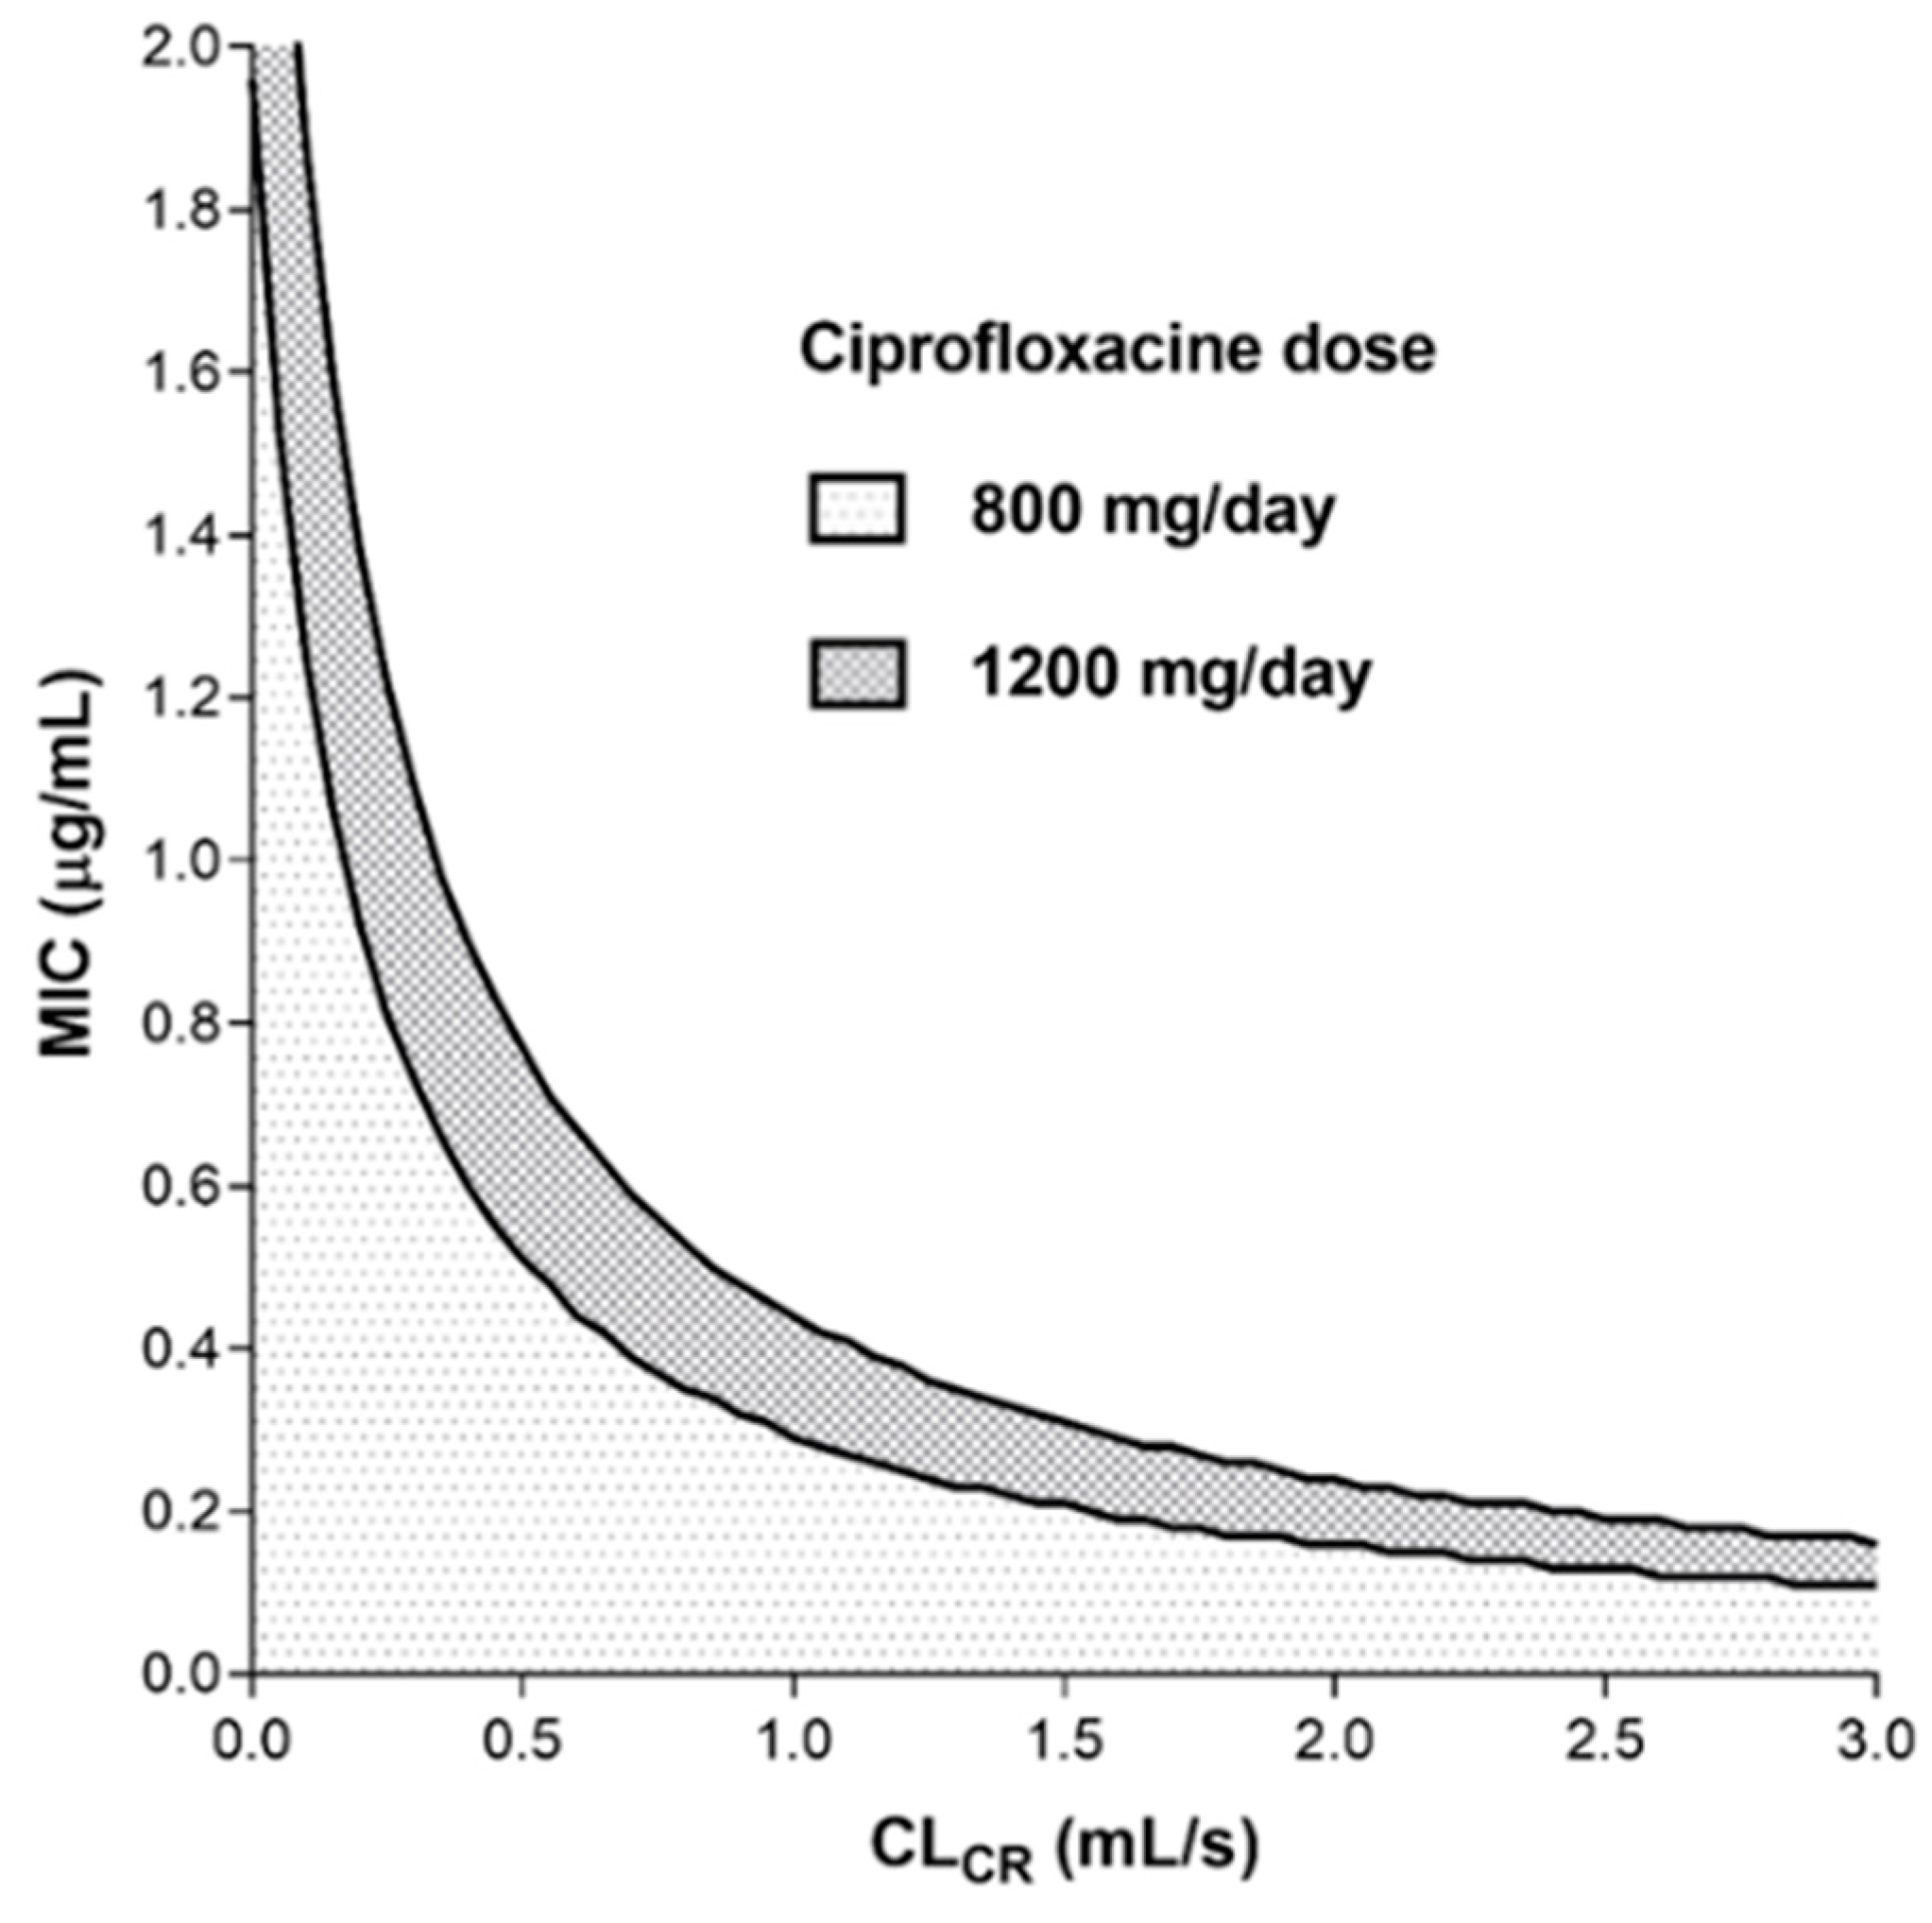
25]. The nomogram based on individual PK analysis (
Figure 1) shows that at standard dosage (800–1200 mg/day), it was practically impossible to reach the recommended ciprofloxacin PK/PD target (AUC/MIC ≥ 125) when the MIC ≥ 0.5 mg/L (except for patients with moderate to severe renal impairment). This observation was consistent with ciprofloxacin-resistance breakpoint value of 0.5 mg/L stated by the European Committee on Antimicrobial Susceptibility Testing (EUCAST). On the other hand, the ciprofloxacin PK/PD target should be reached at standard dosing when the MIC is less than 0.25 mg/L (except in patients with augmented renal clearance), which fully corresponds with the EUCAST-sensitivity breakpoint value for ciprofloxacin. However, it is evident from the nomogram that in patients with augmented renal clearance, even a ciprofloxacin dose of 1200 mg/day may not be effective, and on the contrary, commonly used doses may lead to overexposure in patients with renal impairment.
Monte Carlo simulations were performed to assess PTA of the ciprofloxacin PK/PD target (AUC/MIC ≥ 125). Dosing regimen including 400 mg b.i.d. was sufficient for MICs ≤ 0.125 mg/L but was insufficient for MICs ≥ 0.25 mg/L, except for patients with impaired renal function (CL
CR = 0.5 mL/s). Additionally, a dosing regimen consisting of ciprofloxacin 400 mg t.i.d. enabled PTA > 100% for MICs ≤ 0.25 mg/L. Finally, no dosing regimen achieved sufficient PTA for MICs ≥ 0.5 mg/L. Similar results were obtained in the previous studies conducted in critically ill patients [
4,
26]. Roberts et al. showed that for a directed therapy against
P. aeruginosa (MIC value of 0.5 mg/L), a dose of 600 mg t.i.d. would be needed to achieve an adequate PTA in patients with septic shock [
26]. Although simulations show daily doses > 1200 mg would be required for optimal exposure of ciprofloxacin for MICs ≥ 0.5 mg/L, it is important to note that these dosing regimens have never been prospectively and externally validated. Higher doses increase risk of unwanted effects, which may go undiscovered in critically ill patients who are predisposed to similar adverse effects due to co-medication or their underlying illness. Relatively high incidence of both augmented renal clearance and impaired renal function status among critically ill patients support the clinically reasonable approach to implement therapeutic drug monitoring of fluoroquinolones to safeguard efficacious and safe antimicrobial treatment in this vulnerable patient population.
We can distinguish between the individual and population approaches to perform PK analyses. Advantages and disadvantages of these approaches or their suitability for specific situation are often discussed, but there is a lack of direct comparison of these methods on the same dataset [
27]. Population approach offers significant advantages with respect to comprehensive PK exploration and drug-dosing posology in the population, while the individual approach is superior in terms of the routine clinical care of an individual patient. We analyzed data from our study using both individual and population PK approaches. The median values of ciprofloxacin PK parameters from individual analysis were almost the same as Vd and CL values for a typical individual in the final population model. CL
CR also proved to be the main independent covariate of ciprofloxacin CL in both analyses. In individual analysis CL
CR was also associated with ciprofloxacin Vd. This observation can be explained by fluid retention in patients with impaired renal function resulting in a relative decrease in distribution space for lipophilic agents such as ciprofloxacin. Relation of PK parameters with body size is common, but body weight is usually the strongest covariate, especially in lipophilic drugs [
28]. Since we observed only a weak relationship with height in the individual PK analysis and the other body size descriptors were without significance, it might be considered as a chance finding.
We also compared glomerular filtration rate (measured CL
CR) with multiple estimation equations (CKD-EPI, L–M, C–G, and MDRD) and simple serum creatinine level as determinants of ciprofloxacin CL. As expected, the best predictive performance was shown for measured CL
CR (r
2 = 0.6275). The CKD-EPI or L–M showed numerically better performance in comparison with MDRD, C–G, or simple serum creatinine level, which was in accordance with previous observations in other renally excreted antibiotic agents [
29,
30]. The MDRD formula is applicable primarily in chronic kidney disease subjects. The C–G equation includes body weight, which can lead to a distortion in under- or overweight patients. This may be the reason for the worse performance of glomerular filtration rate calculated by the MDRD or C–G formulas when used in a heterogeneous population. However, estimation of glomerular filtration rate by means of any equation may be reliable only in patients with a stable renal function. Therefore, measurement of CL
CR is considered the “gold standard” in the routine care of patients with unstable renal functions, and estimation methods will likely not be used in the patient population included in our study.
For the individual PK analysis, we used a two-stage method, in the first stage of which the values of the PK parameters in each patient were calculated. Although we used mean (SD) from Drusano et al. as a Bayesian prior [
18], the PK parameters were adapted as random variables via a large number of iterations to achieve maximum fitting of the simulated PK profile with the true observed concentration points in each individual. The fitting was very tight, as evidenced by the goodness-of-fit values. In the second stage, the individual PK parameters were associated with patient characteristics using regression models (continuous variables) or column statistics (categorical variables). The values of PK parameters obtained from this analysis corresponded well with data from other ciprofloxacin individual PK studies [
31,
32,
33,
34].
Although a direct comparison of findings between population PK studies using a NLME approach is difficult due to differences in parameterization and covariate relationships, it is possible to make comparisons between parameter values for typical individuals. So far, two studies using NLME modeling to describe PK ciprofloxacin in critically ill patients have been published [
4,
26]. One of these studies (Roberts et al.) was conducted in patients with sepsis [
26]. To allow comparison of PK parameters, we calculated parameter values for the typical individual from our study with CL
CR of 1.25 mL/s using the provided equations in the corresponding publications. The estimated values of CL in this study for a typical individual (21.5 L/h) were similar to the values reported in the previous studies (25 L/h according to Abdulla et al. [
4], and 15 L/h according to Roberts et al. [
26]). Moreover, Roberts et al. [
26] found CL
CR to be a significant covariate for CL, and this relationship was described as a power function. In our study, this relationship was found to be linear. On the other hand, Abdulla et al. [
4] found no significant covariates for CL. Regarding Vd, we found no predictive covariates, similarly to Abdulla et al. [
4]. Conversely, Roberts et al. [
26] reported body weight to be a predictive covariate for central Vd.
The studies by Abdulla et al. [
4] and Roberts et al. [
26] found the two-compartment model to provide the best description of ciprofloxacin disposition, whereas we selected a one-compartment model. These differences can be explained by a relatively sparse blood sampling at early time points after onset of treatment with ciprofloxacin in the current study, therefore caution should be taken when using this model for extrapolation to early time points after dosing. This was also confirmed by the VPC, as the median of the observed concentrations did not fall into the CI of the median prediction in the early time points after the first dose of ciprofloxacin.


 ,
, 


