
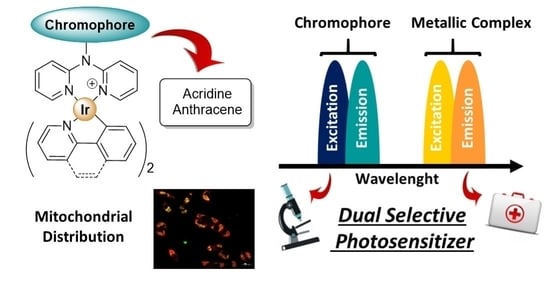
Dual Emissive Ir(III) Complexes for Photodynamic Therapy and Bioimaging

 , , and
Abstract
:
1. Introduction

2. Materials and Methods
2.1. Instrumentation
2.2. Cell Culture
2.3. Cell Viability Assays
2.4. Cytotoxicity Assays
2.5. ROS Production Measurement
2.6. Cell Cycle Analysis
2.7. Fluorescence Confocal Microscopy
2.8. Distribution Coefficient (logP7.4)
2.9. Starting Materials
2.10. General Synthetic Procedures
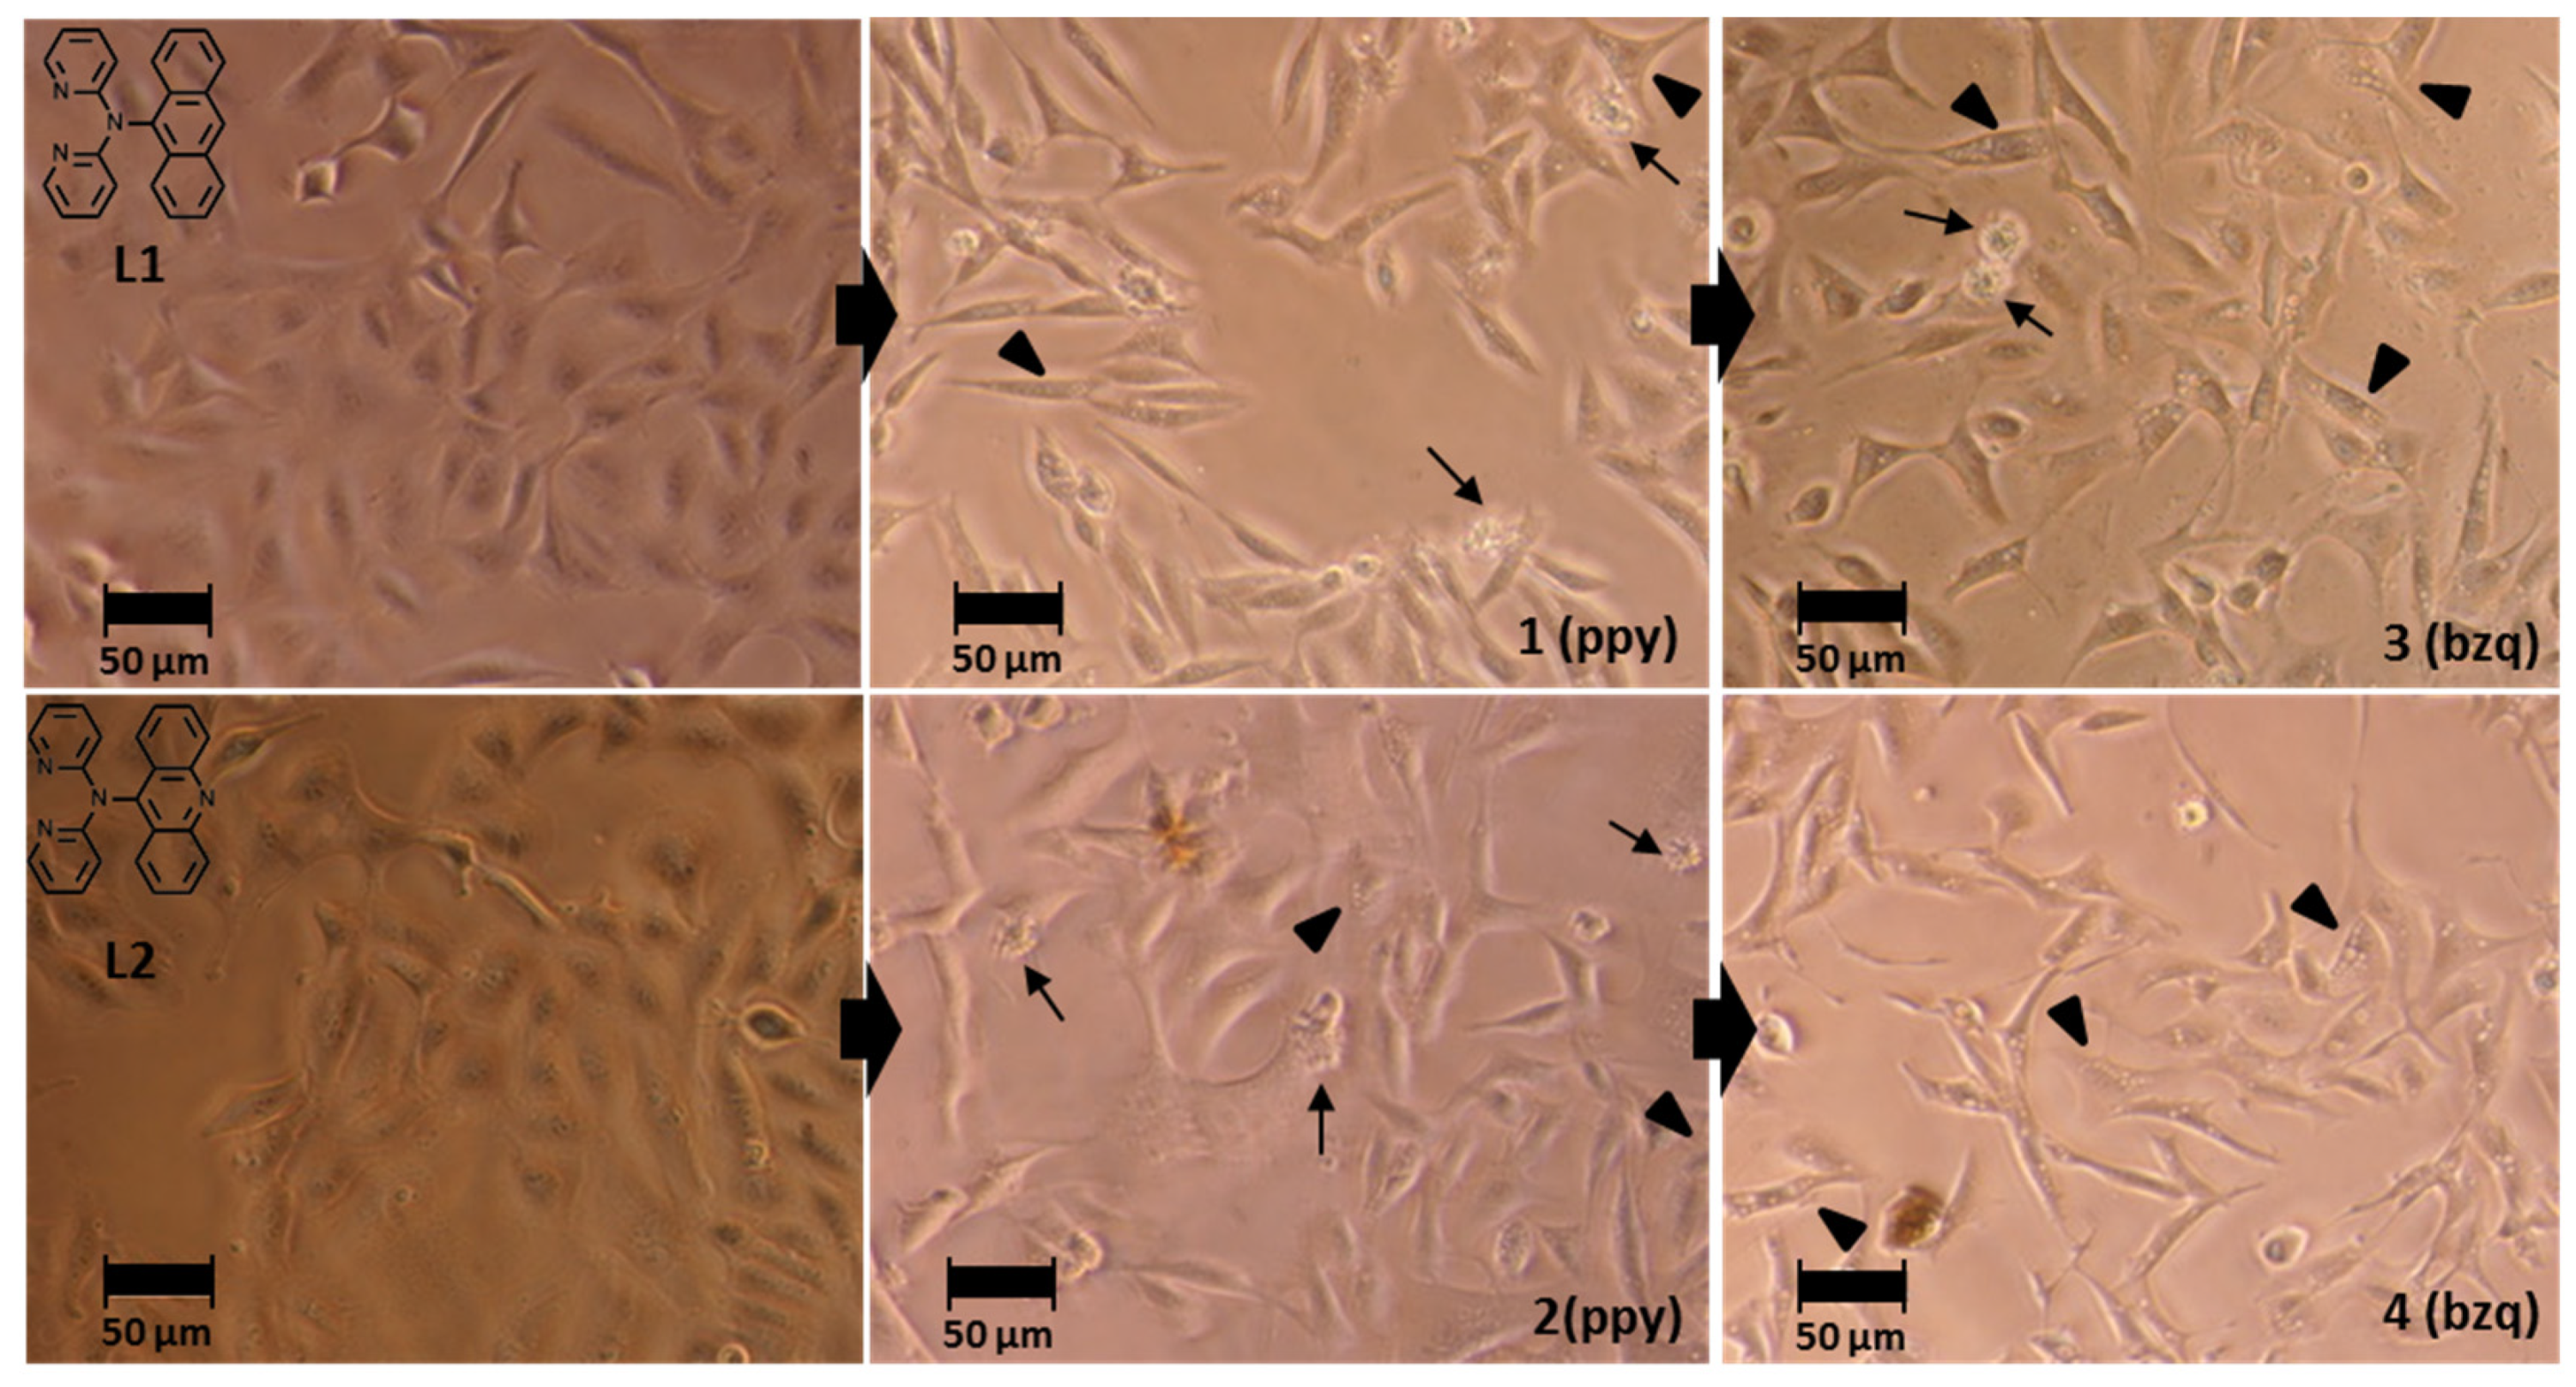
2.10.1. Synthetic Procedure of Ligands L1 and L2
2.10.2. Synthetic Procedure of Complexes 1–2
2.10.3. Synthetic Procedure of Complexes 3–4
3. Results and Discussion
3.1. Preparation and Characterization of Complexes 1–4 and Ligands L1 and L2
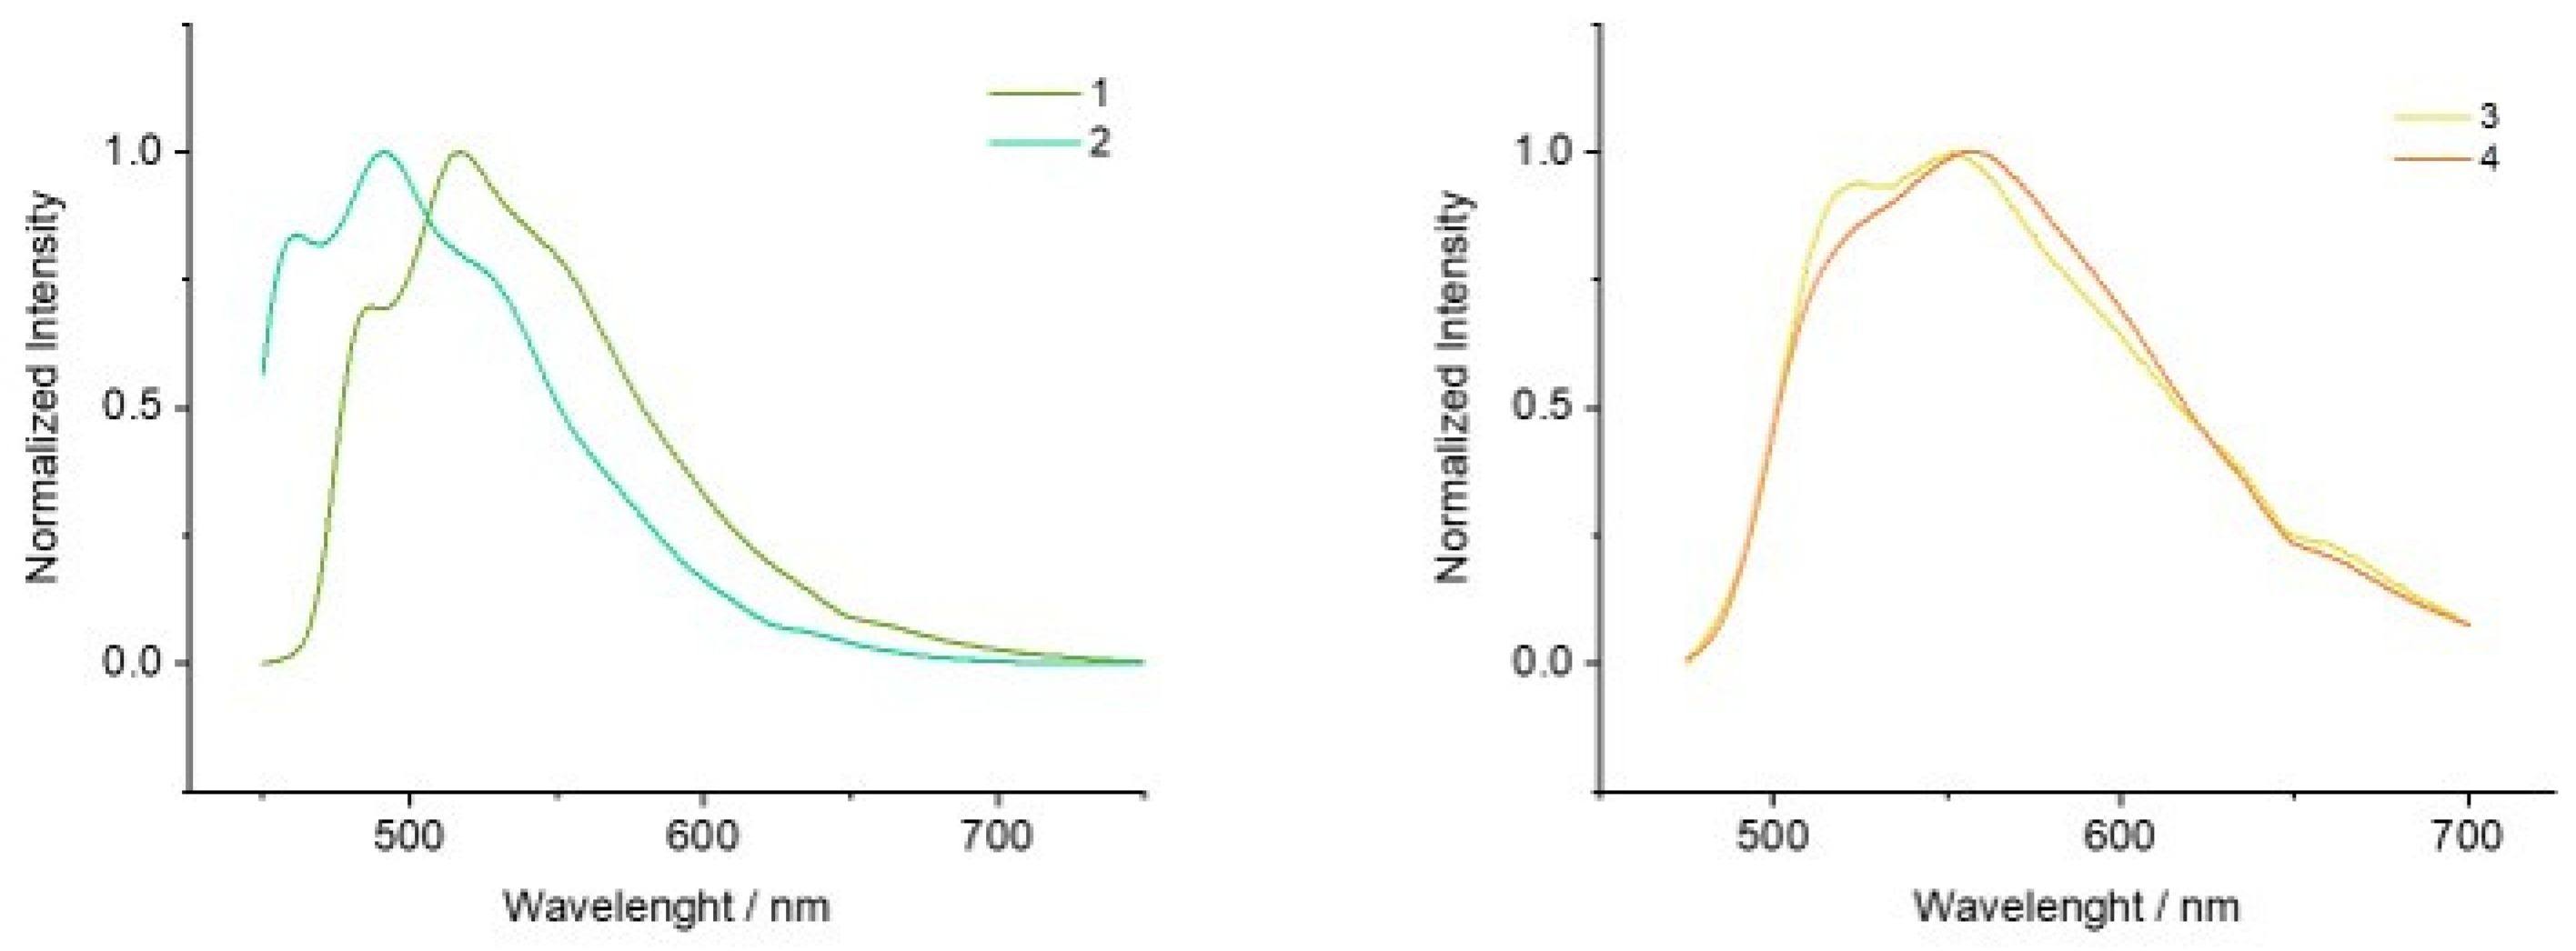
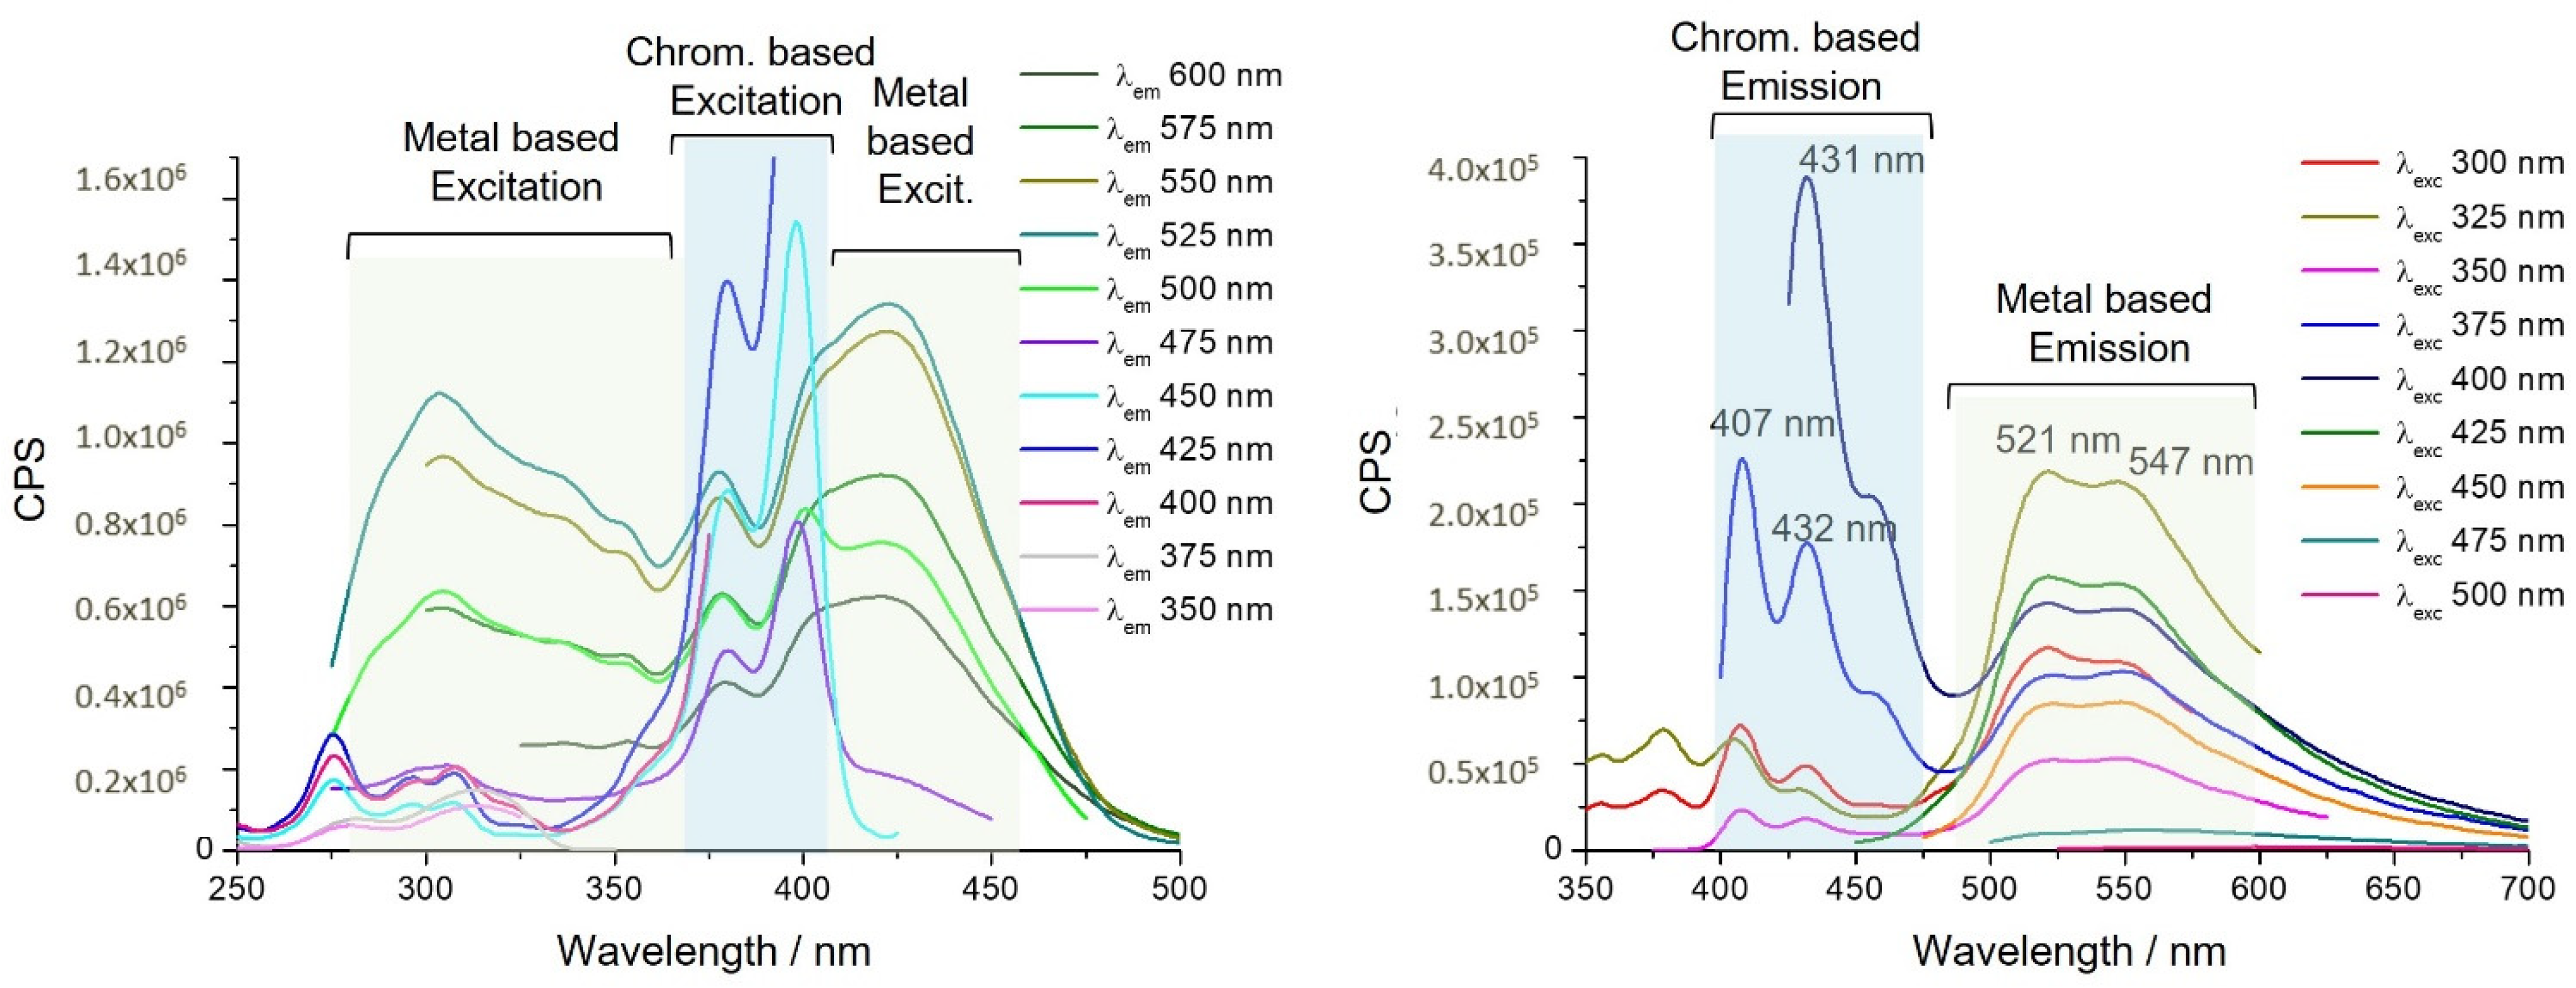
3.2. Optical Properties of Complexes 1–4
3.3. Antiproliferative Activity of Complexes 1–4
3.4. Cell Morphology
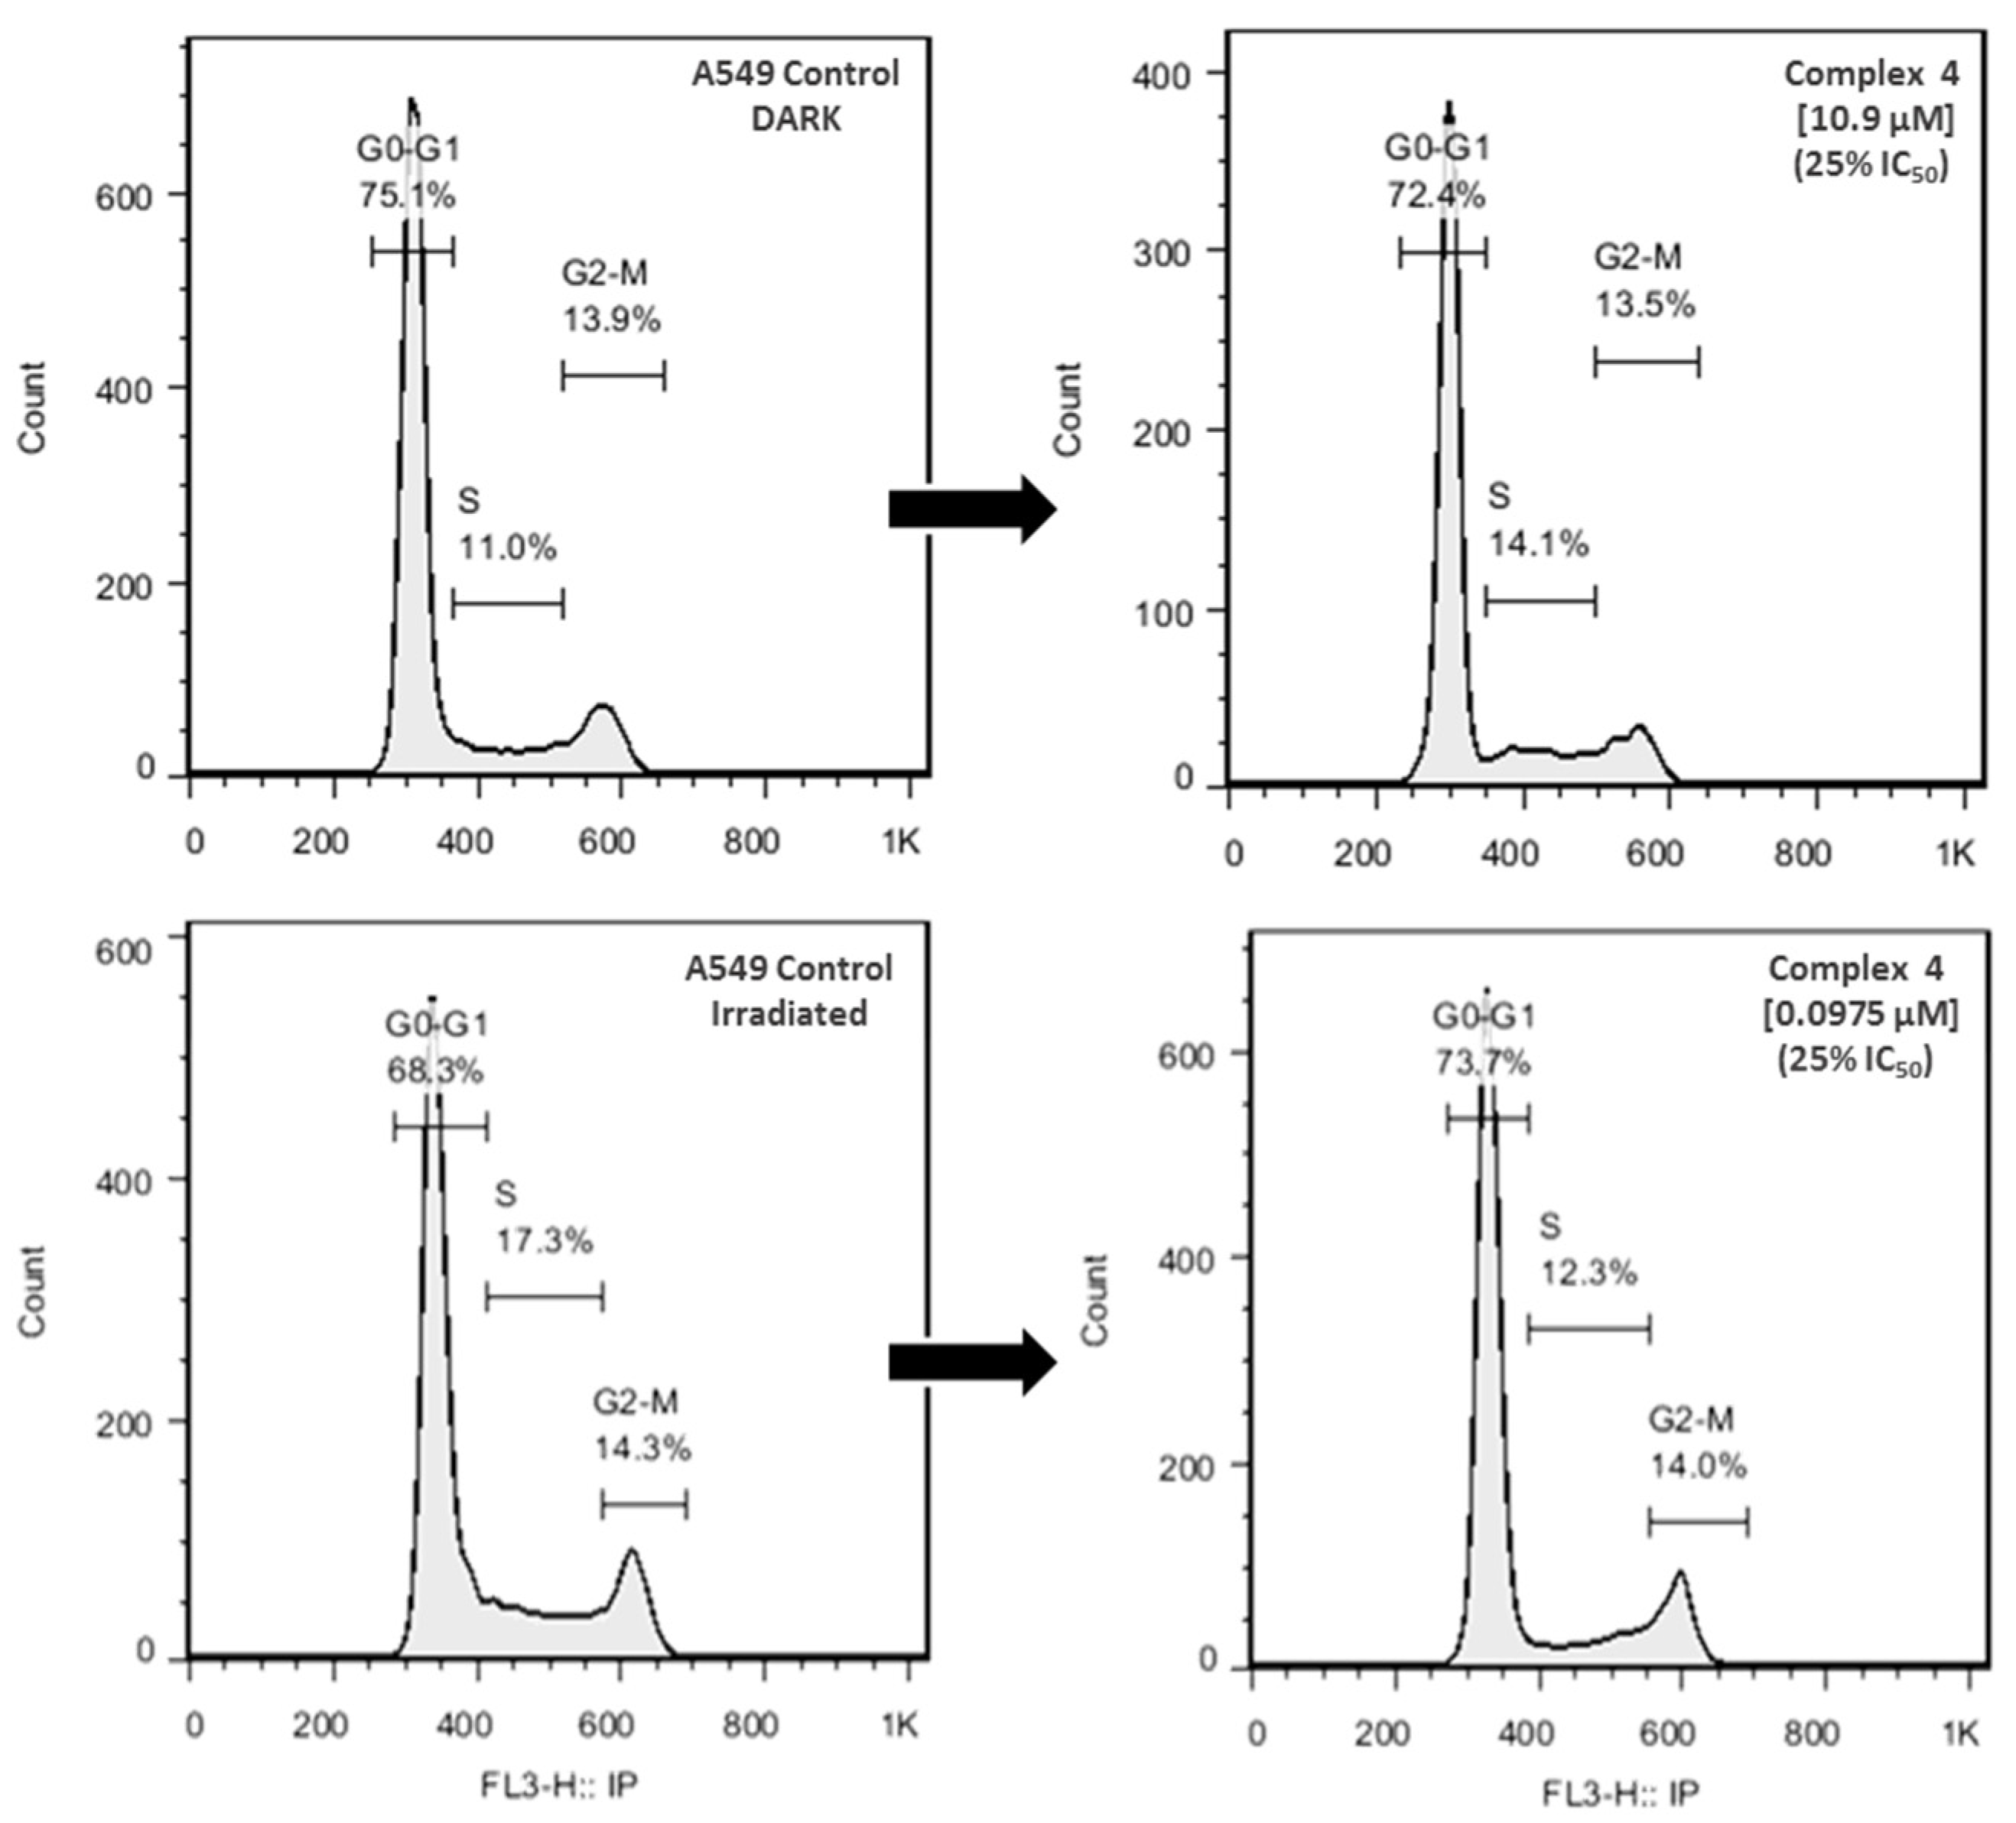
3.5. Cytotoxic Activity, Cell Cycle Arrest of Complex 4 and Partition Coeficient Octanol Water for 1–4 and L1–L2
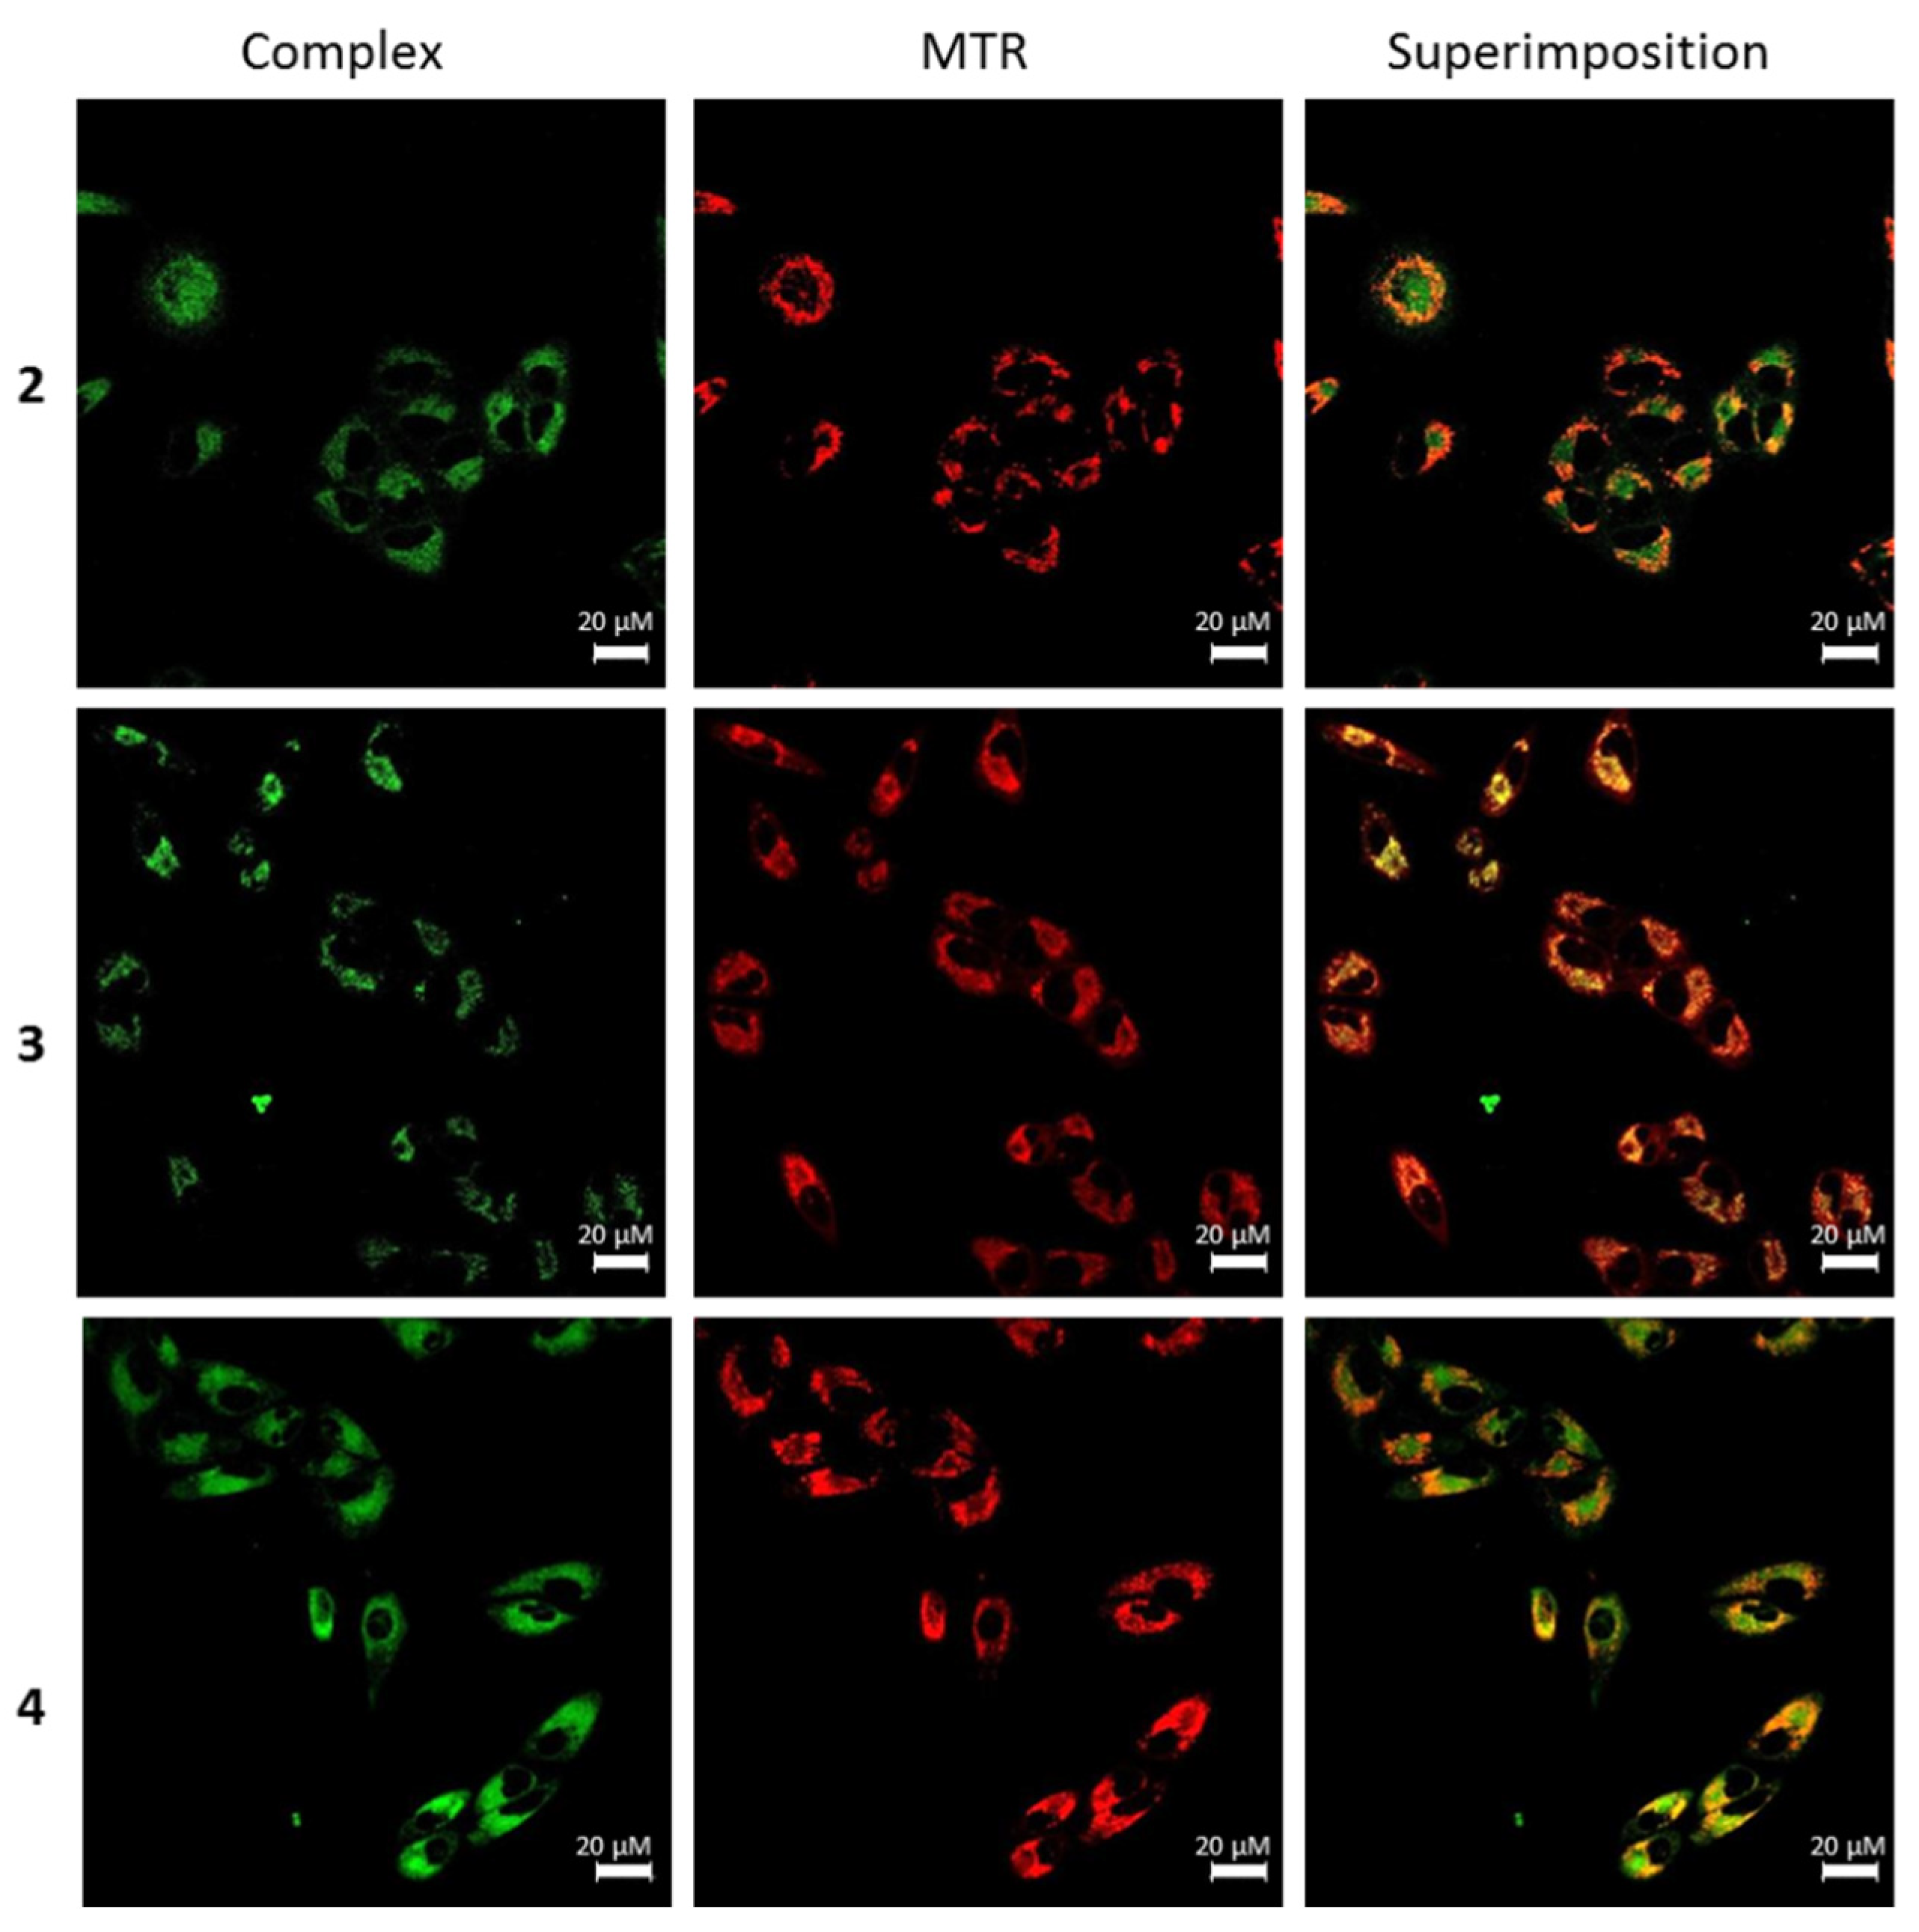
3.6. Subcellular Localization of Complexes 1–4
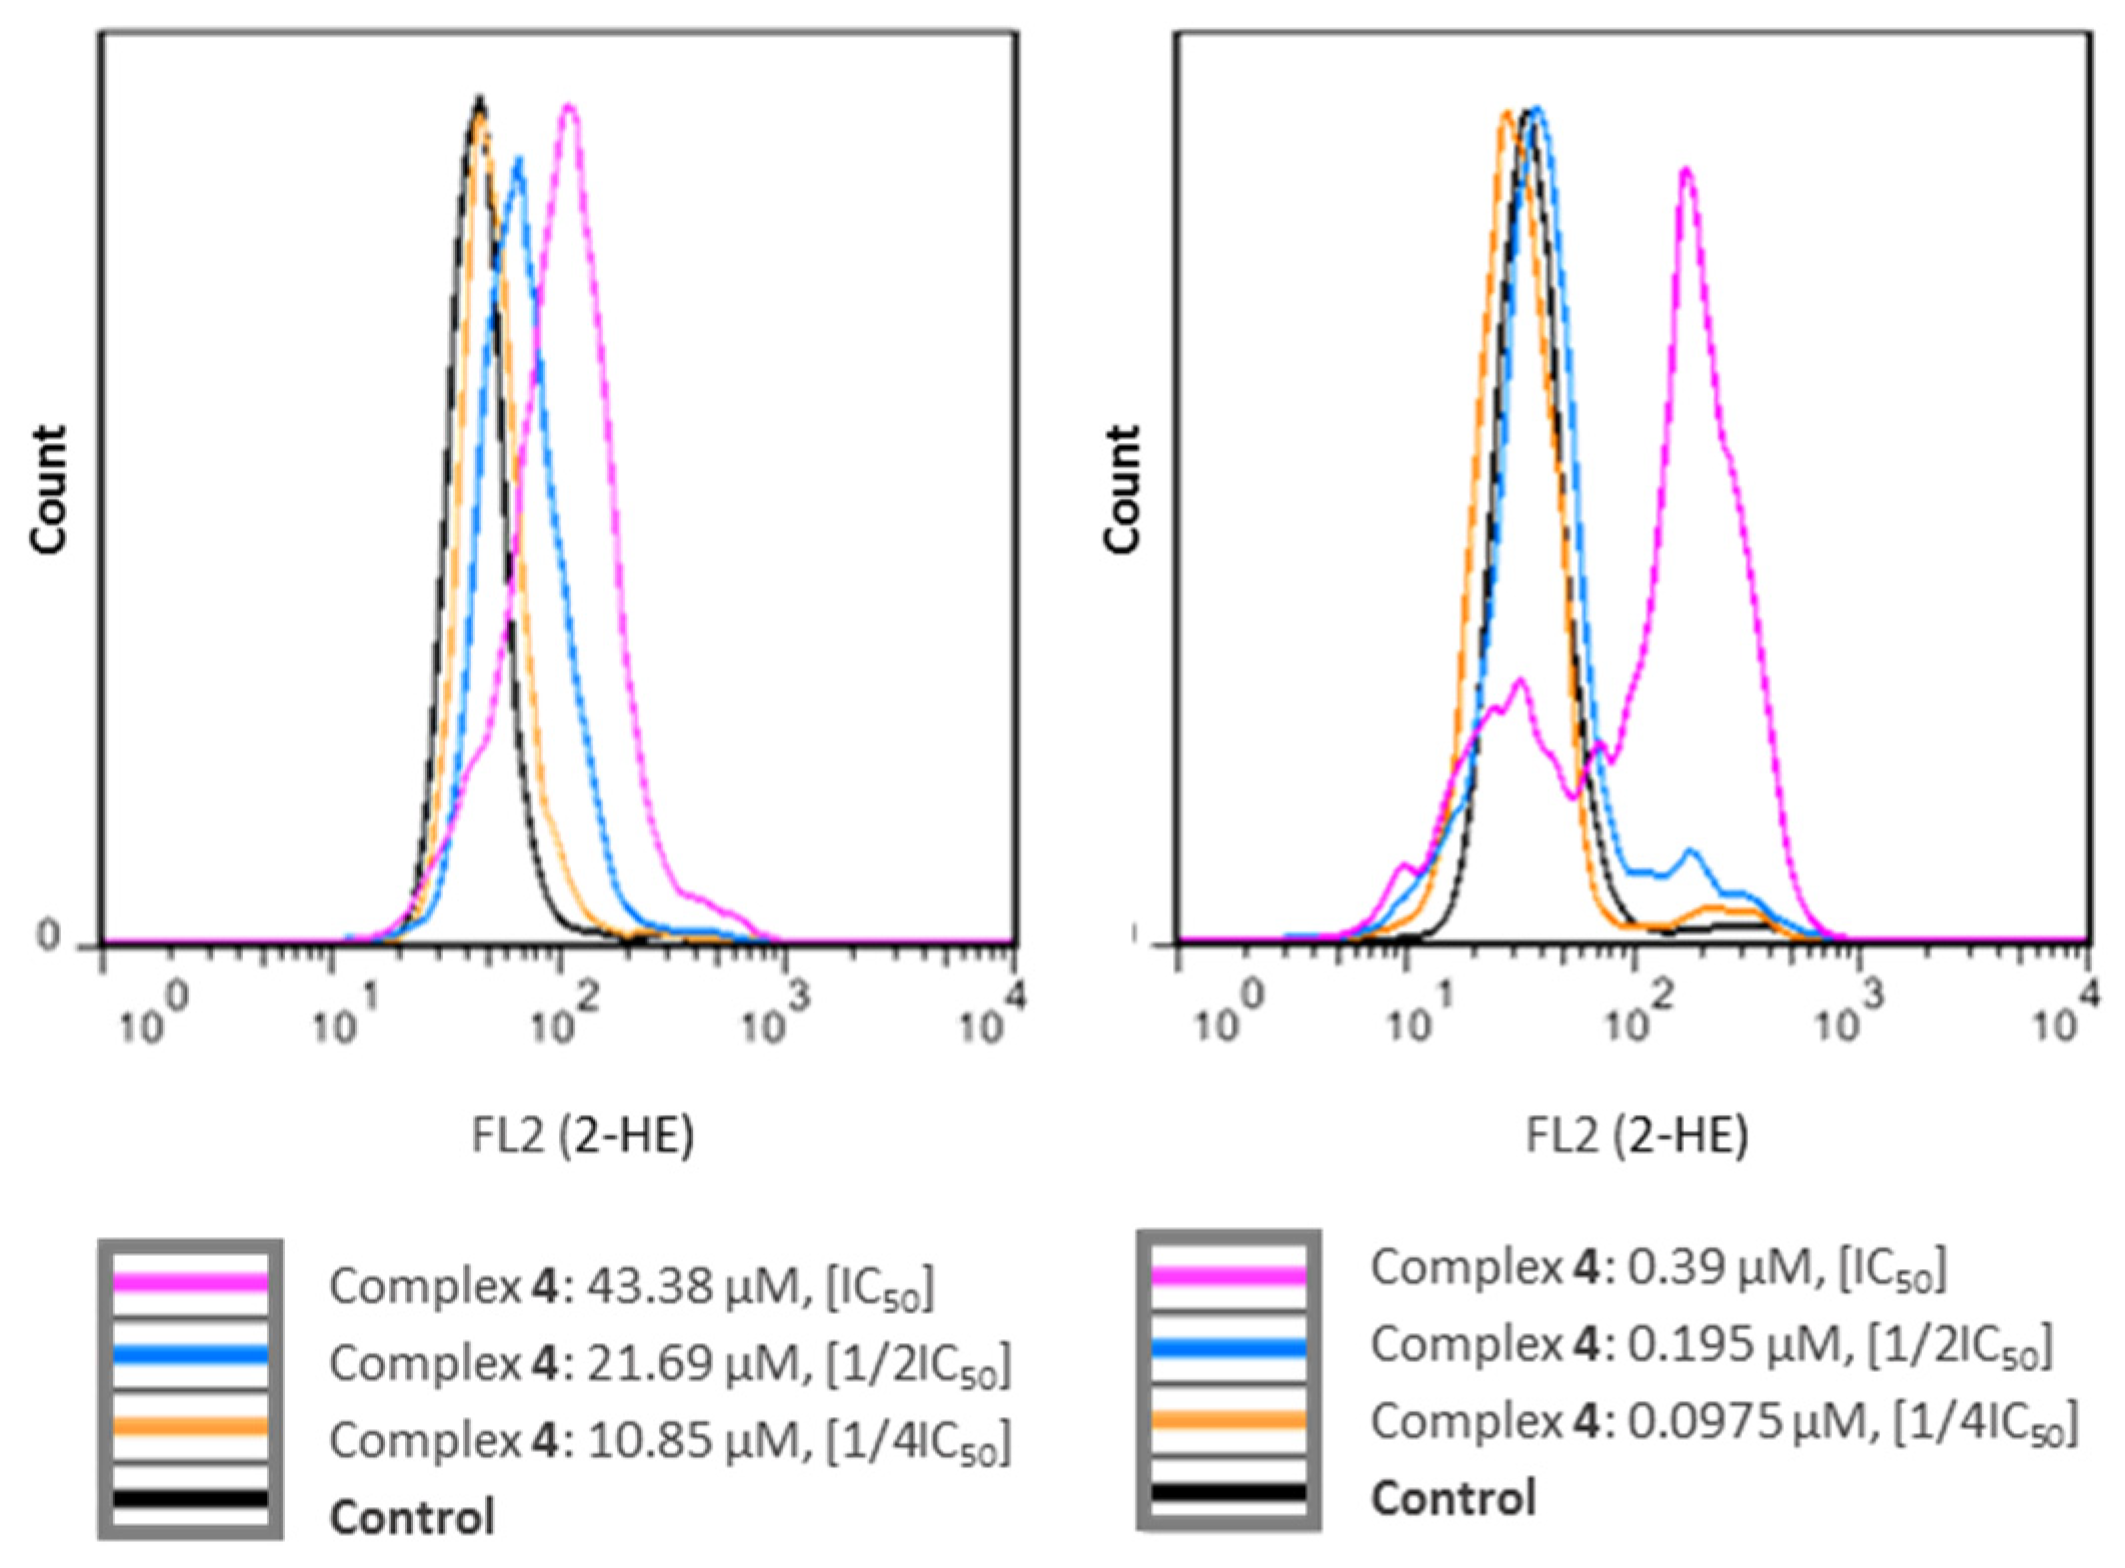
3.7. ROS Generation Potential
4. Conclusions
Supplementary Materials
Author Contributions
Funding
Institutional Review Board Statement
Informed Consent Statement
Data Availability Statement
Acknowledgments
Conflicts of Interest
References
- Abels, C. Targeting of the vascular system of solid tumours by photodynamic therapy (PDT). Photochem. Photobiol. Sci. 2004, 3, 765–771. [Google Scholar] [CrossRef]
- Castano, A.P.; Mroz, P.; Hamblin, M.R. Photodynamic therapy and anti-tumour immunity. Nat. Rev. Cancer 2006, 6, 535–545. [Google Scholar] [CrossRef] [PubMed] [Green Version]
- Mroz, P.; Szokalska, A.; Wu, M.X.; Hamblin, M.R. Photodynamic therapy of tumors can lead to development of systemic antigen-specific immune response. PLoS ONE 2010, 5, e15194. [Google Scholar] [CrossRef] [PubMed] [Green Version]
- Dąbrowski, J.M. Reactive Oxygen Species in Photodynamic Therapy: Mechanisms of Their Generation and Potentiation. Adv. Inorg. Chem. 2017, 70, 343–394. [Google Scholar] [CrossRef]
- McKenzie, L.K.; Bryant, H.E.; Weinstein, J.A. Transition metal complexes as photosensitisers in one- and two-photon photodynamic therapy. Coord. Chem. Rev. 2019, 379, 2–29. [Google Scholar] [CrossRef] [Green Version]
- Josefsen, L.B.; Boyle, R.W. Photodynamic therapy and the development of metal-based photosensitisers. Met.-Based Drugs 2008, 2008, 276109. [Google Scholar] [CrossRef] [PubMed] [Green Version]
- Stacey, O.J.; Pope, S.J.A. New avenues in the design and potential application of metal complexes for photodynamic therapy. RSC Adv. 2013, 3, 25550–25564. [Google Scholar] [CrossRef]
- Monro, S.; Colón, K.L.; Yin, H.; Roque, J.; Konda, P.; Gujar, S.; Thummel, R.P.; Lilge, L.; Cameron, C.G.; McFarland, S.A. Transition metal complexes and photodynamic therapy from a tumor–centered approach: Challenges, opportunities, and highlights from the development of TLD1433. Chem. Rev. 2019, 119, 797–828. [Google Scholar] [CrossRef]
- Caporale, C.; Massi, M. Cyclometallated iridium(III) complexes for life science. Coord. Chem. Rev. 2018, 363, 71–91. [Google Scholar] [CrossRef] [Green Version]
- Zamora, A.; Vigueras, G.; Rodríguez, V.; Santana, M.D.; Ruiz, J. Cyclometallated iridium(III) luminescent complexes in therapy and phototherapy. Coord. Chem. Rev. 2018, 360, 34–76. [Google Scholar] [CrossRef]
- Ouyang, M.; Zeng, L.; Huang, H.; Jin, C.; Liu, J.; Chen, Y.; Jia, L.; Chao, H. Fluorinated cyclometallated iridium(III) complexes as mitochondria-targeted theranostic anticancer agents. Dalton Trans. 2017, 46, 6734–6744. [Google Scholar] [CrossRef] [PubMed]
- Liu, S.; Liang, H.; Zhang, K.Y.; Zhao, Q.; Zhou, X.; Xua, W.; Huang, W. A multifunctional phosphorescent iridium(III) complex for specific nucleus staining and hypoxia monitoring. Chem. Commun. 2015, 51, 7943–7946. [Google Scholar] [CrossRef]
- Luengo, A.; Marzo, I.; Reback, M.; Daubit, I.M.; Fernández-Moreira, V.; Metzler-Nolte, N.; Gimeno, M.C. Luminescent bimetallic IrIII/AuI peptide bioconjugates as potential theranostic agents. Chem. Eur. J. 2020, 26, 12158–12167. [Google Scholar] [CrossRef] [PubMed]
- Redrado, M.; Benedi, A.; Marzo, I.; García-Otín, A.L.; Fernández-Moreira, V.; Gimeno, M.C. Multifunctional heterometallic IrIII−AuI probes as promising anticancer and antiangiogenic agents. Chem. Eur. J. 2021, 27, 9885–9897. [Google Scholar] [CrossRef]
- Mahalingam, S.M.; Ordaz, J.D.; Low, P.S. Targeting of a photosensitizer to the mitochondrion enhances the potency of photo-dynamic therapy. ACS Omega 2018, 3, 6066–6074. [Google Scholar] [CrossRef]
- Jeena, M.T.; Kim, S.; Jin, S.; Ryu, J.-H. Recent progress in mitochondria-targeted drug and drug-free agents for cancer therapy. Cancers 2020, 12, 4. [Google Scholar] [CrossRef] [Green Version]
- Rubio, N.; Fleury, S.P.; Redmond, R.W. Spatial and temporal dynamics of in vitro photodynamic cell killing: Extracellular hydrogen peroxide mediates neighbouring cell death. Photochem. Photobiol. Sci. 2009, 8, 457–464. [Google Scholar] [CrossRef]
- Wilson, B.C.; Olivo, M.; Singh, G. Subcellular localization of photofrin and aminolevulinic acid and photodynamic cross-resistance in vitro in radiation-induced fibrosarcoma cells sensitive or resistant to photofrin-mediated photodynamic therapy. Photochem. Photobiol. 1997, 65, 166–176. [Google Scholar] [CrossRef]
- Belzacq, A.; Jacotot, E.; Vieira, H.L.A.; Mistro, D.; Granville, D.J.; Xie, Z.; Reed, J.C.; Kroemer, G.; Brenner, C. Apoptosis induction by the photosensitizer verteporfin: Identification of mitochondrial adenine nucleotide translocator as a critical target. Cancer Res. 2001, 61, 1260–1264. [Google Scholar]
- Arnaut, L.G.; Pereira, M.M.; Dąbrowski, J.M.; Silva, E.F.F.; Schaberle, F.A.; Abreu, A.R.; Rocha, L.B.; Barsan, M.M.; Urbańska, K.; Stochel, G.; et al. Photodynamic Therapy Efficacy Enhanced by Dynamics: The Role of Charge Transfer and Photostability in the Selection of Photosensitizers. Chem. Eur. J. 2014, 20, 5346–5357. [Google Scholar] [CrossRef] [PubMed]
- Dąbrowski, J.M.; Arnaut, L.G.; Pereira, M.M.; Urbańska, K.; Simões, S.; Stochel, G.; Cortes, L. Combined effects of singlet oxygen and hydroxyl radical in photodynamic therapy with photostable bacteriochlorins: Evidence from intracellular fluorescence and increased photodynamic efficacy in vitro. Free Radic. Biol. Med. 2012, 52, 1188–1200. [Google Scholar] [CrossRef]
- Song, X.D.; Chen, B.B.; He, S.F.; Pan, N.L.; Liao, J.X.; Chen, J.X.; Wang, G.H.; Sun, J. Guanidine-modified cyclometallated iridium(III) complexes for mitochondria-targeted imaging and photodynamic therapy. Eur. J. Med. Chem. 2019, 179, 26–37. [Google Scholar] [CrossRef] [PubMed]
- Pracharova, J.; Vigueras, G.; Novohradsky, V.; Cutillas, N.; Janiak, C.; Kostrhunova, H.; Kasparkova, J.; Ruiz, J.; Brabec, V. Exploring the effect of polypyridyl ligands on the anticancer activity of phosphorescent iridium(III) complexes: From proteosynthesis inhibitors to photodynamic therapy agents. Chem. Eur. J. 2018, 24, 4607–4619. [Google Scholar] [CrossRef] [PubMed]
- Xie, Y.; Ding, Y.; Li, X.; Wang, C.; Hill, J.P.; Ariga, K.; Zhang, W.; Zhua, W. Selective, sensitive and reversible ‘‘turn-on’’ fluorescent cyanide probes based on 2,20-dipyridylaminoanthracene–Cu2+ ensembles. Chem. Commun. 2012, 48, 11513–11515. [Google Scholar] [CrossRef] [PubMed]
- Fulmer, G.R.; Miller, A.J.M.; Sherden, N.H.; Gottlieb, H.E.; Nudelman, A.; Stoltz, B.M.; Bercaw, J.E.; Goldberg, K.I. NMR chemical shifts of trace impurities: Common laboratory solvents, organics, and gases in deuterated solvents relevant to the organometallic chemist. Organometallics 2010, 29, 2176–2179. [Google Scholar] [CrossRef] [Green Version]
- García-Moreno, E.; Cerrada, E.; Bolsa, M.J.; Luquin, A.; Laguna, M. Water-soluble phosphanes derived from 1,3,5-triaza-7-phosphaadamantane and their reactivity towards gold(I) complexes. Eur. J. Inorg. Chem. 2013, 2013, 2020–2030. [Google Scholar] [CrossRef]
- Sprouse, S.; King, K.A.; Spellane, P.J.; Watts, R.J. Photophysical effects of metal-carbon. sigma. bonds in ortho-metalated complexes of iridium(III) and rhodium(III). J. Am. Chem. Soc. 1984, 106, 6647–6653. [Google Scholar] [CrossRef]
- Visbal, R.; Laguna, A.; Gimeno, M.C. N-Heterocyclic Carbene Coinage Metal Complexes as Intense Blue-Green Emitters. Organometallics 2012, 31, 7146–7157. [Google Scholar] [CrossRef] [Green Version]
- Visbal, R.; Gimeno, M.C. N-heterocyclic carbene metal complexes: Photoluminescence and applications. Chem. Soc. Rev. 2014, 43, 3551–3574. [Google Scholar] [CrossRef]
- Vaquero, M.; Ruiz-Riaguas, A.; Martínez-Alonso, M.; Jalón, F.A.; Manzano, B.R.; Rodríguez, A.M.; García-Herbosa, G.; Carbayo, A.; García, B.; Espino, G. Selective photooxidation of sulfides catalyzed by bis-cyclometallated IrIII photosensitizers bearing 2,2′-dipyridylamine-based ligands. Chem. Eur. J. 2018, 24, 10662–10671. [Google Scholar] [CrossRef] [Green Version]
- Costa, R.D.; Ortí, E.; Bolink, H.J.; Monti, F.; Accorsi, G.; Armaroli, N. Luminescent ionic transition-metal complexes for light-emitting electrochemical cells. Angew. Chem. Int. Ed. 2012, 51, 8178–8211. [Google Scholar] [CrossRef] [PubMed]
- Bhat, S.S.; Revankar, V.K.; Pinjari, R.V.; Naveen, S.; Lokanath, N.K.; Kumbar, V.; Bhate, K.; Kokarea, D.G. Phosphorescent cyclometallated iridium(III) complexes: Synthesis, photophysics, DNA interaction, cellular internalization, and cytotoxic activity. New J. Chem. 2018, 42, 16846–16854. [Google Scholar] [CrossRef]
- Ladouceur, S.; Fortin, D.; Zysman-Colman, E. Enhanced luminescent iridium(III) complexes bearing aryltriazole cyclometallated ligands. Inorg. Chem. 2011, 50, 11514–11526. [Google Scholar] [CrossRef]
- Van Engeland, M.; Nieland, L.J.; Ramaekers, F.C.; Schutte, B.; Reutelingsperger, C.P. Annexin V-affinity assay: A review on an apoptosis detection system based on phosphatidylerine exposure. Cytom. J. Int. Soc. Anal. Cytol. 1998, 31, 1–9. [Google Scholar] [CrossRef]
- Sperandio, S.; Poksay, K.S.; Schilling, B.; Danielle, C.; Gibson, B.W.; Bredsen, D.E. Identification of new modulators and protein alterations in non-apoptotic programmed cell death. J. Cell Biochem. 2010, 111, 1401–1412. [Google Scholar] [CrossRef] [PubMed] [Green Version]
- Kops, G.J.P.L.; Weaver, B.A.A.; Cleveland, D.W. On the road to cancer: Aneuploidy and mitotic Checkpoint. Nat. Rev. Cancer 2005, 5, 773–785. [Google Scholar] [CrossRef]
- Amezqueta, S.; Subirats, X.; Fuguet, E.; Roses, M.; Rafols, C. Chapter 6—Octanol-Water Partition Constant. In Handbooks in Separation Science: Liquid-Phase Extraction; Elsevier: Amsterdam, The Netherlands, 2020. [Google Scholar]
- Lipinski, C.A.; Lombardo, F.; Dominy, B.W.; Feeney, P.J. Experimental and computational approaches to estimate solubility and permeability in drug discovery and development settings. Adv. Drug Deliv. Rev. 2001, 46, 3–26. [Google Scholar] [CrossRef]
- Liu, X.; Dai, P.; Gu, T.; Wu, Q.; Wei, H.; Liu, S.; Zhang, K.Y.; Zhao, Q. Cyclometallated iridium(III) complexes containing an anthracene unit for sensing and imaging singlet oxygen in cellular mitochondria. J. Inorg. Biochem. 2020, 209, 111106–111116. [Google Scholar] [CrossRef] [PubMed]
- Lennarz, W.; Lane, M.; Modrich, P.; Dixon, J.; Carafoli, E.; Exton, J.; Cleveland, D. Golgi Complex. In Encyclopedia of Biological Chemistry; Elsevier: Amsterdam, The Netherlands, 2004. [Google Scholar] [CrossRef]
- Ho, C.-L.; Wong, K.-L.; Kong, H.-K.; Ho, Y.-M.; Chan, C.T.-L.; Kwok, W.-M.; Leung, K.S.-Y.; Tam, H.-L.; Lam, M.H.-W.; Ren, X.-F.; et al. A strong two-photon induced phosphorescent Golgi-specific in vitro marker based on a heteroleptic iridium complex. Chem. Commun. 2012, 48, 2525–2527. [Google Scholar] [CrossRef] [PubMed]
- Lo, K.K.-W.; Zhang, K.Y. Iridium (III) complexes as therapeutic and bioimaging reagents for cellular applications. RSC Adv. 2012, 2, 12069–12083. [Google Scholar] [CrossRef]
- Huang, H.; Banerjee, S.; Sadler, P.J. Recent advances in the design of targeted iridium(III) photosensitizers for photodynamic therapy. ChemBioChem 2018, 19, 1574–1589. [Google Scholar] [CrossRef] [PubMed]


| UV-vis a (×103 ε/dm3 mol−1 cm−1)/nm | λem [λexc] (nm) b | τ (ns) b | Φ (%) c | |
|---|---|---|---|---|
| L1 | 260 (47.5), 318 (8.7), 355 (3.4), 373 (5.2), 394 (4.5) | 405, 422, 448 [375] | - | - |
| L2 | 260 (47.5), 270 (30.7), 317 (16.2), 350 (7.5), 362 (9.8), 388 (5.4) | 409, 431, 557 [400] | - | - |
| 1 | 260 (94.4), 320 (14.5), 354 (10.0), 375 (10.7), 395 (8.9), 424 (3.9) | 486, 515s, 551 [437] | 186 | 8.3 |
| 2 | 260 (87.5), 273 (68.1), 310 (25.4), 380 (20.2), 400 (22.1), 427 (6.5) | 485, 514 [433] | 210 | 8.4 |
| 3 | 260 (43.4), 324 (9.4), 353 (6.7), 374 (5.5), 394 (3.9), 423 (1.8) | 521s, 551s [432] | 242 | 6.4 |
| 4 | 260 (39.1), 271 (35.1), 308 (12.9), 380 (10.1), 398 (11.5), 425 (3.2) | 521s, 547s 407s, 432, 458 [450] | 451 | 10 |
| Complexes | IC50 (DARK) | IC50(λexc 405 nm) 1 | PI | IC50(λexc 470 nm) 1 | PI |
|---|---|---|---|---|---|
| L1 | >50 | - | - | ||
| L2 | >50 | - | - | ||
| 1 | 13.6 ± 0.08 | 1.16 ± 0.06 | 11.7 | 0.18 ± 0.05 | 75.5 |
| 2 | 19.6 ± 0.68 | 2.54 ± 0.08 | 7.7 | 0.34 ± 0.06 | 57.6 |
| 3 | 18.9 ± 0.12 | 1.35 ± 0.08 | 14.0 | 0.40 ± 0.08 | 47.2 |
| 4 | 43.38 ± 0.14 | >5 | 0.39 ± 0.09 | 111.2 |
| Ligands | logP(Oct/W) | Complexes | logP(Oct/W) | Complexes | logP(Oct/W) |
|---|---|---|---|---|---|
| L1 | 1.20 | 1 | 0.75 | 3 | 1.73 |
| L2 | 0.59 | 2 | 0.28 | 4 | 1.24 |
Publisher’s Note: MDPI stays neutral with regard to jurisdictional claims in published maps and institutional affiliations. |
© 2021 by the authors. Licensee MDPI, Basel, Switzerland. This article is an open access article distributed under the terms and conditions of the Creative Commons Attribution (CC BY) license (https://creativecommons.org/licenses/by/4.0/).
Share and Cite
Redrado, M.; Benedi, A.; Marzo, I.; Gimeno, M.C.; Fernández-Moreira, V. Dual Emissive Ir(III) Complexes for Photodynamic Therapy and Bioimaging. Pharmaceutics 2021, 13, 1382. https://doi.org/10.3390/pharmaceutics13091382
Redrado M, Benedi A, Marzo I, Gimeno MC, Fernández-Moreira V. Dual Emissive Ir(III) Complexes for Photodynamic Therapy and Bioimaging. Pharmaceutics. 2021; 13(9):1382. https://doi.org/10.3390/pharmaceutics13091382
Chicago/Turabian StyleRedrado, Marta, Andrea Benedi, Isabel Marzo, M. Concepción Gimeno, and Vanesa Fernández-Moreira. 2021. "Dual Emissive Ir(III) Complexes for Photodynamic Therapy and Bioimaging" Pharmaceutics 13, no. 9: 1382. https://doi.org/10.3390/pharmaceutics13091382
APA StyleRedrado, M., Benedi, A., Marzo, I., Gimeno, M. C., & Fernández-Moreira, V. (2021). Dual Emissive Ir(III) Complexes for Photodynamic Therapy and Bioimaging. Pharmaceutics, 13(9), 1382. https://doi.org/10.3390/pharmaceutics13091382