
Rizatriptan-Loaded Oral Fast Dissolving Films: Design and Characterizations
 , , , , and
Abstract
:1. Introduction
2. Materials and Methods
2.1. Materials
2.2. Fabrication of RZT-ODFs
2.3. Experimental Design for RZT-ODFs
2.4. Characterization of RZT-ODFs
2.4.1. Appearance and Morphology
2.4.2. Thickness, Weight and Drug Content Uniformity
2.4.3. Mechanical Analysis
2.4.4. Determination of pH, Moisture Content, and Water Absorption
2.4.5. Disintegration Time (D-Time)
2.4.6. In Vitro Drug Dissolution Study
2.5. Compatibility Test of RZT-ODFs
2.5.1. X-ray Diffractometric (XRD) Analysis
2.5.2. Differential Scanning Calorimetry (DSC) Analysis
2.5.3. Fourier Transform Infrared (FTIR) Spectroscopy
2.6. In Vivo Pharmacokinetic (PK) Studies
2.6.1. Experimental Animals
2.6.2. PK Experimental Design
2.7. Statistical Analysis
3. Results and Discussion
3.1. Optimizations of Independent Variables
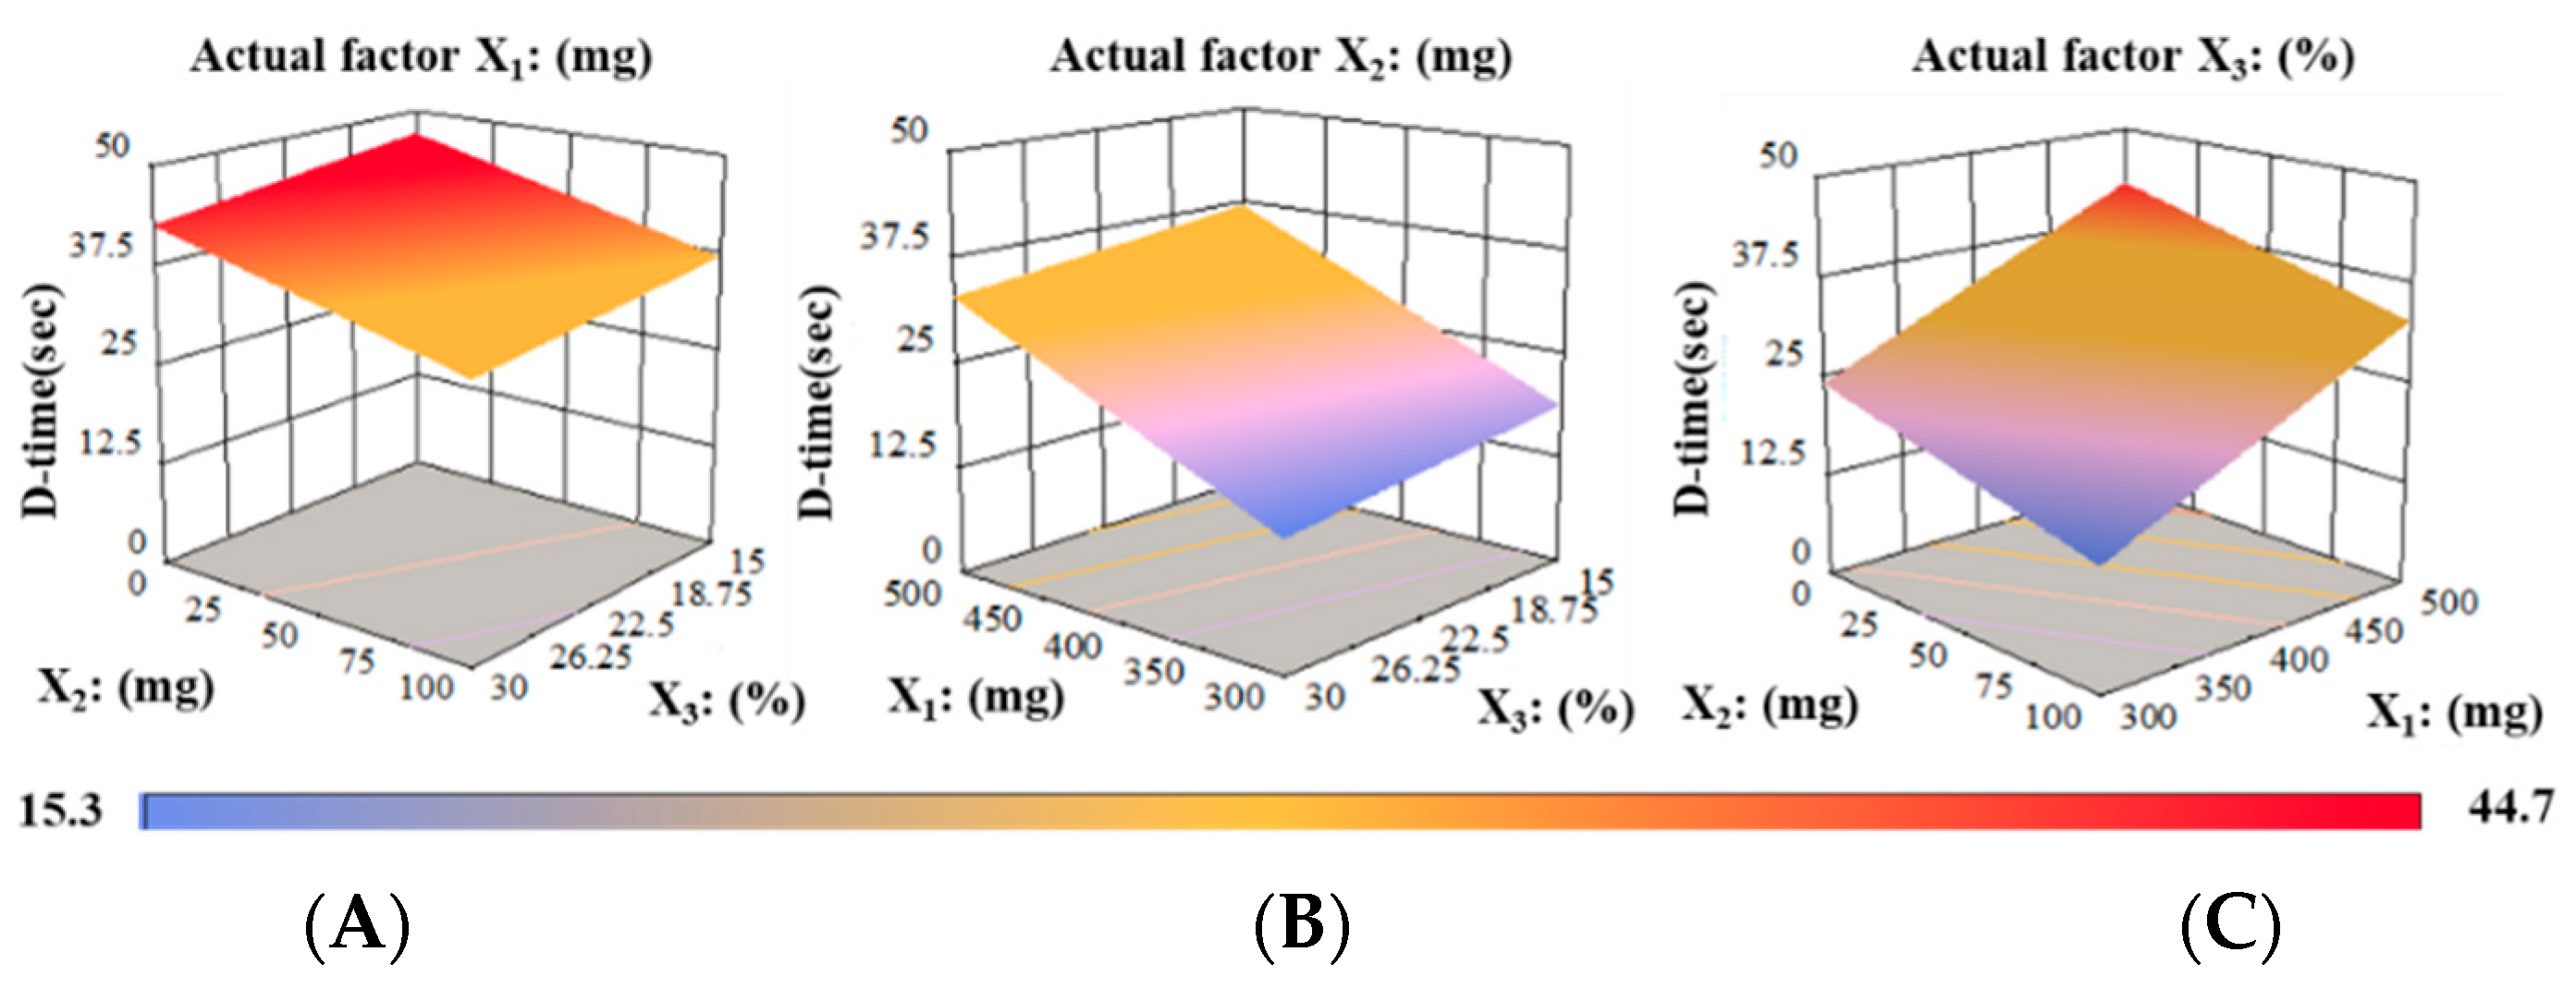
3.2. Box–Behnken Experimental Design (BBD)
3.3. Characterization of RZT-ODFs
3.3.1. Appearance and Morphology
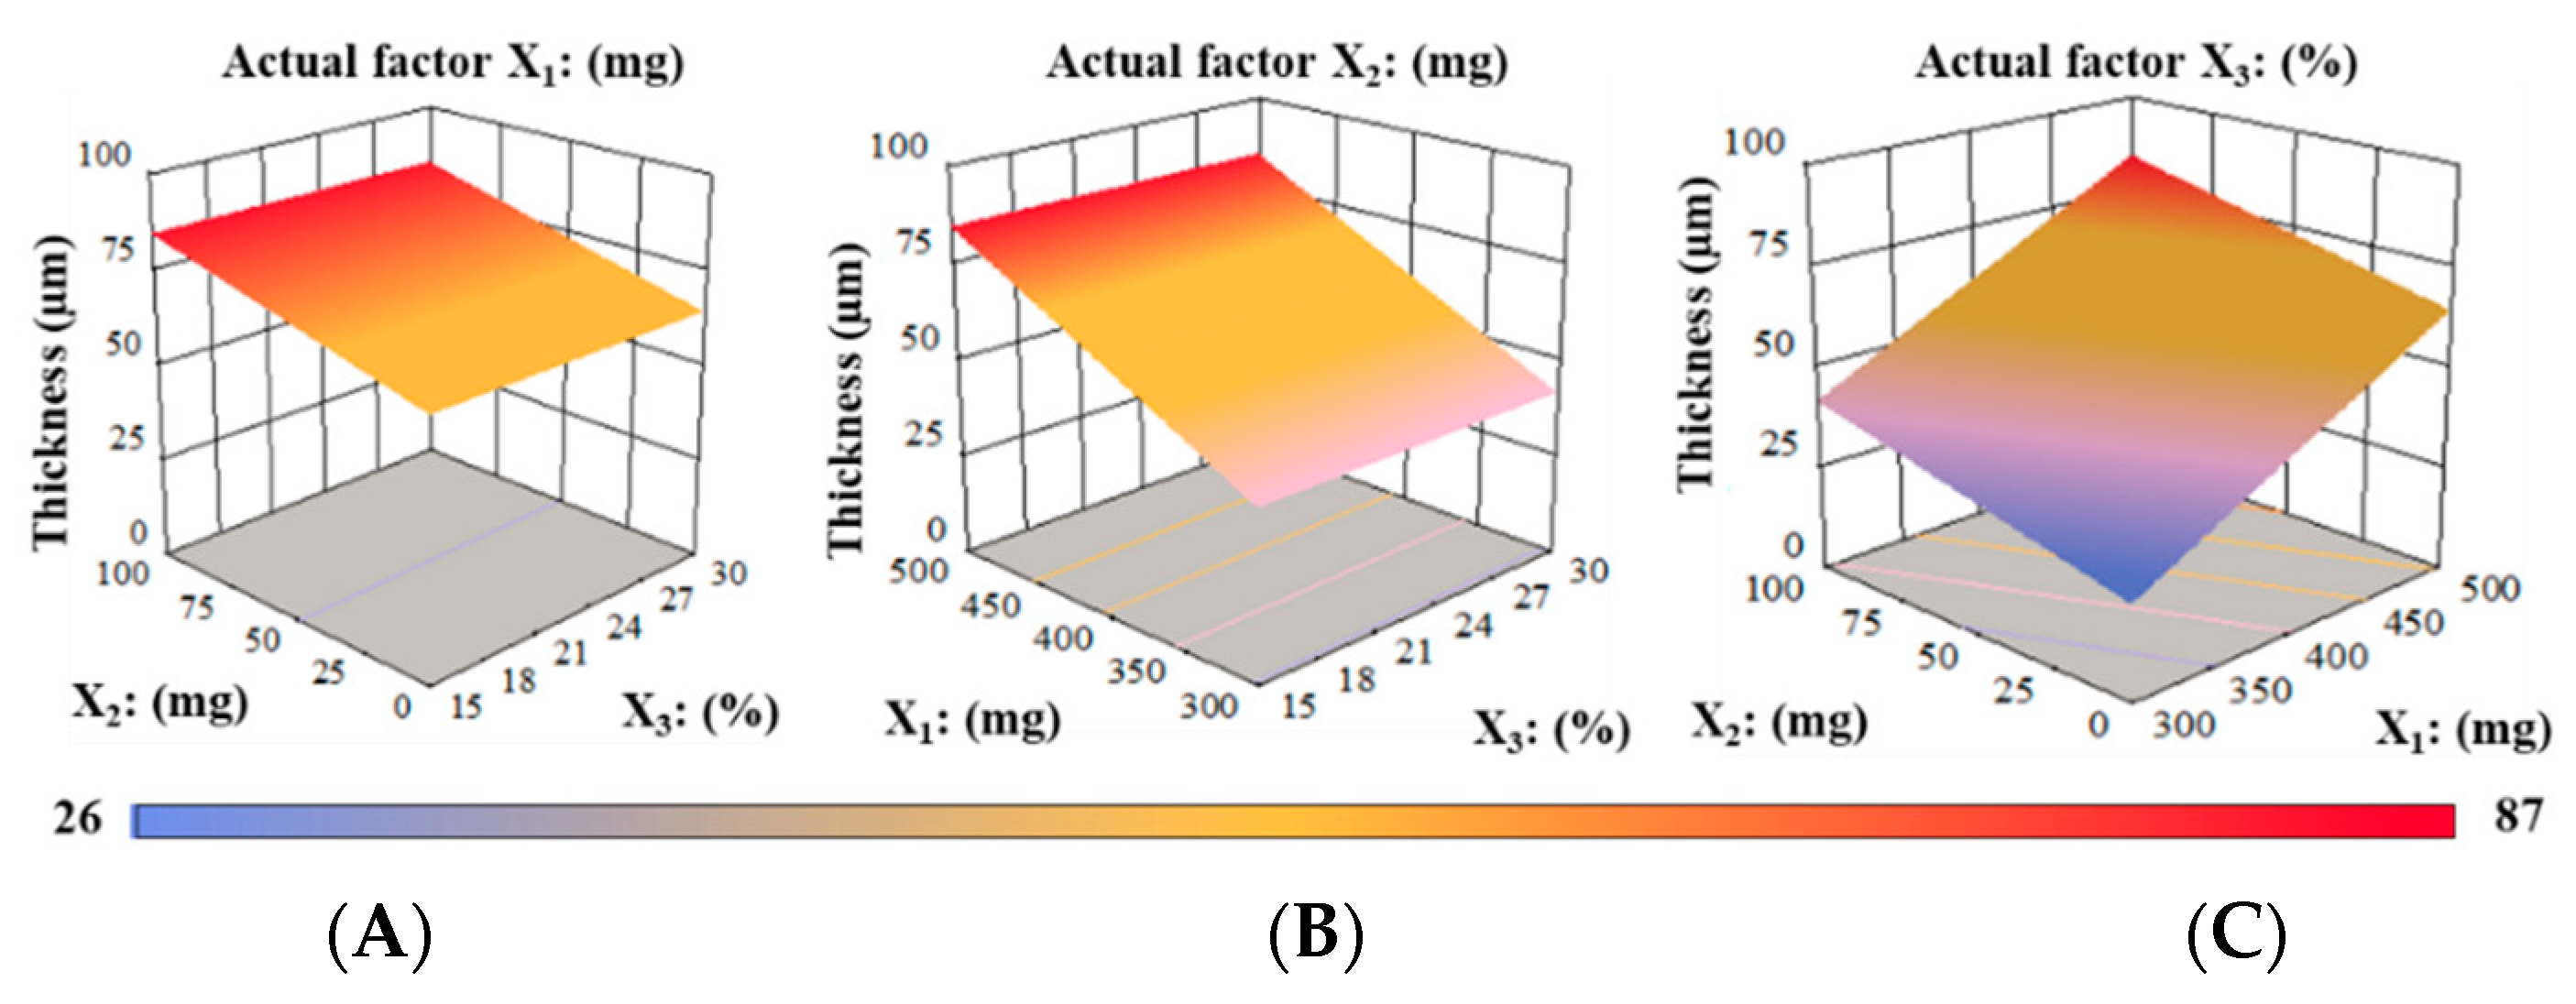
3.3.2. Thickness, Weight, and Drug Content Uniformity
3.3.3. Mechanical Properties
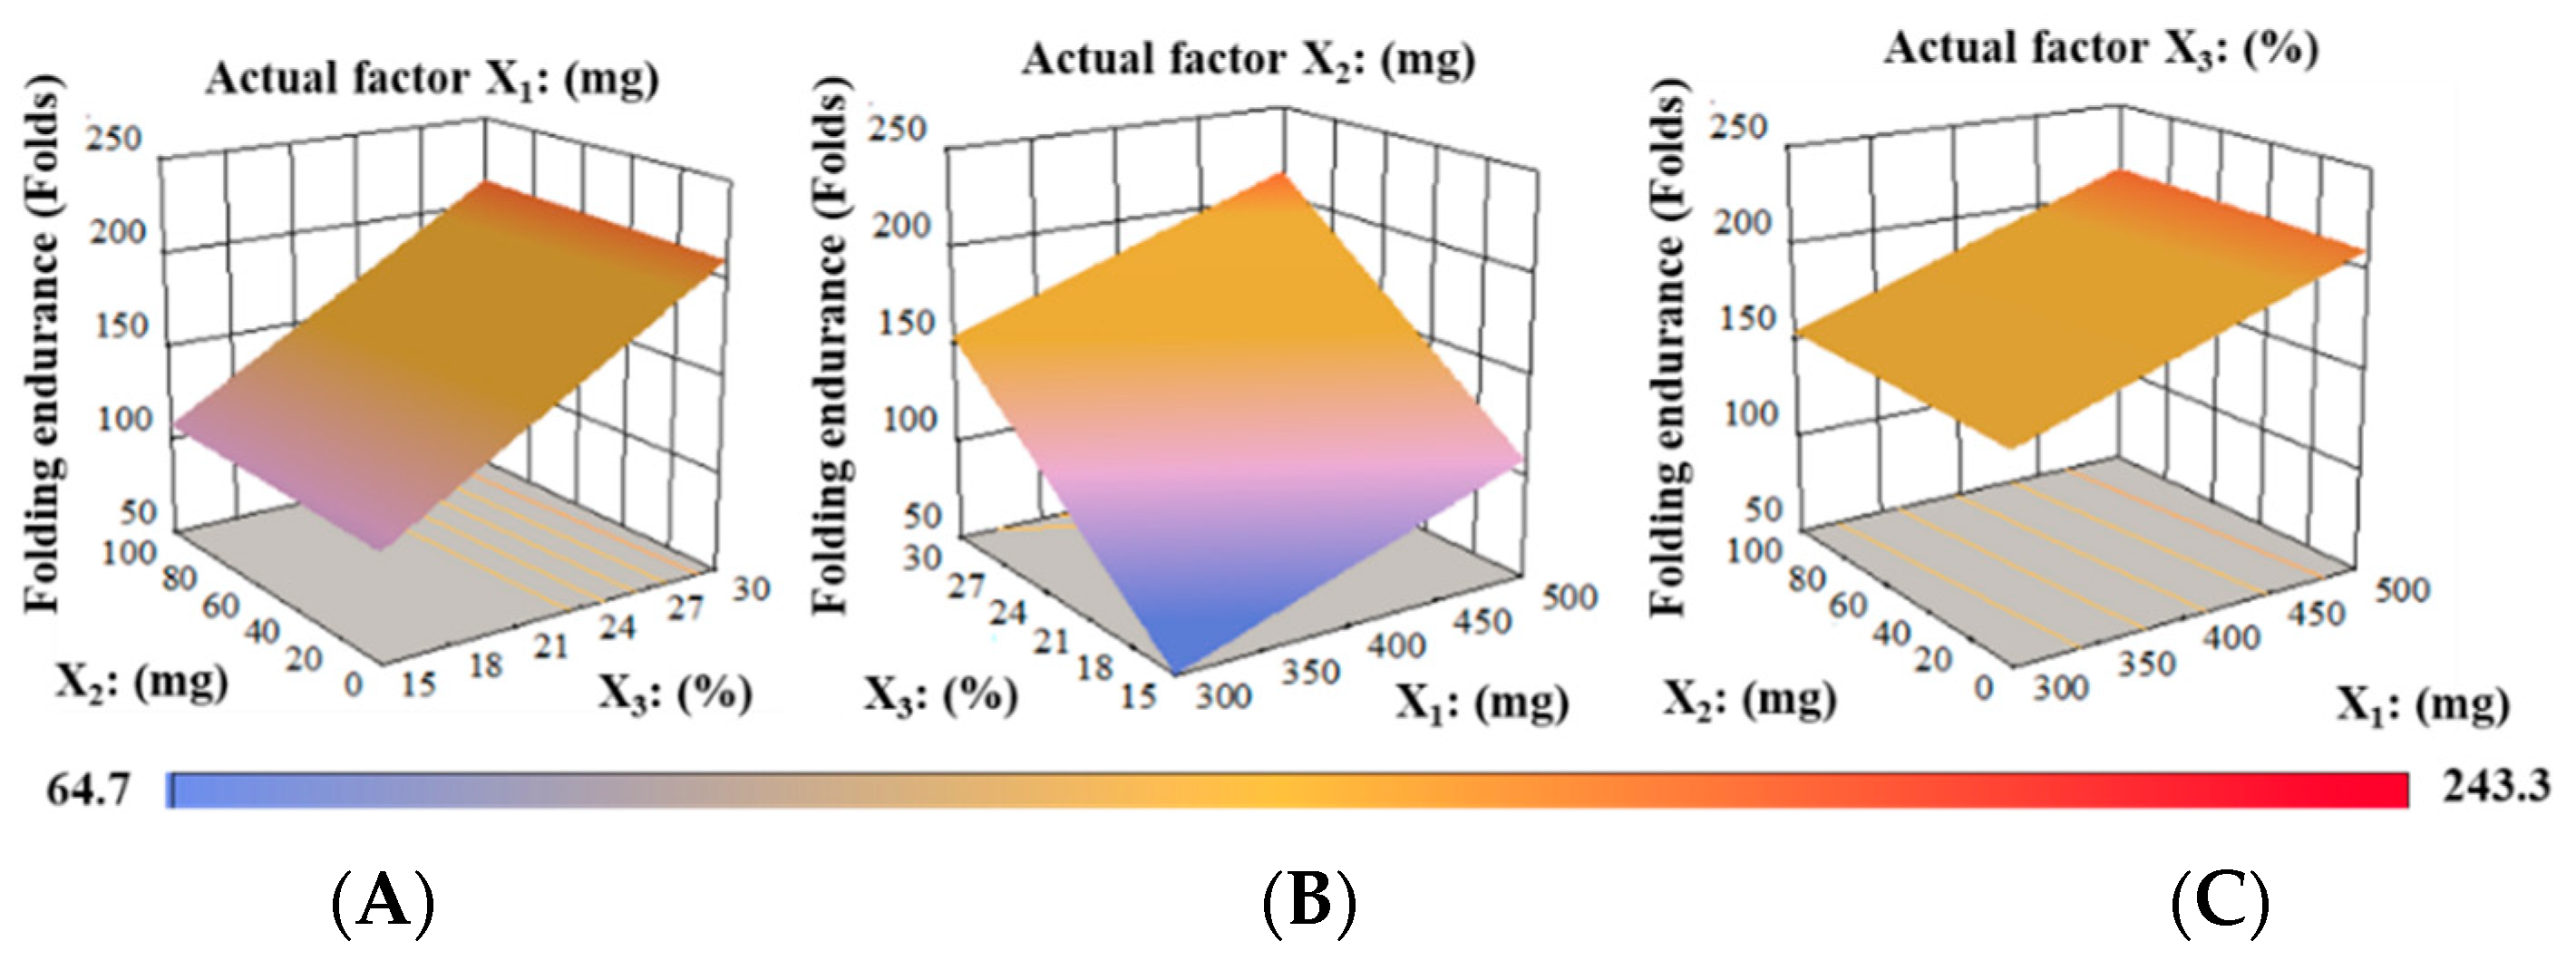
Folding Endurance (FE)
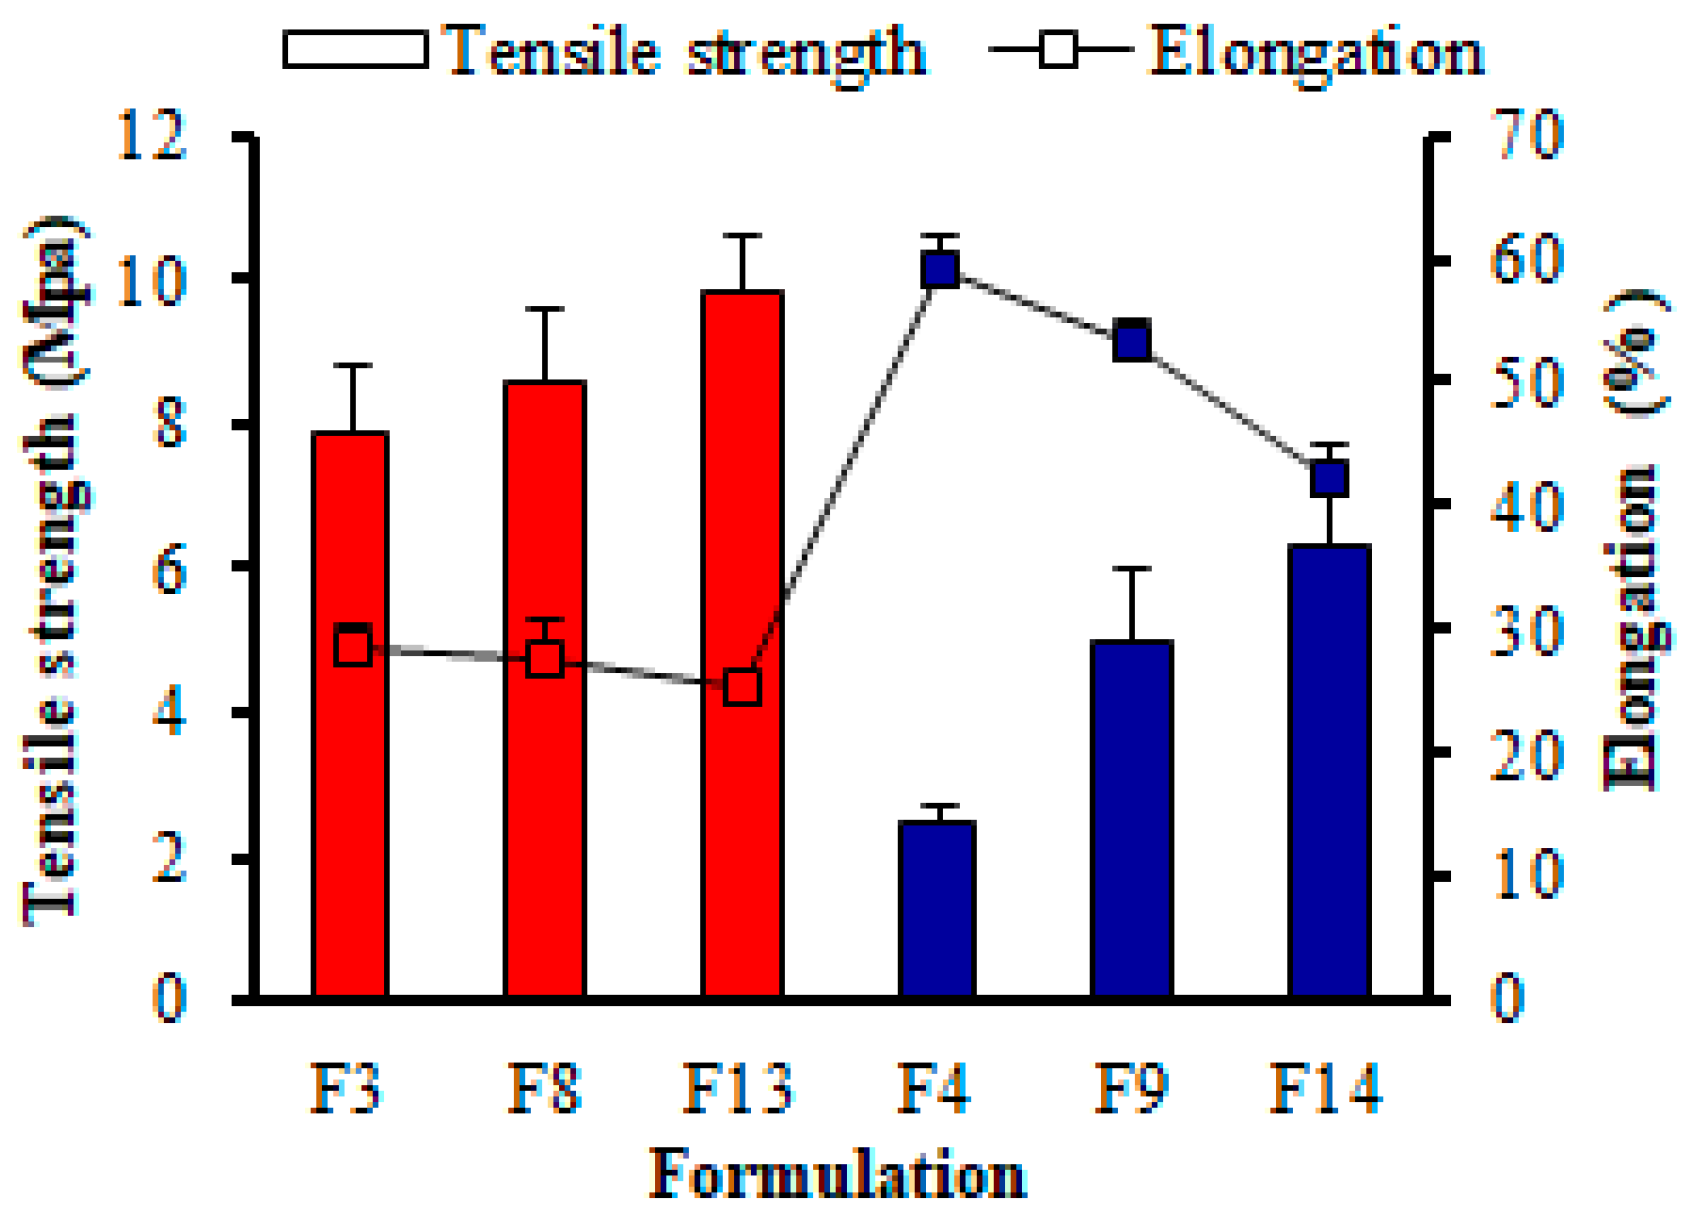
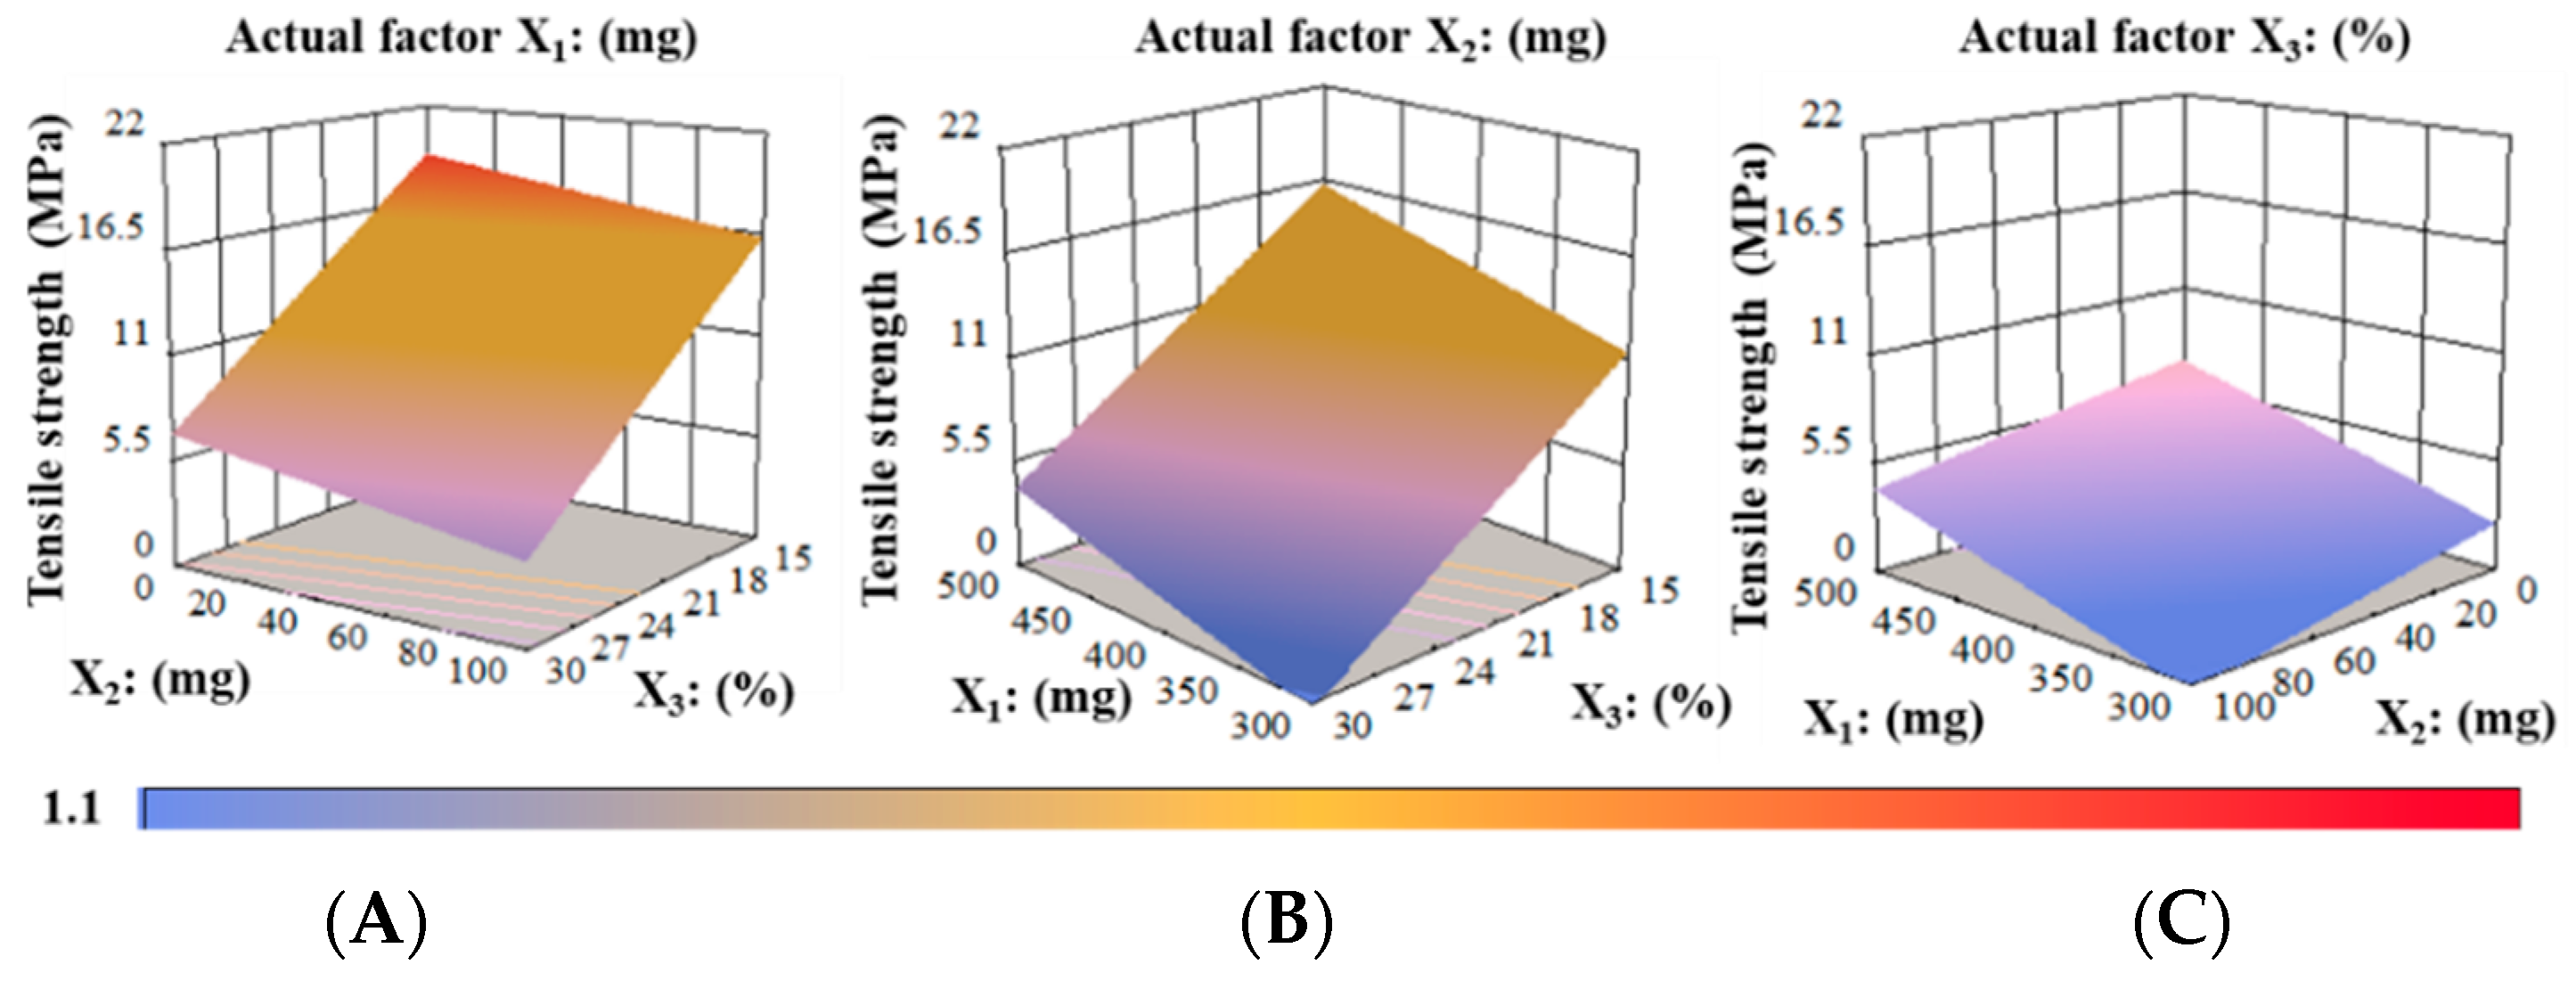
Tensile Strength (TS) Analysis
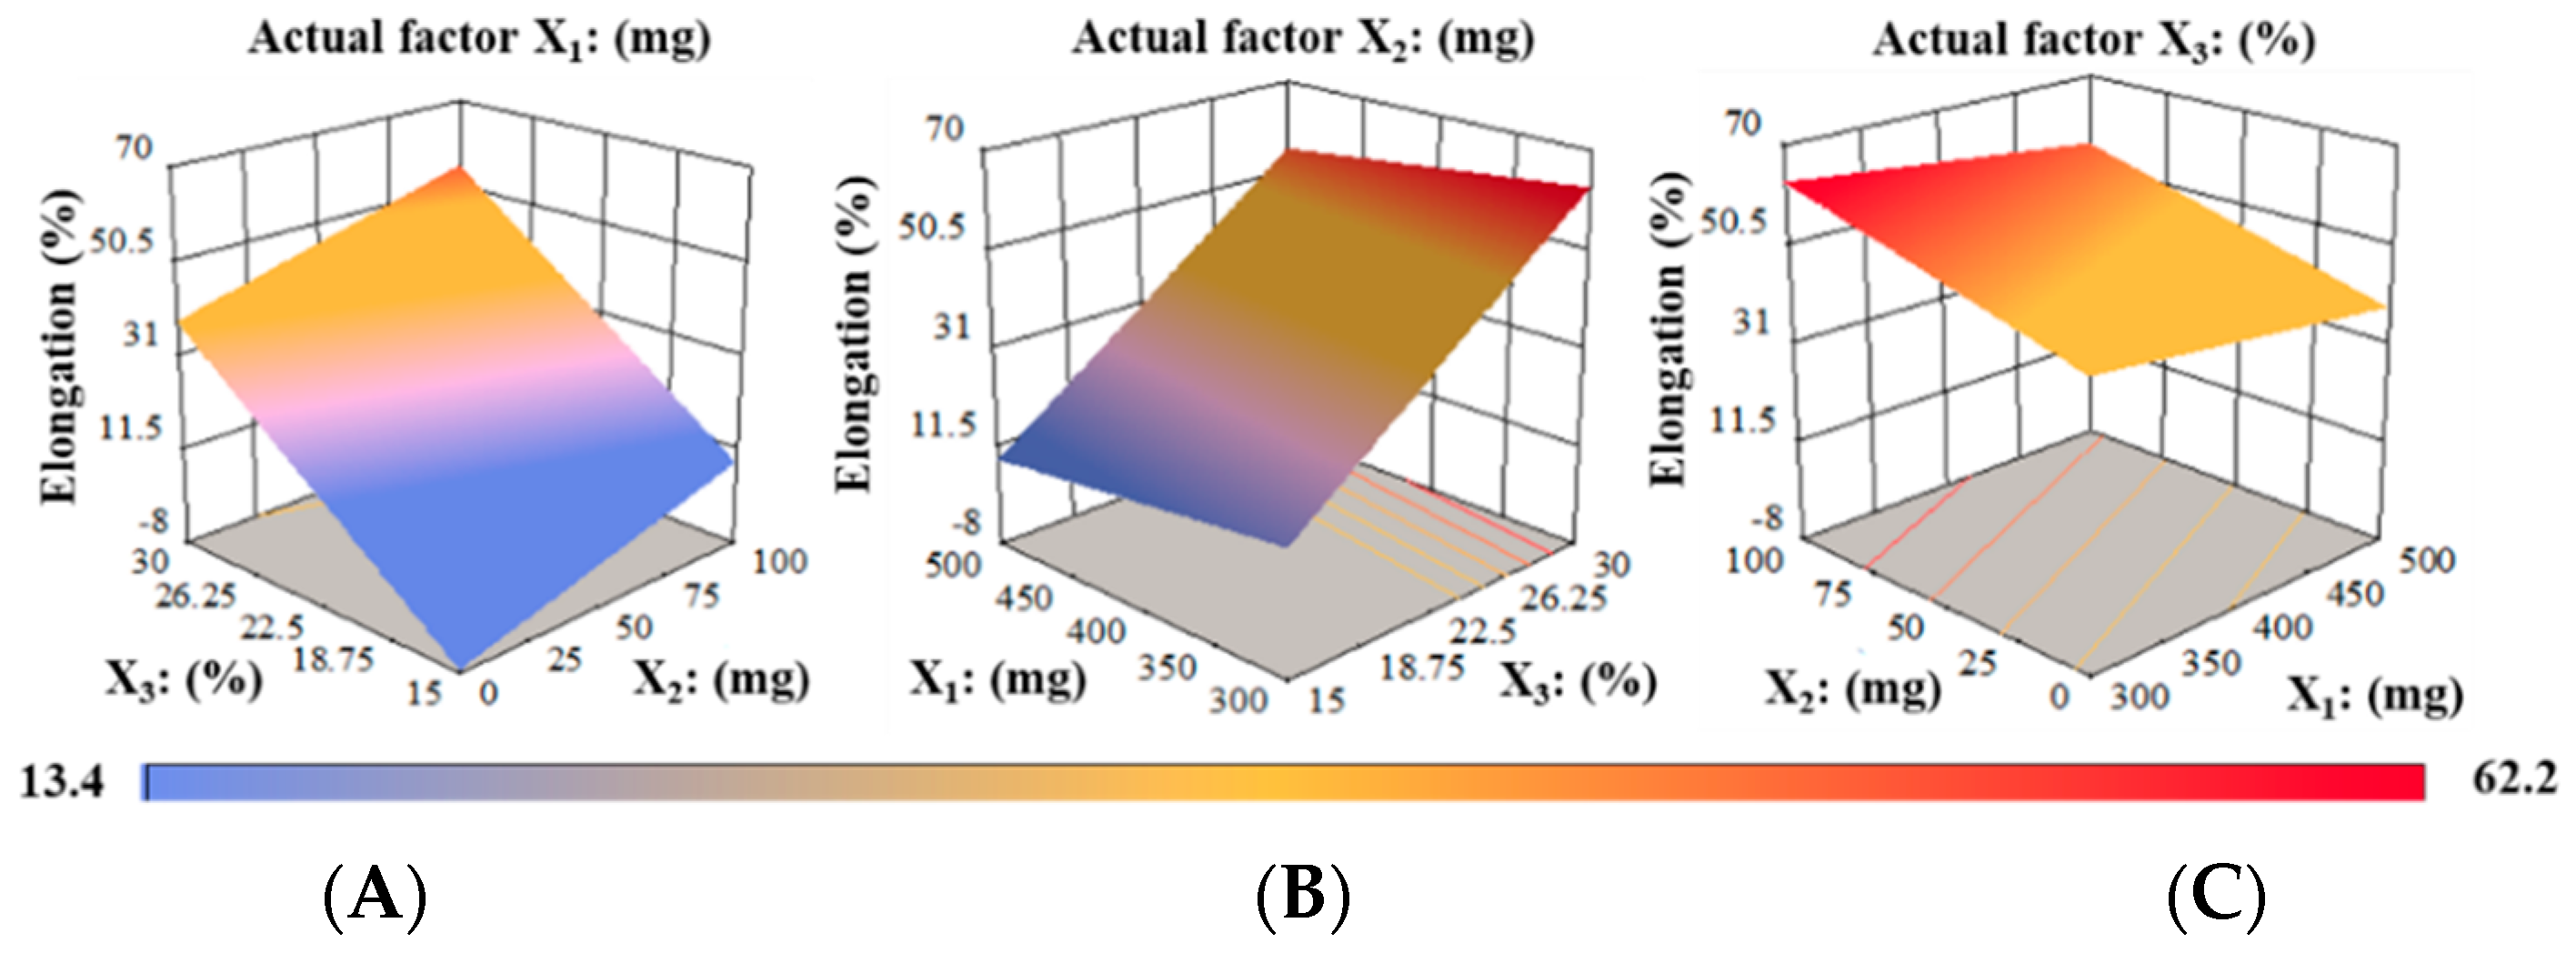
Elongation (%) Analysis
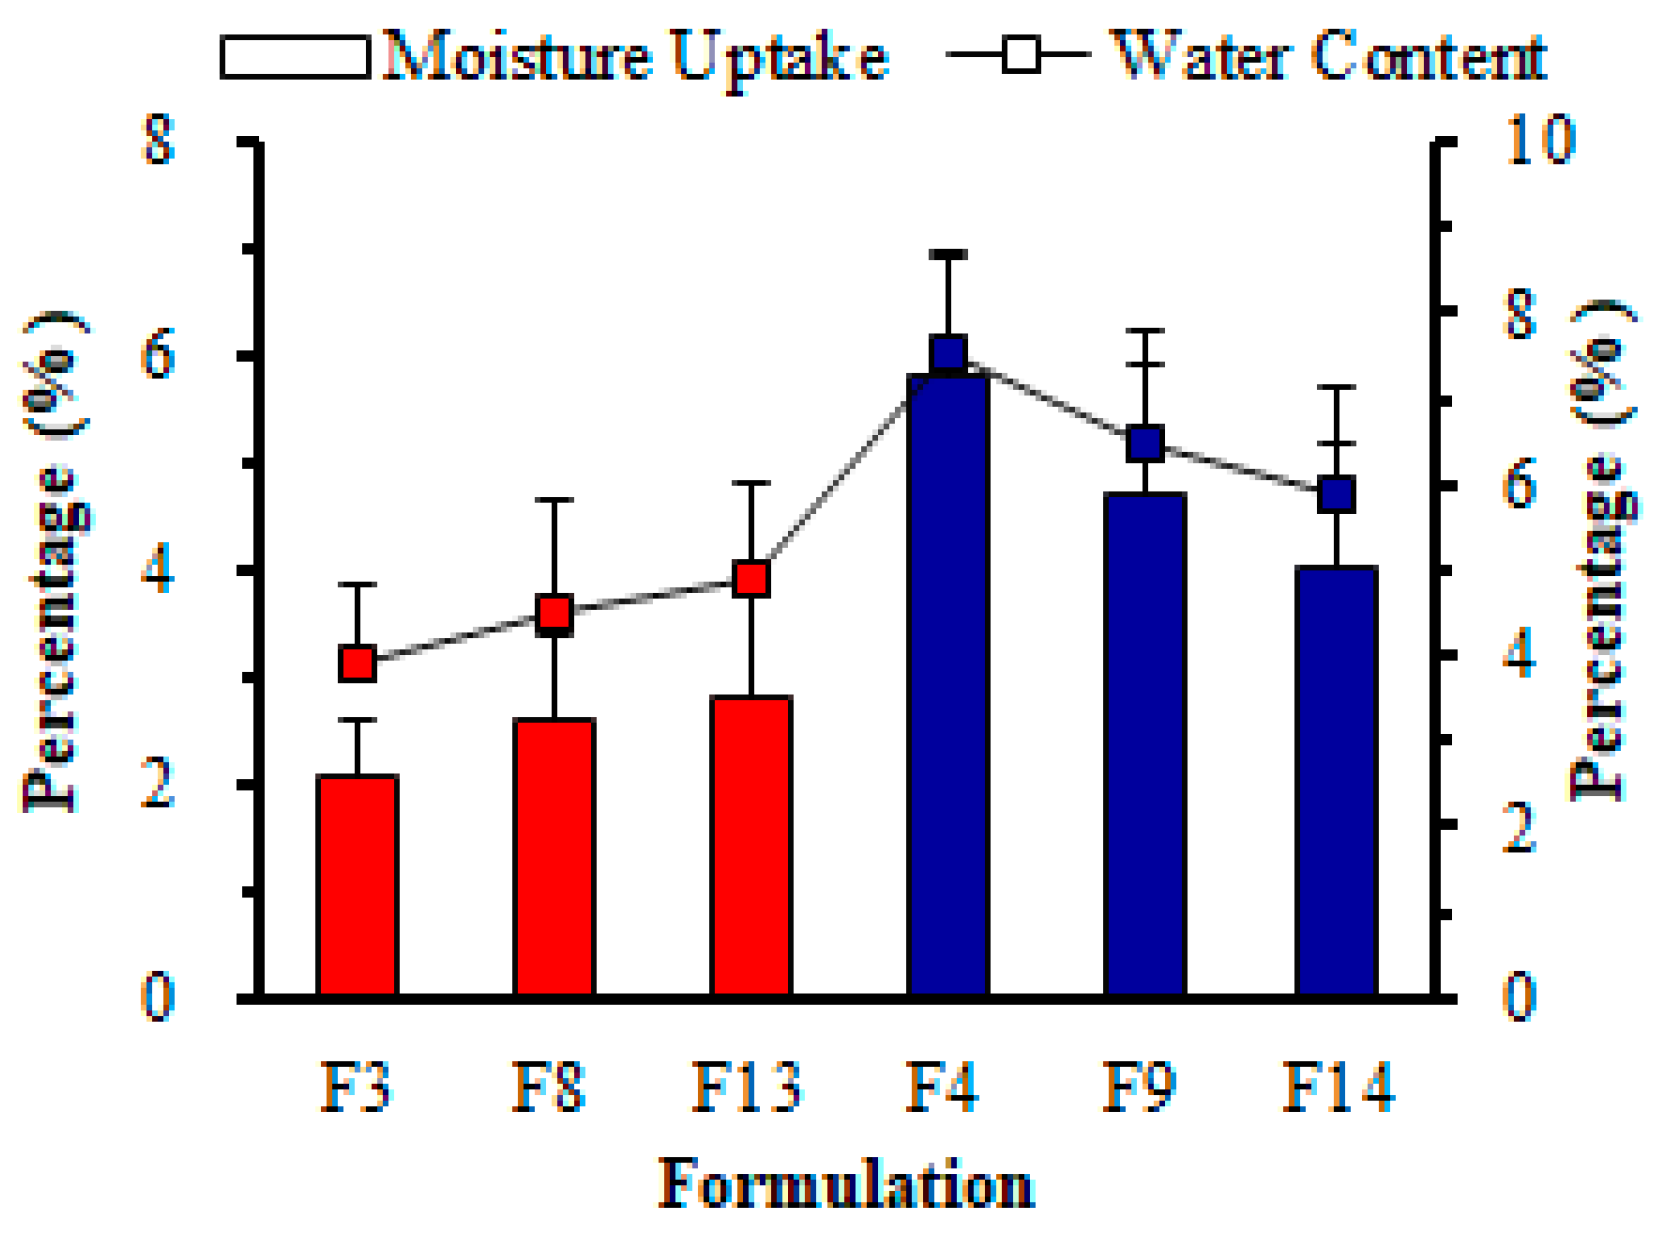
3.3.4. pH, Moisture Content, and Water Absorption
pH Determination
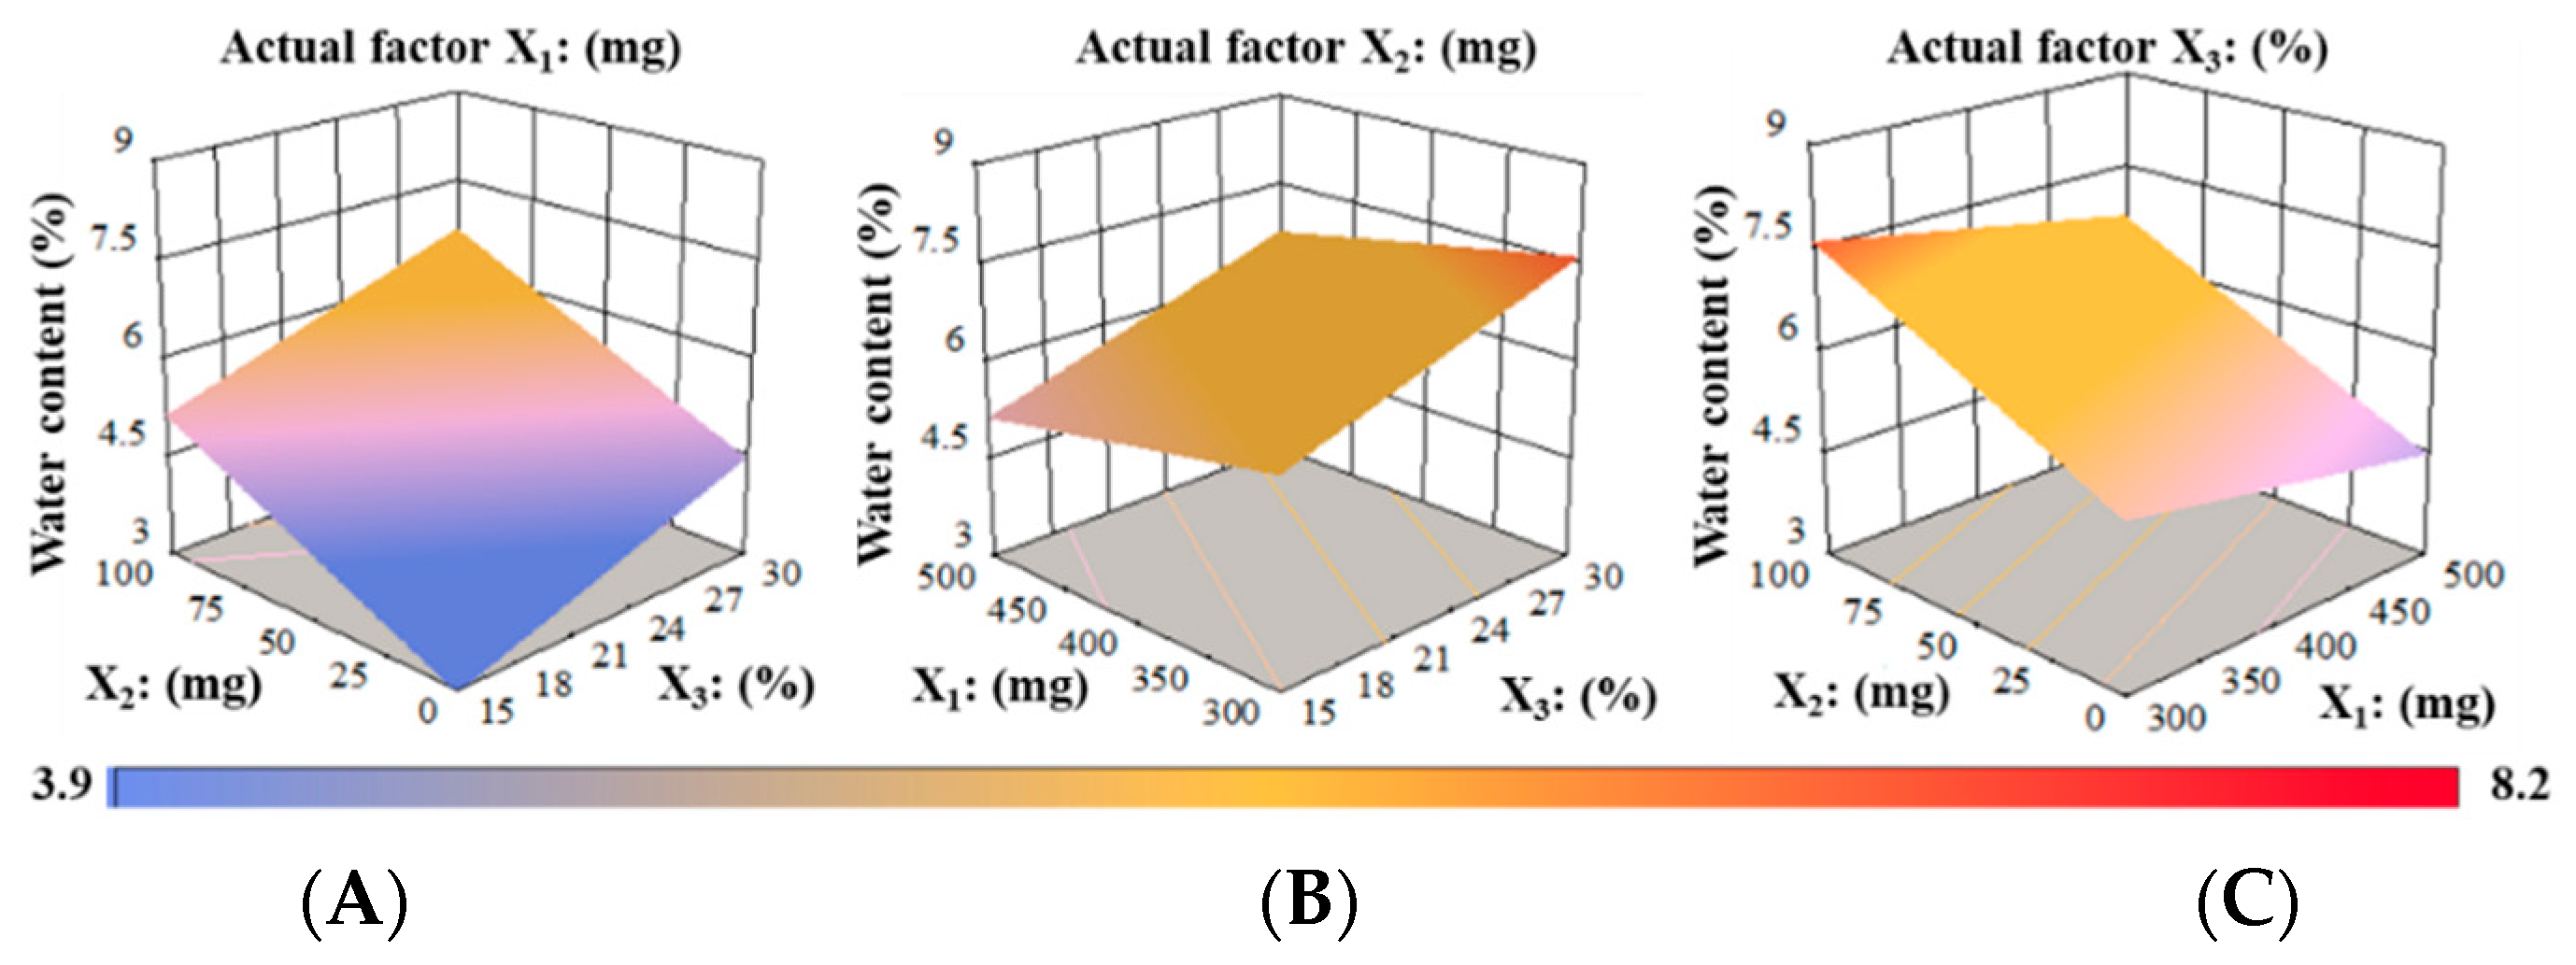
Water Content (%)
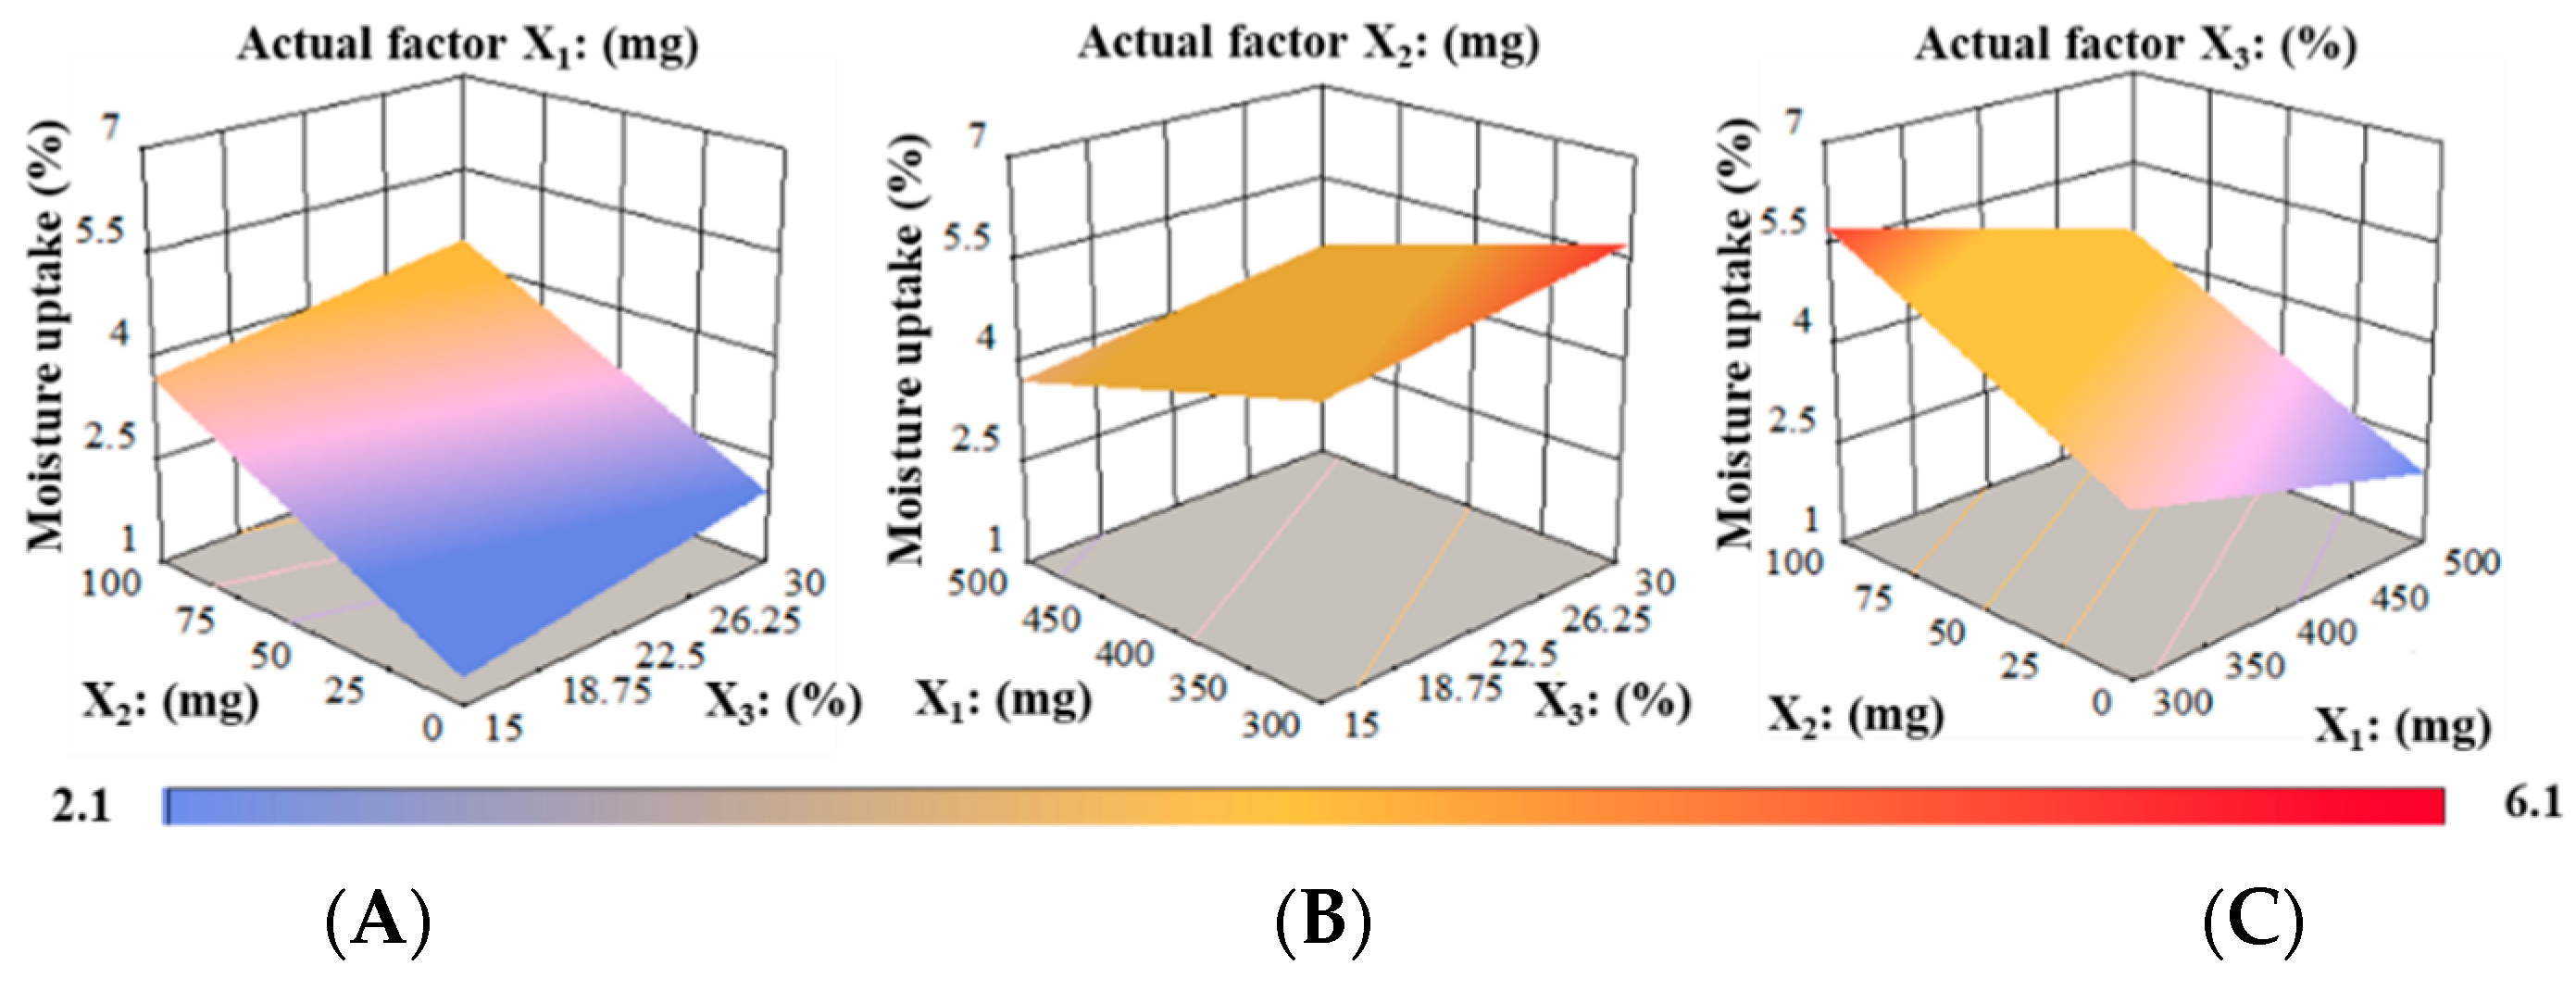
Water Absorption (%)
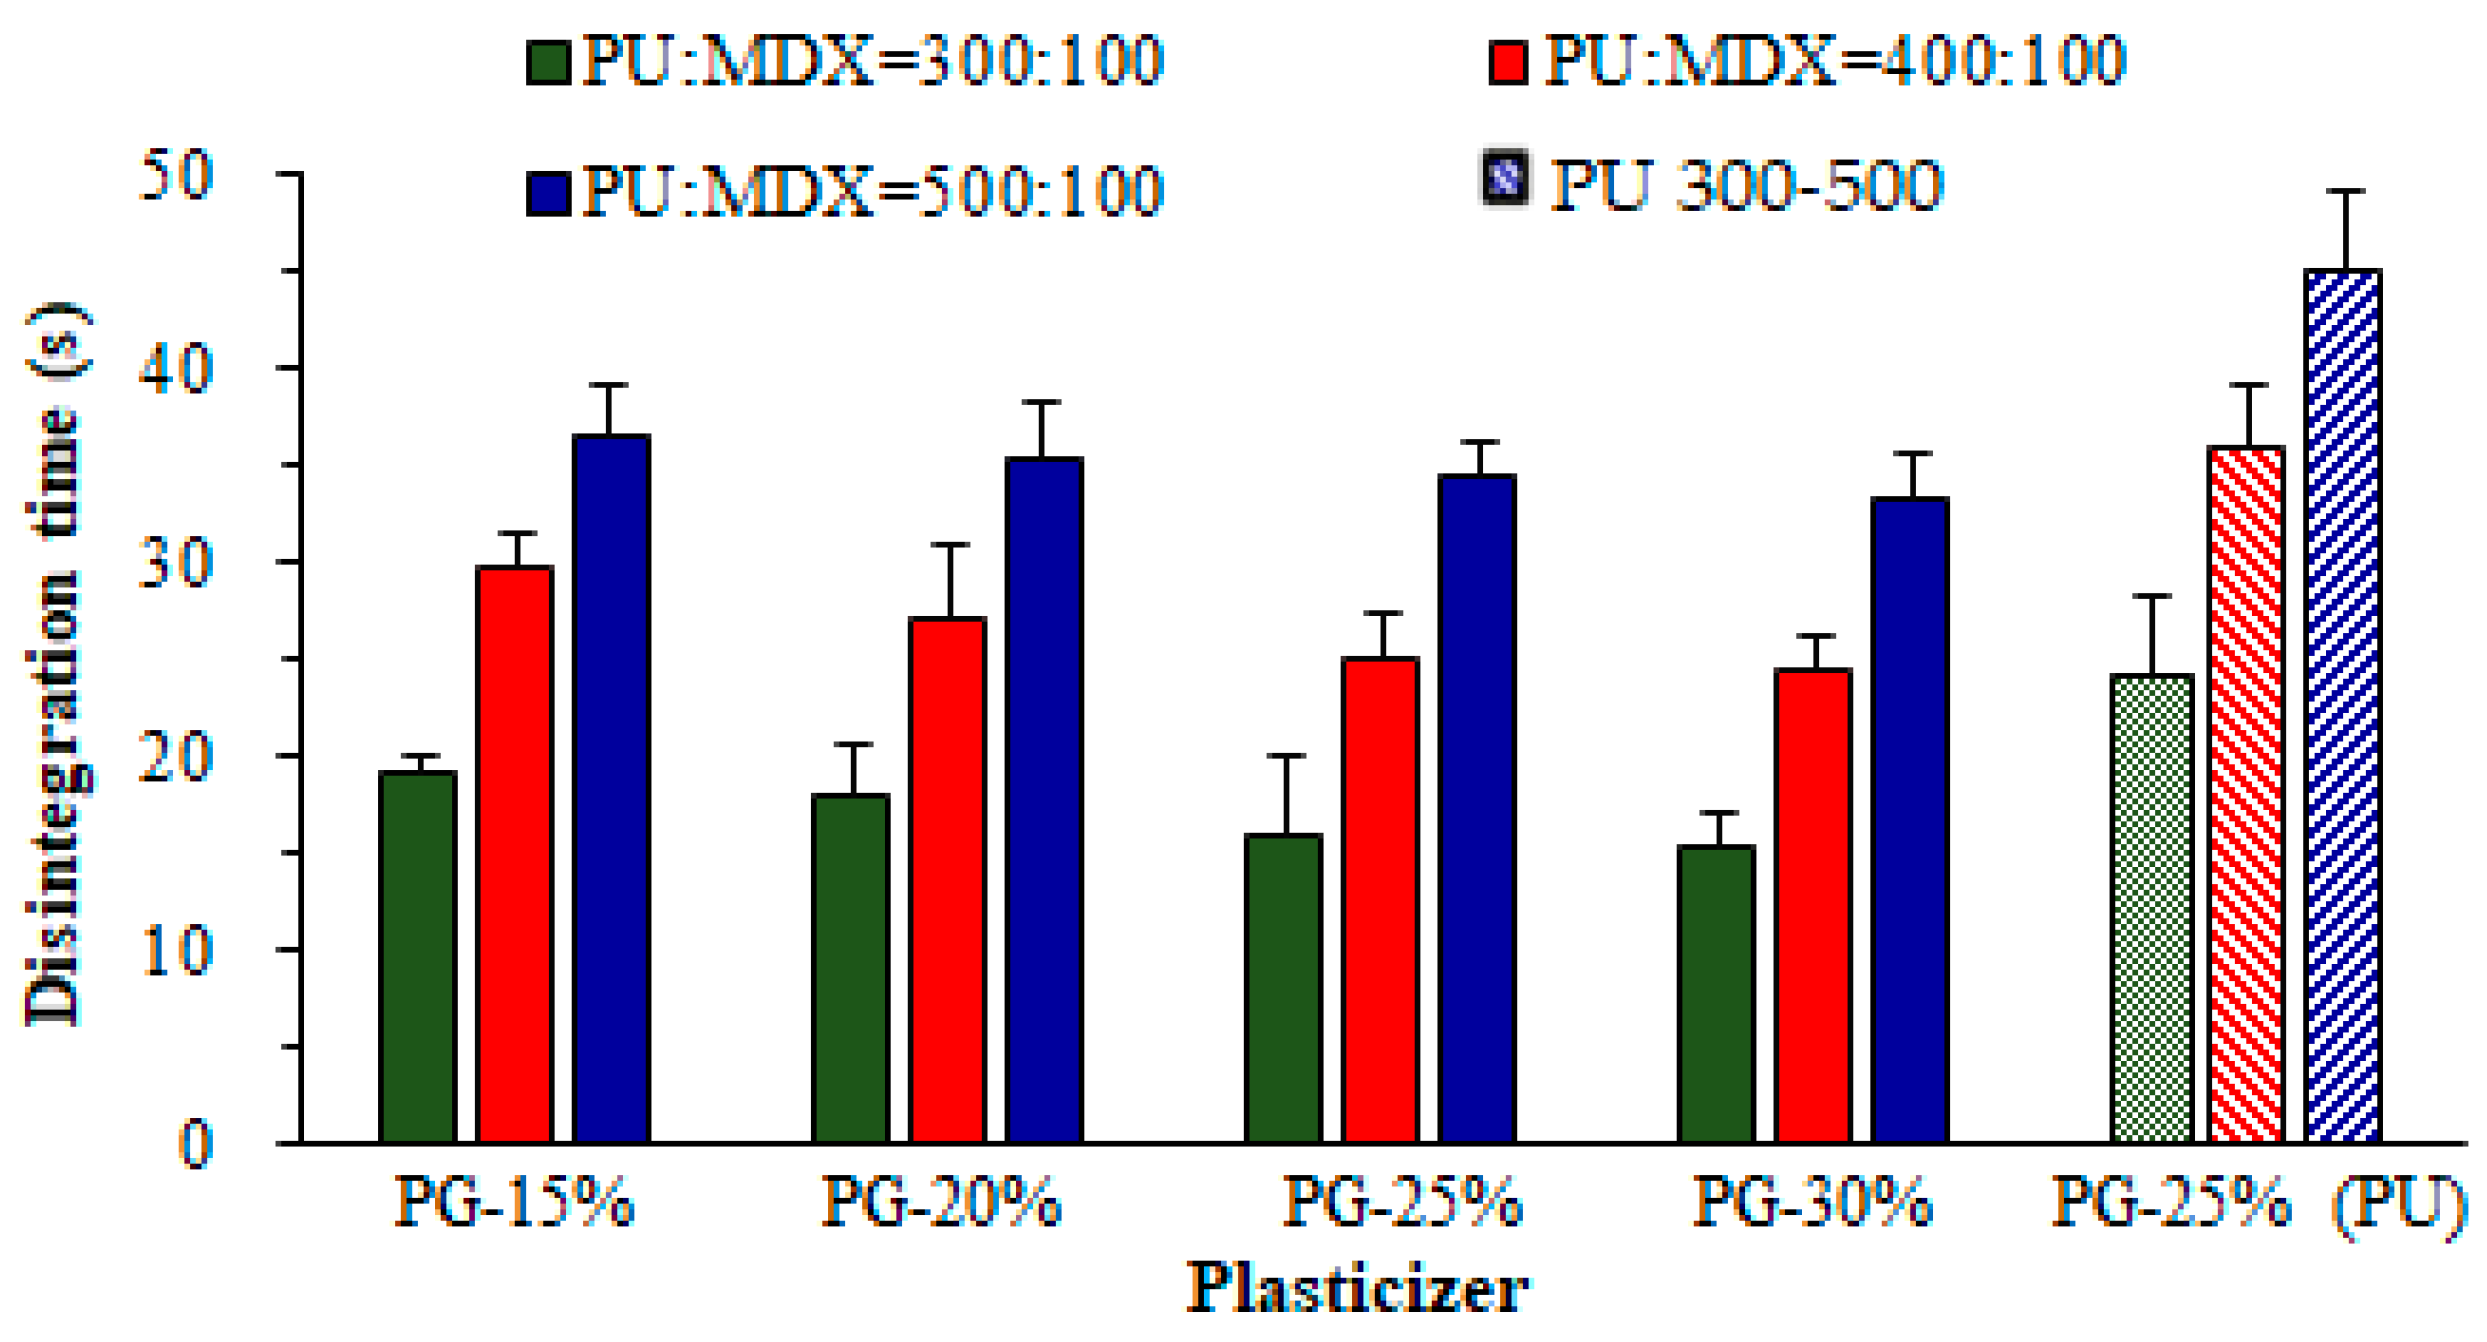
3.4. Disintegration Time (D-Time)
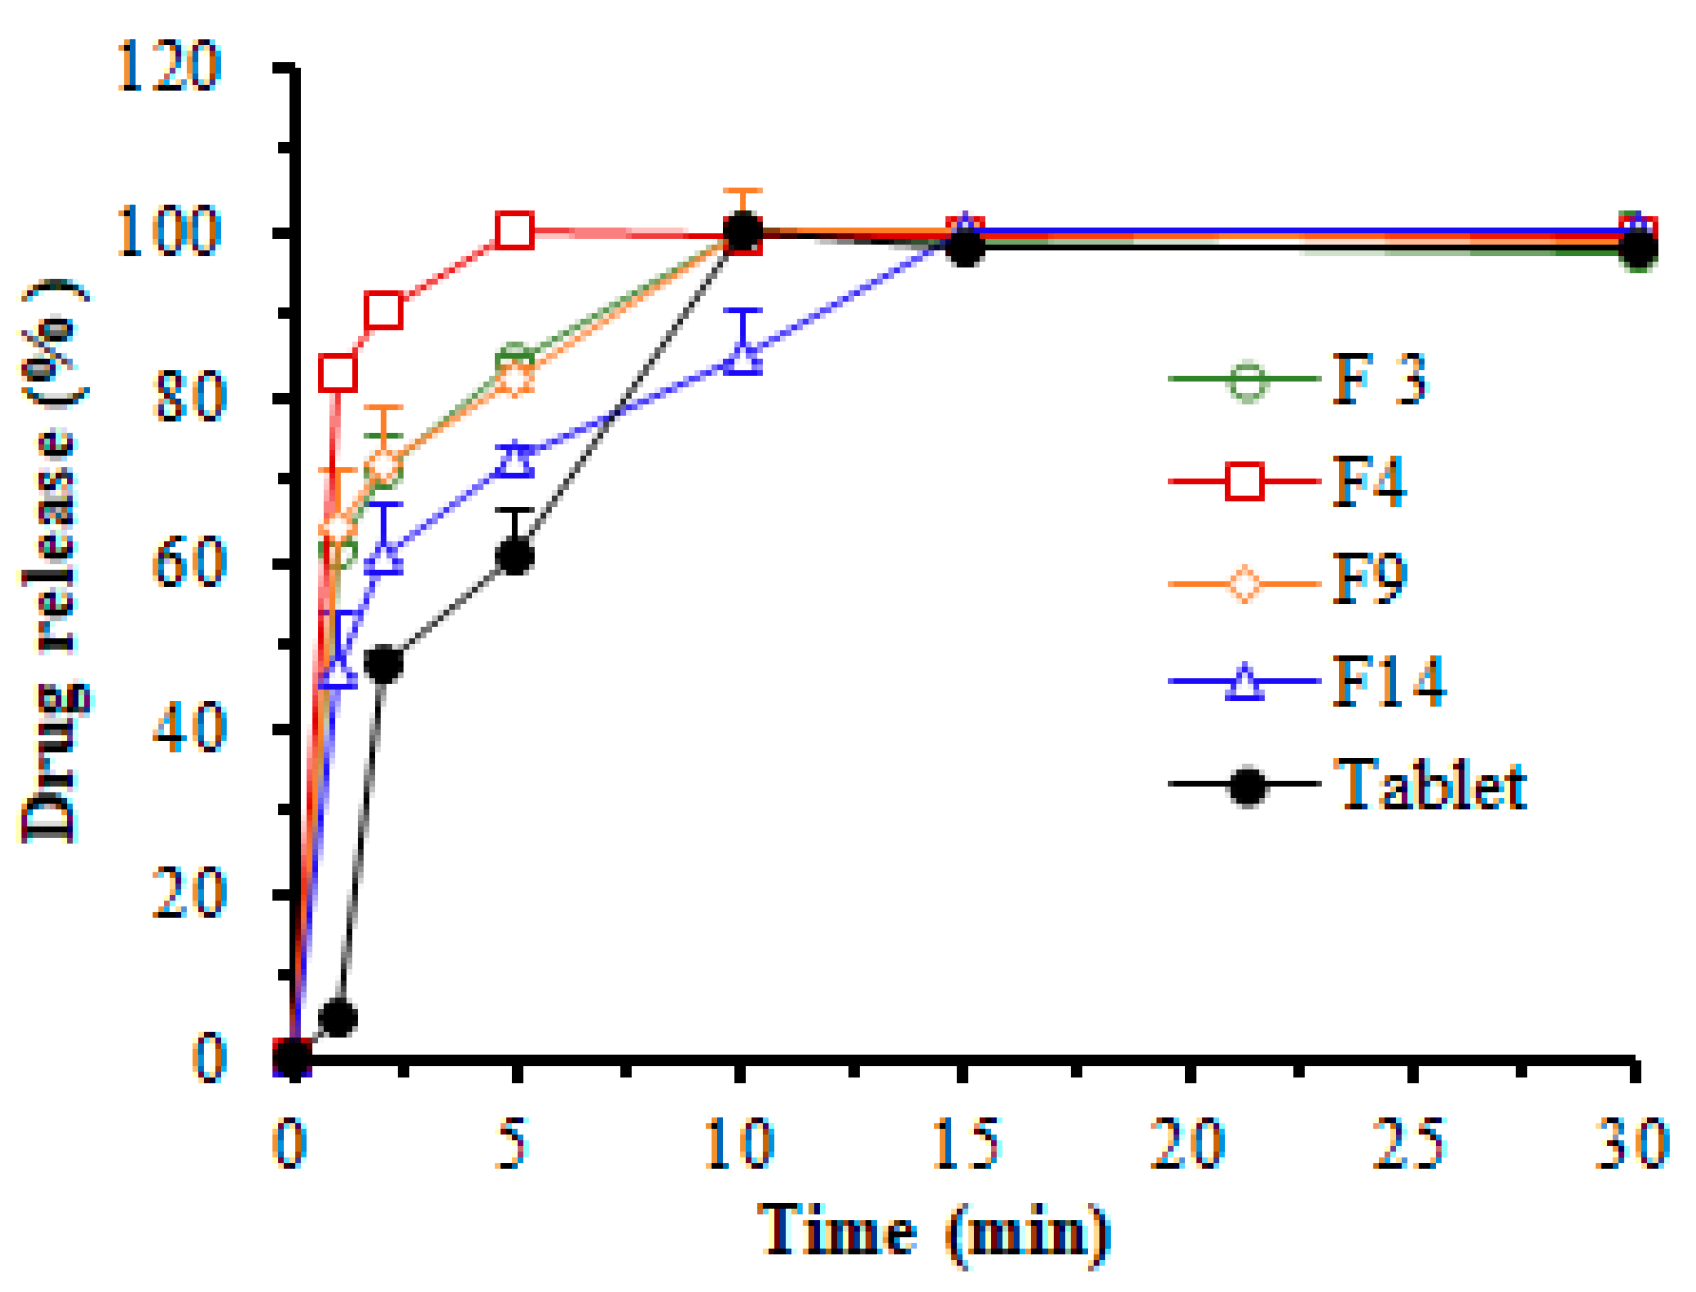
3.5. In Vitro Dissolution Study
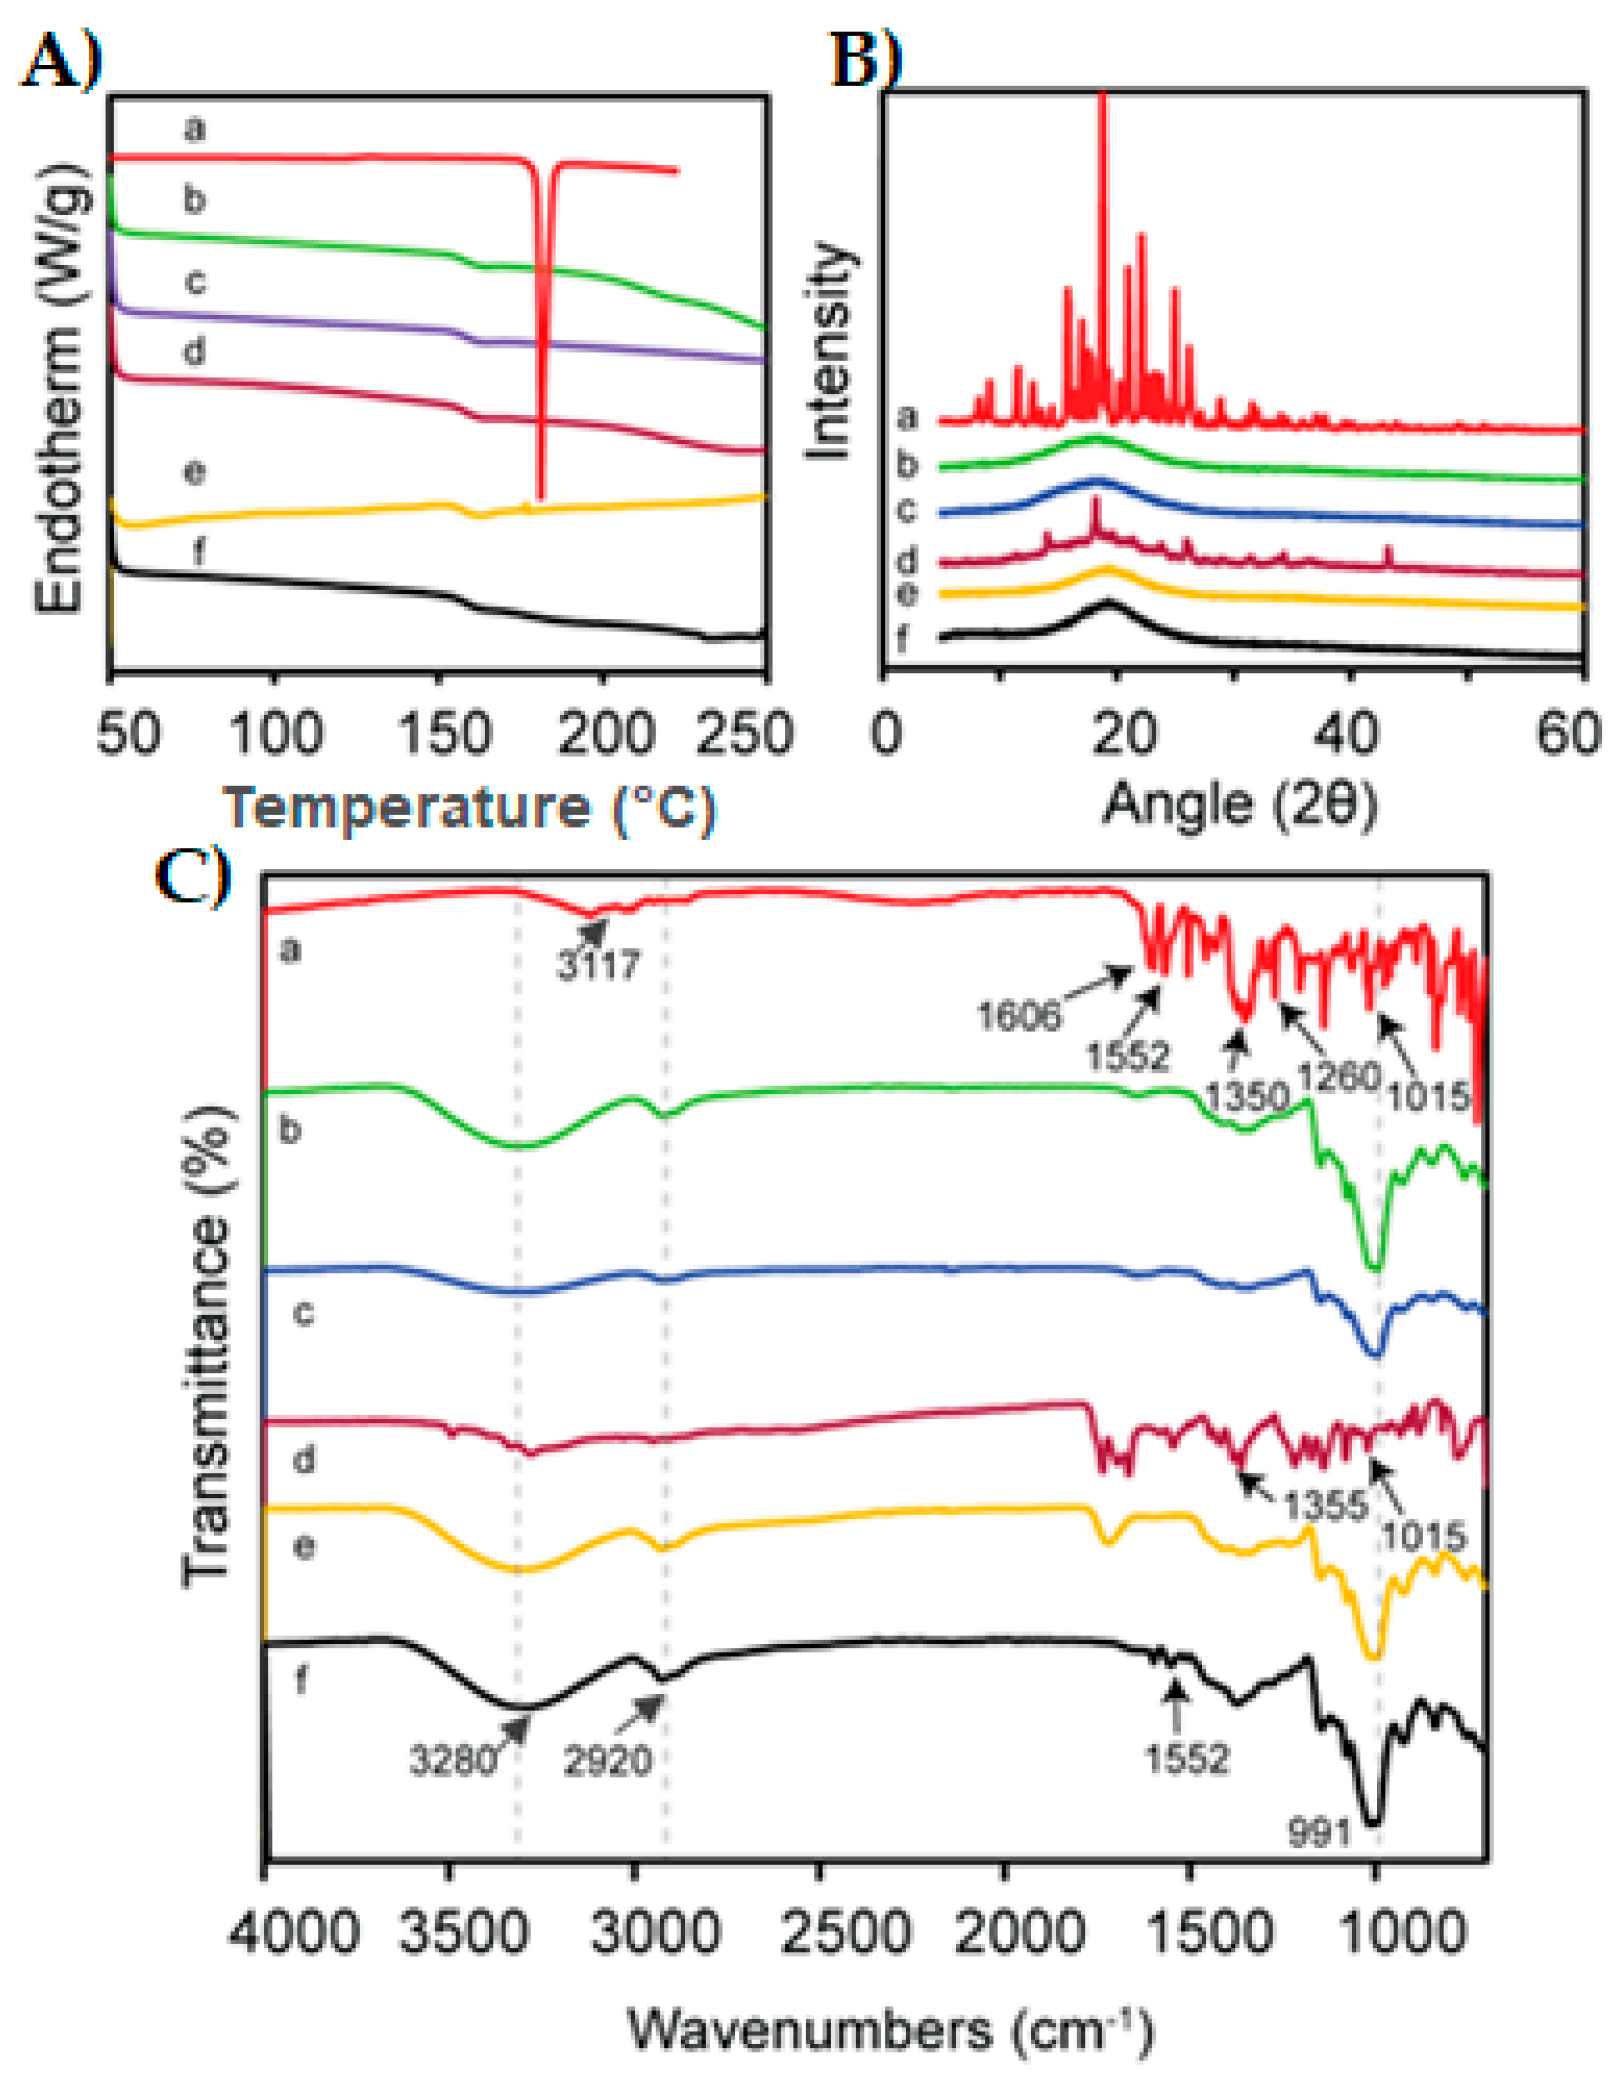
3.6. Compatibility Test
3.7. Model Validation Using Desirability Function
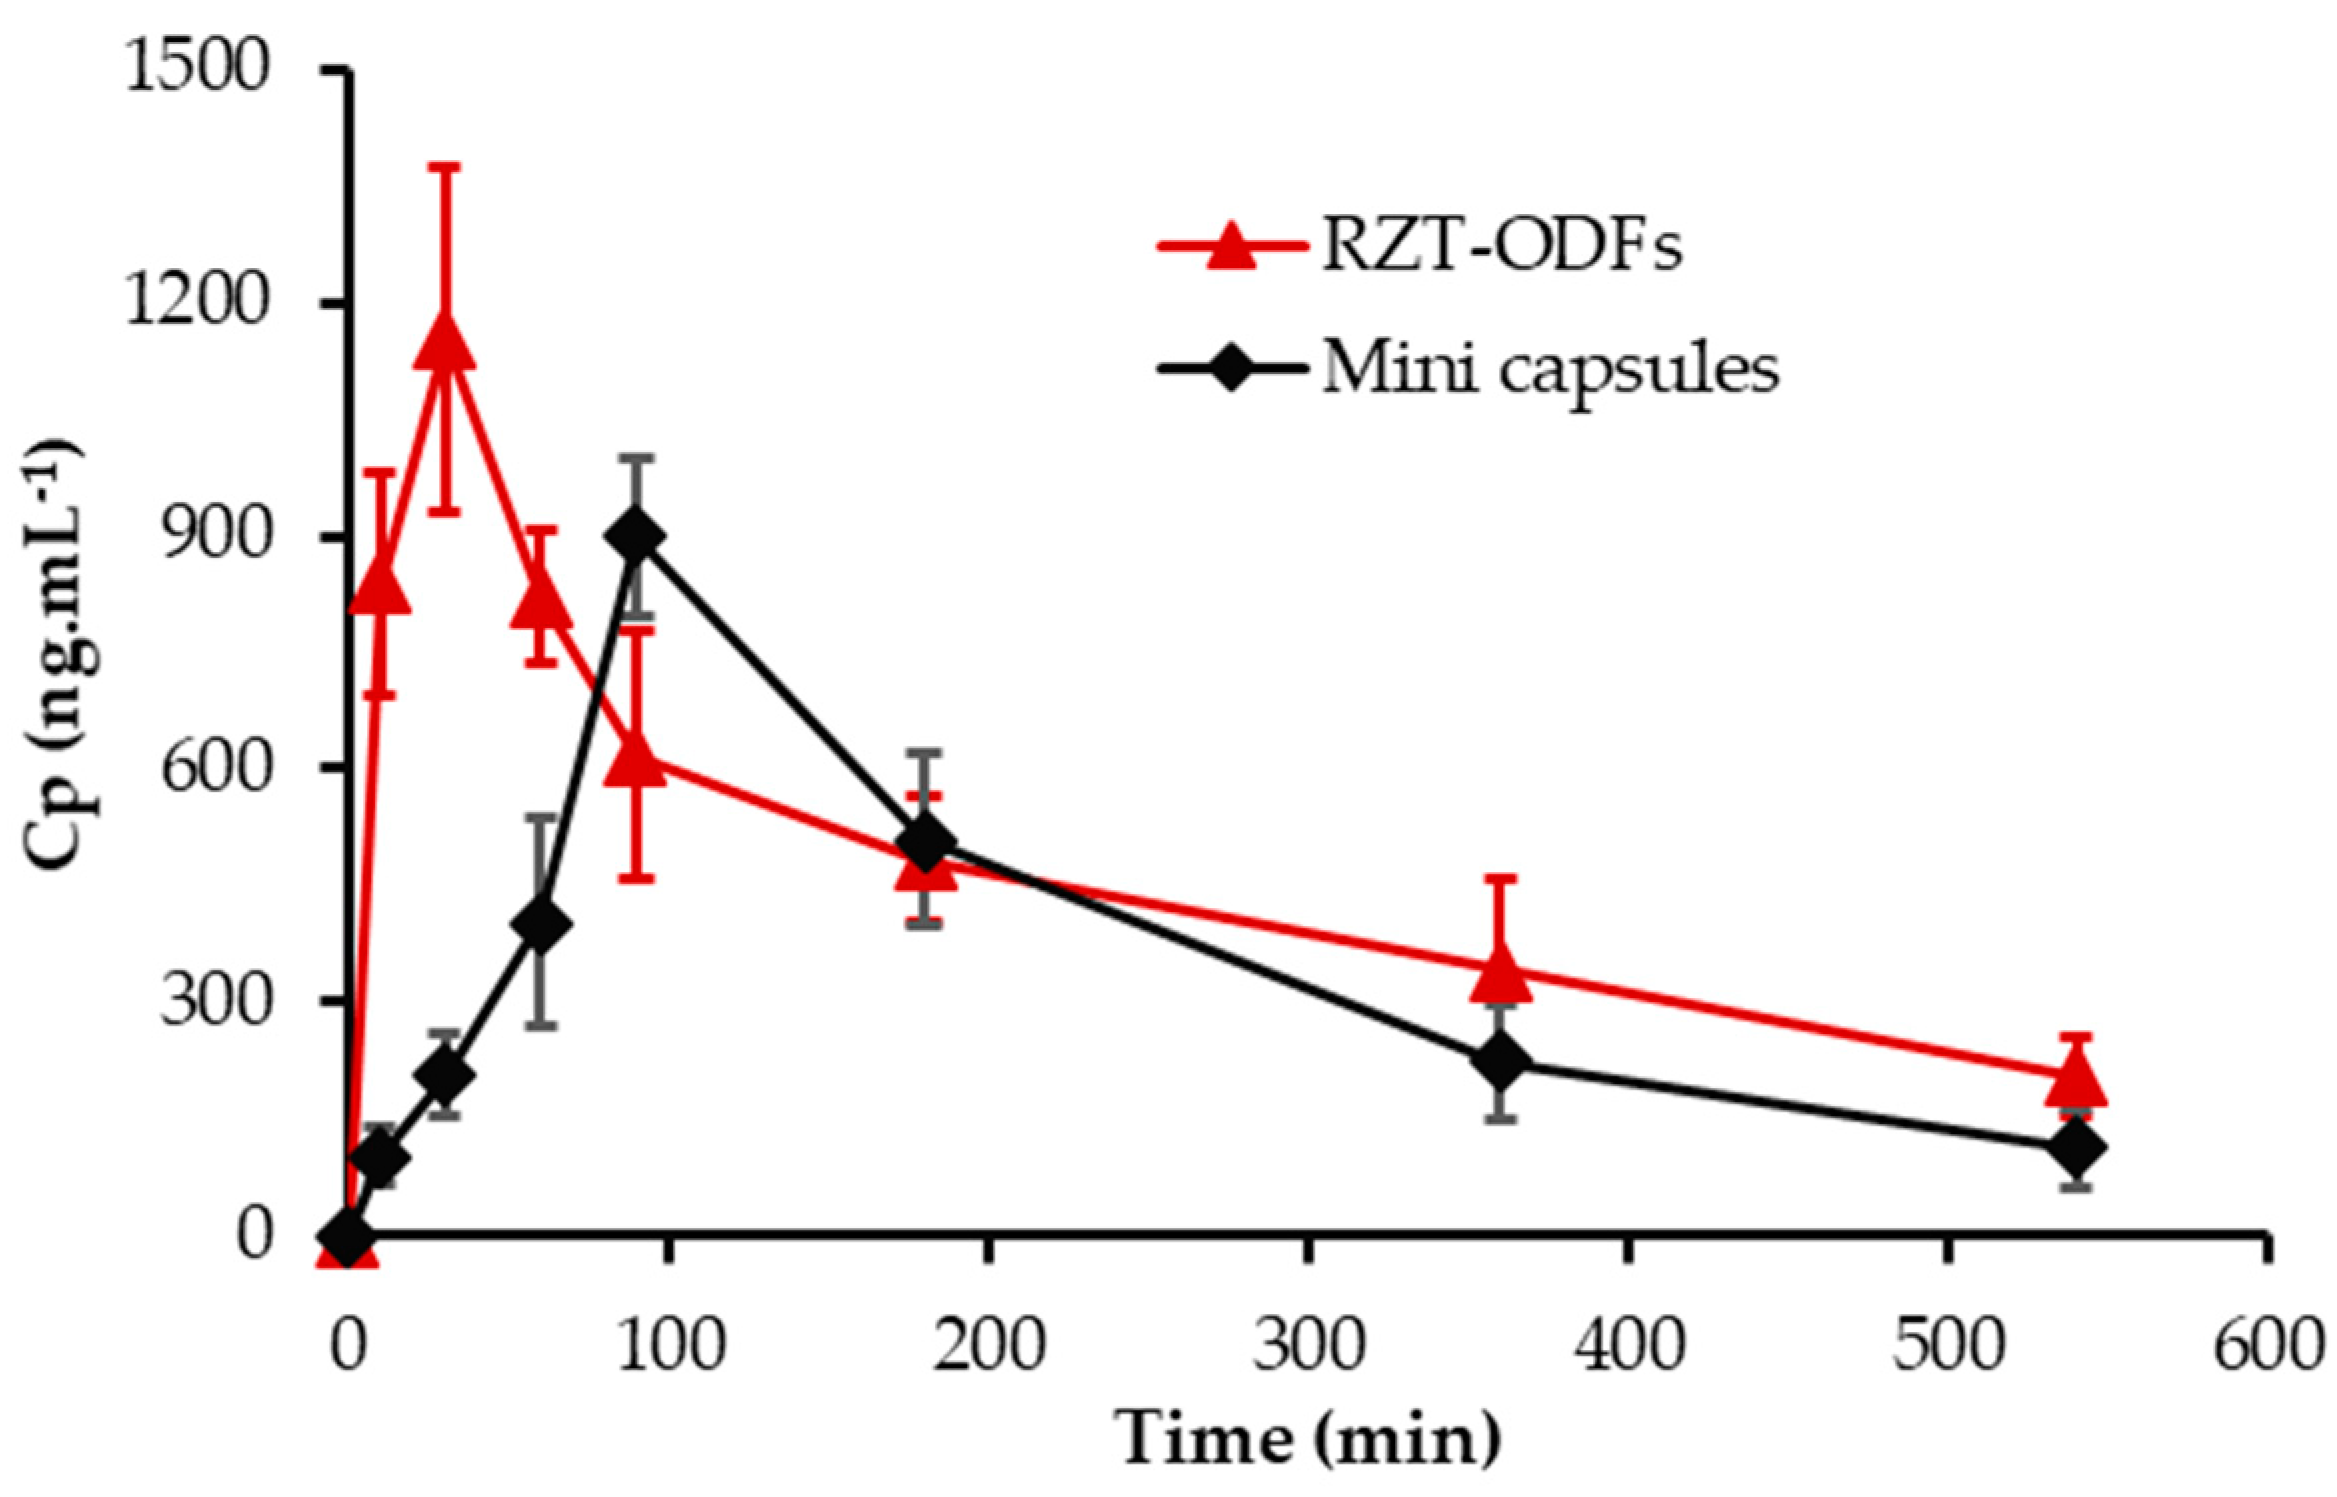
3.8. Animal Pharmacokinetic Performance
4. Conclusions
Supplementary Materials
Author Contributions
Funding
Institutional Review Board Statement
Informed Consent Statement
Data Availability Statement
Acknowledgments
Conflicts of Interest
References
- Guo, X.; Cun, D.; Wan, F.; Bera, H.; Song, Q.; Tian, X.; Chen, Y.; Rantanen, J.; Yang, M. Comparative assessment of in vitro/in vivo performances of orodispersible electrospun and casting films containing rizatriptan benzoate. Eur. J. Pharm. Biopharm. 2020, 154, 283–289. [Google Scholar] [CrossRef] [PubMed]
- Lau, Y.H.; Kurien, J.K.; Lau, K.M.; Adenan, S. Clinical Profile of Migraine Patients: A Descriptive Study of a Single Tertiary Centre in Malaysia. SN Compr. Clin. Med. 2022, 4, 22. [Google Scholar]
- Tepper, S.J.; Spears, R.C. Acute treatment of migraine. Neurol. Clin. 2009, 27, 417–427. [Google Scholar] [CrossRef]
- Ferrari, M.D.; Goadsby, P.J.; Burstein, R.; Kurth, T.; Ayata, C.; Charles, A.; Ashina, M.; van den Maagdenberg, A.M.J.M.; Dodick, D.W. Migraine. Nat. Rev. Dis. Primers. 2022, 8, 2. [Google Scholar] [CrossRef] [PubMed]
- Mathure, D.; Ranpise, H.; Awasthi, R.; Pawar, A. Formulation and Characterization of Nanostructured Lipid Carriers of Rizatriptan Benzoate-Loaded In Situ Nasal Gel for Brain Targeting. Assay Drug Dev. Technol. 2022, 20, 211–224. [Google Scholar] [CrossRef] [PubMed]
- Salehi, S.; Boddohi, S. New formulation and approach for mucoadhesive buccal film of rizatriptan benzoate. Prog. Biomater. 2017, 6, 175–187. [Google Scholar] [CrossRef] [PubMed] [Green Version]
- Gori, S.; Morelli, N.; Bellini, G.; Bonanni, E.; Manca, L.; Orlandi, G.; Iudice, A.; Murri, L. Rizatriptan does not change cerebral blood flow velocity during migraine attacks. Brain Res. Bull. 2005, 65, 297–300. [Google Scholar] [CrossRef] [PubMed]
- Wu, D.; Tanaka, Y.; Jin, Y.; Yoneto, K.; Alama, T.; Quan, Y.; Kamiyama, F.; Kusamori, K.; Katsumi, H.; Sakane, T. Development of a novel transdermal patch containing sumatriptan succinate for the treatment of migraine: In vitro and in vivo characterization. J. Drug Deliv. Sci. Technol. 2014, 24, 695–701. [Google Scholar] [CrossRef]
- Abou-Taleb, H.A.; Mustafa, W.W.; Makram, T.S.; Abdelaty, L.N.; Salem, H.; Abdelkader, H. Vardenafil Oral Dispersible Films (ODFs) with advanced dissolution, palatability, and bioavailability. Pharmaceutics 2022, 14, 517. [Google Scholar] [CrossRef]
- Alkahtani, M.E.; Aodah, A.H.; Abu Asab, O.A.; Basit, A.W.; Orlu, M.; Tawfik, E.A. Fabrication and Characterization of Fast-Dissolving Films Containing Escitalopram/Quetiapine for the Treatment of Major Depressive Disorder. Pharmaceutics 2021, 13, 891. [Google Scholar] [CrossRef] [PubMed]
- Shah, K.A.; Gao, B.; Kamal, R.; Razzaq, A.; Qi, S.; Zhu, Q.-N.; Lina, S.; Huang, L.; Cremin, G.; Iqbal, H.; et al. Development and Characterizations of Pullulan and Maltodextrin-Based Oral Fast-Dissolving Films Employing a Box–Behnken Experimental Design. Materials 2022, 15, 3591. [Google Scholar] [CrossRef] [PubMed]
- Chen, L.-H.; Doyle, P.S. Thermogelling Hydroxypropyl Methylcellulose Nanoemulsions as Templates to Formulate Poorly Water-Soluble Drugs into Oral Thin Films Containing Drug Nanoparticles. Chem. Mater. 2022, 34, 5194–5205. [Google Scholar] [CrossRef]
- Pezik, E.; Gulsun, T.; Sahin, S.; Vural, I. Development and characterization of pullulan-based orally disintegrating films containing amlodipine besylate. Eur. J. Pharm. Sci. 2021, 156, 105597. [Google Scholar] [CrossRef] [PubMed]
- Lai, F.; Franceschini, I.; Corrias, F.; Sala, M.C.; Cilurzo, F.; Sinico, C.; Pini, E. Maltodextrin fast dissolving films for quercetin nanocrystal delivery. A feasibility study. Carbohydr. Polym. 2015, 121, 217–223. [Google Scholar] [CrossRef] [PubMed]
- Xu, L.-L.; Shi, L.-L.; Cao, Q.-R.; Xu, W.-J.; Cao, Y.; Zhu, X.-Y.; Cui, J.-H. Formulation and in vitro characterization of novel sildenafil citrate-loaded polyvinyl alcohol-polyethylene glycol graft copolymer-based orally dissolving films. Int. J. Pharm. 2014, 473, 398–406. [Google Scholar] [CrossRef] [PubMed]
- Morozkina, S.; Strekalovskaya, U.; Vanina, A.; Snetkov, P.; Krasichkov, A.; Polyakova, V.; Uspenskaya, M. The Fabrication of Alginate–Carboxymethyl Cellulose-Based Composites and Drug Release Profiles. Polymers 2022, 14, 3604. [Google Scholar] [CrossRef]
- Li, Y.; Yokoyama, W.; Wu, J.; Ma, J.; Zhong, F. Properties of edible films based on pullulan–chitosan blended film-forming solutions at different pH. RSC Adv. 2015, 5, 105844–105850. [Google Scholar] [CrossRef]
- Elbadawi, M.; Nikjoo, D.; Gustafsson, T.; Gaisford, S.; Basit, A. Pressure-assisted microsyringe 3D printing of oral films based on pullulan and hydroxypropyl methylcellulose. Int. J. Pharm. 2021, 595, 120197. [Google Scholar] [CrossRef]
- Senta-Loys, Z.; Bourgeois, S.; Valour, J.-P.; Briançon, S.; Fessi, H. Orodispersible films based on amorphous solid dispersions of tetrabenazine. Int. J. Pharm. 2017, 518, 242–252. [Google Scholar] [CrossRef]
- Cilurzo, F.; Cupone, I.E.; Minghetti, P.; Buratti, S.; Selmin, F.; Gennari, C.G.; Montanari, L. Nicotine fast dissolving films made of maltodextrins: A feasibility study. AAPS PharmSciTech 2010, 11, 1511–1517. [Google Scholar] [CrossRef] [Green Version]
- Rezaee, F.; Ganji, F. Formulation, characterization, and optimization of captopril fast-dissolving oral films. AAPS PharmSciTech 2018, 19, 2203–2212. [Google Scholar] [CrossRef] [PubMed]
- Elshafeey, A.H.; El-Dahmy, R.M. Formulation and development of oral fast-dissolving films loaded with nanosuspension to augment paroxetine bioavailability: In vitro characterization, ex vivo permeation, and pharmacokinetic evaluation in healthy human volunteers. Pharmaceutics 2021, 13, 1869. [Google Scholar] [CrossRef] [PubMed]
- Mashru, R.; Sutariya, V.; Sankalia, M.; Parikh, P. Development and evaluation of fast-dissolving film of salbutamol sulphate. Drug Dev. Ind. Pharm. 2005, 31, 25–34. [Google Scholar] [CrossRef]
- Chen, Q.; Yang, W.-W.; Shen, P.; Cao, Q.-R.; Lee, B.-J.; Cui, J.-H. pH-dependent release of platycodin mitigates its gastrointestinal mucosa irritation after oral administration in rats. Arch. Pharm. Res. 2016, 39, 811–824. [Google Scholar] [CrossRef]
- Cilurzo, F.; Cupone, I.E.; Minghetti, P.; Selmin, F.; Montanari, L. Fast dissolving films made of maltodextrins. Eur. J. Pharm. Biopharm. 2008, 70, 895–900. [Google Scholar] [CrossRef] [PubMed]
- Nair, A.B.; Shah, J.; Jacob, S.; Al-Dhubiab, B.E.; Patel, V.; Sreeharsha, N.; Shinu, P. Development of mucoadhesive buccal film for rizatriptan: In vitro and in vivo evaluation. Pharmaceutics 2021, 13, 728. [Google Scholar] [CrossRef]
- Esim, O.; Ozkan, C.K.; Kurbanoglu, S.; Arslan, A.; Tas, C.; Savaser, A.; Ozkan, S.A.; Ozkan, Y. Development and in vitro/in vivo evaluation of dihydroergotamine mesylate loaded maltodextrin-pullulan sublingual films. Drug Dev. Ind. Pharm. 2019, 45, 914–921. [Google Scholar] [CrossRef]
- T Bhagawati, S.; D Chonkar, A.; J Dengale, S.; M Reddy, S.; Bhat, K. Bioavailability enhancement of rizatriptan benzoate by oral disintegrating strip: In vitro and In vivo evaluation. Curr. Drug Deliv. 2016, 13, 462–470. [Google Scholar] [CrossRef]
- Kim, J.-Y.; Choi, Y.-G.; Kim, S.R.B.; Lim, S.-T. Humidity stability of tapioca starch–pullulan composite films. Food Hydrocoll. 2014, 41, 140–145. [Google Scholar] [CrossRef]
- Takeuchi, Y.; Ikeda, N.; Tahara, K.; Takeuchi, H. Mechanical characteristics of orally disintegrating films: Comparison of folding endurance and tensile properties. Int. J. Pharm. 2020, 589, 119876. [Google Scholar] [CrossRef]
- Sharma, R.; Kamboj, S.; Singh, G.; Rana, V. Development of aprepitant loaded orally disintegrating films for enhanced pharmacokinetic performance. Eur. J. Pharmacol. 2016, 84, 55–69. [Google Scholar] [CrossRef] [PubMed]
- Lee, Y.; Kim, K.; Kim, M.; Choi, D.H.; Jeong, S.H. Orally disintegrating films focusing on formulation, manufacturing process, and characterization. J. Pharm. Investig. 2017, 47, 183–201. [Google Scholar] [CrossRef]
- Beigomi, M.; Mohsenzadeh, M.; Salari, A. Characterization of a novel biodegradable edible film obtained from Dracocephalum moldavica seed mucilage. Int. J. Biol. Macromol. 2018, 108, 874–883. [Google Scholar] [CrossRef] [PubMed]
- Jantrawut, P.; Chaiwarit, T.; Jantanasakulwong, K.; Brachais, C.H.; Chambin, O. Effect of plasticizer type on tensile property and in vitro indomethacin release of thin films based on low-methoxyl pectin. Polymers 2017, 9, 289. [Google Scholar] [CrossRef] [PubMed]
- Galus, S.; Mathieu, H.; Lenart, A.; Debeaufort, F. Effect of modified starch or maltodextrin incorporation on the barrier and mechanical properties, moisture sensitivity and appearance of soy protein isolate-based edible films. Innov. Food Sci. Emerg. Technol. 2012, 16, 148–154. [Google Scholar] [CrossRef]
- ElMeshad, A.N.; El Hagrasy, A.S. Characterization and optimization of orodispersible mosapride film formulations. AAPS PharmSciTech 2011, 12, 1384–1392. [Google Scholar] [CrossRef] [Green Version]
- Yan, J.J.; Li, Z.; Zhang, J.F.; Qiao, C.S. Preparation and properties of pullulan composite films. Adv. Mat. Res. 2012, 476–478, 2100–2104. [Google Scholar] [CrossRef]
- Palem, C.R.; Gannu, R.; Doodipala, N.; Yamsani, V.V.; Yamsani, M.R. Transmucosal delivery of domperidone from bilayered buccal patches: In vitro, ex vivo and in vivo characterization. Arch. Pharm. Res. 2011, 34, 1701–1710. [Google Scholar] [CrossRef]
- Zhang, L.; Aloia, M.; Pielecha-Safira, B.; Lin, H.; Rajai, P.M.; Kunnath, K.; Davé, R.N. Impact of superdisintegrants and film thickness on disintegration time of strip films loaded with poorly water-soluble drug microparticles. J. Pharm. Sci. 2018, 107, 2107–2118. [Google Scholar] [CrossRef]
- Fahmy, R.H.; Badr-Eldin, S.M. Novel delivery approach for ketotifen fumarate: Dissofilms formulation using 32 experimental design: In vitro/in vivo evaluation. Pharm. Dev. Technol. 2014, 19, 521–530. [Google Scholar] [CrossRef]
- Enomoto-Rogers, Y.; Iio, N.; Takemura, A.; Iwata, T. Synthesis and characterization of pullulan alkyl esters. Eur. Polym. J. 2015, 66, 470–477. [Google Scholar] [CrossRef]
- Patel, V.I.; Dave, R.H. Evaluation of colloidal solid dispersions: Physiochemical considerations and in vitro release profile. AAPS PharmSciTech 2013, 14, 620–628. [Google Scholar] [CrossRef] [PubMed] [Green Version]
- Raja, K.; Sankarikutty, B.; Sreekumar, M.; Jayalekshmy, A.; Narayanan, C. Material characterization studies of maltodextrin samples for the use of wall material. Starch 1989, 41, 298–303. [Google Scholar] [CrossRef]
- Singh, A.; Ubrane, R.; Prasad, P.; Ramteke, S. Preparation and characterization of rizatriptan benzoate loaded solid lipid nanoparticles for brain targeting. Mater. Today Proc. 2015, 2, 4521–4543. [Google Scholar] [CrossRef]
- Vidyadhara, S.; Sasidhar, R.L.; Balakrishna, T.; Vardhan, M.S. Formulation of rizatriptan benzoate fast dissolving buccal films by emulsion evaporation technique. Int. J. Pharm. Investig. 2015, 5, 101. [Google Scholar] [CrossRef] [Green Version]
- Santiago-Adame, R.; Medina-Torres, L.; Gallegos-Infante, J.; Calderas, F.; González-Laredo, R.; Rocha-Guzmán, N.; Ochoa-Martínez, L.; Bernad-Bernad, M. Spray drying-microencapsulation of cinnamon infusions (Cinnamomum zeylanicum) with maltodextrin. LWT-Food Sci. Technol. 2015, 64, 571–577. [Google Scholar] [CrossRef]
- Lima, I.A.d.; Pomin, S.P.; Cavalcanti, O.A. Development and characterization of pullulan-polymethacrylate free films as potential material for enteric drug release. Braz. J. Pharm. Sci. 2017, 53. [Google Scholar] [CrossRef] [Green Version]
- Dungarwal, U.N.; Patil, S.B. Development of orodispersible tablets of taste masked rizatriptan benzoate using hydroxypropyl β cyclodextrin. J. Pharm. Investig. 2016, 46, 537–545. [Google Scholar] [CrossRef]
- Mourabet, M.; El Rhilassi, A.; El Boujaady, H.; Bennani-Ziatni, M.; El Hamri, R.; Taitai, A. Removal of fluoride from aqueous solution by adsorption on Apatitic tricalcium phosphate using Box–Behnken design and desirability function. Appl. Surf. Sci. 2012, 258, 4402–4410. [Google Scholar] [CrossRef]
- Lai, K.L.; Fang, Y.; Han, H.; Li, Q.; Zhang, S.; Li, H.Y.; Chow, S.F.; Lam, T.N.; Lee, W.Y.T. Orally-dissolving film for sublingual and buccal delivery of ropinirole. Colloids Surf. B 2018, 163, 9–18. [Google Scholar] [CrossRef] [PubMed]
- Singh, H.; Singla, Y.P.; Narang, R.S.; Pandita, D.; Singh, S.; Narang, J.K. Frovatriptan loaded hydroxy propyl methyl cellulose/treated chitosan based composite fast dissolving sublingual films for management of migraine. J. Drug Deliv. Sci. Technol. 2018, 47, 230–239. [Google Scholar] [CrossRef]


| Code | PUL (mg, X1) | MTX (mg, X2) | PG (%, X3) | Thickness (Y1, µm) | FE (Y2, Folds) | TS (Y3, MPa) | Elongation (Y4, %) | Moisture Content (Y5, %) | Moisture Uptake (Y6, MPa) | D-Time (Y7, s) |
|---|---|---|---|---|---|---|---|---|---|---|
| F1 | 300 | 100 | 15 | 44.1 ± 5.8 | 64.7 ± 7.8 | 11.1 ± 3.5 | 14.0 ± 9.1 | 6.0 ± 1.7 | 5.4 ± 1.6 | 19.0 ± 1.8 |
| F2 | 300 | 100 | 20 | 43.0 ± 5.3 | 80.7 ± 6.7 | 6.3 ± 4.0 | 25.4 ± 3.9 | 6.7 ± 1.9 | 5.7 ± 1.8 | 17.8 ± 1.6 |
| F3 | 300 | - | 25 | 26.0 ± 4.5 | 121.3 ± 3.2 | 7.9 ± 0.9 | 28.4 ± 0.7 | 3.9 ± 0.9 | 2.1 ± 0.5 | 24.7 ± 4.1 |
| F4 | 300 | 100 | 25 | 39.8 ± 5.0 | 110 ± 8.0 | 2.5 ± 0.1 | 58.9 ± 0.3 | 7.5 ± 2.1 | 5.8 ± 1.8 | 16.0 ± 2.4 |
| F5 | 300 | 100 | 30 | 44.2 ± 4.6 | 156.3 ± 10.7 | 1.1 ± 0.9 | 62.2 ± 2.8 | 8.2 ± 2.4 | 6.1 ± 1.9 | 15.3 ± 3.1 |
| F6 | 400 | 100 | 15 | 63.9 ± 7.4 | 88.7 ± 12.9 | 15.7 ± 0.4 | 13.9 ± 0.2 | 5.8 ± 1.8 | 4.4 ± 1.8 | 29.7 ± 2.9 |
| F7 | 400 | 100 | 20 | 62.9 ± 6.8 | 112.7 ± 9.5 | 7.2 ± 4.0 | 24 ± 0.6 | 6.1 ± 2.5 | 4.5 ± 1.9 | 27.0 ± 1.7 |
| F8 | 400 | - | 25 | 40.2 ± 5.3 | 142.3 ± 12.4 | 8.6 ± 8.1 | 27.7 ± 1.5 | 4.5 ± 1.3 | 2.6 ± 0.8 | 35.7 ± 3.0 |
| F9 | 400 | 100 | 25 | 64.2 ± 4.5 | 128.3 ± 8.5 | 5.0 ± 4.0 | 53.2 ± 12.4 | 6.5 ± 2.8 | 4.7 ± 2.0 | 25.0 ± 2.0 |
| F10 | 400 | 100 | 30 | 63.1 ± 4.6 | 193.0 ± 6.1 | 4.4 ± 1.0 | 54.8 ± 12.4 | 7.1 ± 3.0 | 4.8 ± 2.1 | 24.3 ± 2.0 |
| F11 | 500 | 100 | 15 | 84.4 ± 5.0 | 106.3 ± 8.0 | 21.3 ± 1.8 | 13.4 ± 7.1 | 5.2 ± 2.9 | 3.5 ± 1.8 | 36.5 ± 3.3 |
| F12 | 500 | 100 | 20 | 87.0 ± 6.6 | 146.3 ± 7.4 | 9.7 ± 5.9 | 21.1 ± 6.0 | 5.5 ± 3.1 | 3.7 ± 1.6 | 35.2 ± 3.9 |
| F13 | 500 | - | 25 | 66.4 ± 5.5 | 173.0 ± 6.6 | 9.8 ± 9.4 | 25.2 ± 11.3 | 4.9 ± 2.2 | 2.8 ± 1.4 | 44.7 ± 4.2 |
| F14 | 500 | 100 | 25 | 83.8 ± 4.1 | 160.7 ± 7.6 | 6.3 ± 2.7 | 42.1 ± 0.3 | 5.9 ± 3.3 | 4.0 ± 2.0 | 34.3 ± 2.5 |
| F15 | 500 | 100 | 30 | 85.7 ± 5.0 | 243.3 ± 7.5 | 5.2 ± 3.9 | 51.1 ± 8.8 | 6.4 ± 3.6 | 4.5 ± 2.3 | 33.2 ± 2.3 |
| No. | PK-Parameters | RZT-ODFs | Mini Capsules |
|---|---|---|---|
| 1 | Cmax (ng·mL−1) | 1151.9 ± 223.1 * | 898.2 ± 103.1 |
| 2 | Tmax (h) | 0.5 | 1.5 |
| 3 | AUC(0−t) (ng·h·mL−1) | 4140.9 ± 630.0 * | 3201.3 ± 467.9 |
| 4 | MRT (h) | 3.3 ± 0.3 | 3.3 ± 0.3 |
Publisher’s Note: MDPI stays neutral with regard to jurisdictional claims in published maps and institutional affiliations. |
© 2022 by the authors. Licensee MDPI, Basel, Switzerland. This article is an open access article distributed under the terms and conditions of the Creative Commons Attribution (CC BY) license (https://creativecommons.org/licenses/by/4.0/).
Share and Cite
Shah, K.A.; Li, G.; Song, L.; Gao, B.; Huang, L.; Luan, D.; Iqbal, H.; Cao, Q.; Menaa, F.; Lee, B.-J.; et al. Rizatriptan-Loaded Oral Fast Dissolving Films: Design and Characterizations. Pharmaceutics 2022, 14, 2687. https://doi.org/10.3390/pharmaceutics14122687
Shah KA, Li G, Song L, Gao B, Huang L, Luan D, Iqbal H, Cao Q, Menaa F, Lee B-J, et al. Rizatriptan-Loaded Oral Fast Dissolving Films: Design and Characterizations. Pharmaceutics. 2022; 14(12):2687. https://doi.org/10.3390/pharmaceutics14122687
Chicago/Turabian StyleShah, Kiramat Ali, Guifeng Li, Lina Song, Binbin Gao, Linyu Huang, Dazhi Luan, Haroon Iqbal, Qingri Cao, Farid Menaa, Beom-Jin Lee, and et al. 2022. "Rizatriptan-Loaded Oral Fast Dissolving Films: Design and Characterizations" Pharmaceutics 14, no. 12: 2687. https://doi.org/10.3390/pharmaceutics14122687