
Influence of Oil Polarity and Cosurfactants on the Foamability of Mono- and Diacylphosphatidylcholine Stabilized Emulsions


Abstract
:1. Introduction
2. Materials and Methods
2.1. Materials
2.2. Preparation of Premixes
2.3. Preparation of Oil-in-Water Emulsions
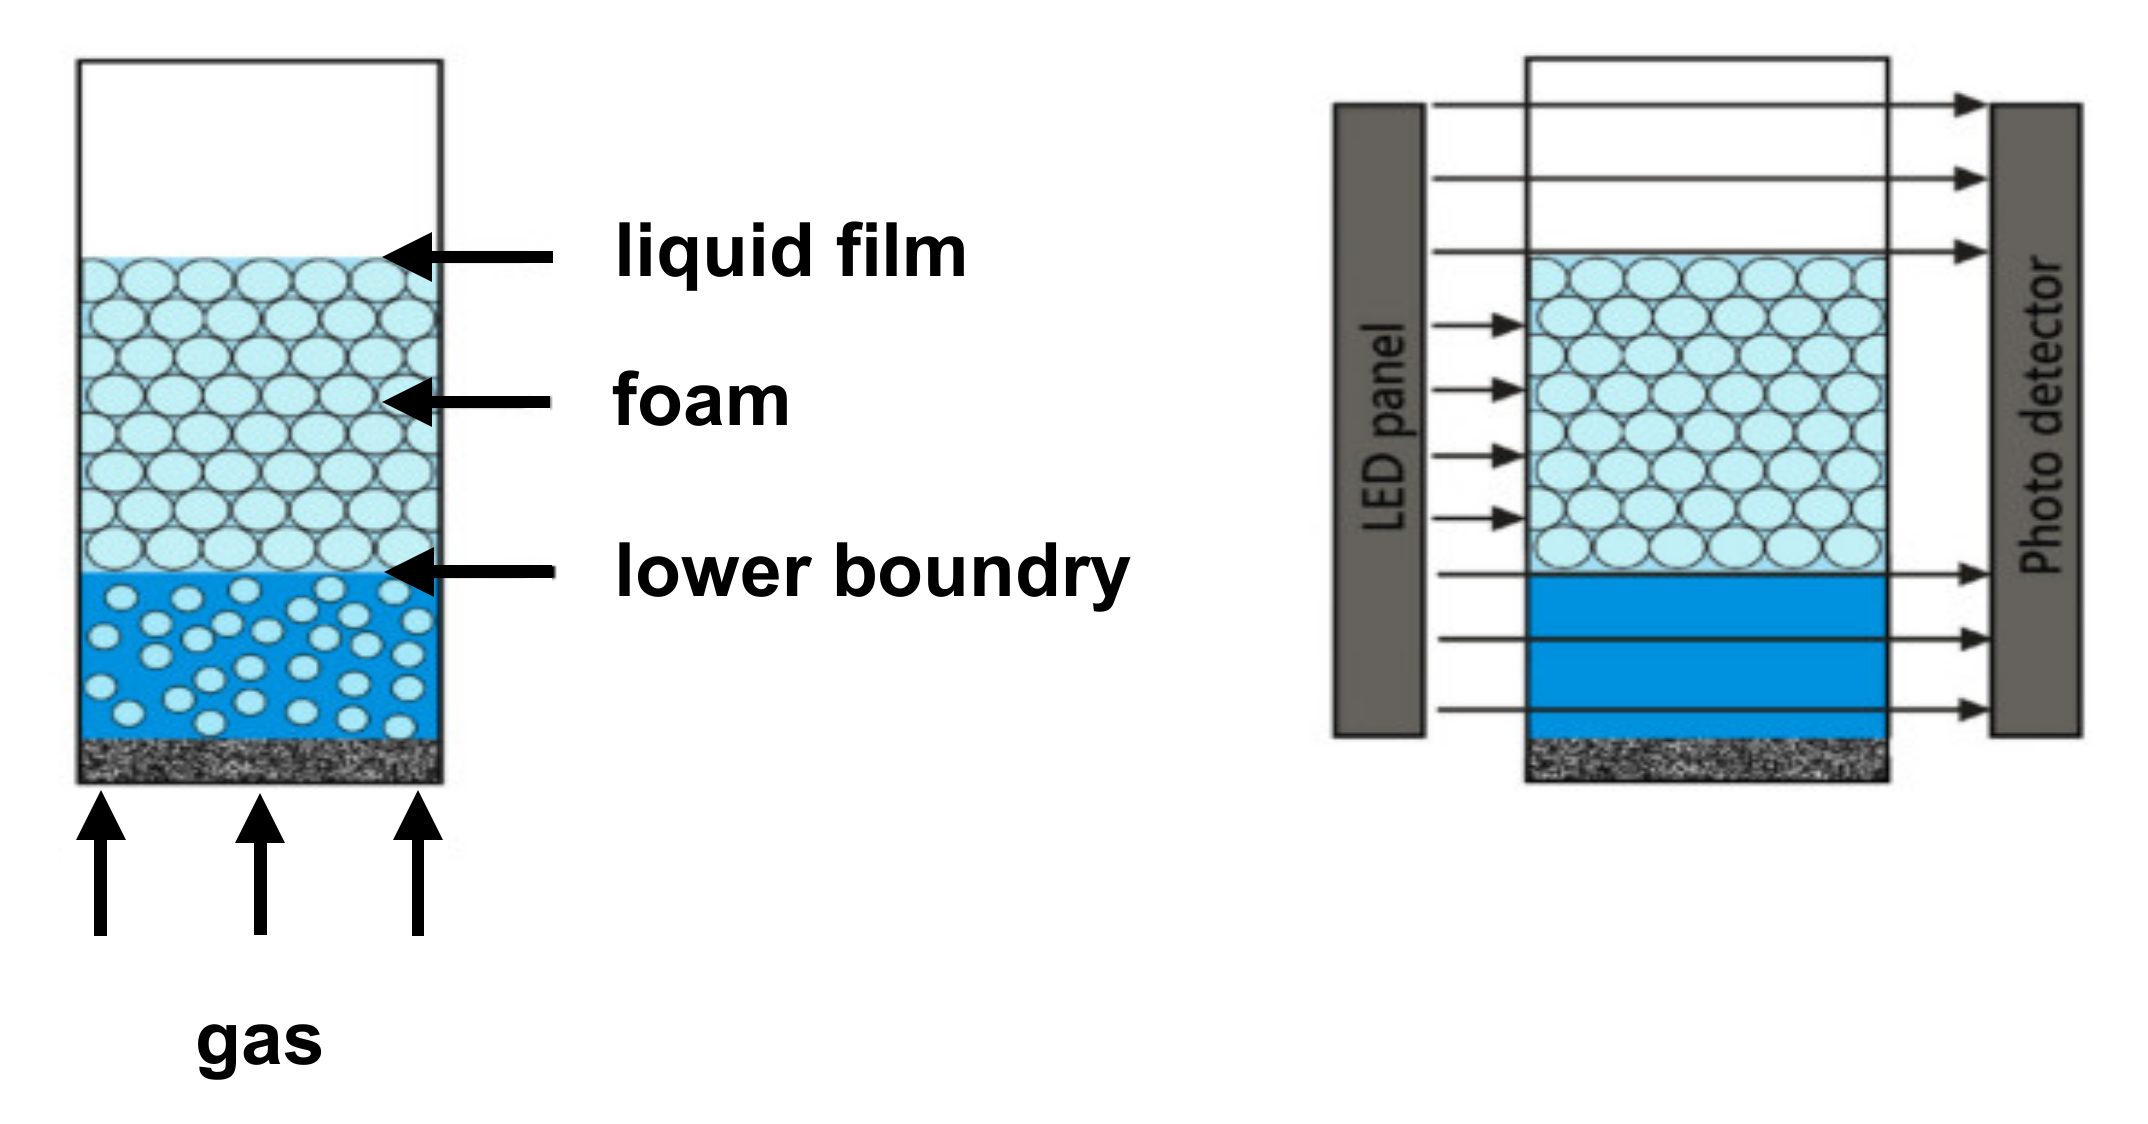
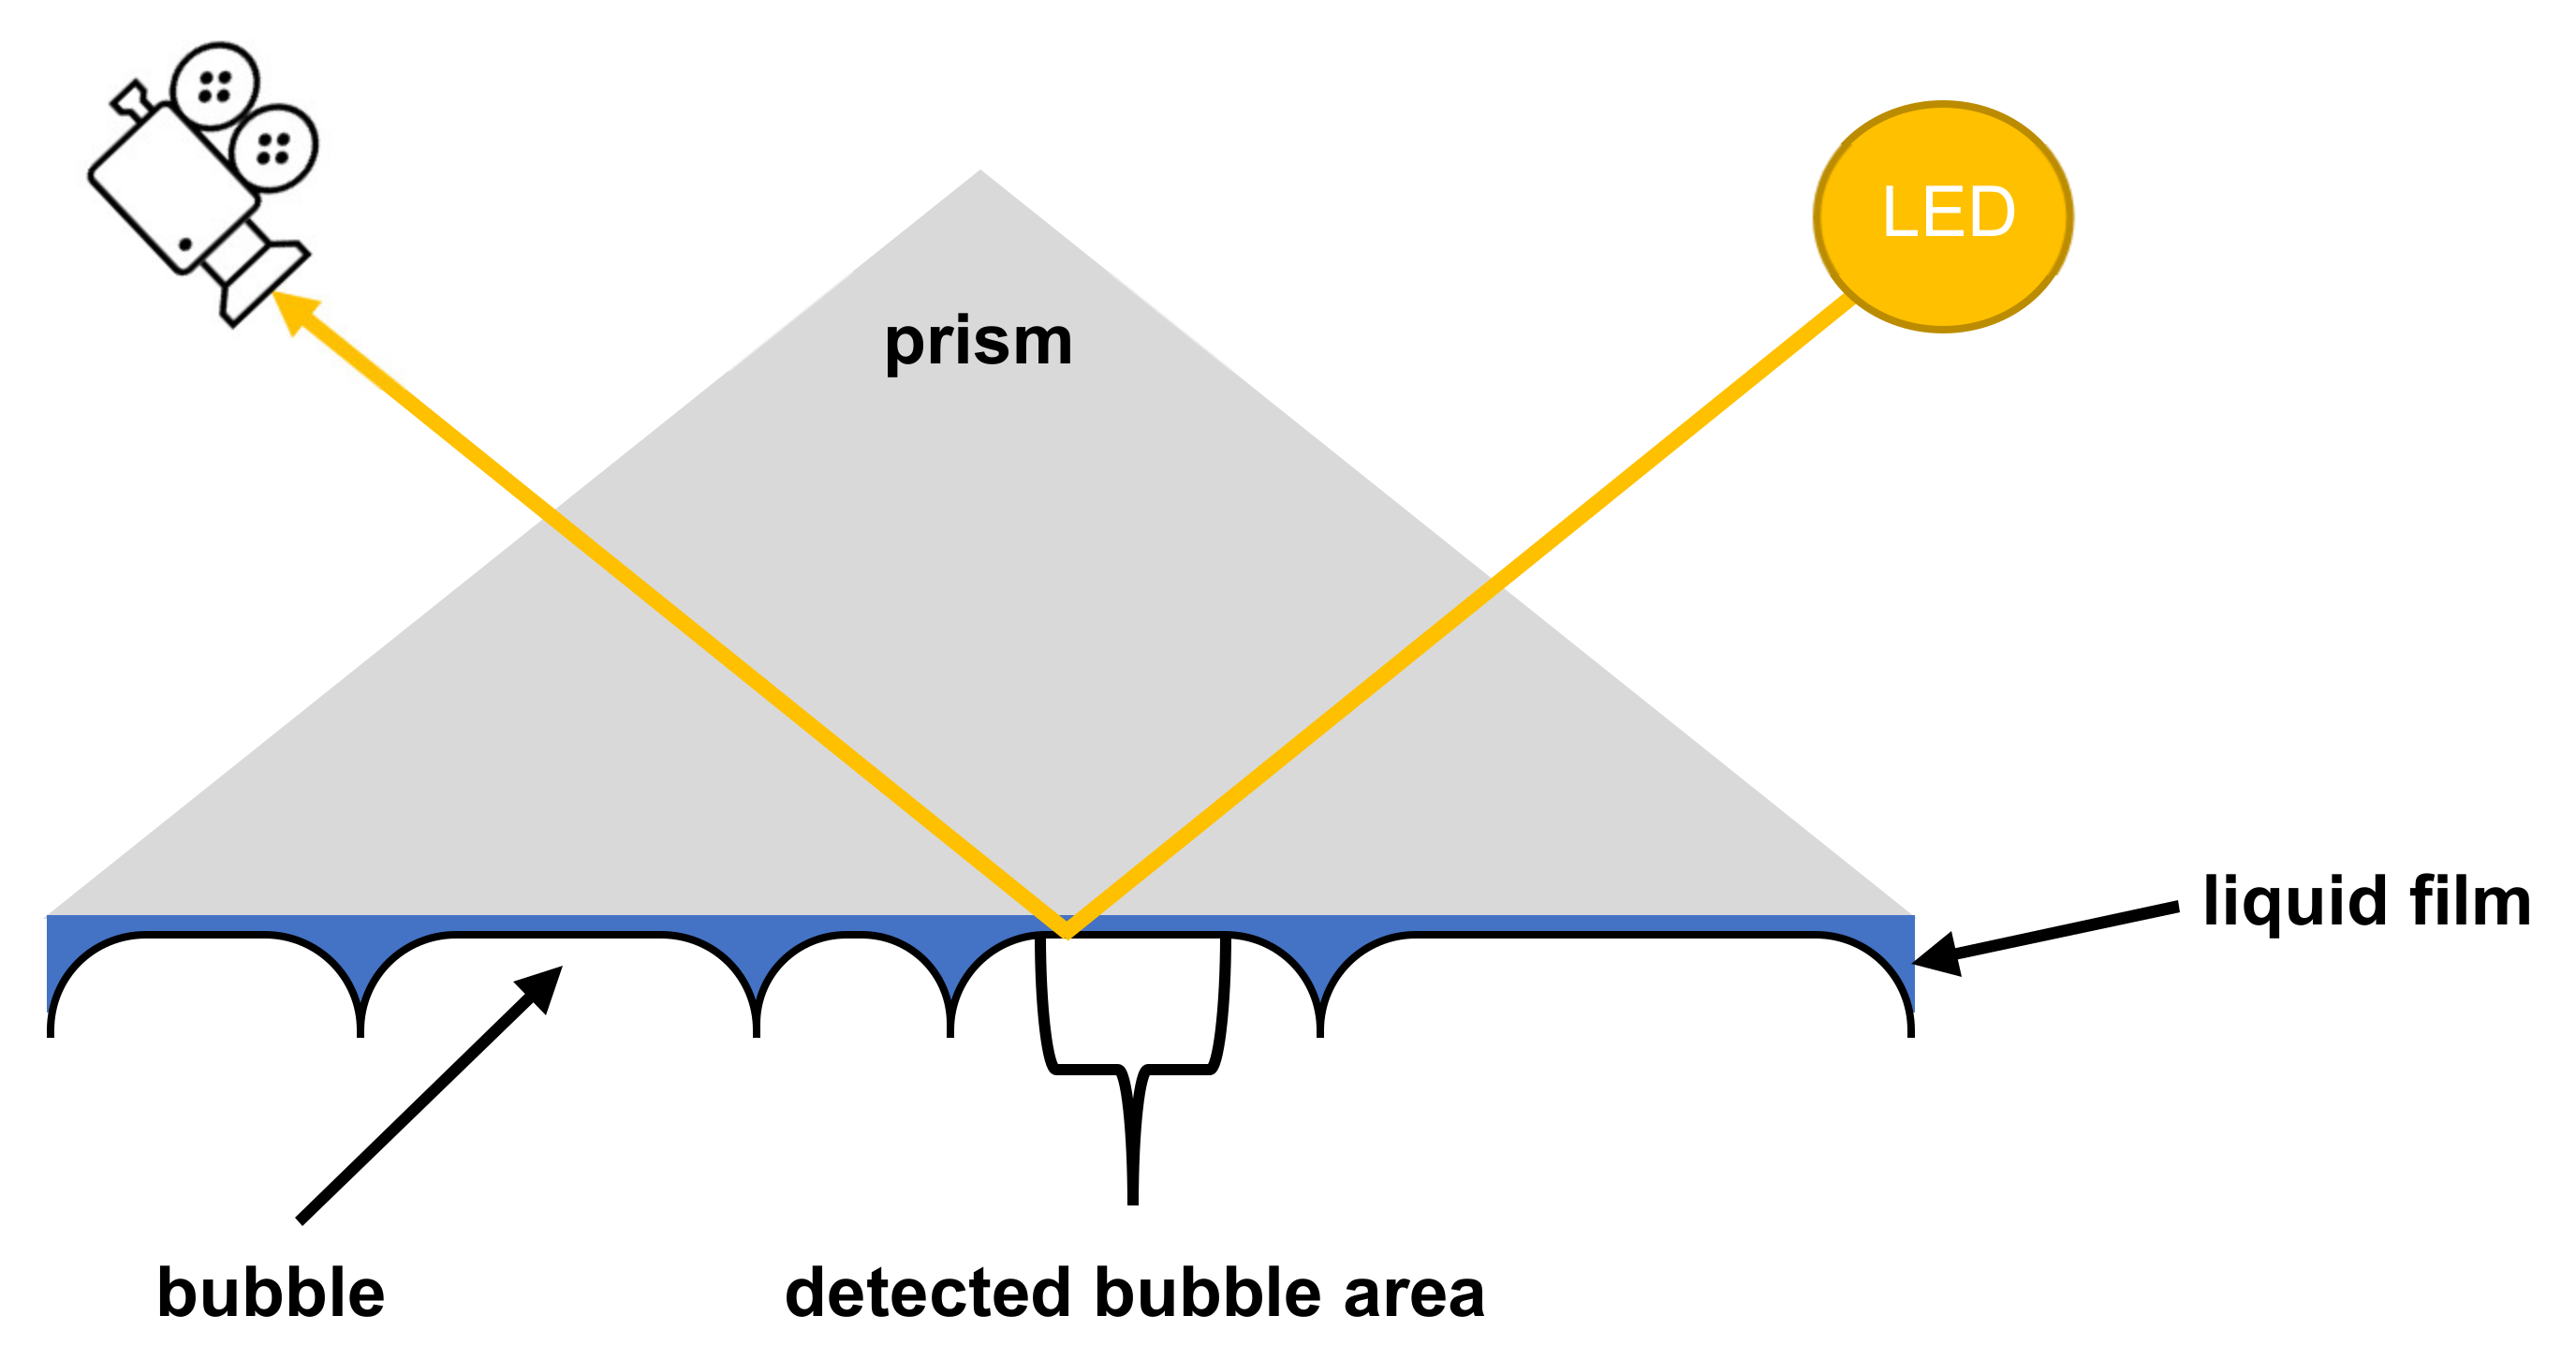
2.4. Foam Analysis
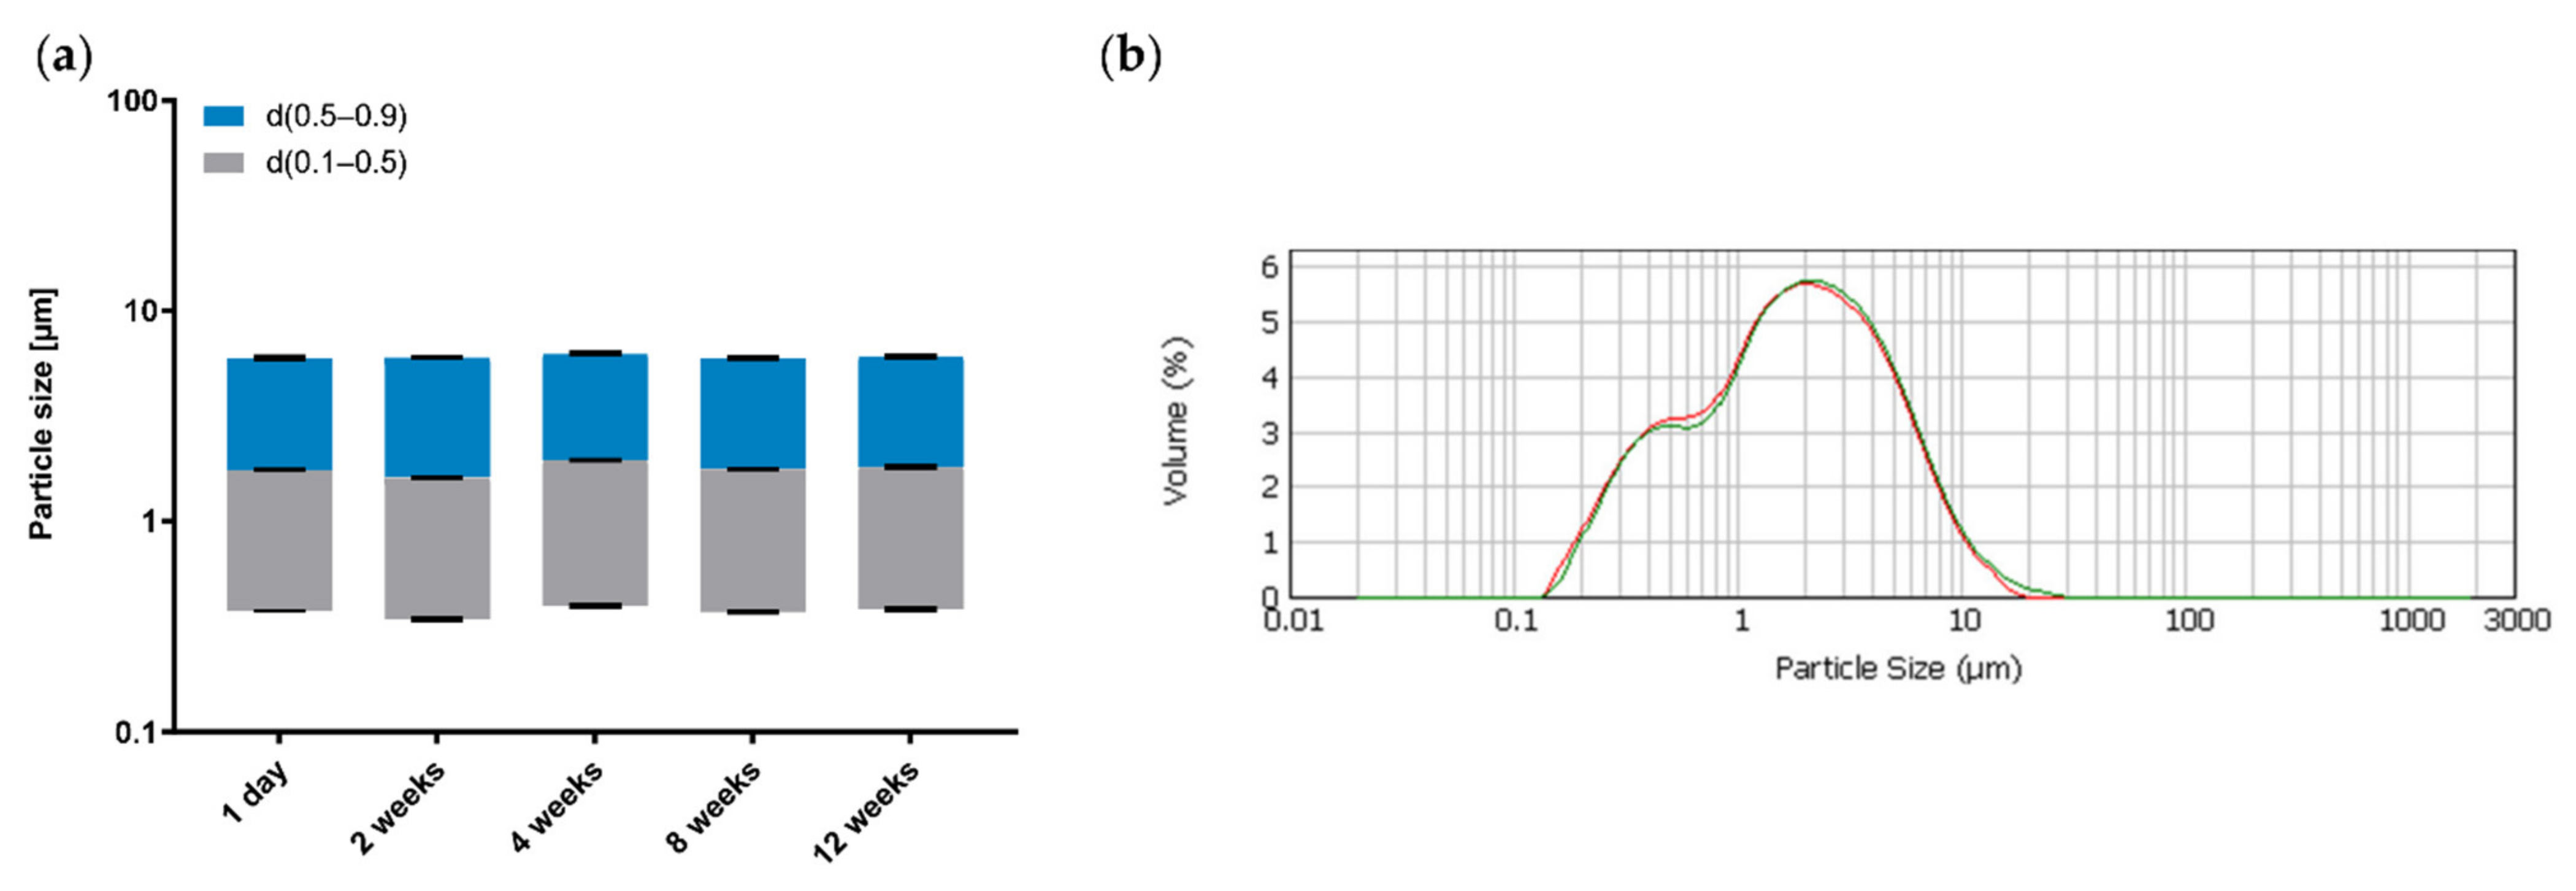
2.5. Droplet Size Analysis
2.6. Density Measurements
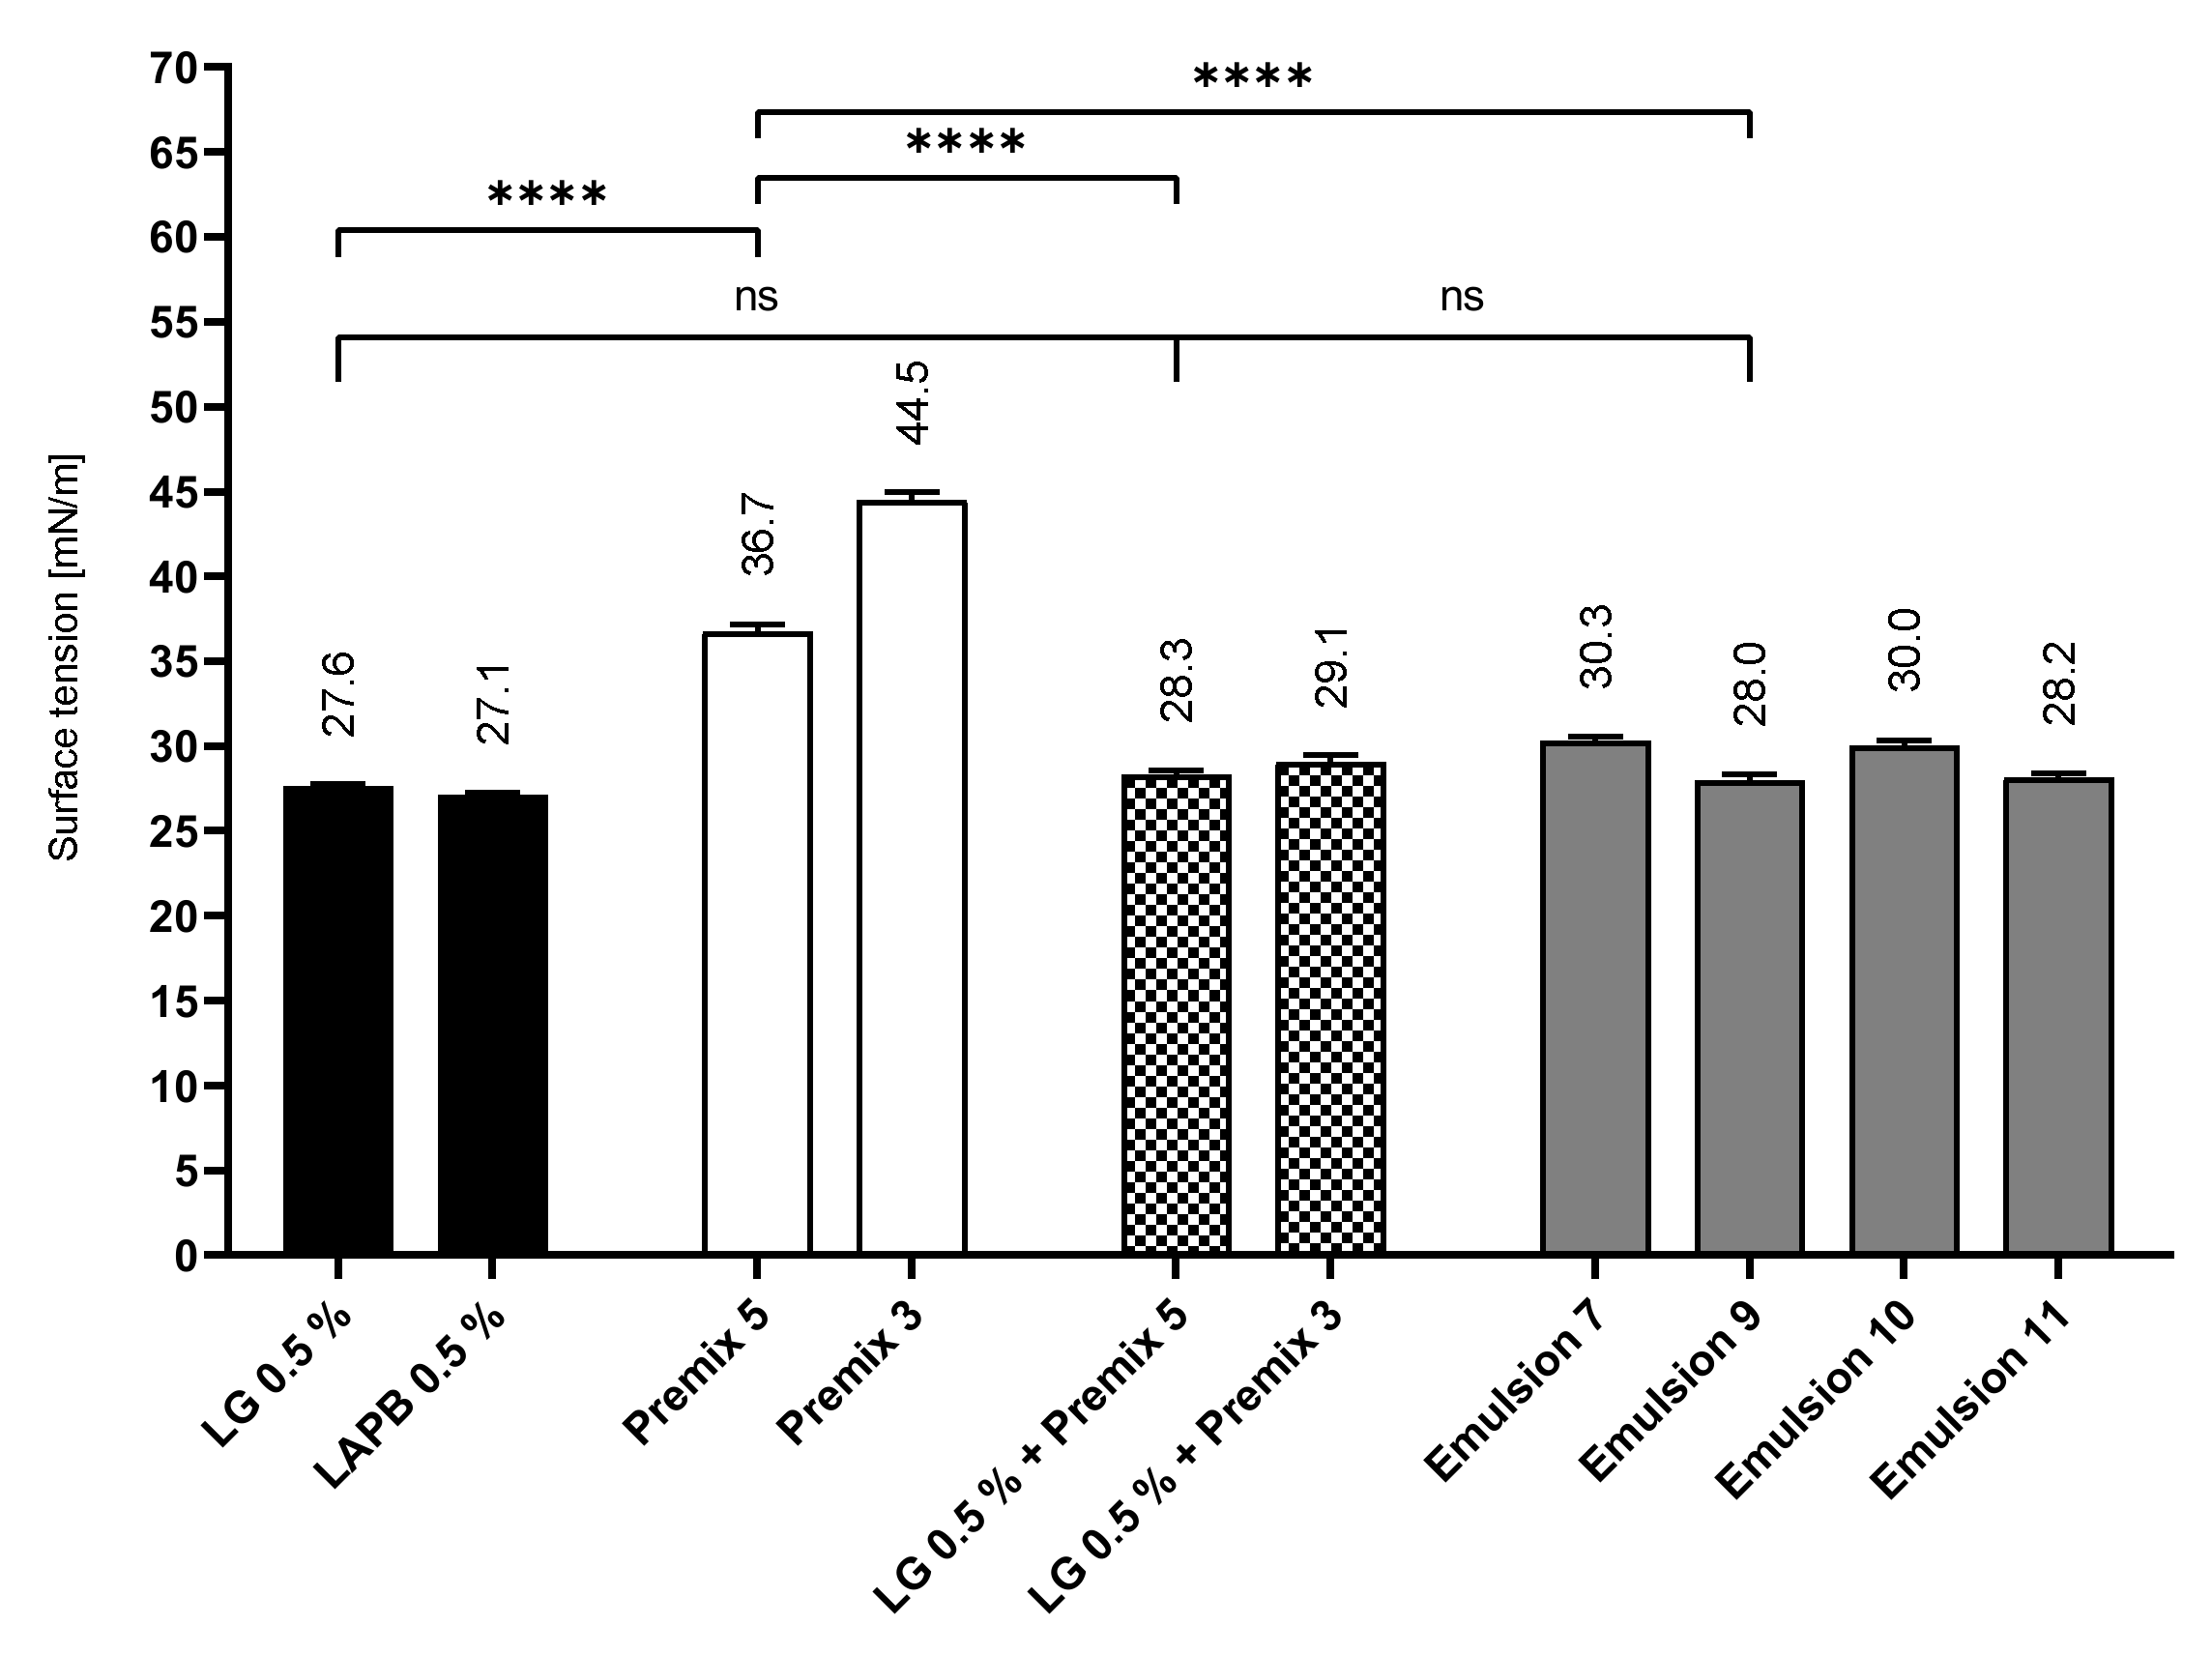
2.7. Surface Tension Measurements
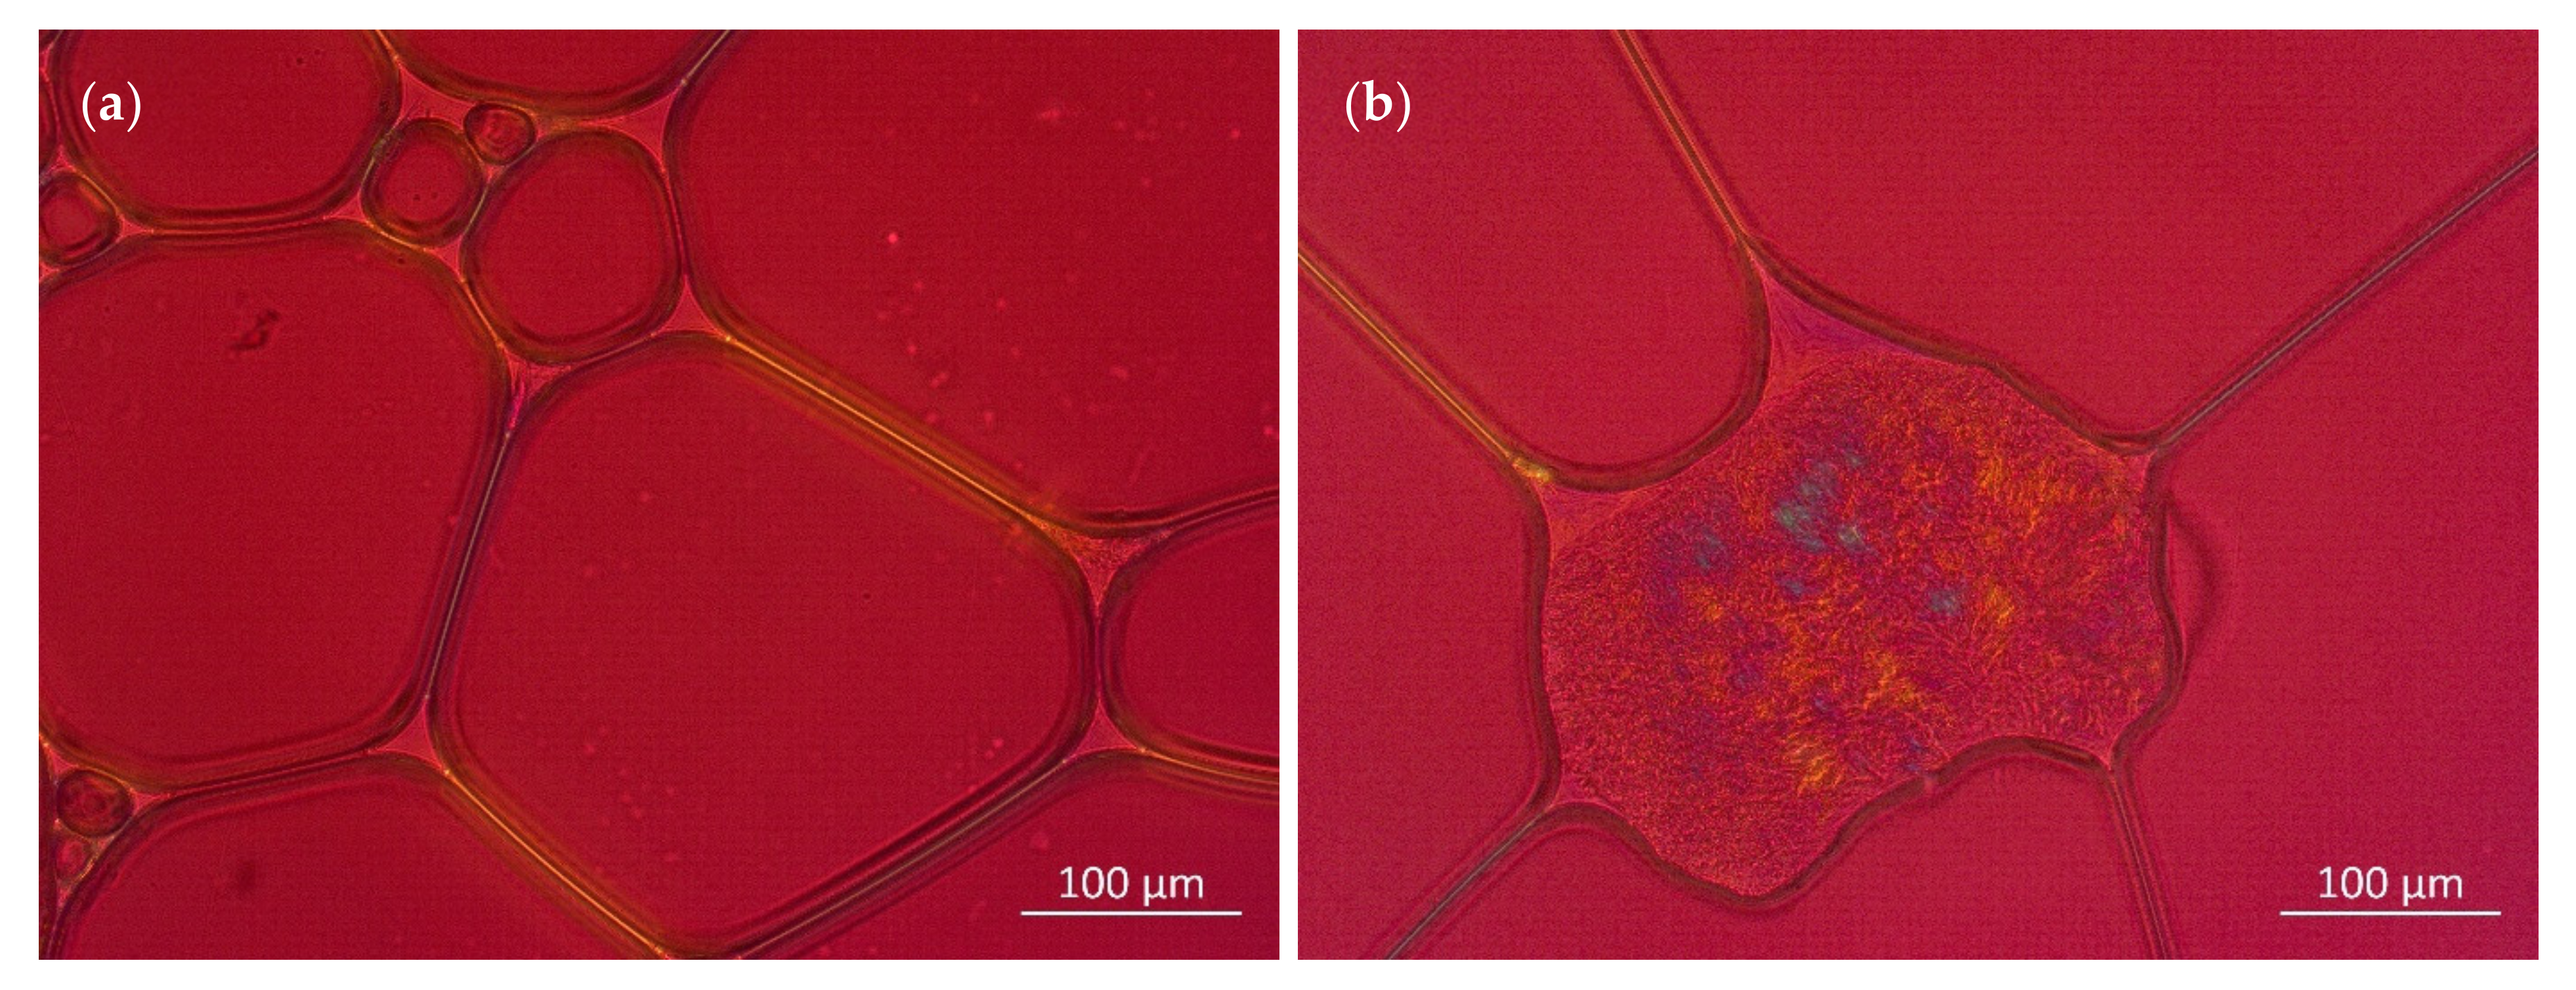
2.8. Microscopy
2.9. Statistical Analysis
3. Results and Discussion
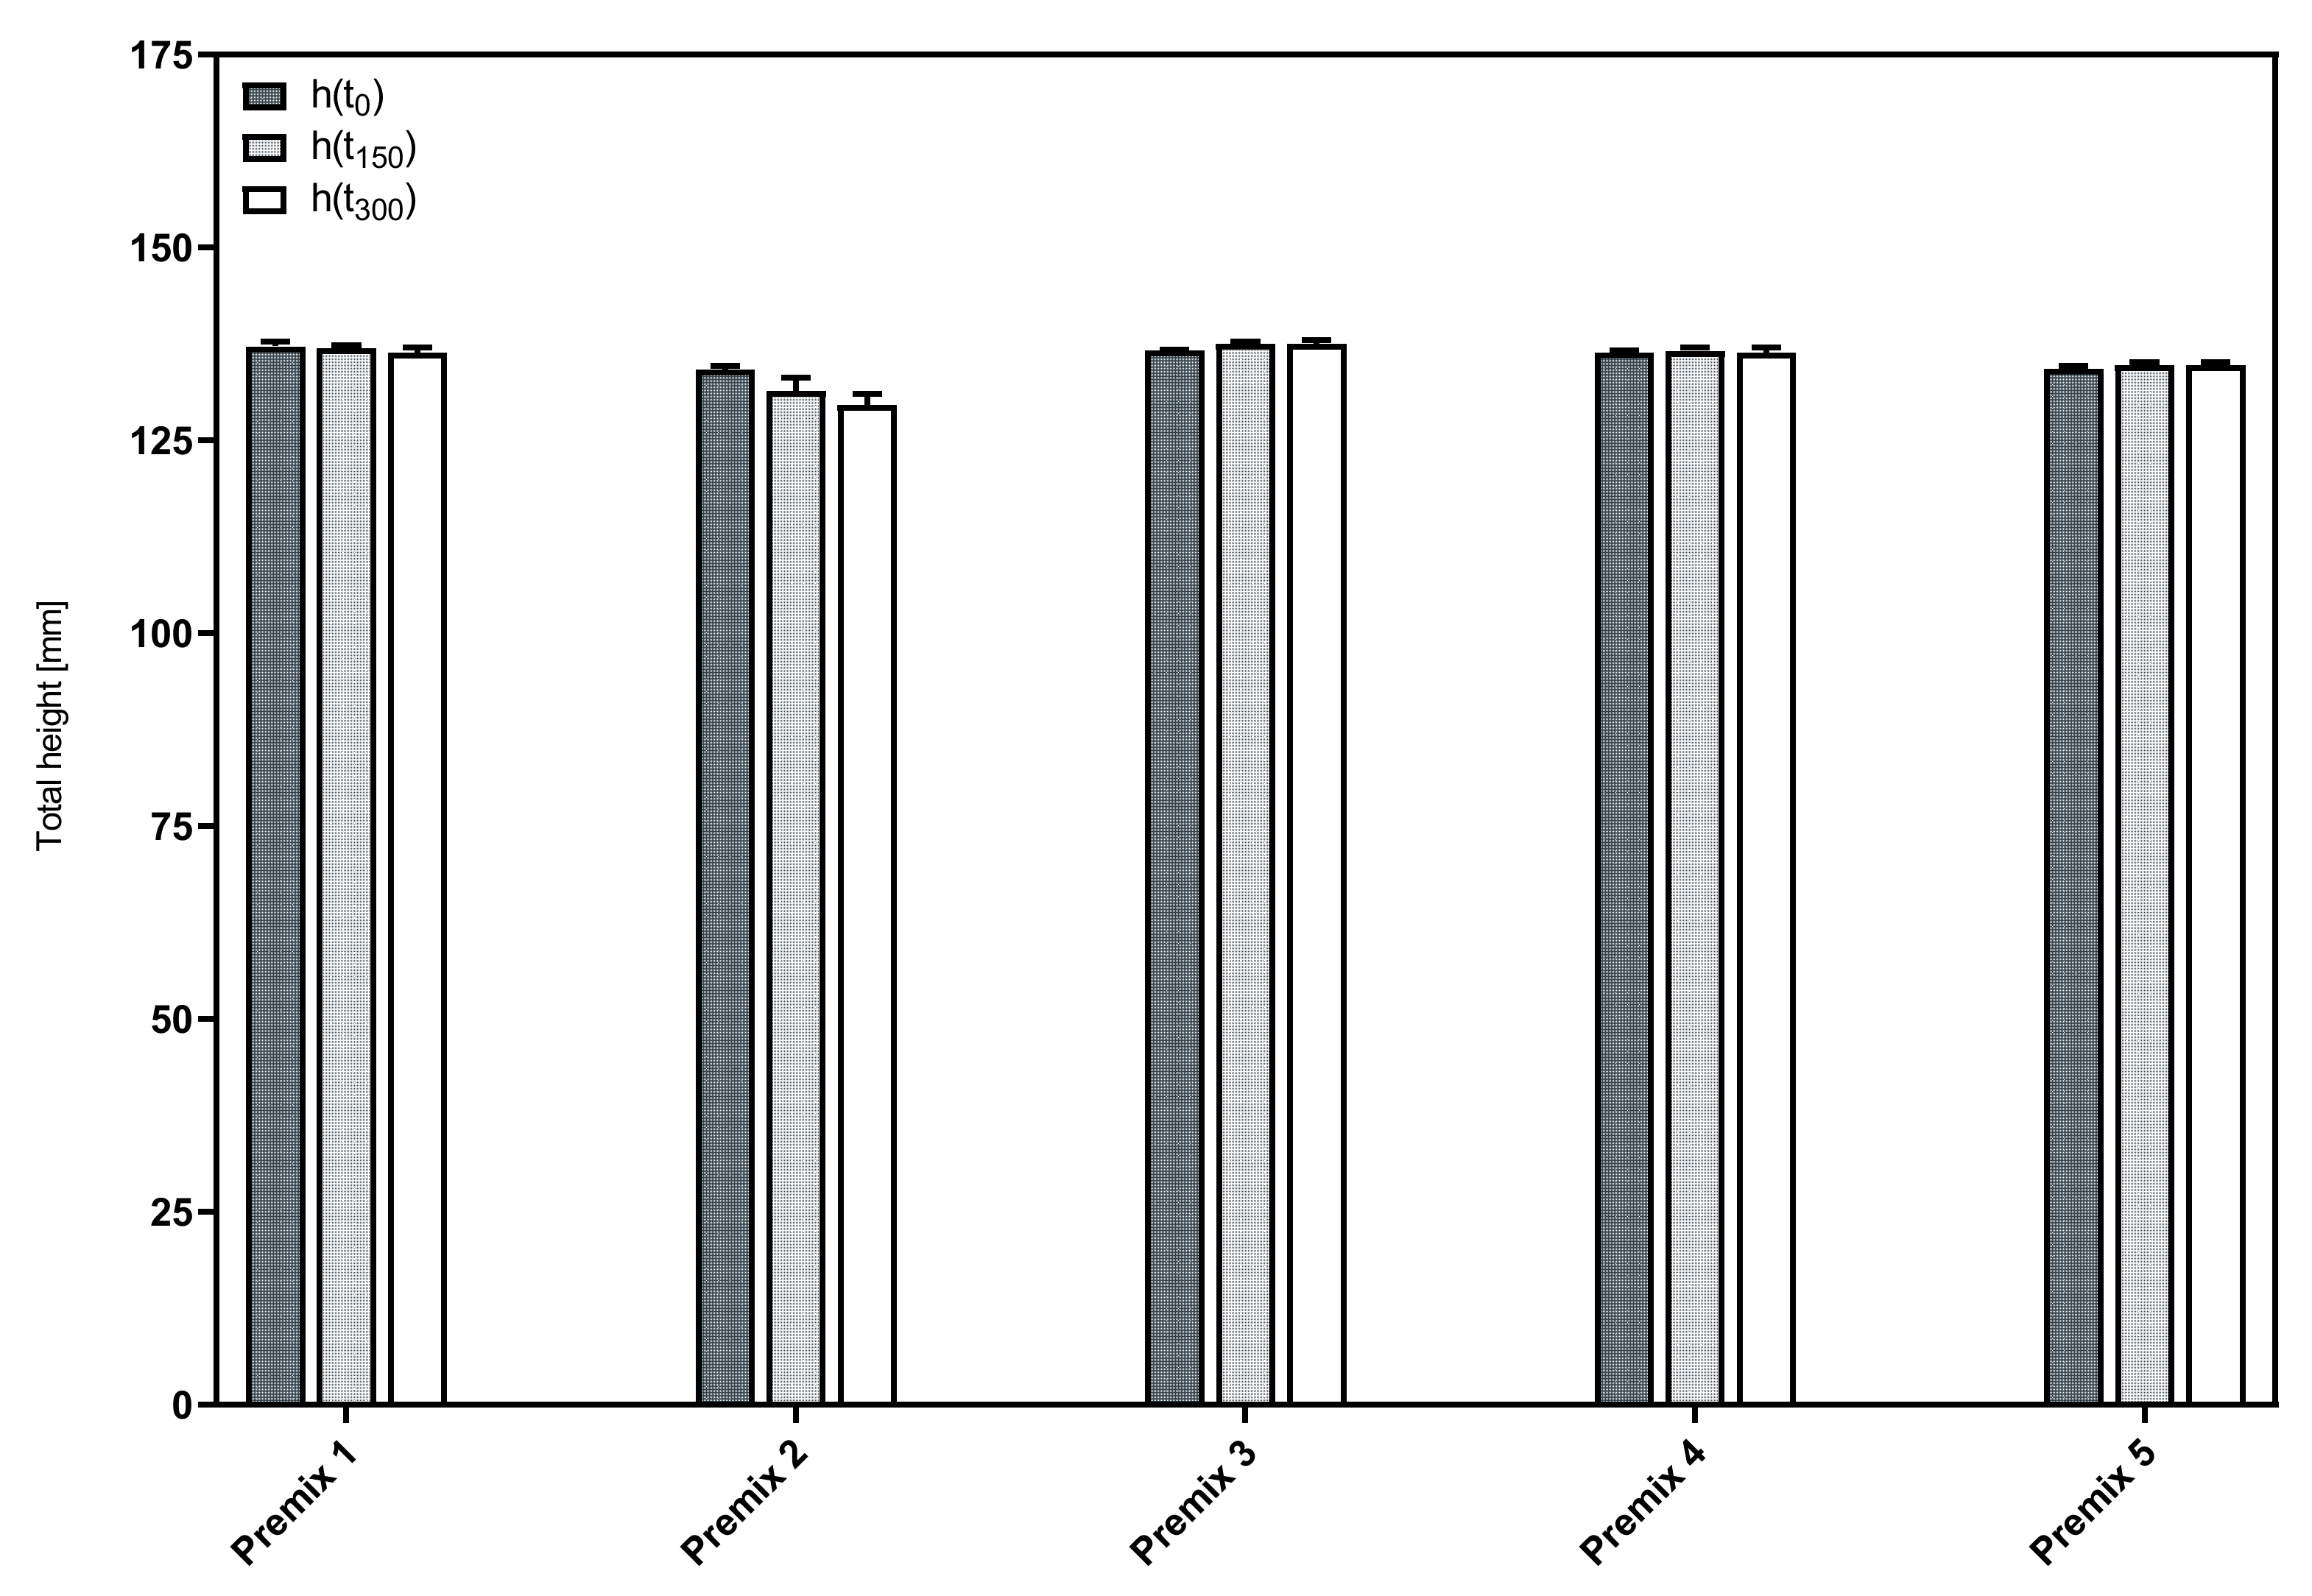
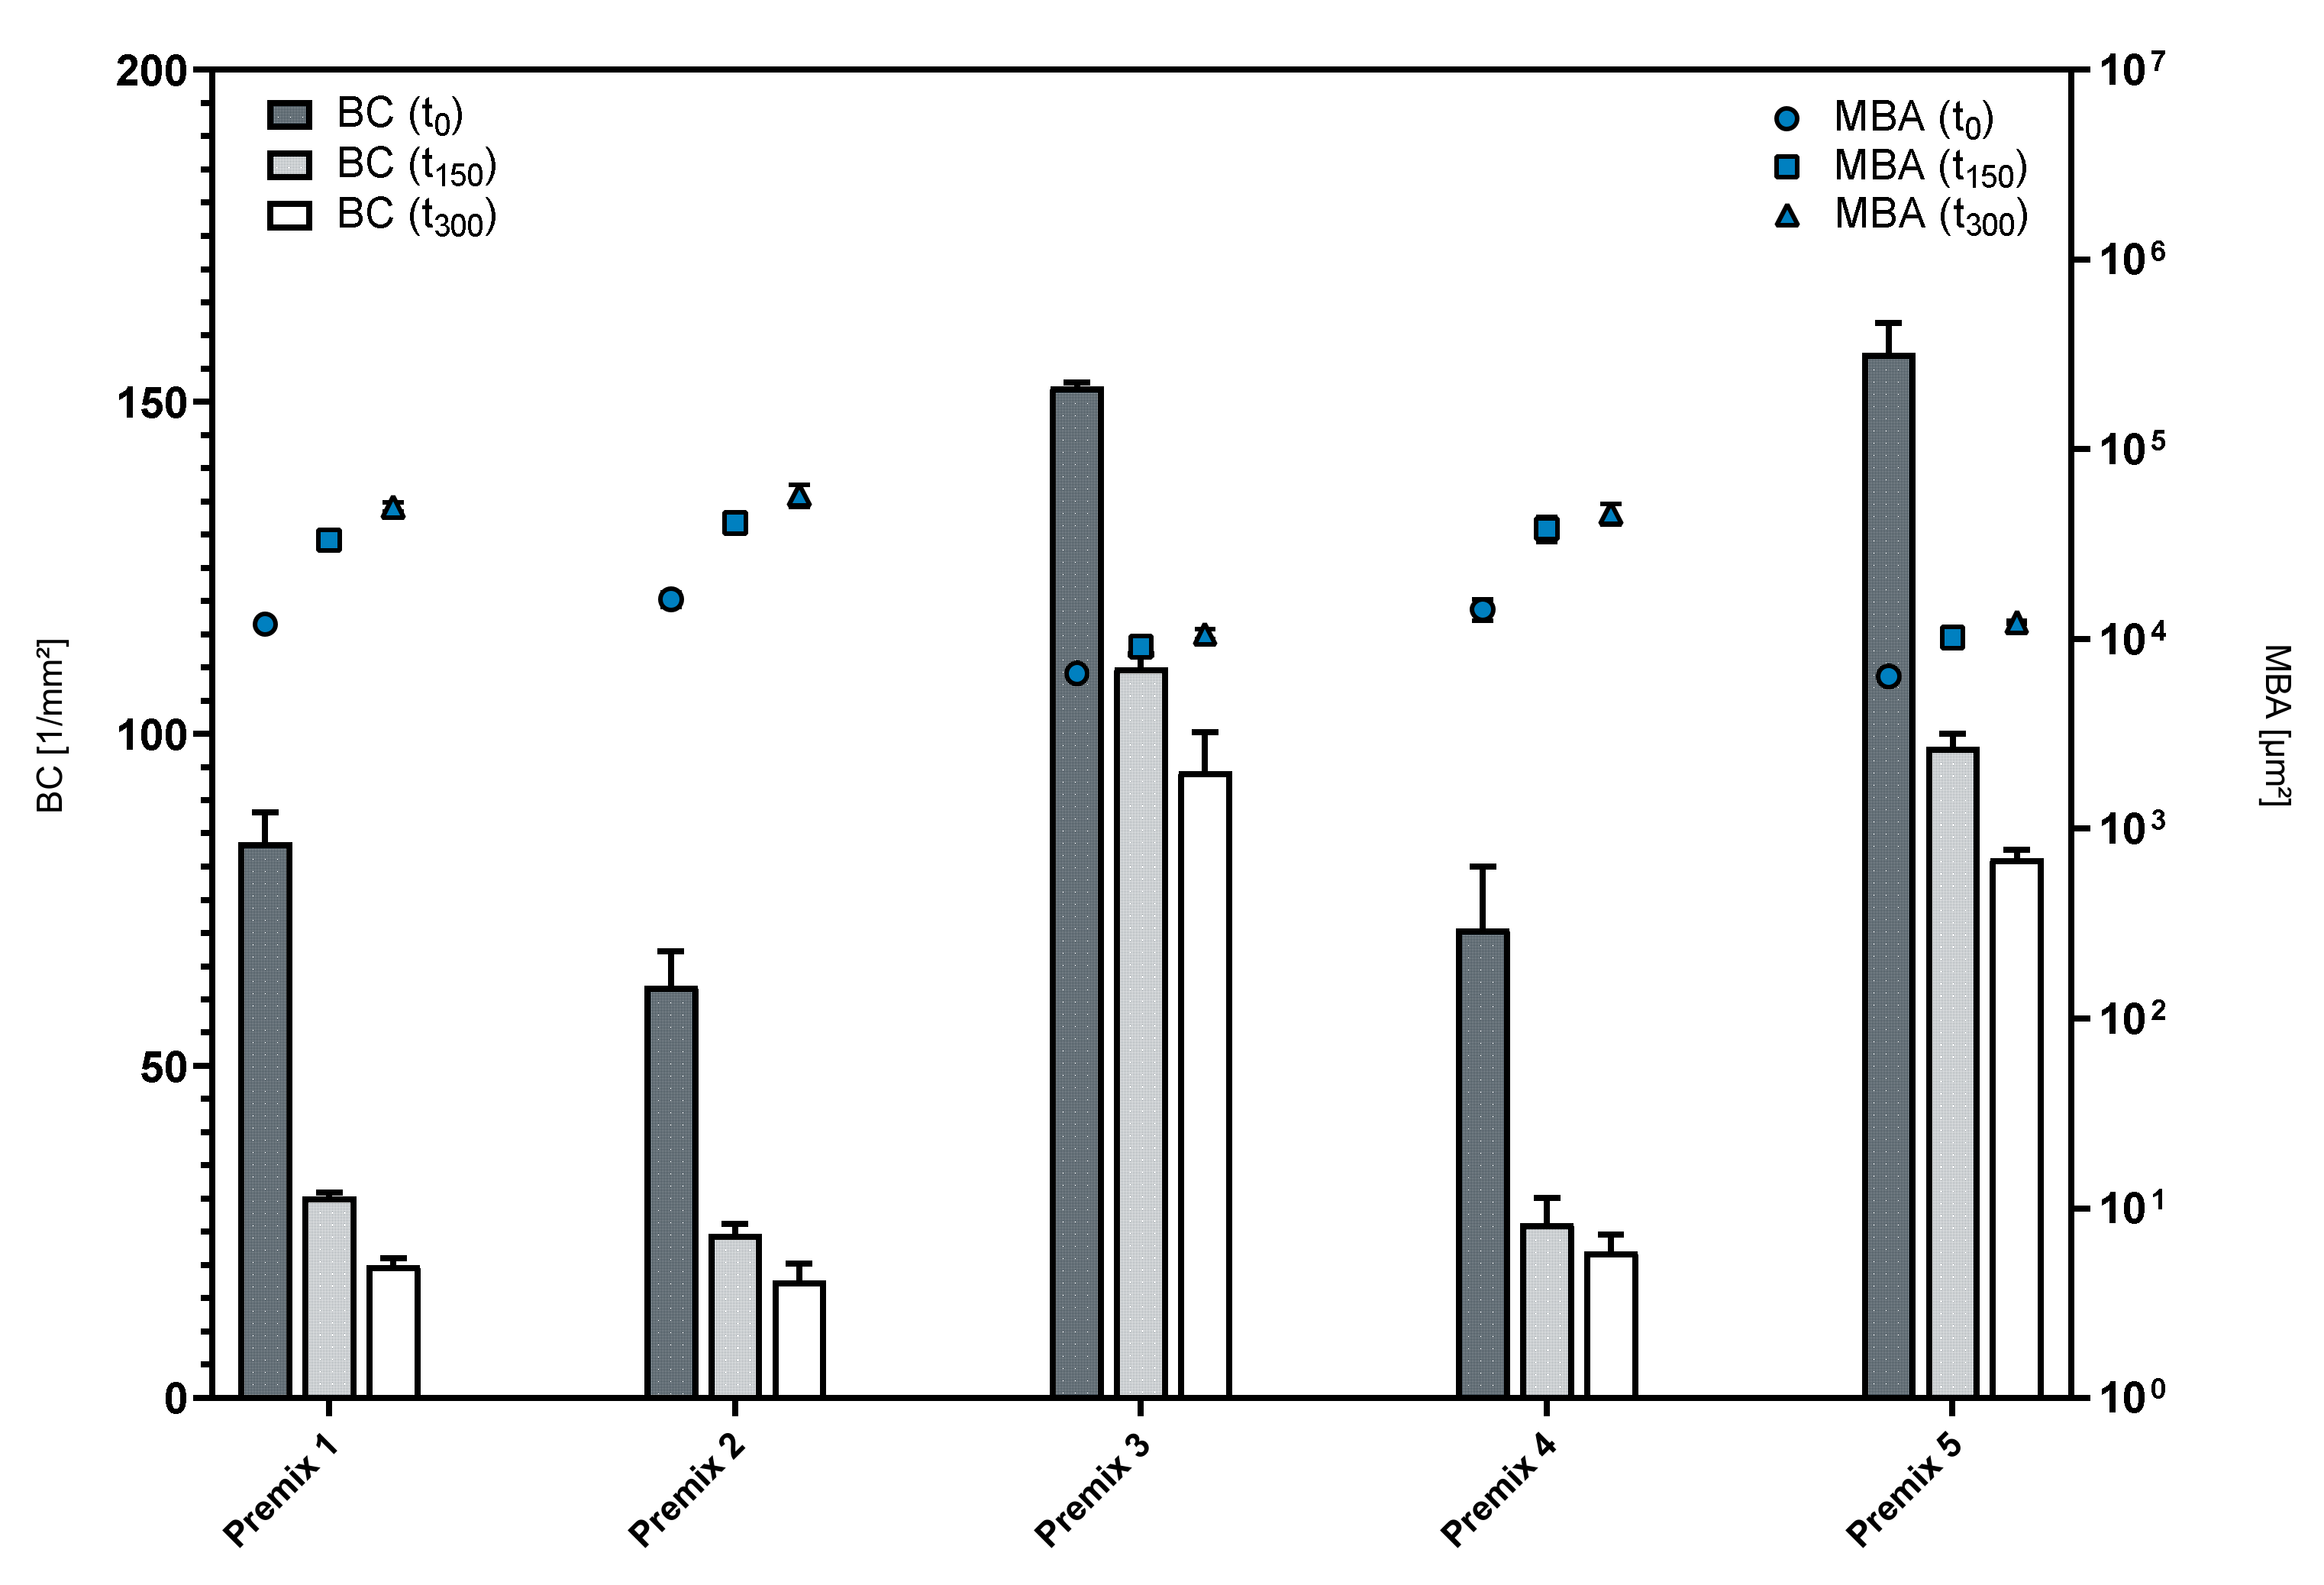
3.1. Influence of Phospholipid Premix Composition on Foaming Properties
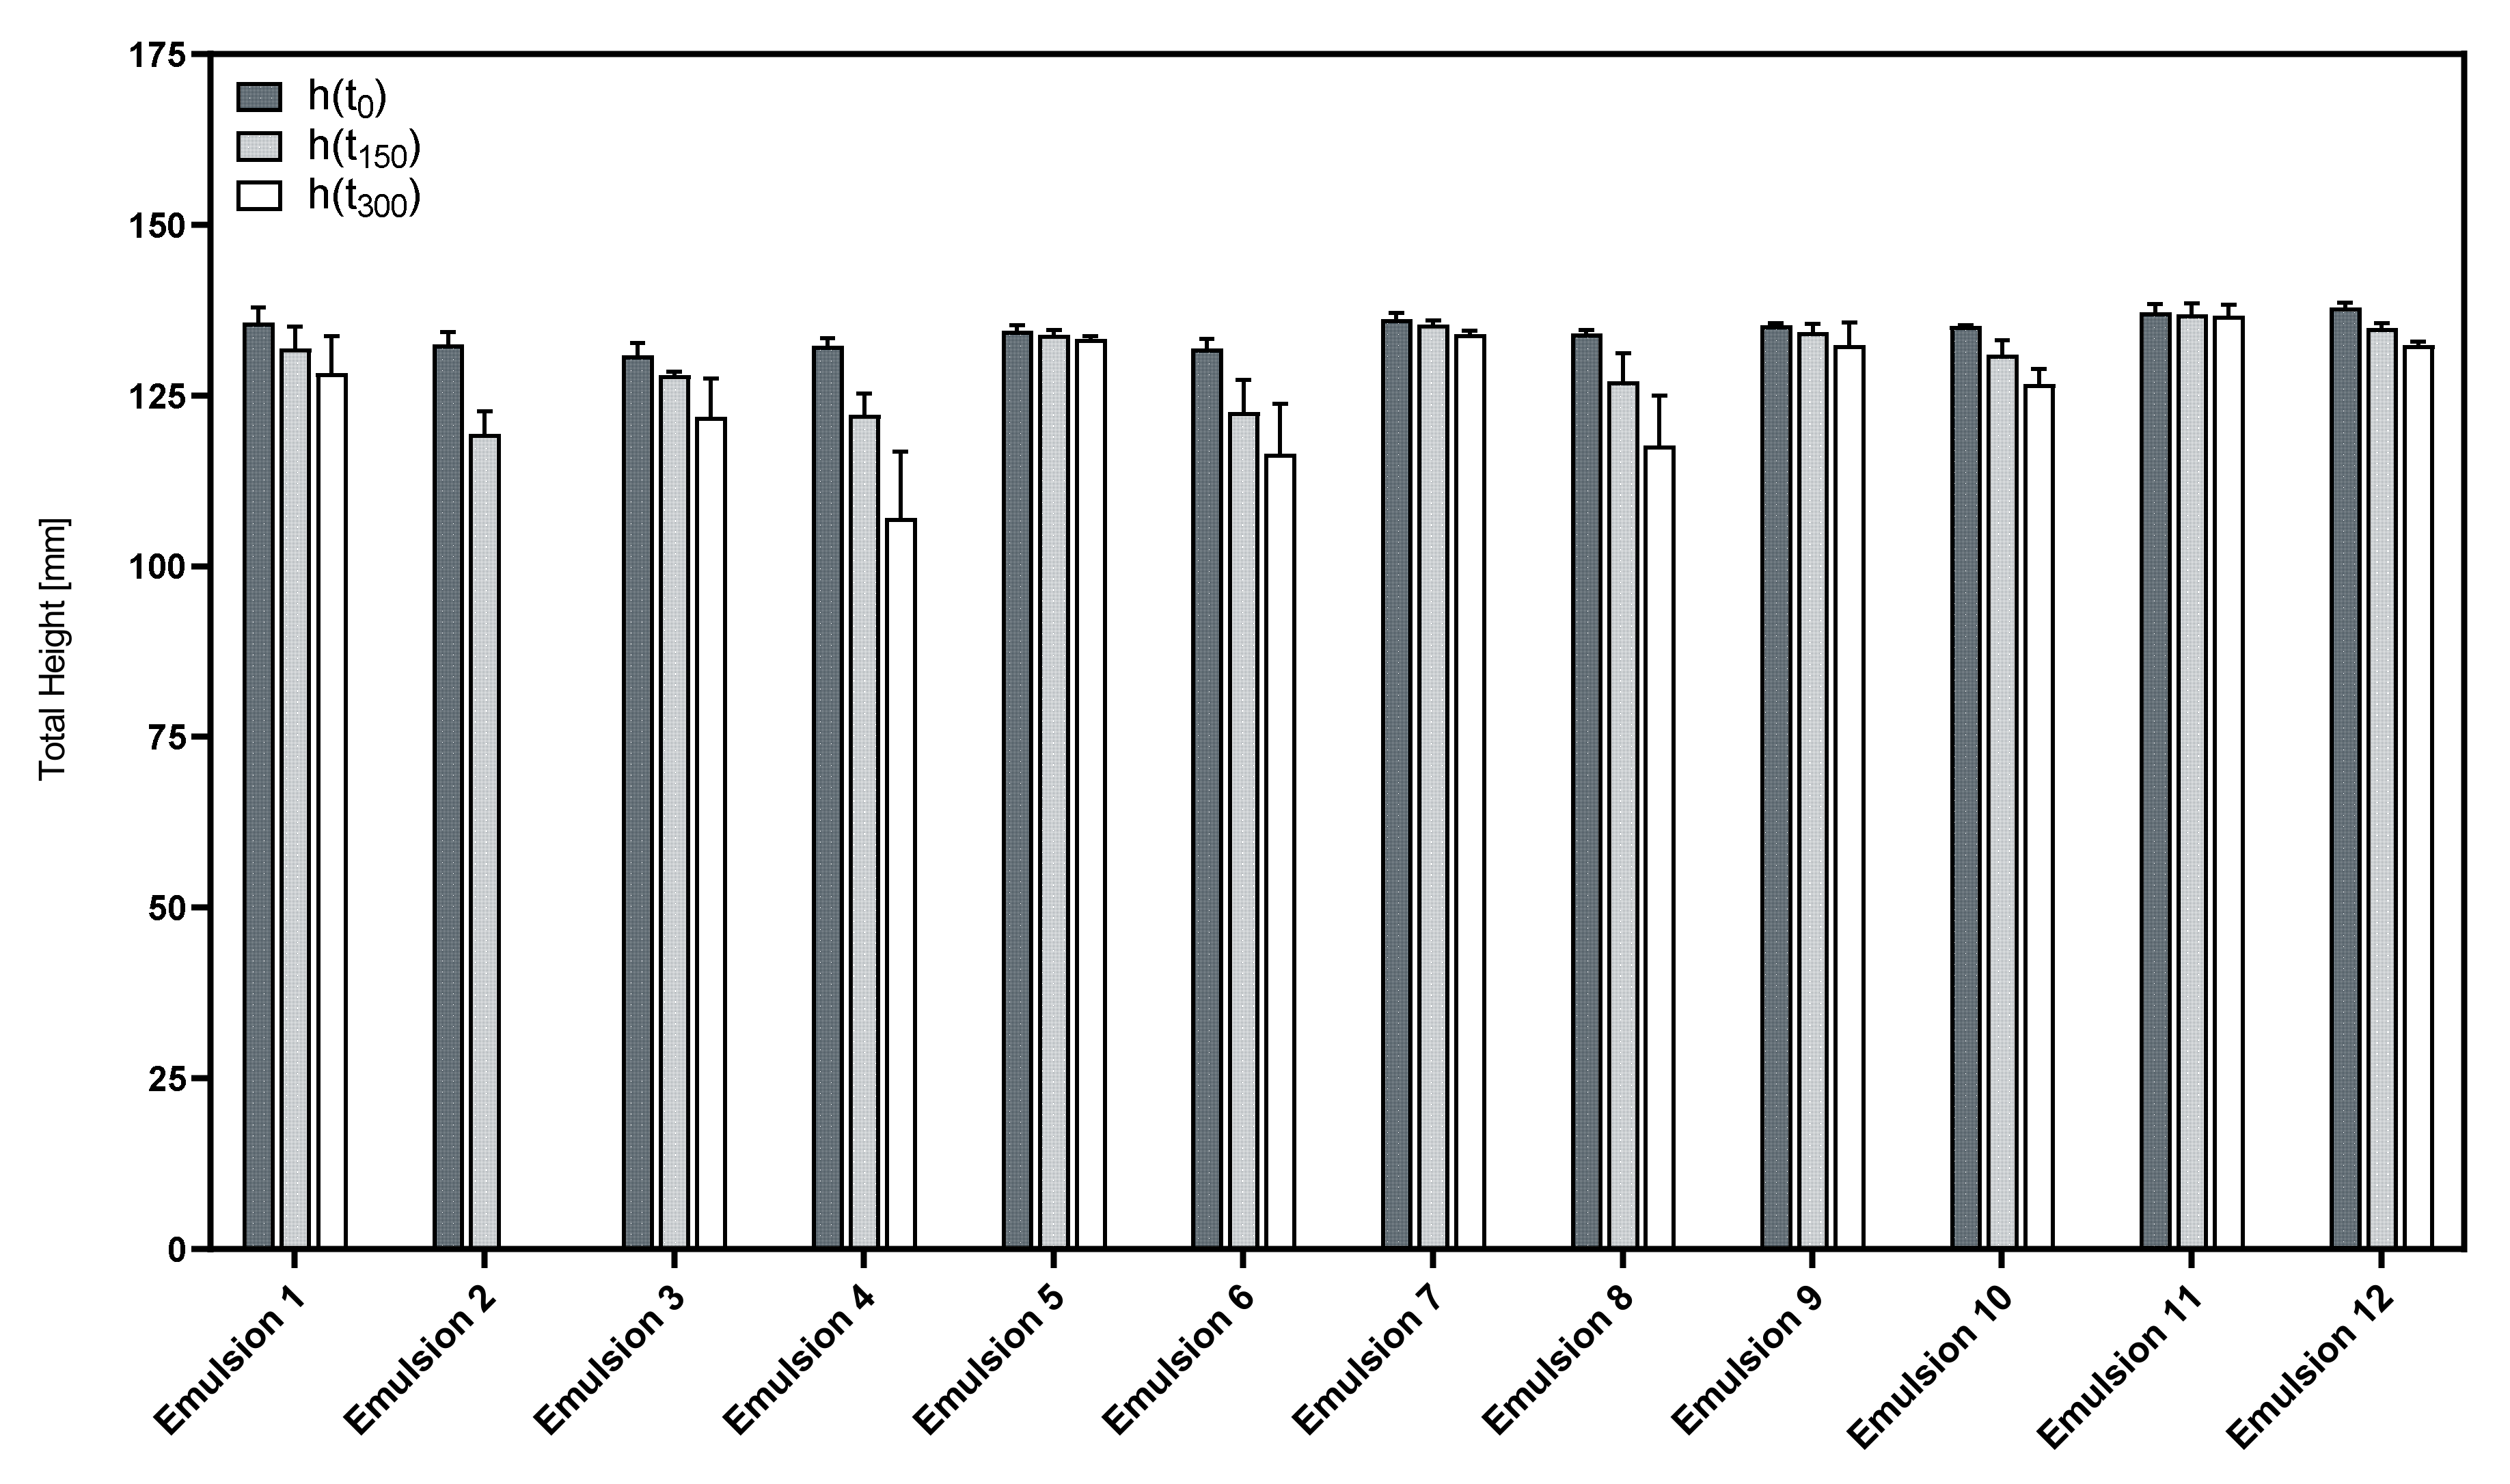
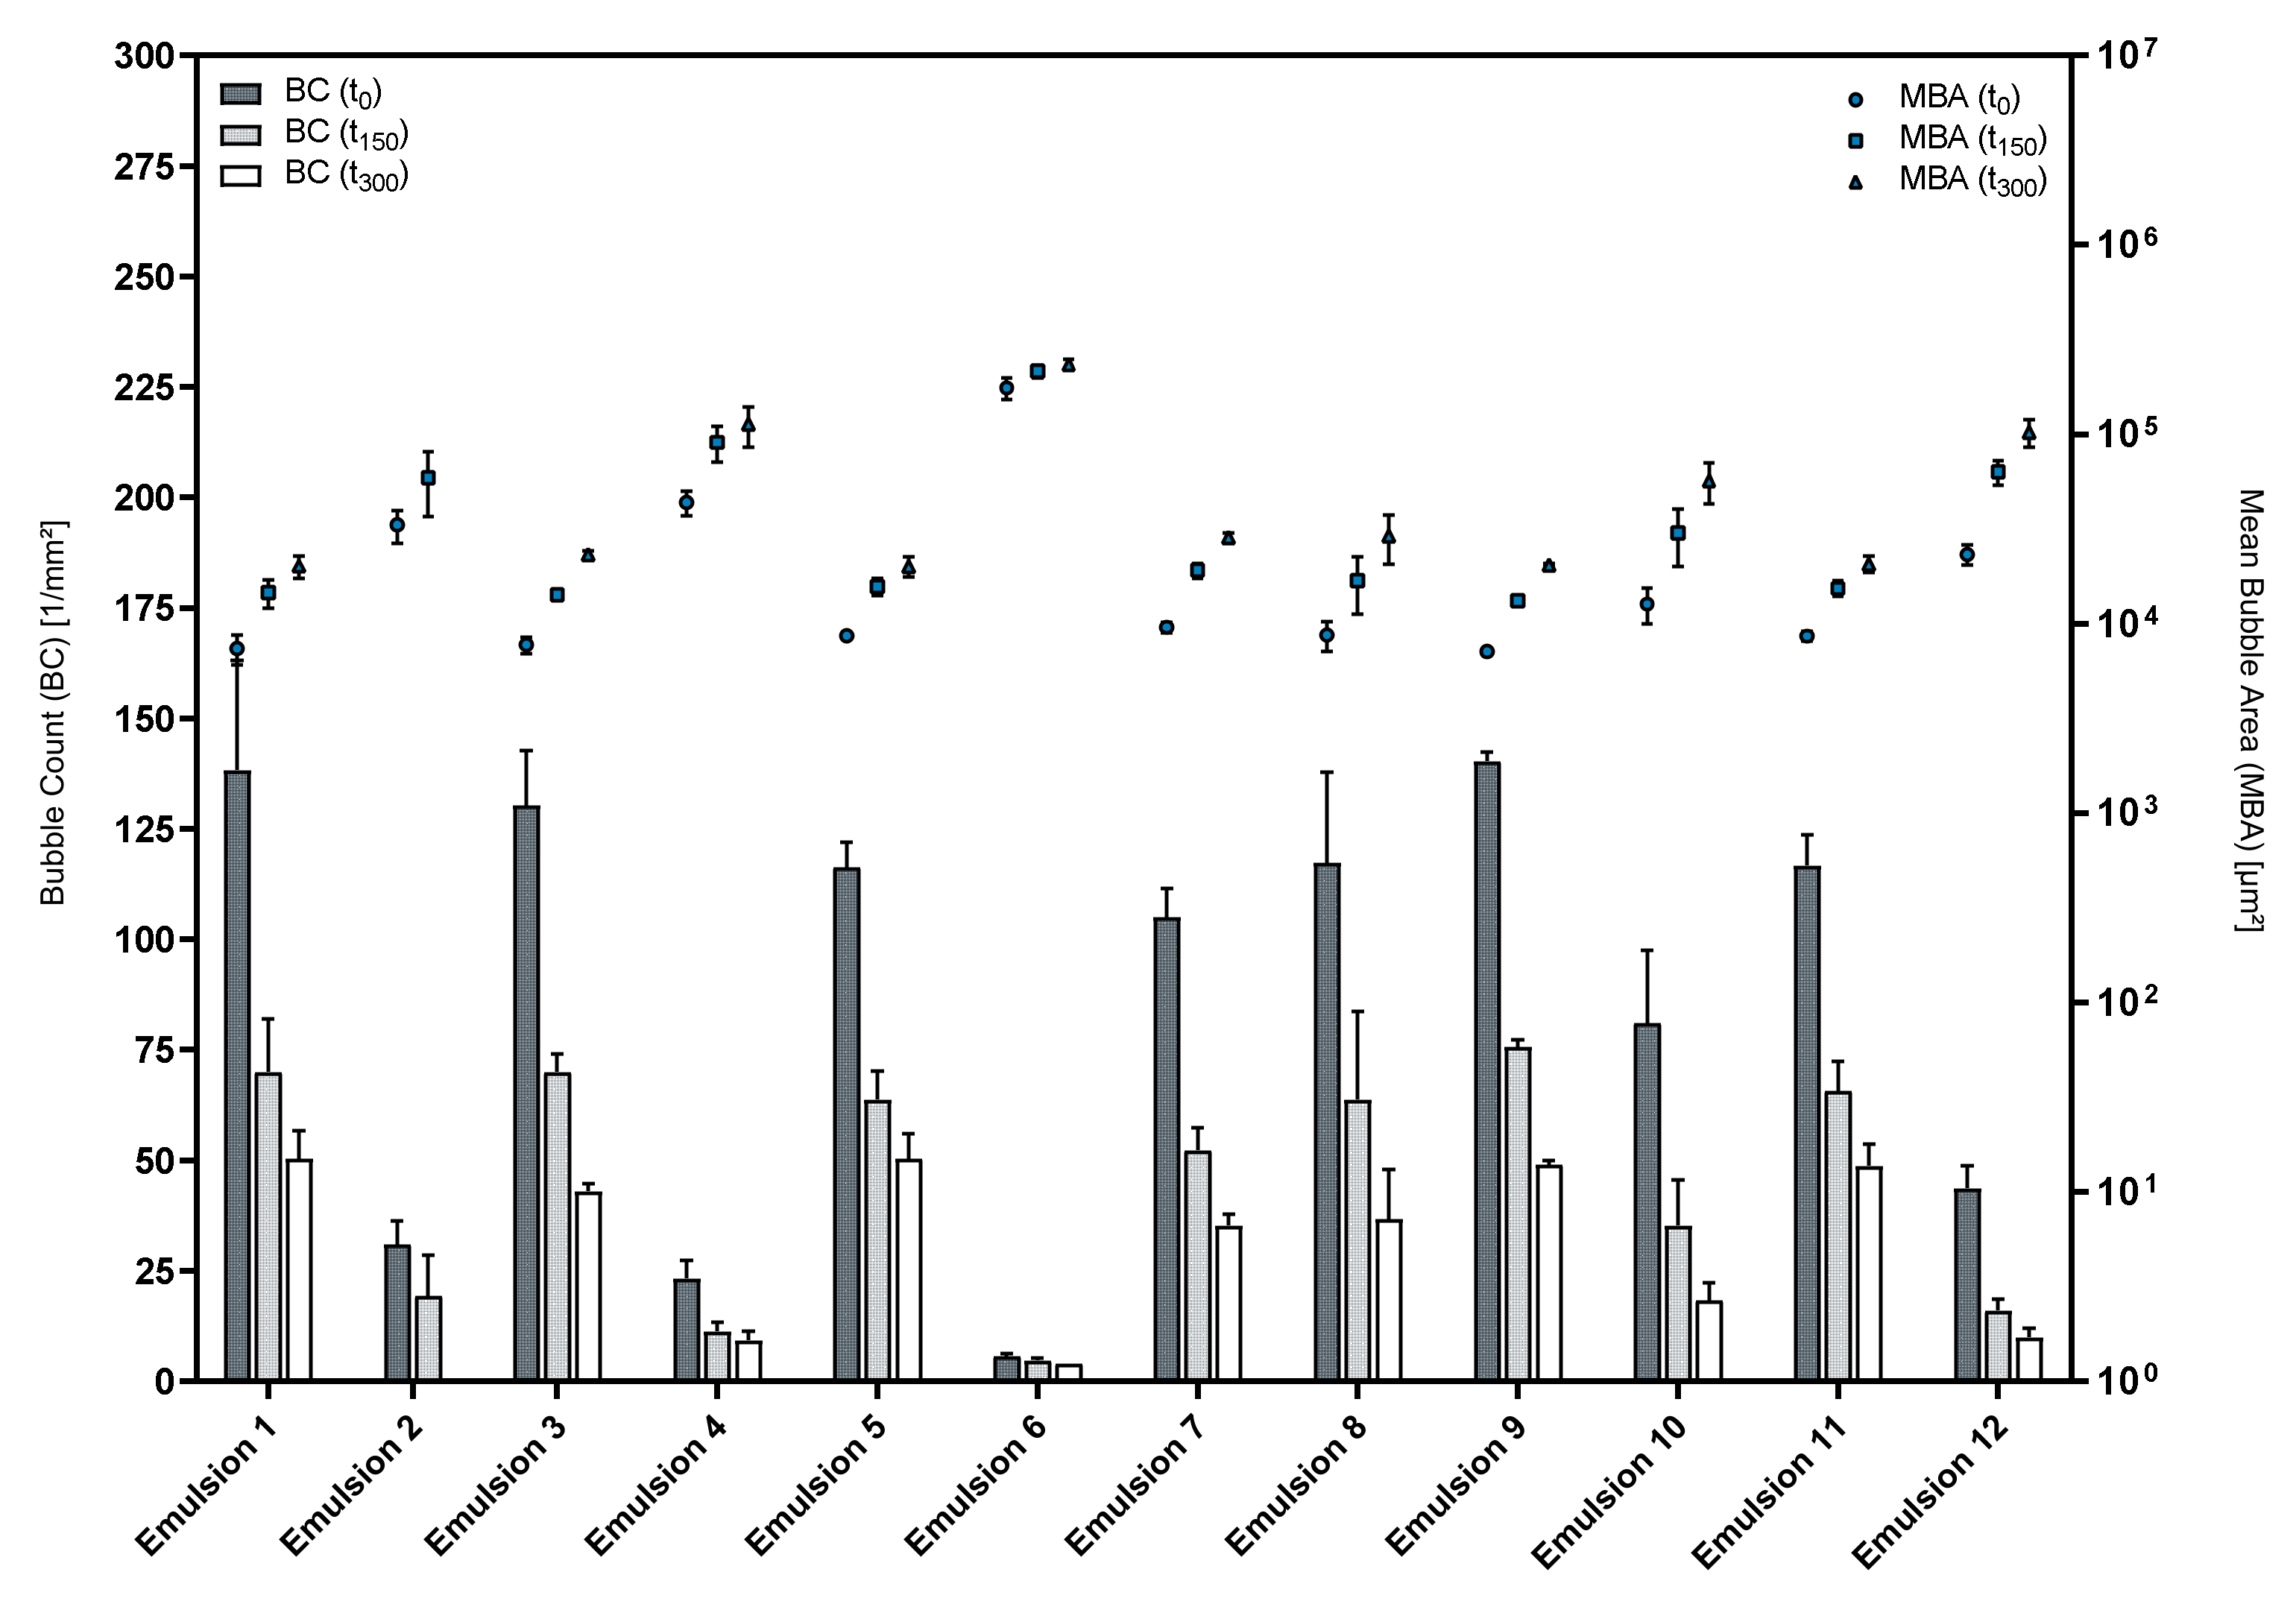
3.2. Foaming Behavior of Phospholipid Emulsions
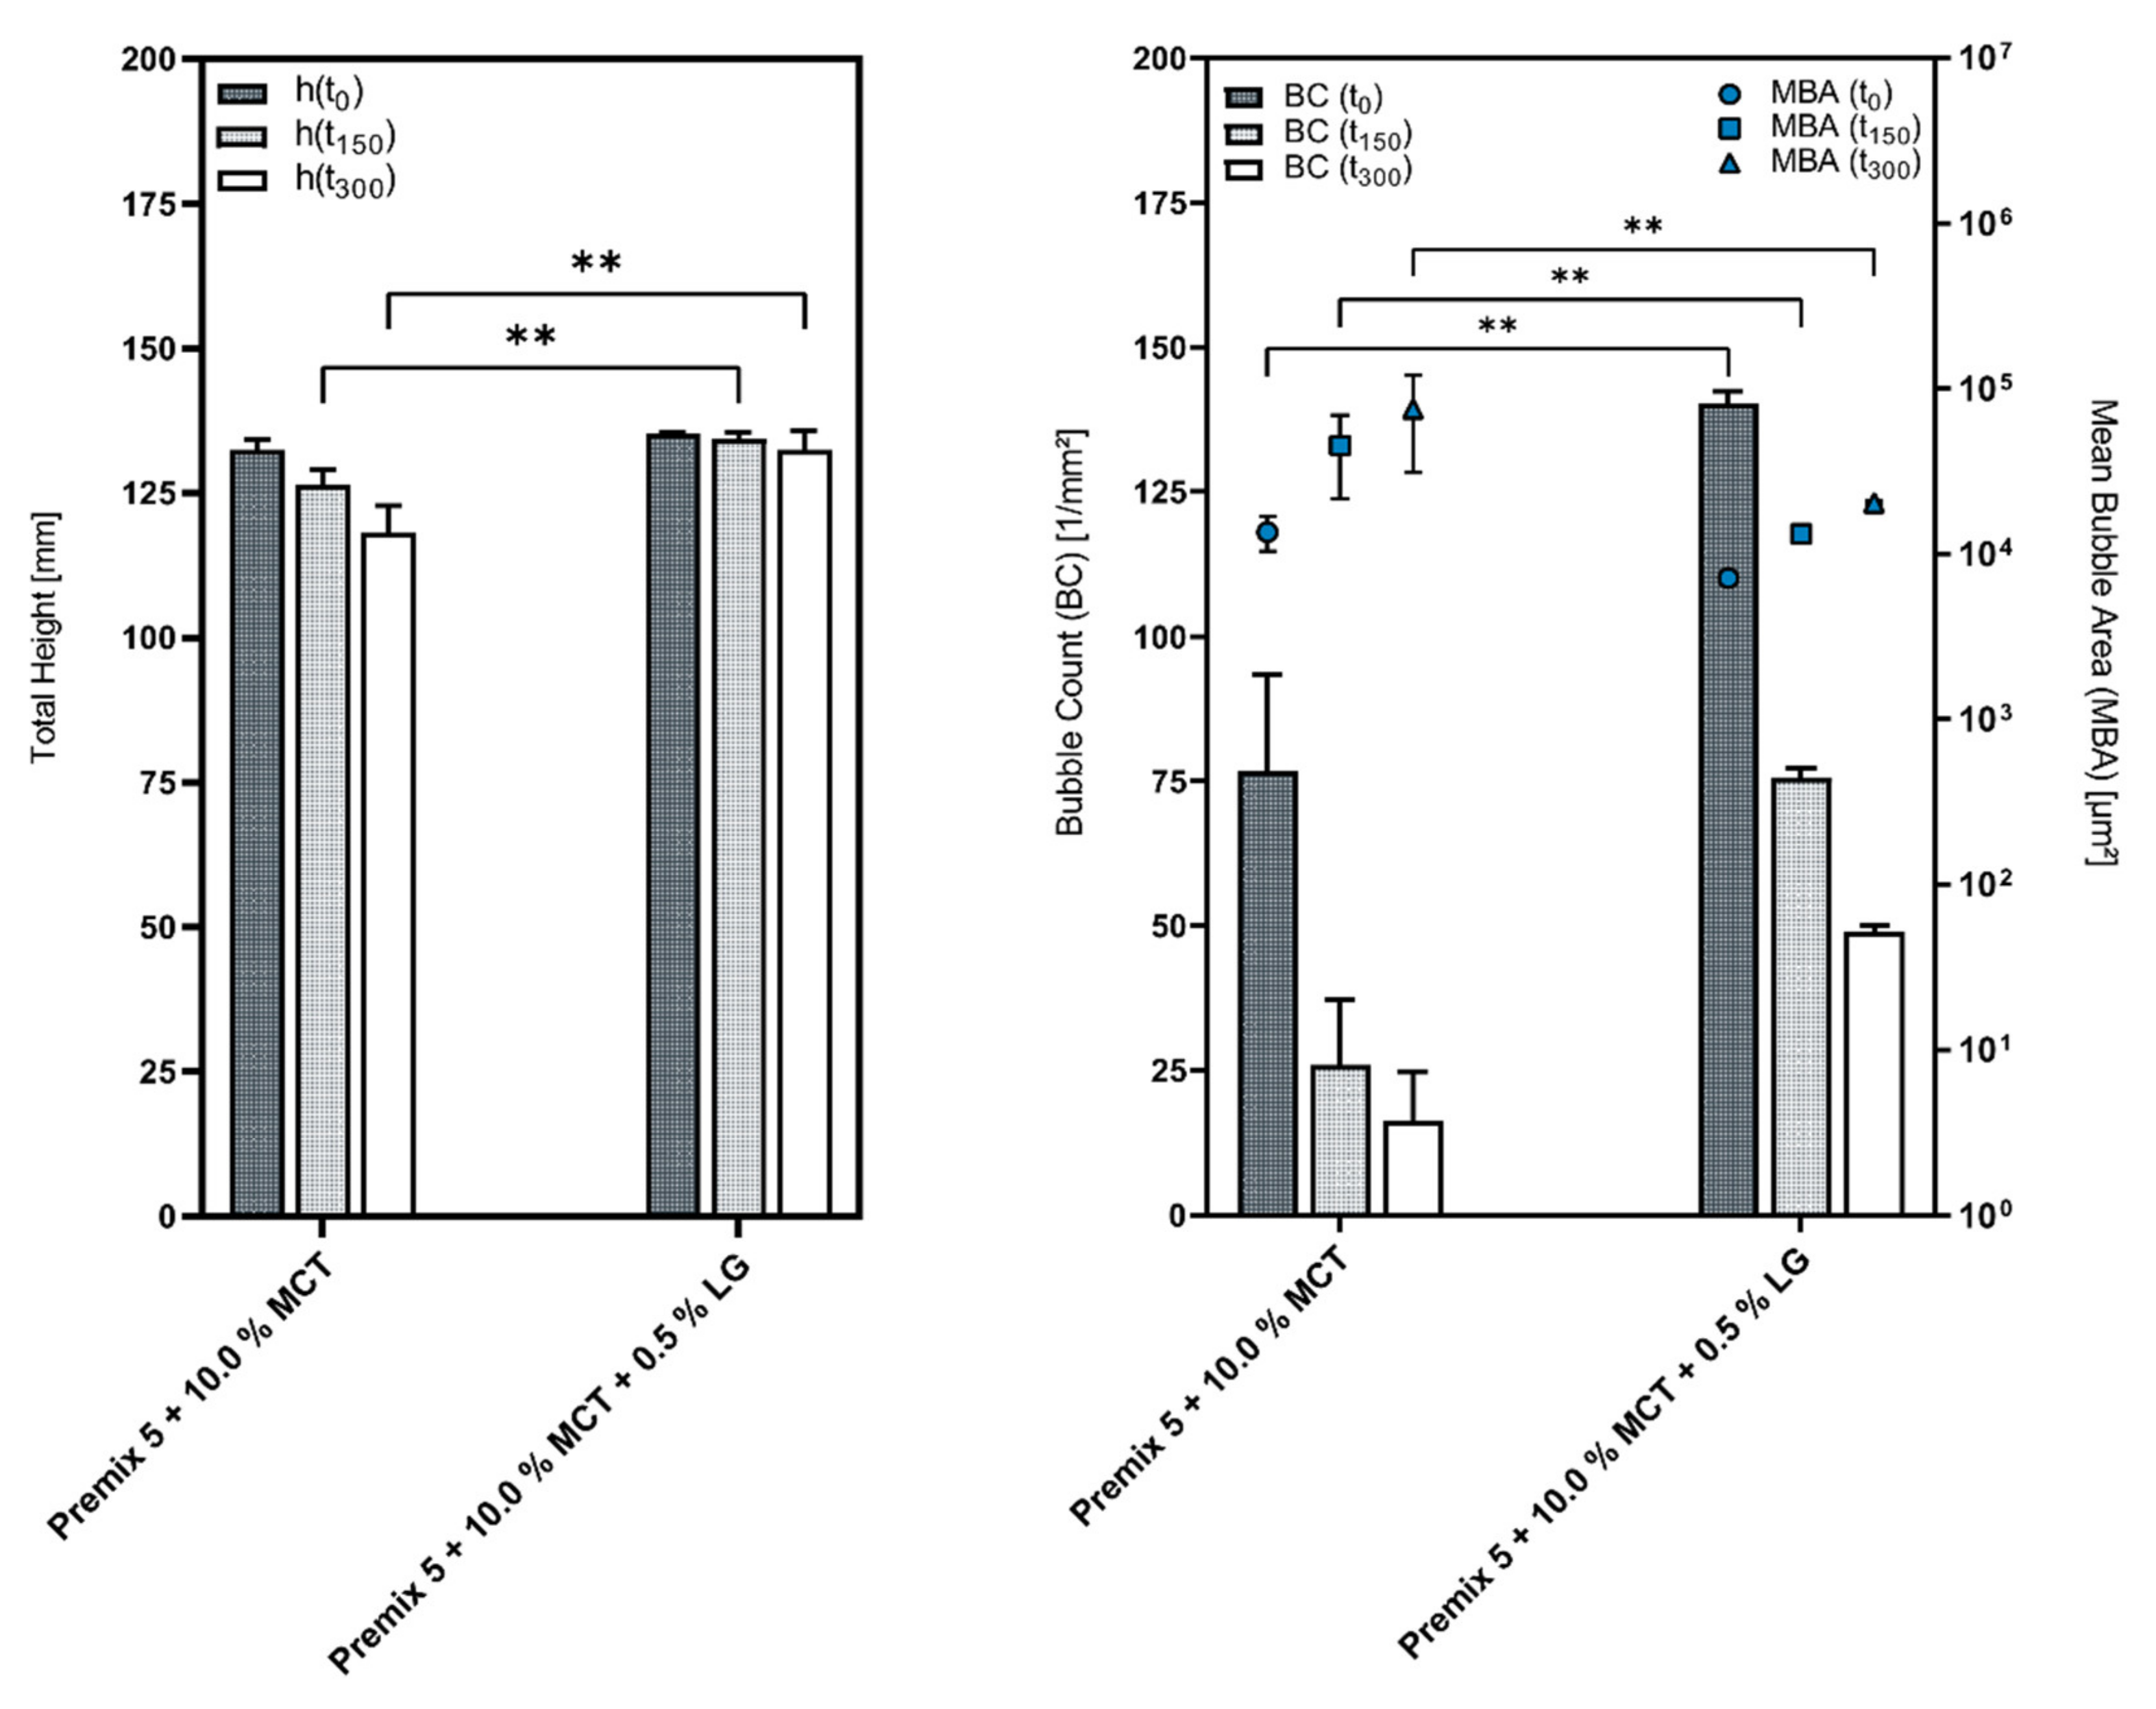
3.3. Influence of the Cosurfactants and Polarity of the Oil Phase on the Foaming Properties of Phospholipid Emulsions
Characterization of Liquid–Air Interface
- Γ—Surface concentration of a foaming agent (mol/m2);
- ɣ—Surface tension of the liquid (N/m);
- c—molar concentration of the foaming agent (mol/L);
- R—gas constant (J/mol*K);
- T—temperature (K).
4. Conclusions
Supplementary Materials
Author Contributions
Funding
Institutional Review Board Statement
Informed Consent Statement
Data Availability Statement
Acknowledgments
Conflicts of Interest
References
- Arzhavitina, A. Foams as Novel Delivery Vehicle for Topical Application. Ph.D. Thesis, Christian Albrecht University, Kiel, Germany, 2009. [Google Scholar]
- Zhao, Y.; Brown, M.B.; Jones, S.A. Pharmaceutical foams: Are they the answer to the dilemma of topical nanoparticles? Nanomedicine 2010, 6, 227–236. [Google Scholar] [CrossRef]
- Purdon, C.H.; Haigh, J.M.; Surber, C.; Smith, E.W. Foam Drug Delivery in Dermatology. Am. J. Drug Deliv. 2003, 1, 71–75. [Google Scholar] [CrossRef]
- Shinde, N. Pharmaceutical Foam Drug Delivery System: General Considerations. Indo Am. J. Pharm. Res. 2013, 3, 1322–1327. [Google Scholar]
- Gennari, C.G.M.; Selmin, F.; Minghetti, P.; Cilurzo, F. Medicated Foams and Film Forming Dosage Forms as Tools to Improve the Thermodynamic Activity of Drugs to be Administered through the Skin. Curr. Drug Deliv. 2019, 16, 461–471. [Google Scholar] [CrossRef]
- Hasanzadeh, H.; Nasrollahi, S.A.; Halavati, N.; Saberi, M.; Firooz, A. Efficacy and safety of 5% minoxidil topical foam in male pattern hair loss treatment and patient satisfaction. Acta Dermatovenerol. Alp. Pannonica Adriat. 2016, 25, 41–44. [Google Scholar] [CrossRef]
- Asama, M.; Hall, A.; Qi, Y.; Moreau, B.; Walthier, H.; Schaschwary, M.; Bristow, B.; Wang, Q. Alternative foaming agents for topical treatment of ulcerative colitis. J. Biomed. Mater. Res. A 2018, 106, 1448–1456. [Google Scholar] [CrossRef] [PubMed]
- Farkas, D.; Kállai-Szabó, N.; Antal, I. Foams as carrier systems for pharmaceuticals and cosmetics. APH 2019, 89, 5–15. [Google Scholar] [CrossRef]
- Drescher, S.; Van Hoogevest, P. The Phospholipid Research Center: Current Research in Phospholipids and Their Use in Drug Delivery 2020. Pharmaceutics 2020, 12, 1235. [Google Scholar] [CrossRef]
- Van Hoogevest, P.; Fahr, A. Phospholipids in Cosmetic Carriers. In Nanocosmetics; Springer: Berlin/Heidelberg, Germany, 2019; pp. 95–140. [Google Scholar]
- Johnson, W.; Bergfeld, W.F.; Belsito, D.V.; Hill, R.A.; Klaassen, C.D.; Liebler, D.C.; Marks, J.G.; Shank, R.C.; Slaga, T.J.; Snyder, P.W.; et al. Safety Assessment of Lecithin and Other Phosphoglycerides as Used in Cosmetics. Int. J. Toxicol. 2020, 39, 5S–25S. [Google Scholar] [CrossRef]
- Fiume, Z. Final Report on the Safety Assessment of Lecithin and Hydrogenated Lecithin. Int. J. Toxicol. 2000, 1, 21–45. [Google Scholar]
- Pichot, R.; Watson, R.L.; Norton, I.T. Phospholipids at the interface: Current trends and challenges. Int. J. Mol. Sci. 2013, 14, 11767–11794. [Google Scholar] [CrossRef] [Green Version]
- Heidecke, C.; Van Hoogevest, P.; Müller, A. Application of Monoacyl Phosphatidylcholine Products in Cosmetic Formulation Technology. In Proceedings of the 23. IFSCC Conference, Zurich, Switzerland, 21–23 September 2015. [Google Scholar]
- Cabezas, D.M.; Madoery, R.; Diehl, B.W.K.; Tomás, M.C. Emulsifying Properties of Different Modified Sunflower Lecithins. J. Am. Oil Chem. Soc. 2012, 89, 355–361. [Google Scholar] [CrossRef]
- Van Hoogevest, P.; Wendel, A. The use of natural and synthetic phospholipids as pharmaceutical excipients. Eur. J. Lipid Sci. Technol. 2014, 116, 1088–1107. [Google Scholar] [CrossRef] [Green Version]
- Cohen, R.; Exerowa, D.; Kolarov, T.; Yamanaka, T.; Tano, T. Foam Films Stabilized with Lysophosphatidylcholine-A comparison of microinterferometric and fourier transform infrared spectroscopy thickness measurements. Langmuir 1997, 12, 3172–3176. [Google Scholar] [CrossRef]
- Berry, J.D.; Neeson, M.J.; Dagastine, R.R.; Chan, D.Y.C.; Tabor, R.F. Measurement of surface and interfacial tension using pendant drop tensiometry. J. Colloid Interface Sci. 2015, 454, 226–237. [Google Scholar] [CrossRef]
- Arancibia, C.; Riquelme, N.; Zúñiga, R.; Matiacevich, S. Comparing the effectiveness of natural and synthetic emulsifiers on oxidative and physical stability of avocado oil-based nanoemulsions. Innov. Food Sci. Emerg. Technol. 2017, 44, 159–166. [Google Scholar] [CrossRef]
- Hildebrandt, E.; Nirschl, H.; Kok, R.J.; Leneweit, G. Adsorption of phospholipids at oil/water interfaces during emulsification is controlled by stress relaxation and diffusion. Soft Matter 2018, 14, 3730–3737. [Google Scholar] [CrossRef] [PubMed]
- Makievski, A.V.; Fainerman, V.B.; Miller, R.; Bree, M.; Liggieri, L.; Ravera, F. Determination of equilibrium surface tension values by extrapolation via long time approximations. Colloids Surf. A Physicochem. Eng. Asp. 1997, 122, 269–273. [Google Scholar] [CrossRef]
- Bhakata, A.; Ruckenstein, E. Decay of standing foams: Drainage, coalescence and collapse. Adv. Colloid Interface Sci. 1997, 70, 1–124. [Google Scholar] [CrossRef]
- Krüss, G. Schaumverhalten von Zahnpasten. AR279 2016. [Google Scholar]
- Fuller, N.; Rand, R.P. The Influence of Lysolipids on the Spontaneous Curvature and Bending Elasticity of Phospholipid Membranes. Biophys. J. 2001, 81, 243–254. [Google Scholar] [CrossRef] [Green Version]
- Abbott, S. Surfactant Science: Principles and Practice. Update 2019, 1, 2–26. [Google Scholar]
- Pugh, R.J. Foaming, foam films, antifoaming and defoaming. Adv. Colloid Interface Sci. 1996, 64, 67–142. [Google Scholar] [CrossRef]
- Stricker, H. Physikalische Pharmazie; Wissenschaftliche Verlagsgesellschaft: Stuttgart, Germany, 1987. [Google Scholar]
- Wilde, P.J. Interfaces: Their role in foam and emulsion behaviour. Curr. Opin. Colloid Interface Sci. 2000, 5, 176–181. [Google Scholar] [CrossRef]
- Denkov, N.; Tcholakova, S.; Politova-Brinkova, N. Physicochemical control of foam properties. Curr. Opin. Colloid Interface Sci. 2020, 50, 101376. [Google Scholar] [CrossRef]
- Lam, S.; Velikov, K.P.; Velev, O.D. Pickering stabilization of foams and emulsions with particles of biological origin. Curr. Opin. Colloid Interface Sci. 2014, 19, 490–500. [Google Scholar] [CrossRef]
- Changqui, S.; Aya, H.; Hiroshi, K.; Masaharu, U. Formation and characterization of phosphatidylethanolamine/lysophosphatidylcholine mixed vesicles. Biochim. Biophys. Acta (BBA) Biomembr. 1999, 1467, 16–26. [Google Scholar]
- Li, Z.; Harbottle, D.; Pensini, E.; Ngai, T.; Richtering, W.; Xu, Z. Fundamental Study of Emulsions Stabilized by Soft and Rigid Particles. Langmuir 2015, 31, 6282–6288. [Google Scholar] [CrossRef]
- Williams, J.M.; Gray, A.J.; Wilkerson, M.H. Emulsion stability and rigid foams from styrene or divinylbenzene water-in-oil emulsions. Langmuir 1989, 6, 437–444. [Google Scholar] [CrossRef]
- Parajuli, S.; Ureña-Benavides, E.E. Fundamental aspects of nanocellulose stabilized Pickering emulsions and foams. Adv. Colloid Interface Sci. 2022, 299, 102530. [Google Scholar] [CrossRef]


| Constituent | LPC20 | LPC90 | PL80H | PL90G |
|---|---|---|---|---|
| Phosphatidylcholine, hydrogenated (hPC) | 69.0% | 80.9% | ||
| Phosphatidylcholine (PC) | 2.8% | 96.1% | ||
| Lysophosphatidyl choline, hydrogenated (hLPC) | 18.0% | 2.0% | ||
| Lysophosphatidyl choline (LPC) | 89.3% | 1.1% |
| Formulation | LPC | hLPC | PC | hPC |
|---|---|---|---|---|
| Premix 1 | 0.50% LPC90 | - | 0.50% PL90G | - |
| Premix 2 | 0.75% LPC90 | - | - | 0.25% PL80H |
| Premix 3 | - | 0.1875% LPC20 | 0.0625% PL90G | - |
| Premix 4 | - | 0.50% LPC20 | - | 0.50% PL80H |
| Premix 5 | 0.125% LPC90 | 0.375% LPC20 | - | - |
| Formulation | BC(t150)/BC(t0) | BC(t300)/BC(t0) |
|---|---|---|
| Premix 1 | 36.25% | 23.90% |
| Premix 2 | 39.78% | 28.49% |
| Premix 3 | 72.21% | 61.93% |
| Premix 4 | 37.26% | 31.13% |
| Premix 5 | 62.29% | 51.69% |
| Formulation | PL1 | PL2 | Cosurfactant | Oil Phase |
|---|---|---|---|---|
| Premix 3 | 0.1875% LPC20 | 0.0625% PL90G | - | - |
| Emulsion 1 | 0.16875% LPC20 | 0.05625% PL90G | 0.45% LG | 10.0% PO |
| Emulsion 2 | 0.16875% LPC20 | 0.05625% PL90G | 0.45% LAPB | 10.0% PO |
| Emulsion 3 | 0.16875% LPC20 | 0.05625% PL90G | 0.45% LG | 10.0% MCT |
| Emulsion 4 | 0.16875% LPC20 | 0.05625% PL90G | 0.45% LAPB | 10.0% MCT |
| Emulsion 5 | 0.16875% LPC20 | 0.05625% PL90G | 0.45% LG | 10.0% CO |
| Emulsion 6 | 0.16875% LPC20 | 0.05625% PL90G | 0.45% LAPB | 10.0% CO |
| Premix 5 | 0.375% LPC20 | 0.125% LPC90 | - | - |
| Emulsion 7 | 0.3375% LPC20 | 0.1125% LPC90 | 0.45% LG | 10.0% PO |
| Emulsion 8 | 0.3375% LPC20 | 0.1125% LPC90 | 0.45% LAPB | 10.0% PO |
| Emulsion 9 | 0.3375% LPC20 | 0.1125% LPC90 | 0.45% LG | 10.0% MCT |
| Emulsion 10 | 0.3375% LPC20 | 0.1125% LPC90 | 0.45% LAPB | 10.0% MCT |
| Emulsion 11 | 0.3375% LPC20 | 0.1125% LPC90 | 0.45% LG | 10.0% CO |
| Emulsion 12 | 0.3375% LPC20 | 0.1125% LPC90 | 0.45% LAPB | 10.0% CO |
| Formulation | MBA(t0) | MBA(t150) | MBA(t300) | BC(t0) | BC(t150) | BC(t300) |
|---|---|---|---|---|---|---|
| Premix 3 | 6566.67 | 9125.00 | 10623.67 | 152.33 | 110.00 | 94.33 |
| Emulsion 1 | 7371.67 | 14565.00 | 20089.33 | 138.33 | 70.00 | 50.33 |
| Emulsion 3 | 7724.33 | 14242.67 | 23212.00 | 130.33 | 70.00 | 43.00 |
| Premix 5 | 6347.00 | 10190.00 | 12268.33 | 157.33 | 98.00 | 81.33 |
| Emulsion 9 | 7121.00 | 13203.00 | 20340.33 | 140.33 | 75.67 | 49.00 |
| Formulation | d10 (µm) | d50 (µm) | d90 (µm) |
|---|---|---|---|
| Premix 3 | |||
| Emulsion 1 | 0.498 | 2.628 | 9.204 |
| Emulsion 2 | 0.589 | 3.118 | 9.975 |
| Emulsion 3 | 0.337 | 1.832 | 6.315 |
| Emulsion 4 | 0.421 | 2.220 | 6.966 |
| Emulsion 5 | 1.197 | 21.661 | 56.973 |
| Emulsion 6 | 0.881 | 13.589 | 38.119 |
| Premix 5 | |||
| Emulsion 7 | 0.638 | 3.517 | 12.443 |
| Emulsion 8 | 0.562 | 2.870 | 9.807 |
| Emulsion 9 | 0.434 | 2.327 | 7.556 |
| Emulsion 10 | 0.405 | 2.214 | 7.341 |
| Emulsion 11 | 1.292 | 23.846 | 68.532 |
| Emulsion 12 | 1.206 | 23.016 | 59.856 |
Publisher’s Note: MDPI stays neutral with regard to jurisdictional claims in published maps and institutional affiliations. |
© 2022 by the authors. Licensee MDPI, Basel, Switzerland. This article is an open access article distributed under the terms and conditions of the Creative Commons Attribution (CC BY) license (https://creativecommons.org/licenses/by/4.0/).
Share and Cite
Bunk, M.; Daniels, R. Influence of Oil Polarity and Cosurfactants on the Foamability of Mono- and Diacylphosphatidylcholine Stabilized Emulsions. Pharmaceutics 2022, 14, 1212. https://doi.org/10.3390/pharmaceutics14061212
Bunk M, Daniels R. Influence of Oil Polarity and Cosurfactants on the Foamability of Mono- and Diacylphosphatidylcholine Stabilized Emulsions. Pharmaceutics. 2022; 14(6):1212. https://doi.org/10.3390/pharmaceutics14061212
Chicago/Turabian StyleBunk, Manuel, and Rolf Daniels. 2022. "Influence of Oil Polarity and Cosurfactants on the Foamability of Mono- and Diacylphosphatidylcholine Stabilized Emulsions" Pharmaceutics 14, no. 6: 1212. https://doi.org/10.3390/pharmaceutics14061212
APA StyleBunk, M., & Daniels, R. (2022). Influence of Oil Polarity and Cosurfactants on the Foamability of Mono- and Diacylphosphatidylcholine Stabilized Emulsions. Pharmaceutics, 14(6), 1212. https://doi.org/10.3390/pharmaceutics14061212