Abstract
MiRNA-targeted therapy is an active research field in precision cancer therapy. Studying the effect of miRNA expression changes on apoptosis is important for evaluating miRNA-targeted therapy and realizing personalized precision therapy for cancer patients. Here, a new fluorescent nanoprobe was designed for the simultaneous imaging of miRNA-21 and apoptotic protein caspase-3 in cancer cells by using gold nanoparticles as the core and polydopamine as the shell. Confocal imaging indicated that the nanoprobe could be successfully applied for in situ monitoring of miRNA regulation of apoptosis. This design strategy is critical for investigating the feasibility of miRNA-targeted therapy, screening new anti-cancer drugs targeting miRNA, and developing personalized treatment plans.
1. Introduction
Cancer is a devastating and highly fatal disease that leads to cancer diagnosis and treatment, inspiring many research fronts in the creation of various detection and therapy platforms. Precision medicine offers personalized and tailored treatment according to the patient’s genes (e.g., miRNA, mRNA, DNA), lifestyle (e.g., diet, smoking, drinking), and living environment [1]. Such personalized treatment can offer a high cure rate, fewer side effects, and increased treatment precision. The importance of personalized treatment has risen to the national strategic level, and miRNA-based targeted therapy is currently an active research field in precision cancer therapy.
MiRNAs are small and non-coding RNAs with a nucleotide sequence of 20–24 nt [2]. Abnormal expression of miRNAs is closely related to the occurrence and development of various cancers [3,4]. MiRNAs play significant roles in important processes, including cancer cell apoptosis, invasion, and metastasis, by regulating target genes. Studies have shown that apoptotic genes can be regulated to induce cell apoptosis by enhancing or inhibiting the expression of specific miRNAs. In this regard, miRNAs are candidates for achieving precise cancer therapy [5,6,7]. Apoptosis is autonomous cellular programmed death that can remove functionally impaired cells. Real-time monitoring of apoptosis is critical in drug efficacy and prognosis evaluation. Different miRNAs play distinctive roles as oncogenic factors or tumor suppressors in the human body [8,9,10,11,12,13]. For example, miRNA-21 is overexpressed as an oncogene in various cancers, including pancreatic cancer, ovarian cancer, lung cancer, and colorectal cancer; let-7 is a tumor suppressor gene down-regulated in the cancers described above [14]. Thus, it is necessary to understand the effects of changes in miRNA expression on apoptosis when studying miRNA-targeted precision cancer therapy.
Current methods for detecting intracellular miRNAs are mainly based on molecular biology techniques such as Northern blotting, microarray analysis, and the quantitative reverse transcription–polymerase chain reaction (qRT–PCR) [15,16]. Methods for the study of apoptosis include fluorescence microscopy, electron microscopy, immunohistochemical analysis, caspase-activity assays, and Western blotting (WB) [17,18,19,20,21]. Although these approaches are commonly applied to detect miRNA and apoptotic proteins, most require a process of cell lysis or fixing, which cannot accurately reflect the real-time changes in miRNA expression and apoptosis in living cells. In addition, these approaches also suffer from cumbersome and time-consuming experimental operations and require many specimens. Therefore, it is particularly essential to develop a real-time, in situ detection method for tracking intracellular miRNA and apoptosis and visualizing the effect of changes in miRNA expression on apoptosis.
Recently, fluorescent nanoprobes have been successfully applied for the detection of miRNA or apoptosis-related markers in living cells due to a great many advantages, including non-invasiveness, visual identification, and extremely small consumption [22,23,24,25,26,27,28,29,30,31,32,33]. However, the fluorescence imaging methods mostly realize the single detection of miRNA or apoptosis in living cells, which cannot in situ monitor the effect of miRNA expression changes on apoptosis.
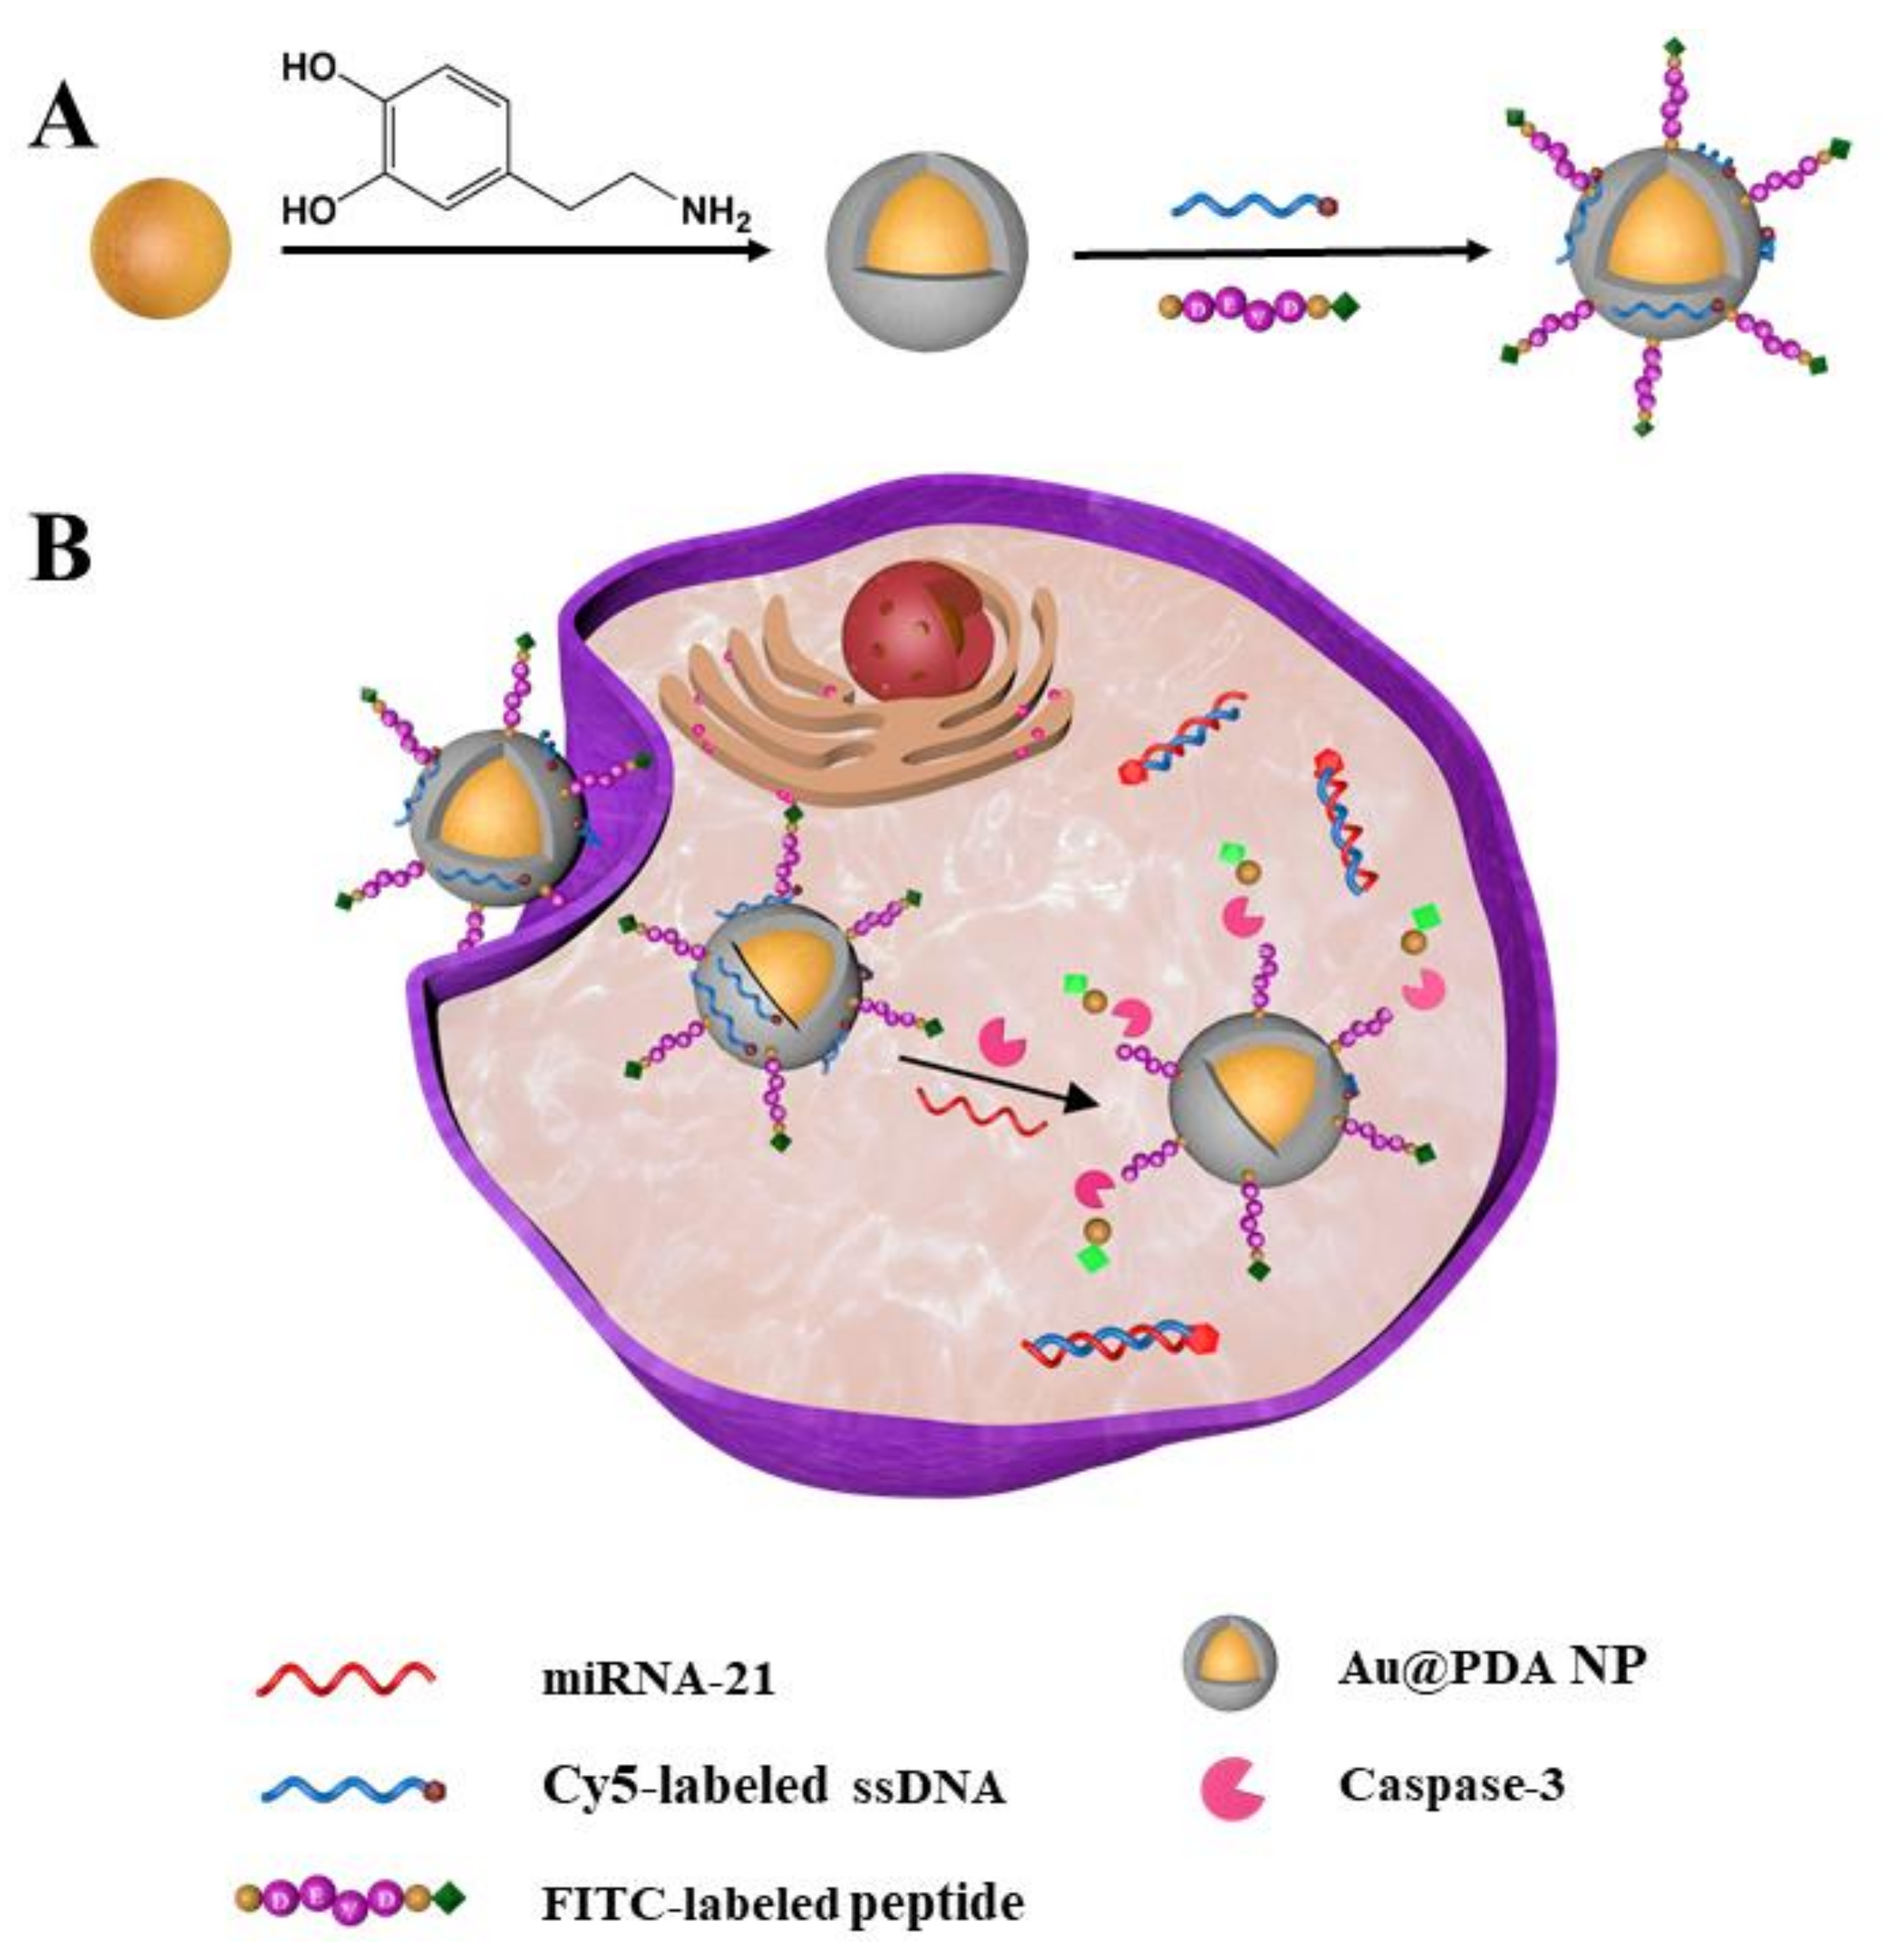
Here, we construct a new fluorescent nanoprobe for the simultaneous detection of miRNA-21 and caspase-3 in living cells and the in situ visualization of miRNA regulation of apoptosis. The nanoprobe possesses core–shell architecture, with gold nanoparticles (AuNPs) as a core and polydopamine (PDA) as a shell. Owing to the abundant catechol and amino groups on the PDA surface, the gold–PDA core–shell nanoparticles (Au@PDA NPs) were gradually functionalized with Cy5-labeled single-strand DNA (ssDNA) and FITC-labeled oligopeptide, step-by-step, via π-π and electrostatic interactions [34]. The resultant Au@PDA–ssDNA–peptide NPs (termed the nanoprobe) can specifically identify miRNA-21 and caspase-3 (Scheme 1A). According to a previous study, we hypothesized that the caveolae-mediated pathway mainly contributes to the endocytosis pathways of the nanoprobe. The nanoprobe can partly escape from endosomes/lysosomes into the cytoplasm [35,36]. There are many amino groups on the PDA shell; this may be responsible for allowing the nanoprobe to escape from endosomes/lysosomes into the cytoplasm by the proton sponge effect [37]. The ssDNA modified on the nanoprobe has a specific sequence that can recognize specific targets (miRNA-21). Additionally, the oligopeptide modified on the nanoprobe can be cleaved specifically by caspase-3. When the nanoprobe enters the cytoplasm, in the absence of targets, the AuNPs and PDA can effectively quench the fluorescence of the labeled dyes with ssDNA and oligopeptides [38,39]. The ssDNA will become double-stranded with the target chain and the oligopeptide will be cleaved by caspase-3 when the nanoprobe encounters the corresponding miRNA-21 and caspase-3 targets, thereby dissociating the fluorophores from the Au@PDA NPs and restoring the fluorescence (Scheme 1B). The designed nanoprobe can be used to visually monitor miRNA regulation of apoptosis in living cells.

Scheme 1.
(A) Preparation of the fluorescent nanoprobe. (B) Simultaneous detection of miRNA-21 and caspase-3 in living cells.
2. Materials and Methods
2.1. Preparation of Au@PDA NPs
AuNPs were synthesized according to methods reported previously [40]; 0.01% HAuCl4 aqueous solution was boiled, with stirring, and then 2 mL of 1% sodium citrate aqueous solution was rapidly added and stirred vigorously. After 15 min, the heating was stopped, and the reaction solution was allowed to cool to room temperature. The resulting AuNPs were stored at 4 °C for future use.
To coat the PDA shell with the AuNPs, 1 mg of dopamine hydrochloride was first dissolved in 8 mL of 10 mM Tris-HCl (pH 8.5), and 8 mL of 0.125 nM AuNP solution was rapidly stirred with the above dopamine solution for 1 h at room temperature. The resulting Au@PDA NPs were then purified via repeated centrifugation (13,000 rpm, 10 min), and the purified Au@PDA NPs were re-dispersed in ultrapure water for future use.
2.2. Fluorescence Quenching
Cy5-labeled ssDNA (150 nM) was added to various concentrations of Au@PDA NPs (10 mM HEPES, 5 mM CaCl2, pH 7.4) to obtain ssDNA-modified Au@PDA NPs (Au@PDA–ssDNA NPs). The fluorescence intensity of Cy5 at 667 nm was recorded under an excitation wavelength at 648 nm to determine the optimal amount of Au@PDA NPs. FITC-labeled oligopeptide (250 nM) was added to different concentrations of Au@PDA-ssDNA NP solutions (10 mM HEPES, 5 mM CaCl2, pH 7.4) to obtain peptide-modified Au@PDA–ssDNA NPs (Au@PDA–ssDNA–peptide NPs). The fluorescence intensity of FITC at 520 nm was collected at 480 nm excitation to determine the optimal amount of Au@PDA–ssDNA NPs. The experiments were repeated three times.
2.3. Preparation of Fluorescent Nanoprobe
The ssDNA21 solution (150 nM 10 mM HEPES, pH 7.4) was first added to the AuNP@PDA NP solution (5 nM) and incubated for 3 h at room temperature. Then, the oligopeptide solution (250 nM) was added to the above solution, followed by continuous incubation for 3 h. The resulting mixture was centrifuged and purified before dispersing it in a 10 mM HEPES buffer solution (5 mM CaCl2, pH 7.4) to obtain the nanoprobe modified with ssDNA and oligopeptide.
2.4. Fluorescence Response of the Nanoprobe
In order to detect miRNA-21, different concentrations of the perfectly matched miRNA-21 target strands (0, 10, 20, 30, 40, 50, 75, 125, 250, 750, and 1500 nM) were added to the nanoprobe solution (5 nM) and incubated for 1 h at 37 °C. The fluorescence intensity of Cy5-labeled ssDNA was collected with λex/λem = 648 nm/667 nm. For caspase-3 detection, various concentrations of caspase-3 (0, 1, 2, 3, and 4 units) were added to the nanoprobe solution (5 nM) and incubated for 4 h at 37 °C. The fluorescence intensity of FITC was recorded at λex/λem = 480 nm/520 nm. The experiments were repeated three times.
2.5. Kinetics
The fully matched miRNA-21 target strands (1000 nM) were added to the nanoprobe solution (5 nM) and incubated with increasing time (0, 5, 10, 15, 20, 30, 40, 50, 60 min) at 37 °C. The recombinant caspase-3 (4 units) was added to the nanoprobe solution (5 nM) and incubated at different times (0, 0.5, 1, 2, 3, 4 h). The fluorescence intensity of Cy5-labeled ssDNA was collected at λex/λem = 648 nm/667 nm, and the fluorescence intensity of FITC-labeled oligopeptide was recorded at λex/λem = 480 nm/520 nm. The experiments were repeated three times.
2.6. Specificity Experiments
To investigate the specificity of the nanoprobe toward miRNA-21, perfectly complementary miRNA-21 targets and other targets were examined. The concentration for each was 500 nM.
After incubating with the nanoprobe (5 nM) for 1 h at 37 °C, the fluorescence of Cy5 was excited at 648 nm and recorded at 667 nm. To detect the specificity of the nanoprobe toward caspase-3, caspase-3 (4 units), and other interfering substances, including hemoglobin (HGB, 4 μg/mL), bovine serum albumin (BSA, 4 μg/mL), glutathione (GSH, 1 mM), glucose (Glu, 20 mM), CaCl2 (2 mM), and NaCl (100 mM), were examined. The fluorescence intensity of FITC was excited at 480 nm and recorded at 520 nm after incubation for 4 h at 37 °C. All experiments were repeated three times.
2.7. MTT Assay
To evaluate biological toxicity of the nanoprobe, a tetrazolium-based colorimetric MTT assay was performed. A549 and Hela cells were seeded into 96-well microtiter plates (1 × 10⁶ cells/well), respectively. The culture was kept in a 5% CO2/95% air incubator at 37 °C for 24 h. Then the initial medium was removed, and the cells were cultured with different concentrations of Au@PDA and Au@PDA–ssDNA–peptide (1, 2, 4, 5, 8 nM) for 24 h, respectively. The MTT solution (5 mg/mL in PBS, 10 μL) was added to each well and further incubated for 4 h. After discarding the remaining MTT solution, 150 μL DMSO was added to dissolve the purple formazan. The absorbance at 490 nm was recorded with a Multiskan FC. The experiments were repeated three times.
2.8. Fluorescence Confocal Imaging
In the experiments for imaging miRNA-21 and caspase-3 in living cells treated with different drugs, Hela and A549 cells were chosen and divided into three groups in parallel. One group was treated with lipopolysaccharide (LPS, 10 μg/mL) for 12 h, and another group was treated with staurosporine (STS, 0.1 μM) for 12 h. The untreated group served as the control. After three groups of cells were incubated with the nanoprobe (5 nM) for 4 h, confocal laser scanning microscopy (CLSM) was performed. Red channels (miRNA-21) and green channels (caspase-3) were excited at 633 and 488 nm, and the fluorescence intensities were collected between 660–700 and 500–600 nm, respectively.
In the experiments for visualizing miRNA regulation of apoptosis in cells treated with transfection reagents, Hela and A549 cells were seeded in three confocal dishes to achieve a cell density of 30–50% at the time of transfection, respectively. One group of cells was transfected with miRNA-21 mimics (100 pmol) and another group of cells was transfected with miRNA-21 inhibitors (500 pmol) for 48 h according to the manufacturer’s instructions. The group of cells without transfection served as the control. The three groups of cells were cultured with the fluorescent nanoprobe (5 nM) for 4 h and then monitored by CLSM after washing the cells with PBS.
3. Results and Discussion
3.1. Preparation and Characterization of the Nanoprobe
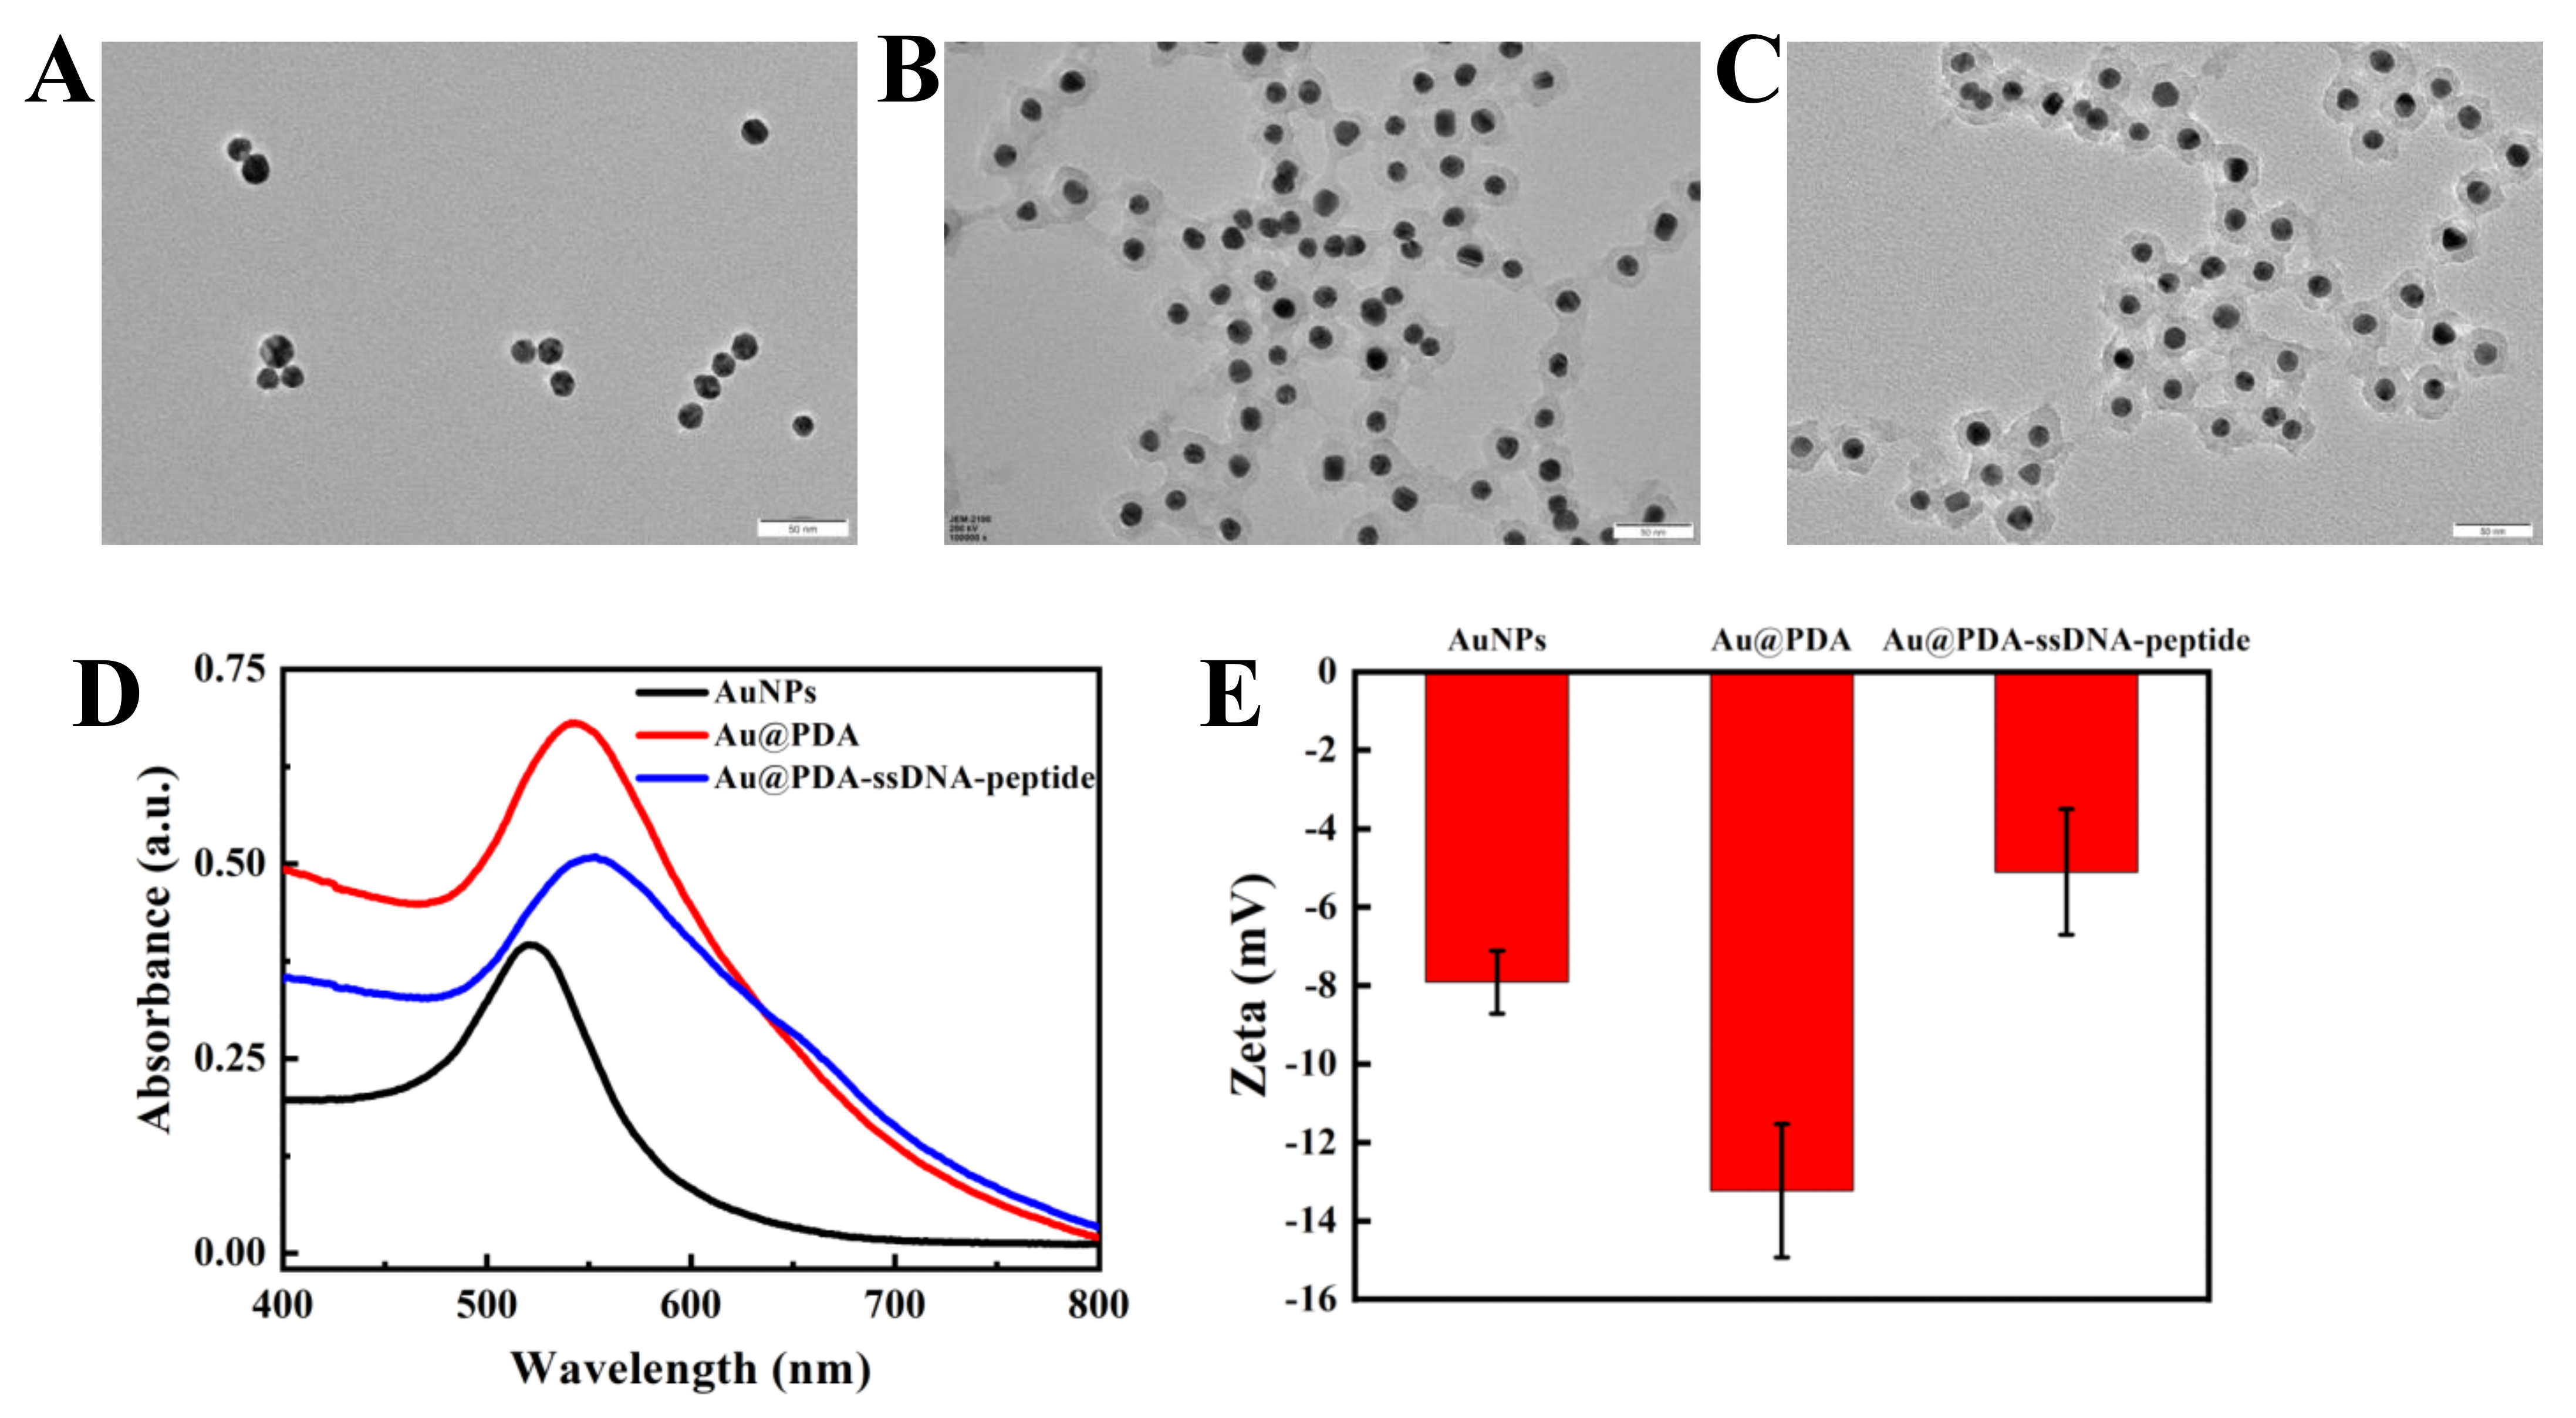
We first synthesized AuNPs as the core of the fluorescent nanoprobe and then coated the PDA shell on the surface of the AuNPs through the in situ polymerization of dopamine. Transmission electron microscopy (TEM) results showed that the AuNPs had good morphology, dispersibility, and uniform size (18 ± 3 nm; Figure 1A). The thickness of the coated PDA shell was 10 ± 2 nm. The size of the Au@PDA NPs was approximately 32 ± 3 nm (Figure 1B). When ssDNA and oligopeptide were used to modify the Au@PDA NPs, the particle diameter increased slightly to about 35 ± 3 nm (Figure 1C). In addition, ultraviolet-visible absorption spectroscopy (UV–vis) analysis results showed that the maximum absorption peak shifted from 530 to 540 nm after PDA shell coating on the AuNPs. Additionally, the absorption peak further red-shifted slightly after ssDNA and oligopeptide modifications of the Au@PDA NPs (Figure 1D). There are several reasons that cause this phenomenon. The increased particle size of the nanoprobe is an important reason. Moreover, the maximum peak is red-shifted due to the higher amount of amino groups on the PDA and carboxyl groups on the oligopeptide, which increases the polarity of the solution [41]. Thus, this indicates that the PDA was successfully coated on the surface of the AuNPs. Dynamic light scattering (DLS) measurements indicate that the diameter of the Au@PDA NPs was mostly 32.7 ± 5 nm (Figure S1), which is consistent with the TEM data. The diameter of a few nanoprobes ranged from 30–90 nm; we suspect that the nanoprobe had unevenly dispersed in the solution and aggregated. The modification of the nanoprobe was further confirmed by zeta potential analysis. Figure 1E showed that the potential of AuNPs was −7.9 mV; the potential decreased to −13.2 mV after PDA coating. When ssDNA and oligopeptide were used to modify the Au@PDA NPs, the potential increased to −5.1 mV. These results confirm that the fluorescent nanoprobe was successfully prepared.

Figure 1.
TEM images of AuNPs (A), Au@PDA NPs (B), and Au@PDA–ssDNA–peptide NPs (C). (Scale bar is 50 nm) UV–vis spectra (D) and zeta potential characterization (E) of AuNPs, Au@PDA NPs, and Au@PDA–ssDNA–peptide NPs.
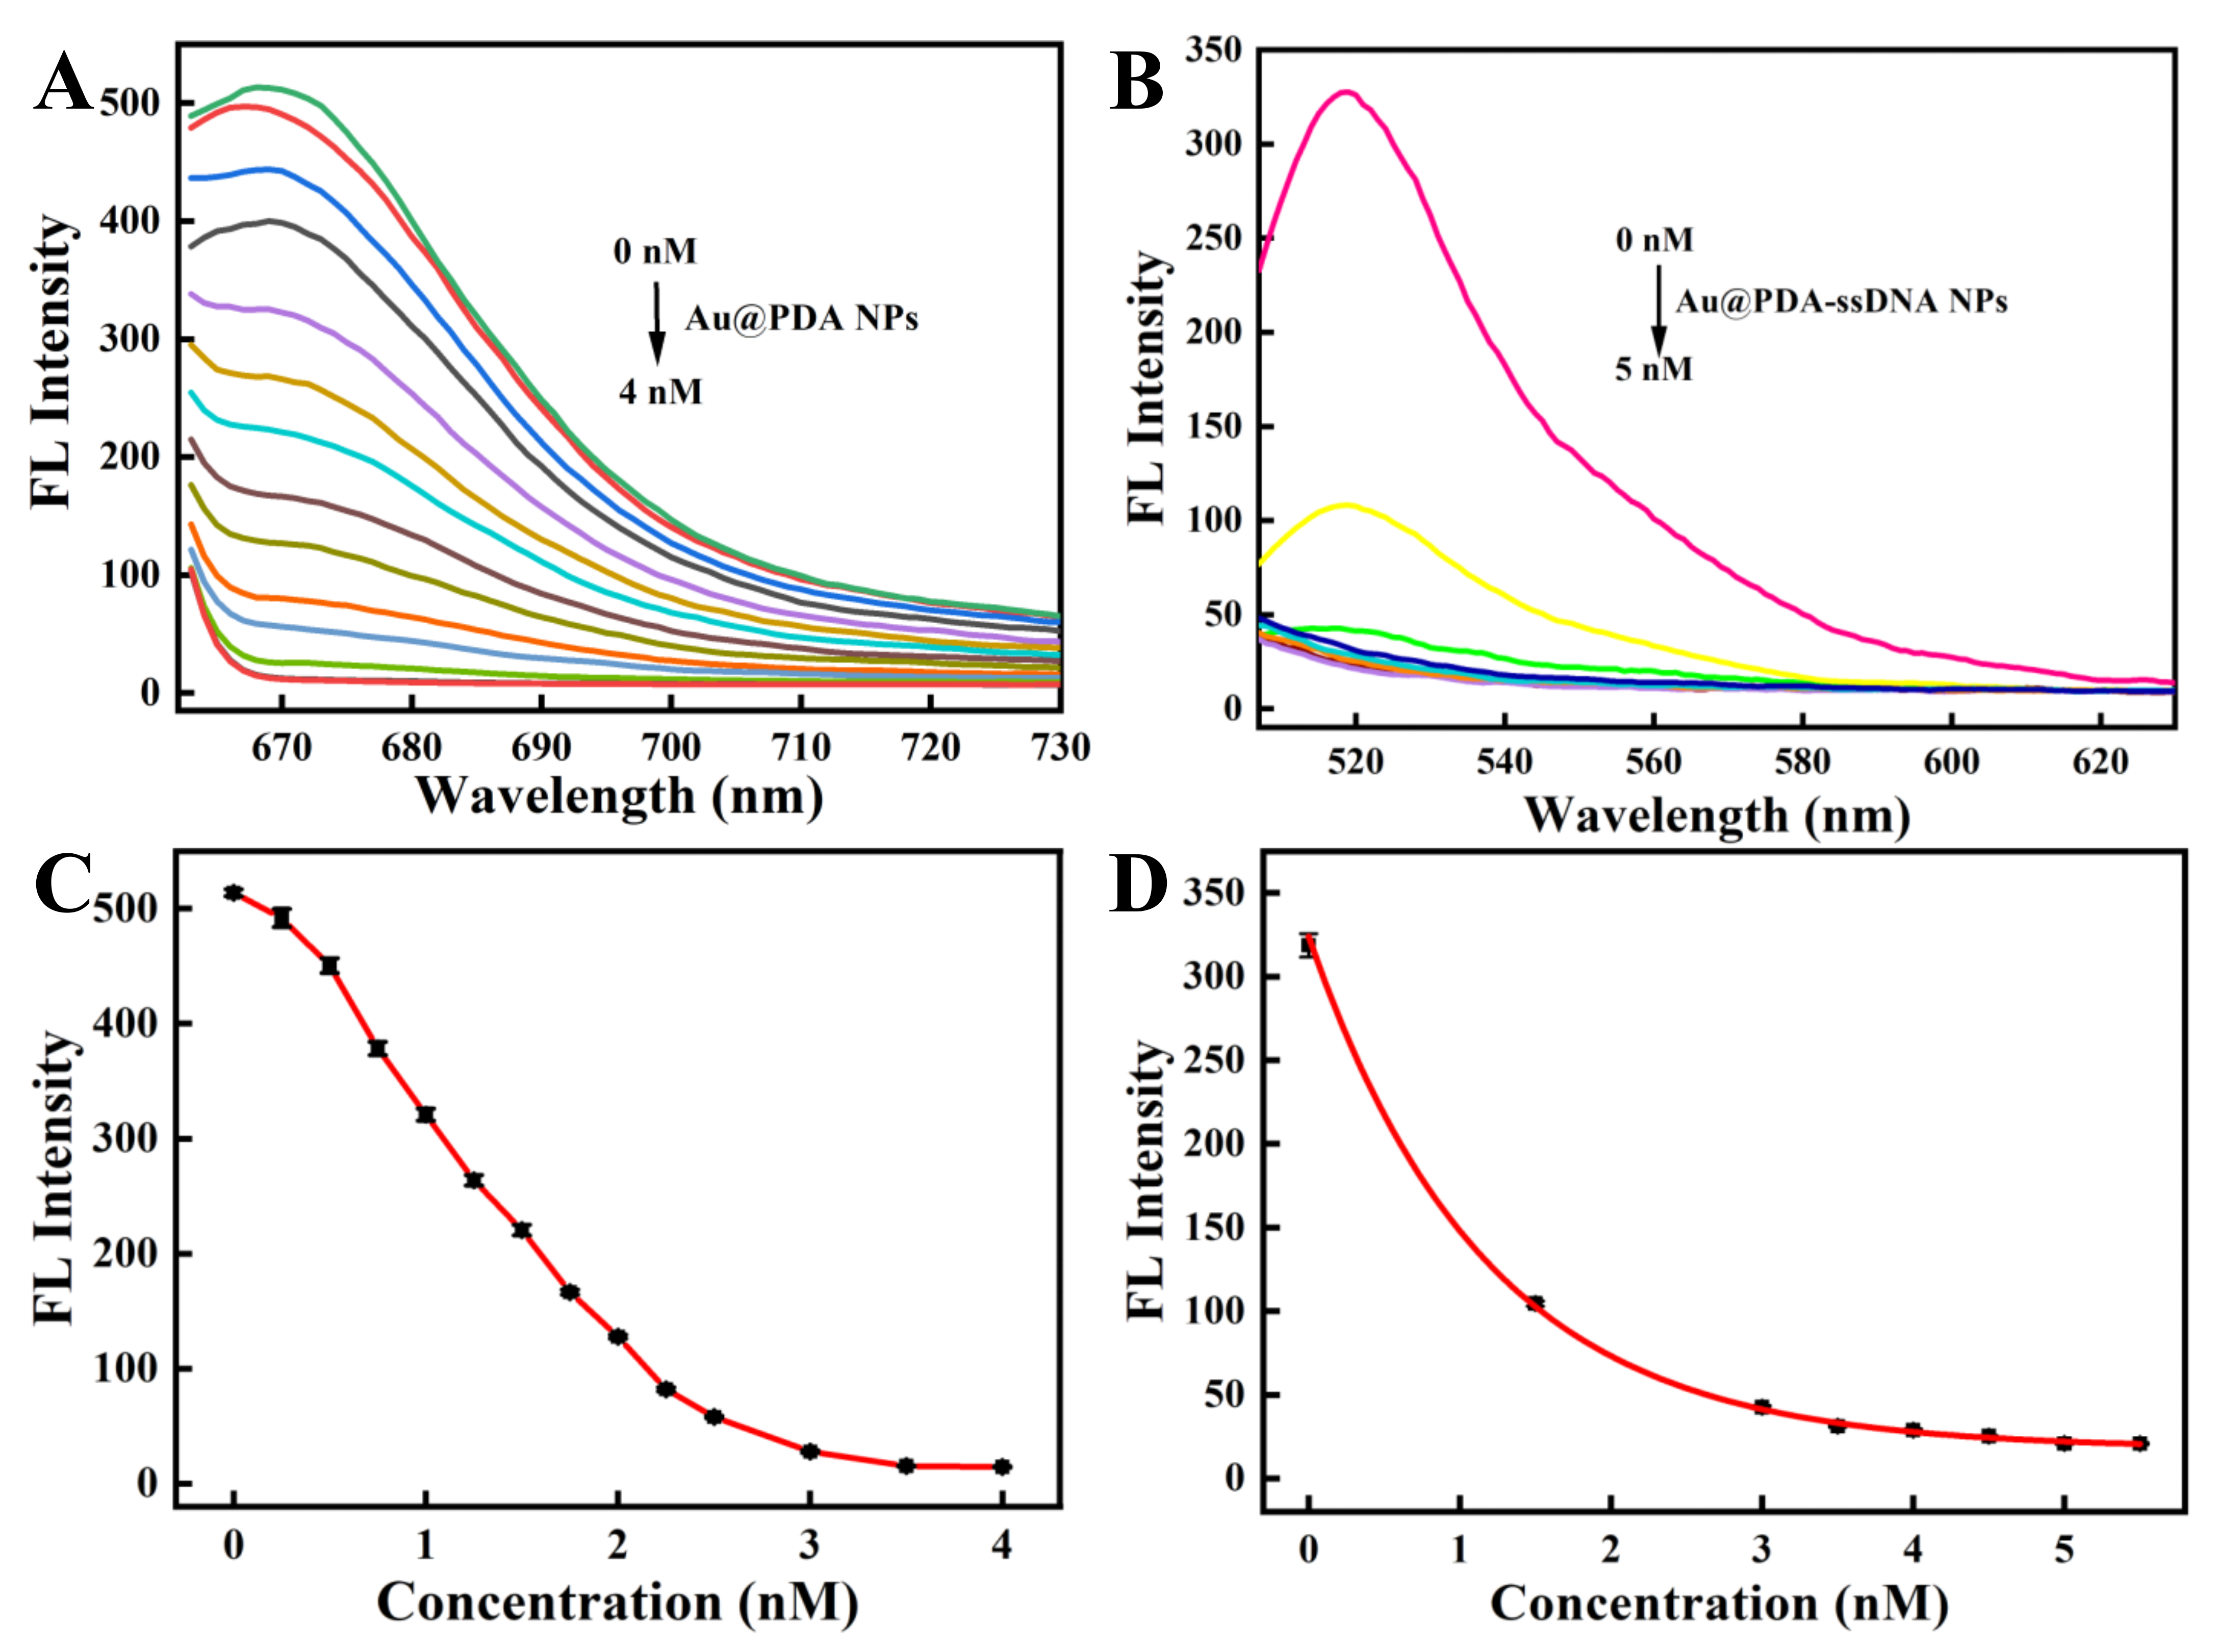
To achieve the best recognizing performance, the optimized concentration of Au@PDA NPs was then determined. Different concentrations of Au@PDA NPs were added to the 150 nM ssDNA solution to successfully prepare the fluorescence-quenched Au@PDA–ssDNA NPs. Figure 2A,C show that the 3.5 nM Au@PDA NPs completely quenched the fluorescence of Cy5 dye-conjugated ssDNA. Then, different concentrations of Au@PDA–ssDNA NPs with the quenching of Cy5 fluorescence were added to the 250 nM oligopeptide solution. The fluorescence of FITC-labeled oligopeptides was completely quenched when the concentration of Au@PDA NPs reached 5 nM (Figure 2B,D). Hence, the Au@PDA NPs at 5 nM were selected for the following experiments.
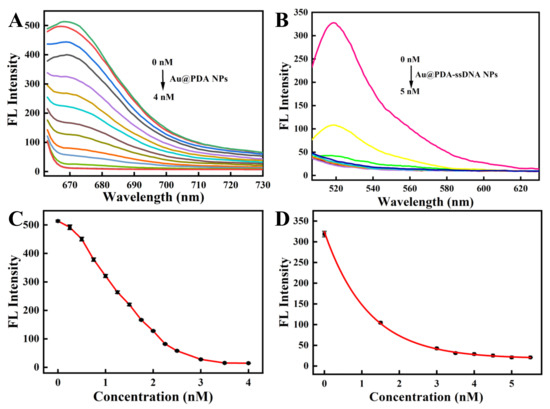
Figure 2.
The fluorescence quenching spectra of the Cy5-labeled ssDNA (150 nM) with various concentrations of Au@PDA NPs (A) and the FITC-labeled oligopeptide (250 nM) with various concentrations of Au@PDA–ssDNA NPs (B). Plot of the fluorescence intensity at various concentrations of Au@PDA NPs (C) and Au@PDA–ssDNA NPs (D).
3.2. In Vitro Studies of the Nanoprobe
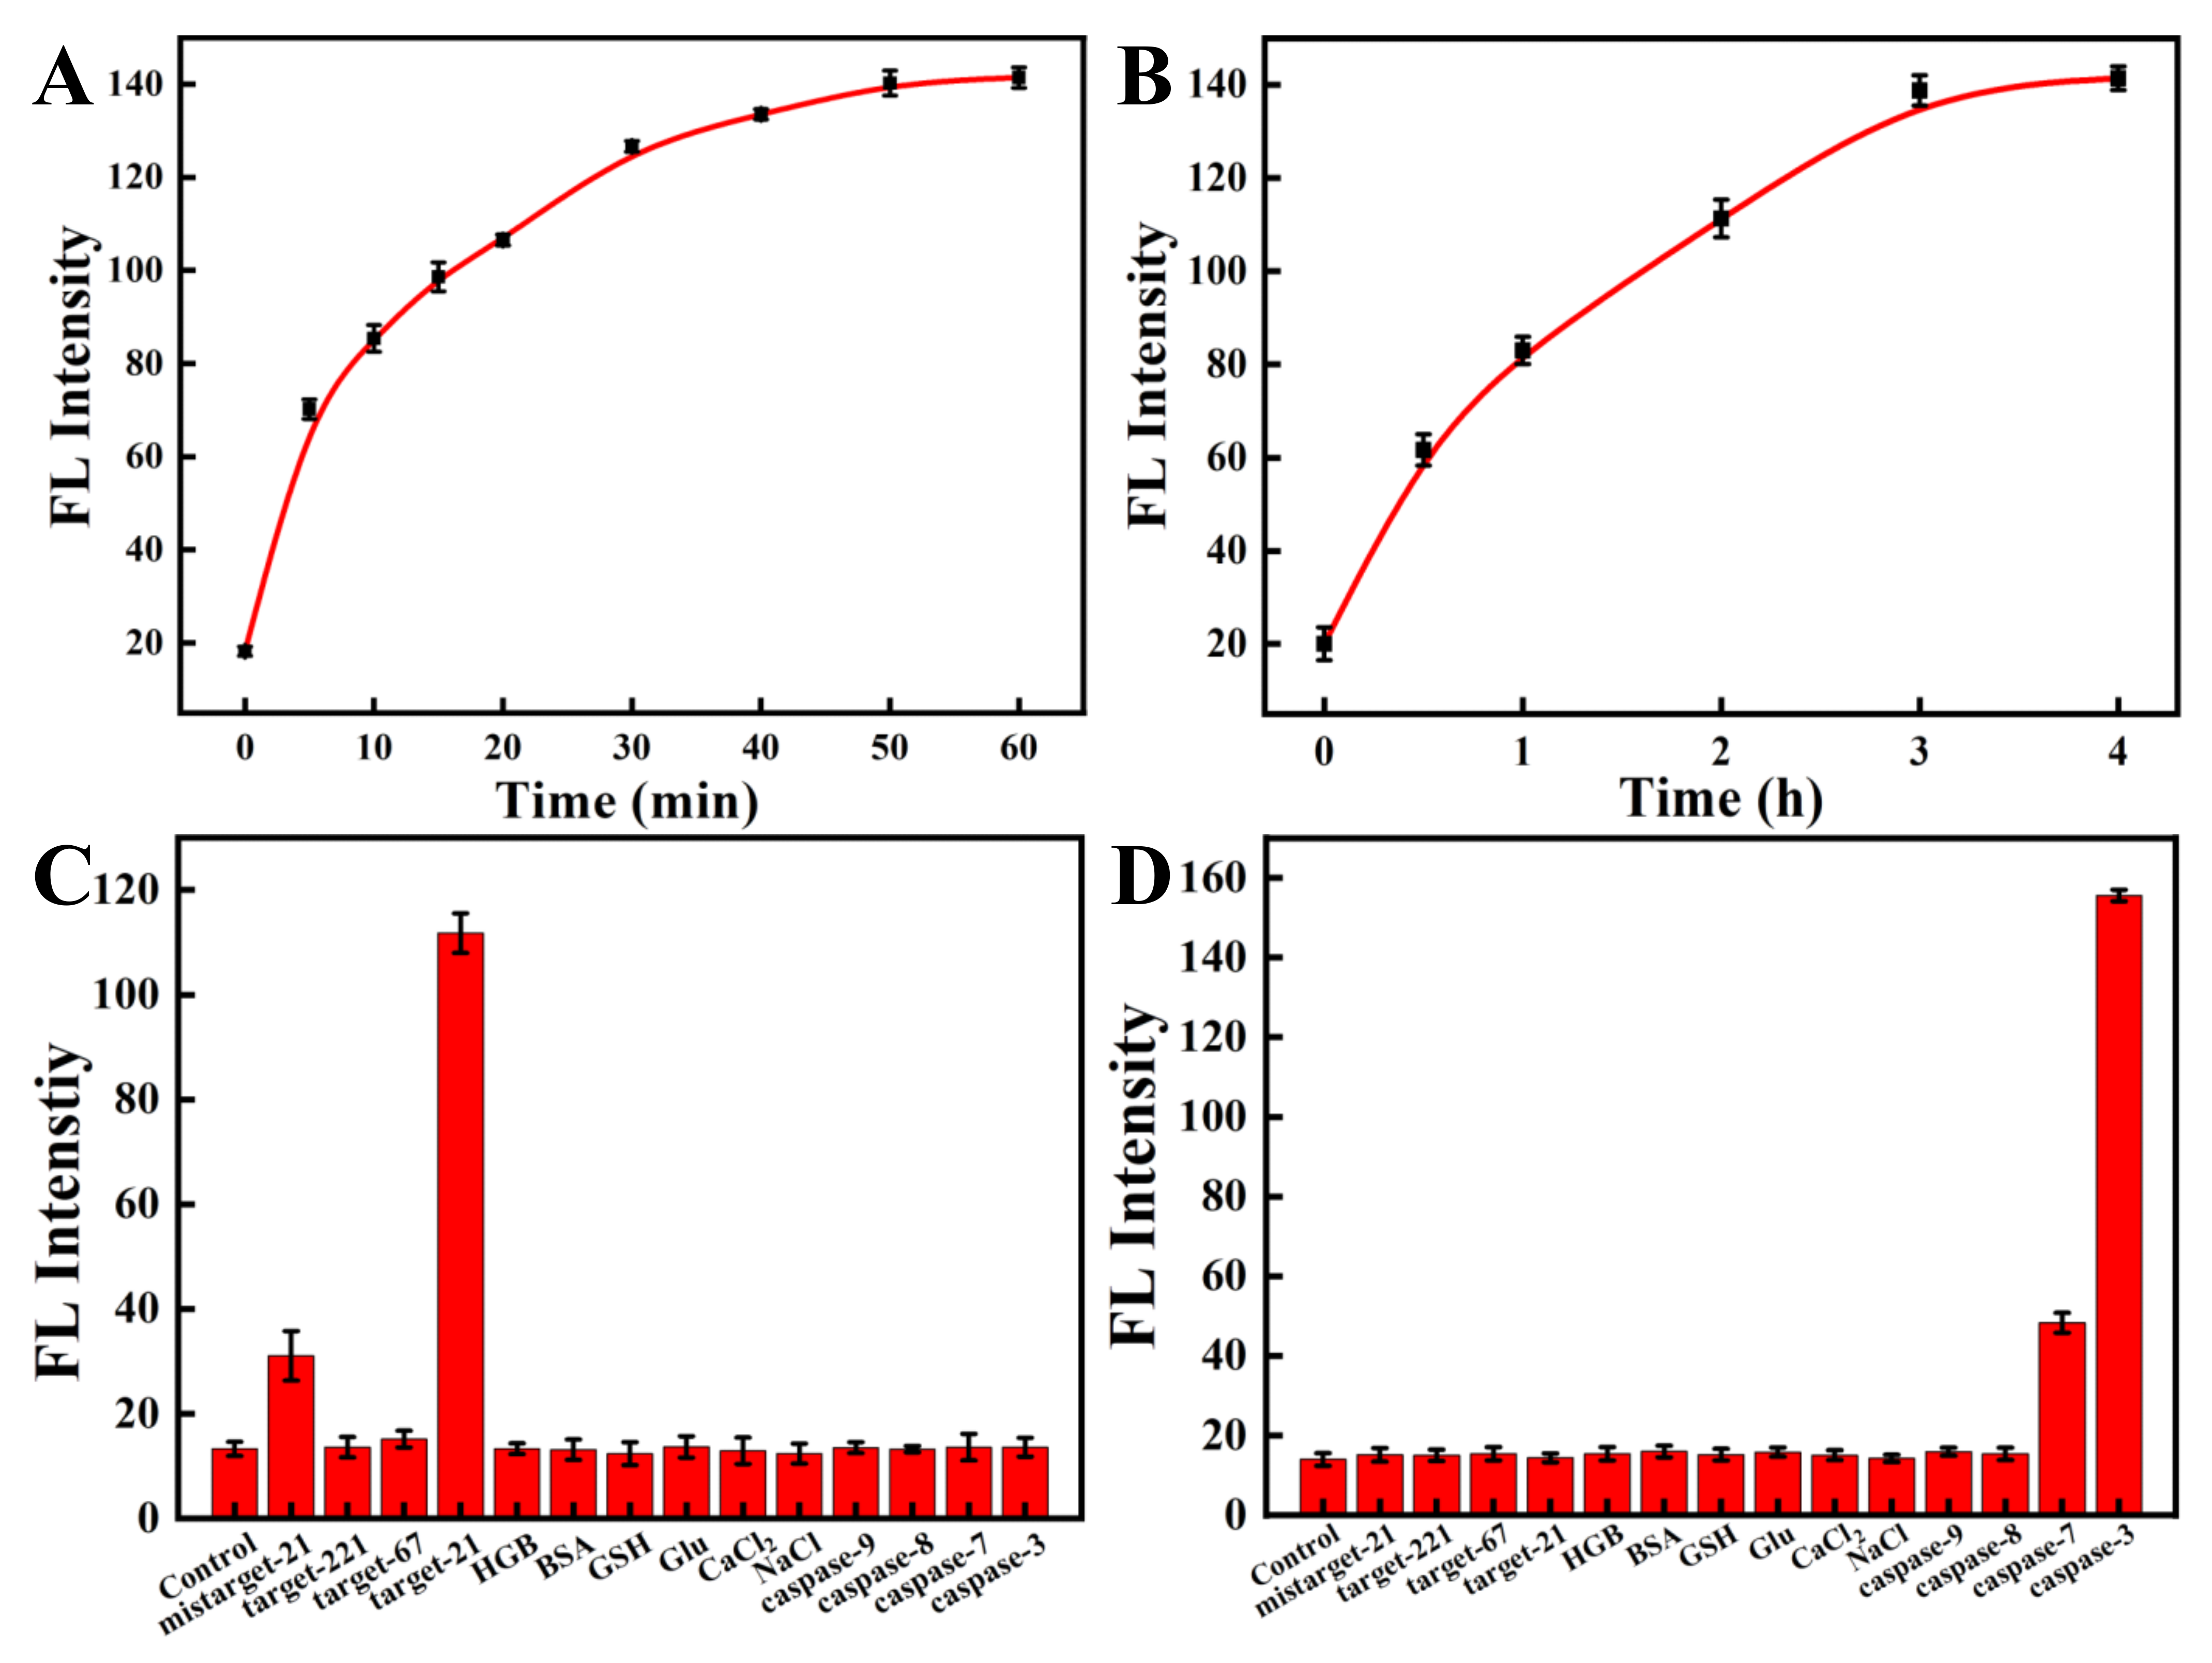
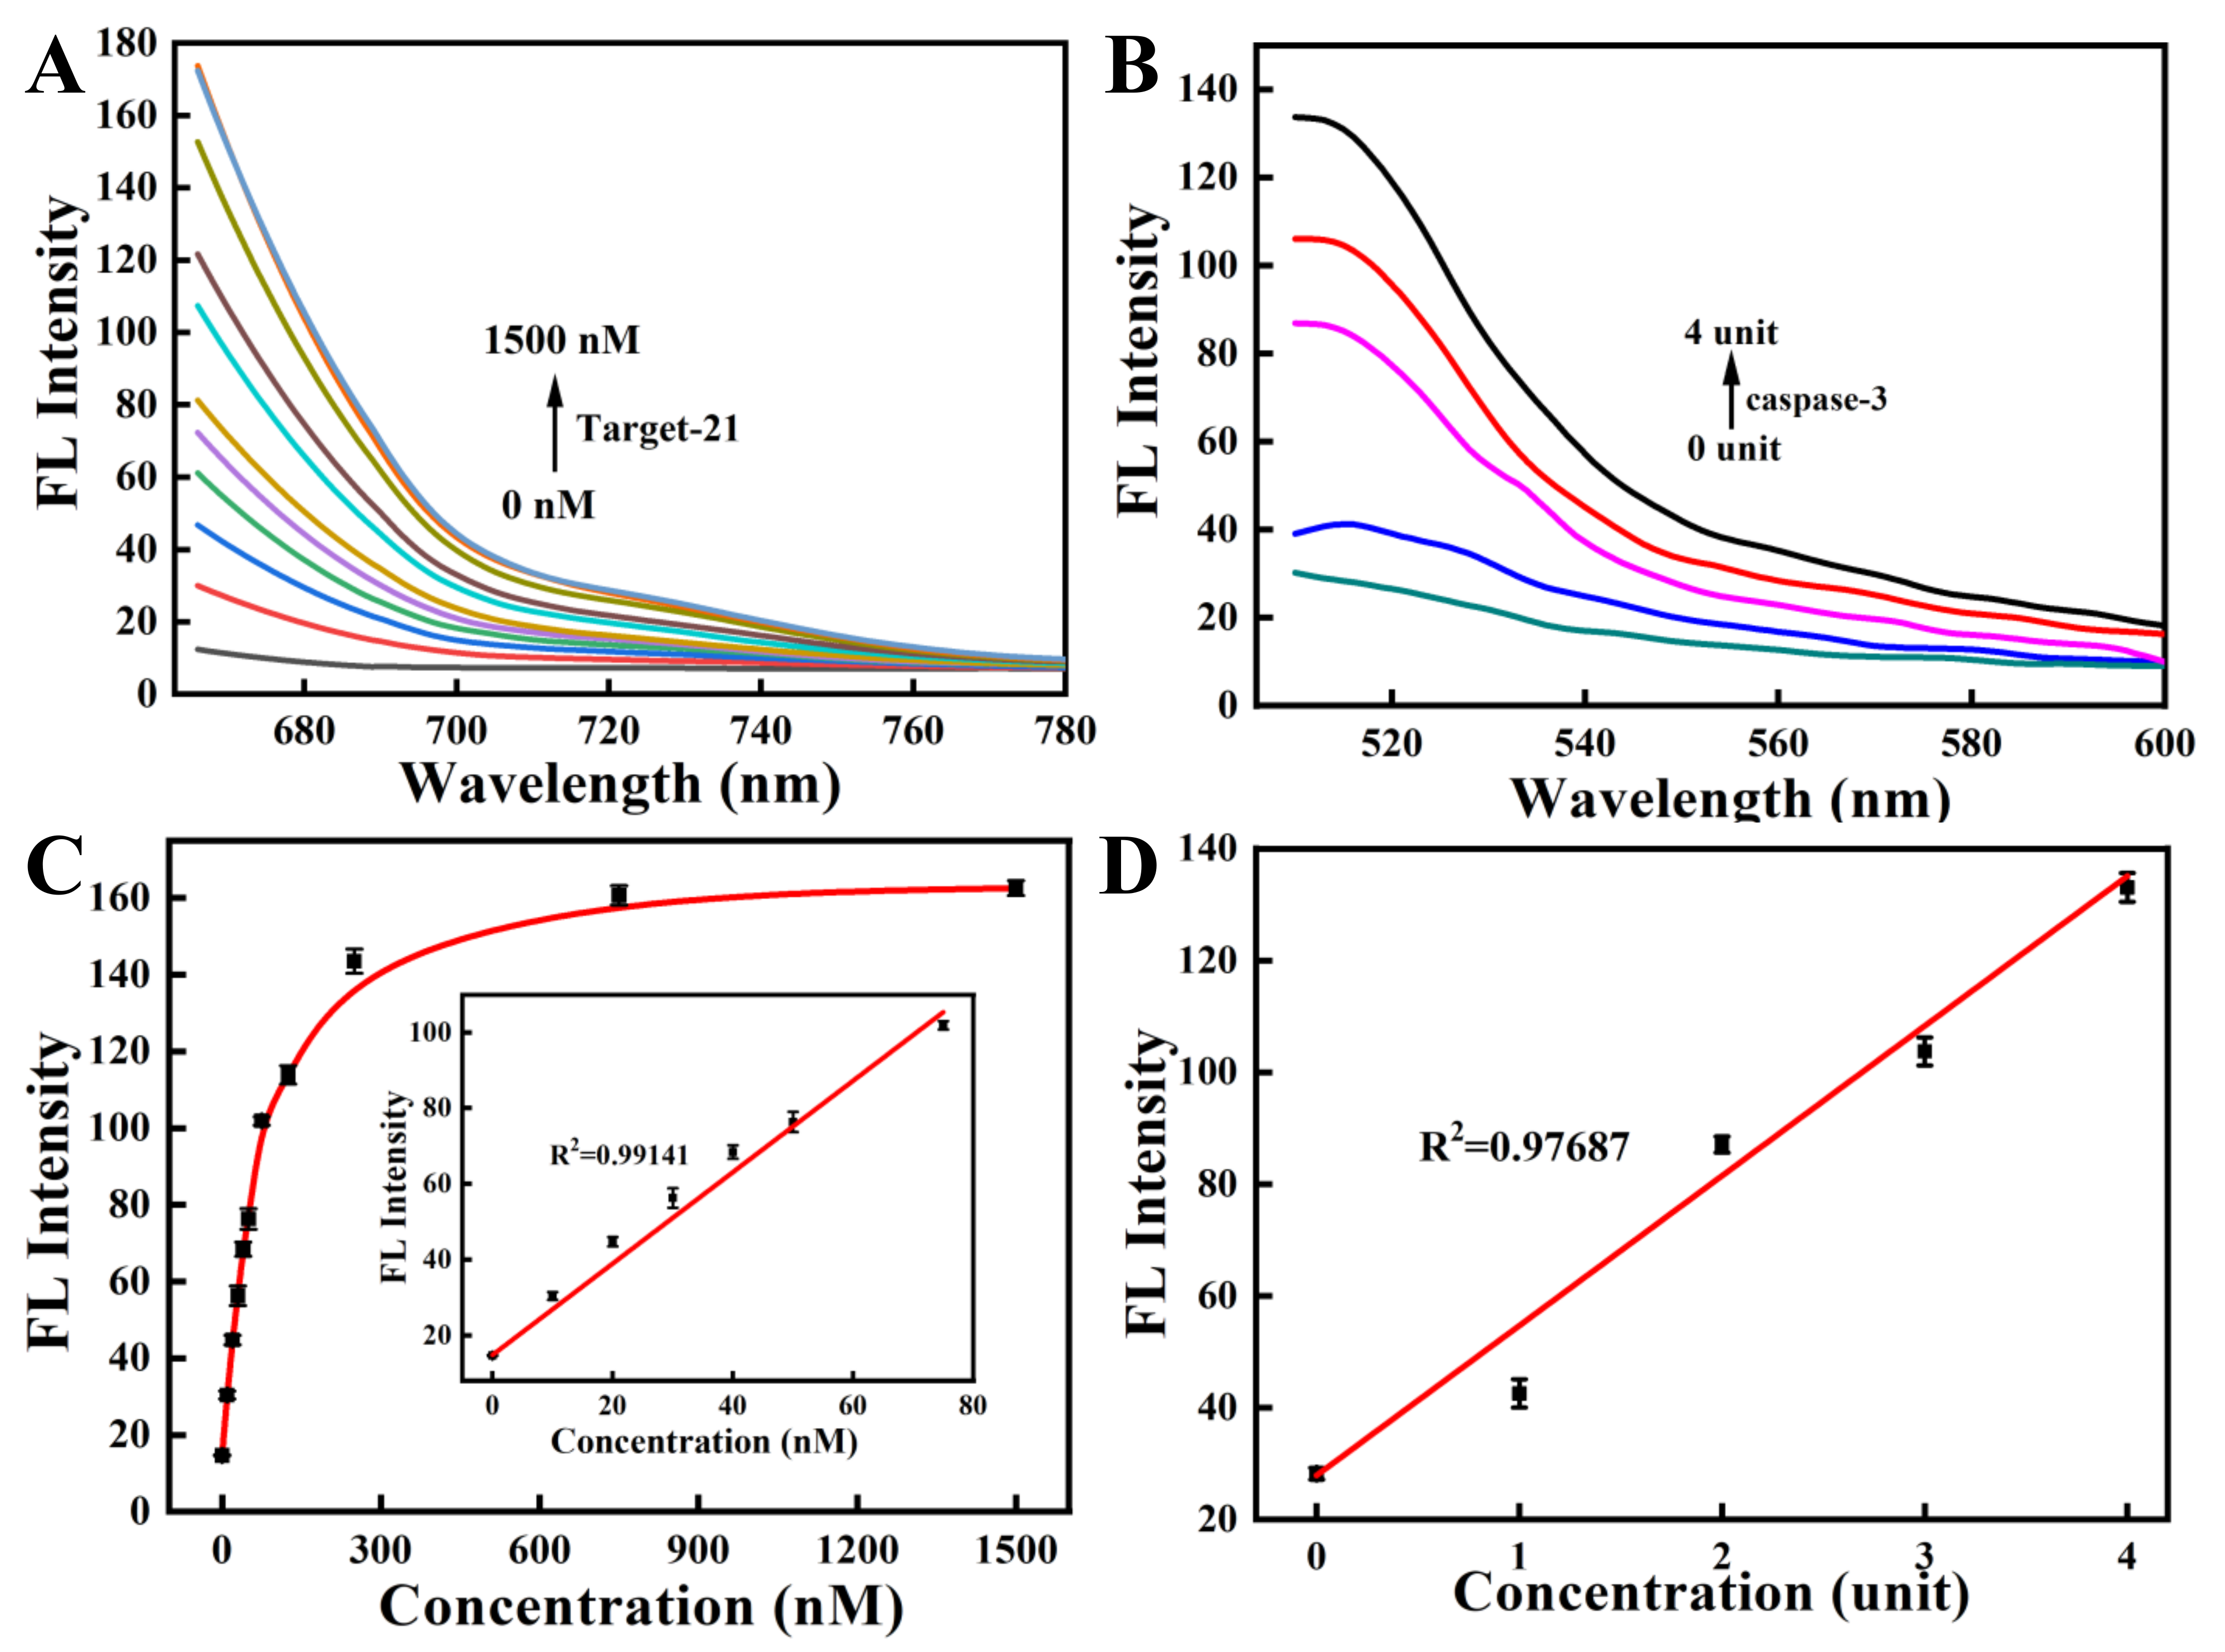
To study the feasibility of simultaneous detection of miRNA-21 and caspase-3 by the nanoprobe, we next investigated the response of ssDNA to a fully complementary target strand as well as the response of the oligopeptide to the corresponding caspase-3 protein. The kinetic results indicated that the nanoprobe could respond rapidly to the perfectly complementary paired miRNA-21 target strand within 10 min and reach a plateau within 60 min (Figure 3A and Figure S2A). The fluorescence response of the nanoprobe to caspase-3 also increased gradually with time and reached a plateau after 3 h (Figure 3B and Figure S2B). In the response experiment of the nanoprobe to the target, with a gradual increase in the perfectly matched target-21 concentration (0–1500 nM), the fluorescent signal of Cy5, labeled on ssDNA, also gradually increased (Figure 4A,C). Similarly, with a gradual increase in the concentration of caspase-3 protein (0–4 unit), the fluorescence intensity of the FITC labeled on the oligopeptide increased gradually (Figure 4B,D). The fluorescence intensity was linearly correlated to the concentration of caspase-3. These results indicate that the recovery of the fluorescence signal is due to the reaction of the nanoprobe with the corresponding DNA target strand and the caspase-3 protein. The fluorescent nanoprobe can achieve simultaneous detection of miRNA-21 and caspase-3.
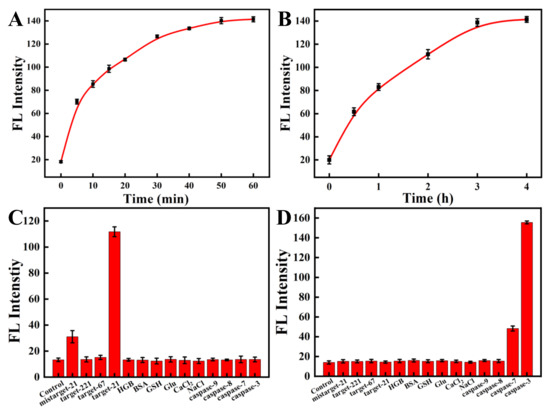
Figure 3.
Kinetics of the nanoprobe in the presence of miRNA-21 (A) and caspase-3 (B). (Cy5-labeled ssDNA, targeting miRNA-21, λex/λem = 648 nm/667 nm; FITC-labeled oligopeptide, targeting caspase-3, λex/λem = 480 nm/520 nm). The specificity experiments of ssDNA (C) and peptide (D) modified on the nanoprobe.
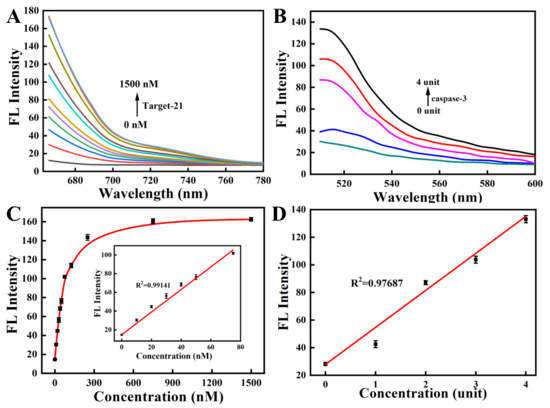
Figure 4.
The fluorescence response spectra of the nanoprobe with various concentrations of miRNA-21 (A) and caspase-3 (B). The fluorescence recovery of the nanoprobe in the presence of miRNA-21 (C) and caspase-3 (D). (Inset: linear relationship for miRNA-21 concentrations ranging from 0 to 75 nM).
To investigate whether the nanoprobe can specifically detect miRNA-21 and caspase-3 proteins, we analyzed the effects of other interfering substances on the nanoprobe. The mismatched target-21 strand and other targets (including target-221 and Ki-67) all showed marginal fluorescence changes compared with the control (Figure 3C). In contrast, the fully matched target-21 strand presented remarkable fluorescence responses. Similar results were detected when the fluorescent nanoprobe met the caspase-3 protein and other interfering substances (Figure 3D). We observed no obvious fluorescence recovery for any interfering substance except for caspase-7. Although caspase-7 can also recognize oligopeptides and result in the recovery of fluorescence, caspase-3 still performed about 3-fold better than caspase-7. The result is consistent with previous studies [42,43]. Therefore, the results show that the nanoprobe can selectively detect miRNA-21 and caspase-3 proteins with high specificity.
3.3. MTT Experiment
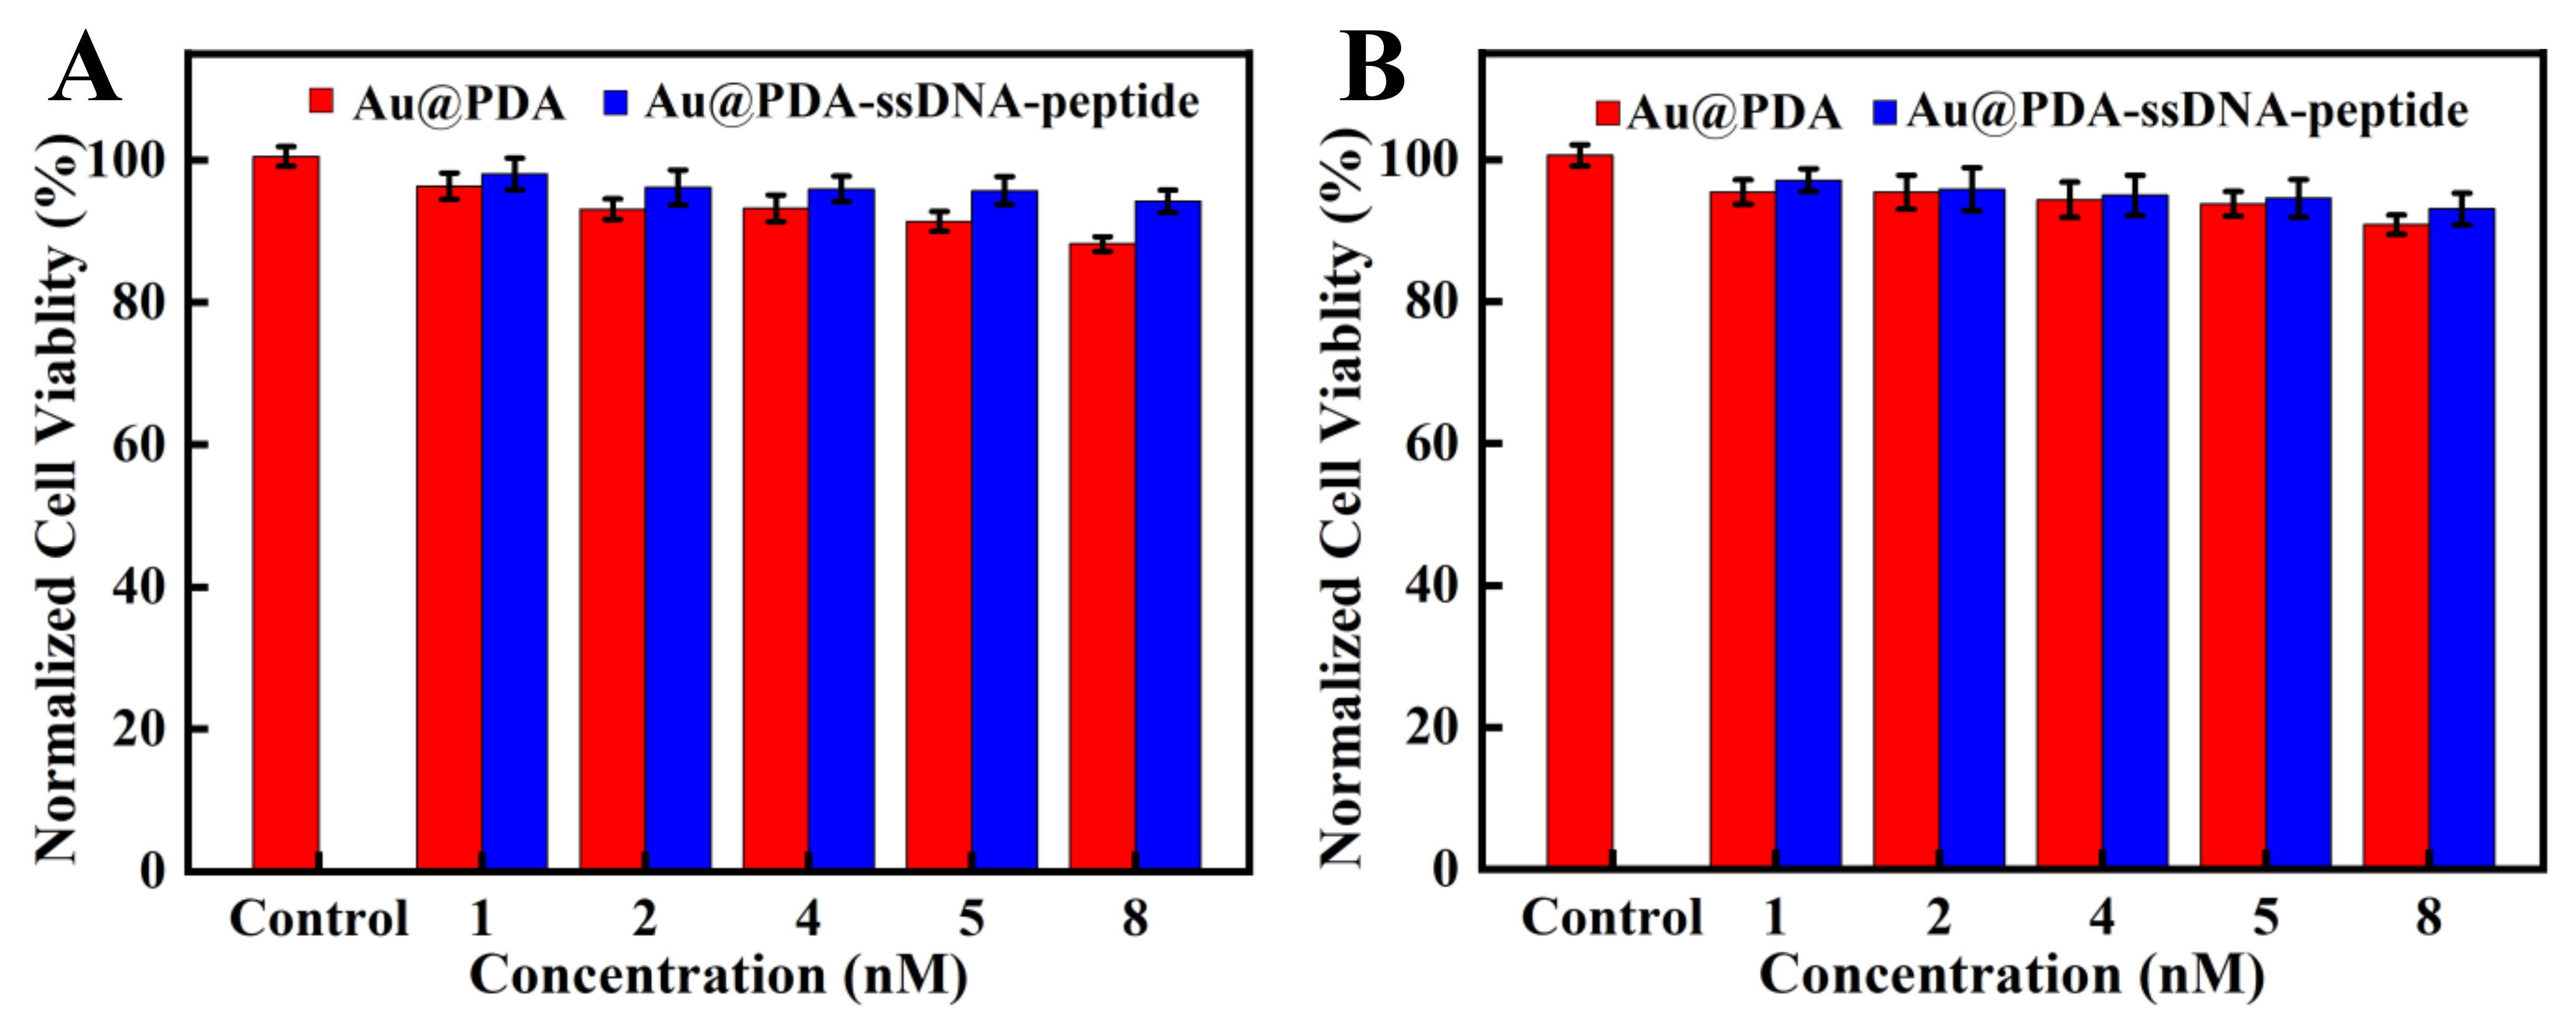
A549 and Hela cells were used to measure the cytotoxicity of the nanoprobe. As shown in Figure 5, the viability of both cell types remained over 90% after incubating the nanoprobe with cells for 24 h, which indicated that the nanoprobe had low cytotoxicity and good biocompatibility. Moreover, the two types of cells had a higher survival rate after being incubated with Au@PDA–ssDNA–peptide NPs than Au@PDA NPs. This is due to the better biocompatibility of the nanoprobe after the modification of ssDNA and peptides. We then set up three parallel groups with the two types of cells to examine whether their cell morphology changed after incubation with the nanoprobe. One group was treated with Au@PDA NPs, and the other group was treated with Au@PDA–ssDNA–peptide NPs. Additionally, the untreated group served as the control. The morphology of the cells treated Au@PDA NPs and Au@PDA–ssDNA–peptide NPs remained almost unchanged compared with the control group (Figure S3). The results confirm that the nanoprobe can be applied for intracellular detection and imaging.
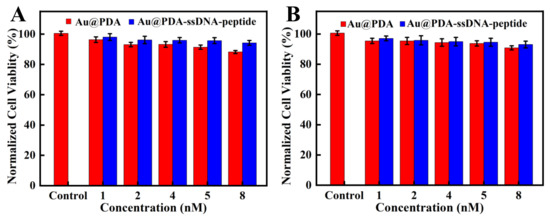
Figure 5.
MTT assays of A549 cells (A) and Hela cells (B). The cells were incubated with various concentrations of the nanoprobe for 24 h.
3.4. Intracellular Imaging of MiRNA-21 and Caspase-3
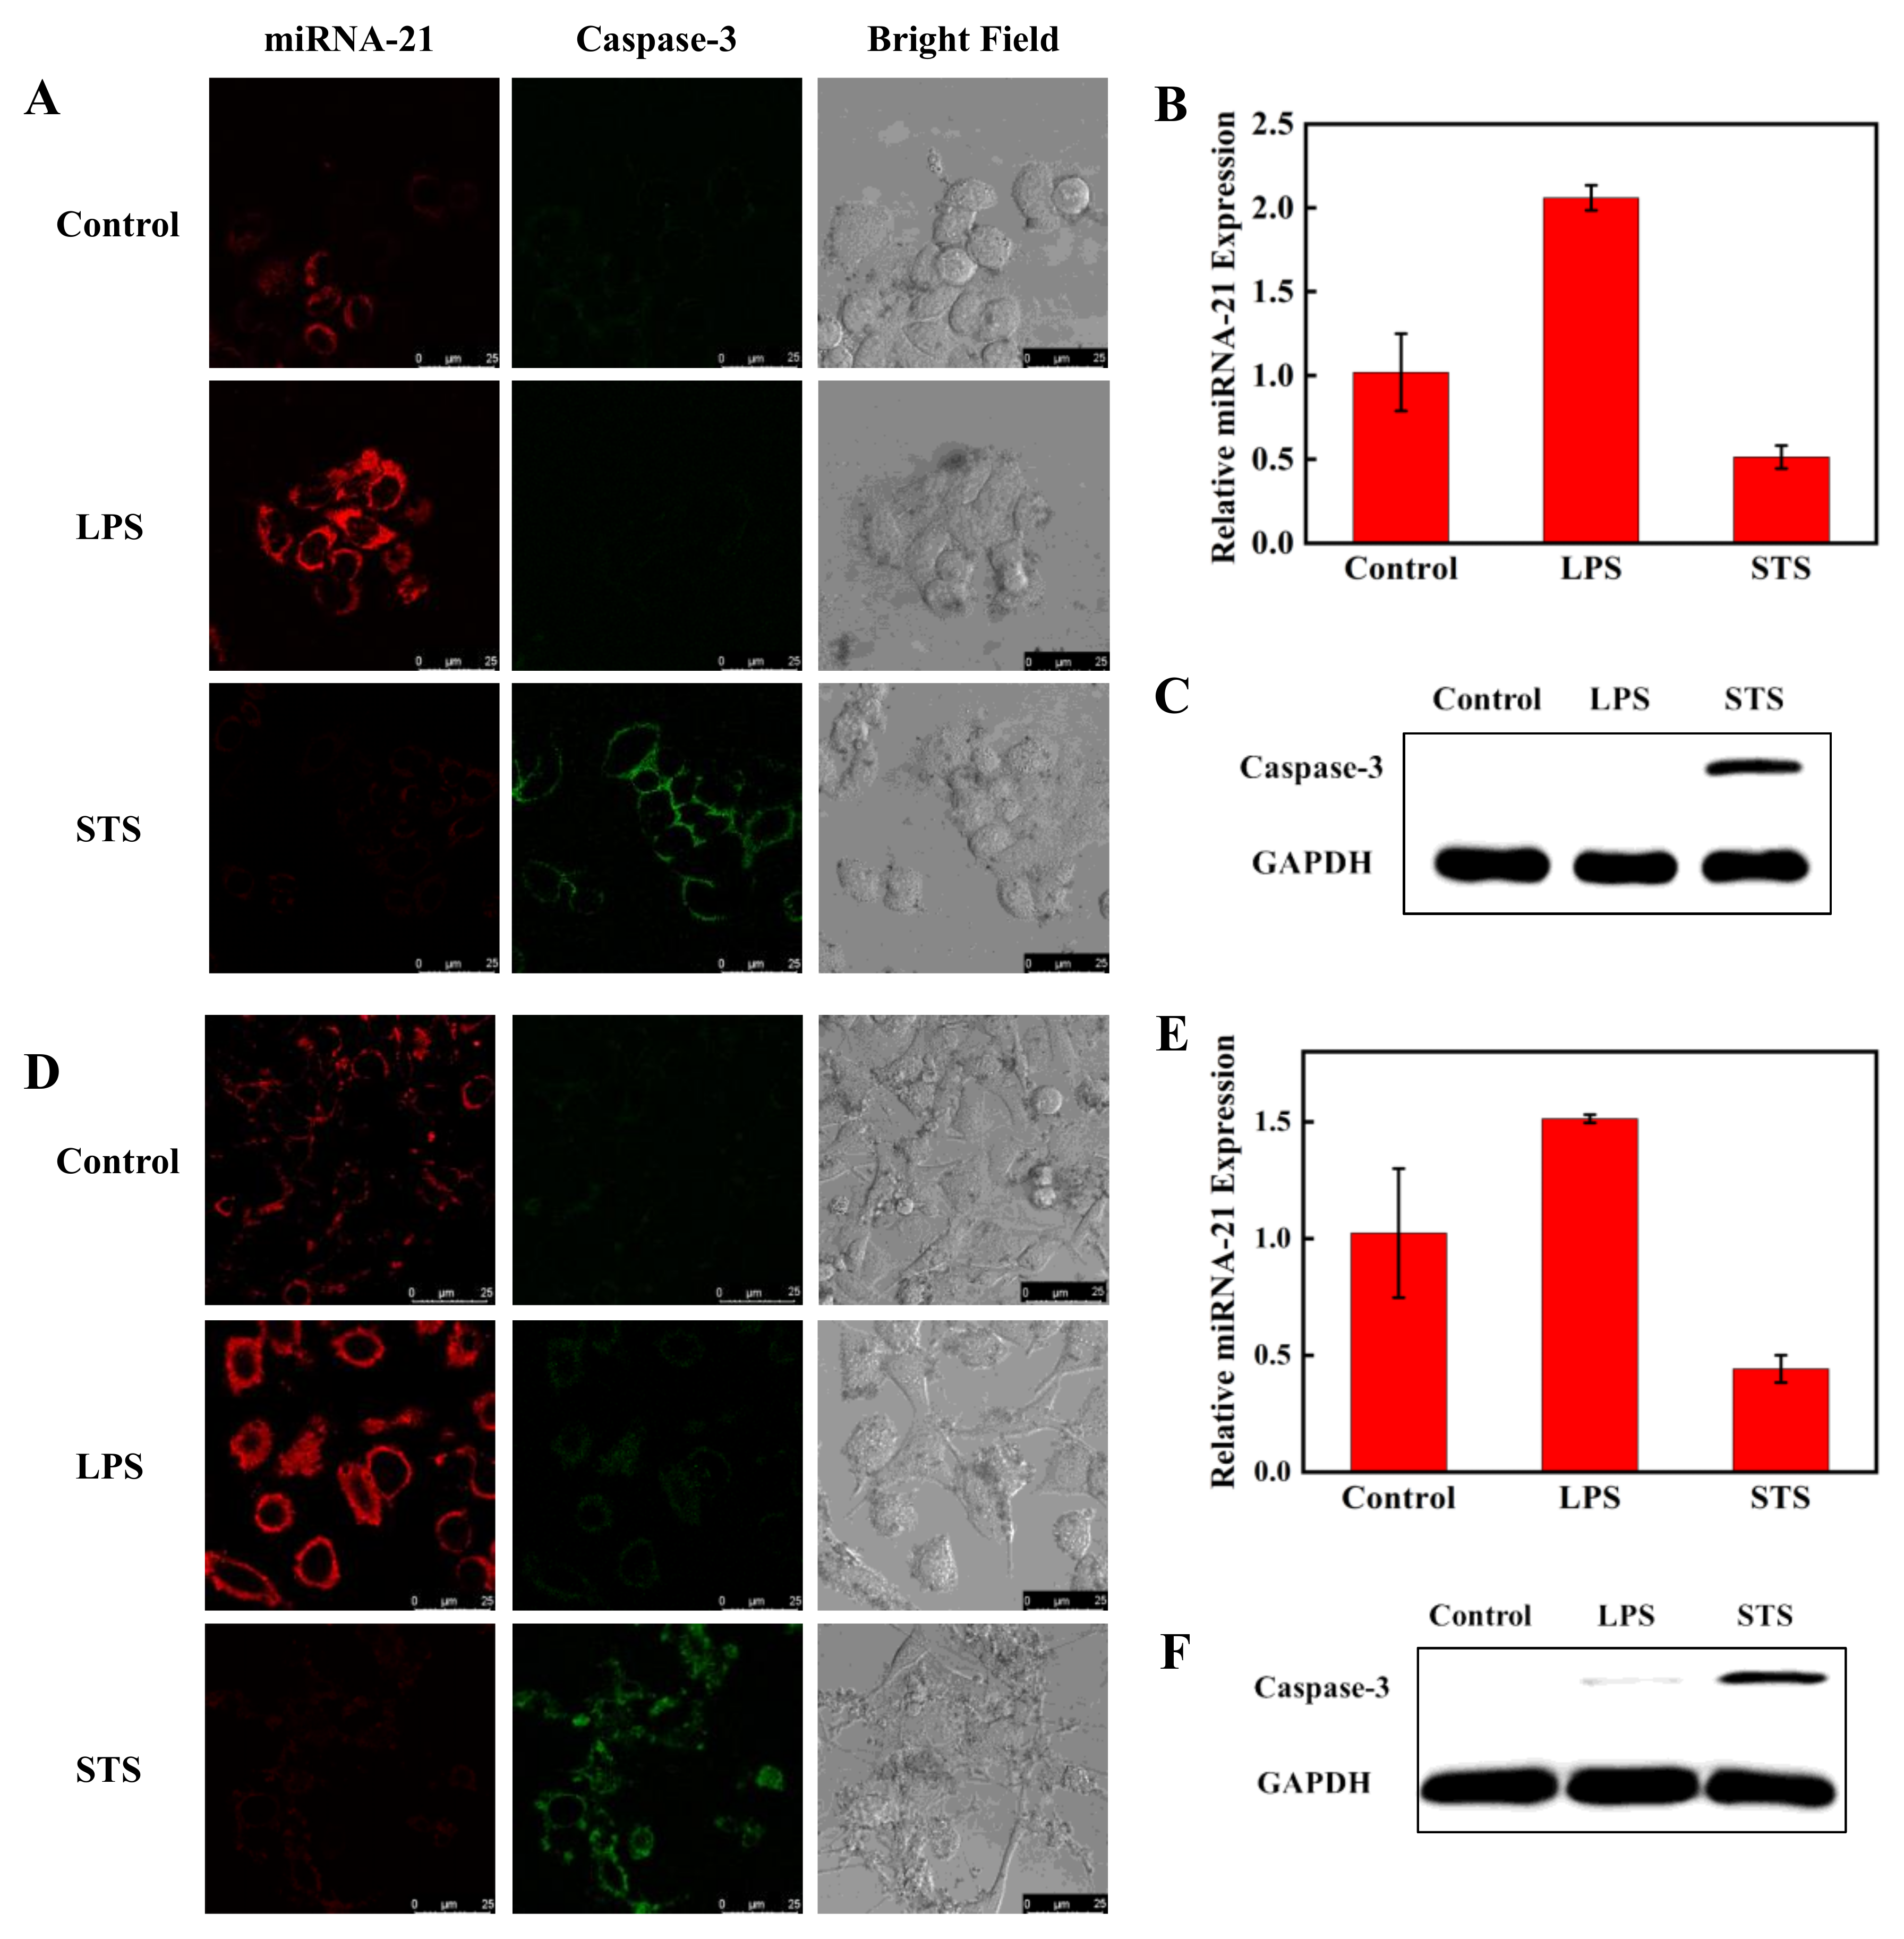
To investigate the ability of the nanoprobe to simultaneously detect miRNA-21 and caspase-3 expression and activity levels in living cells, A549 cells and Hela cells were first chosen. It has been reported that the expression of miRNA-21 is particularly high in cancer cells and the expression and activity of caspase-3 are higher during cancer cell programmed death. We treated the two cell lines with LPS and STS. LPS can stimulate cells to produce an inflammatory response, and miRNA-21 expression is increased [44]. STS can induce cell apoptosis, and caspase-3 expression is increased [45]. Hela cells were divided in parallel into three groups. One group was treated with LPS; another group was treated with STS. The untreated group served as the control. After being incubated with the nanoprobe for 4 h, three groups of Hela cells were monitored by CLSM to measure the red fluorescent signal of Cy5, which was used to monitor miRNA-21, and the green fluorescence of FITC, which was used to monitor caspase-3 protein (Figure 6A). The red fluorescence was significantly enhanced and the green fluorescence was not changed in cells treated with LPS compared to the untreated cells. The green fluorescence was significantly increased and the red fluorescence was weakened in cells treated with STS compared with the control group. Grayscale values of fluorescence intensities obtained from CLSM further verified the expression changes of miRNA-21 and caspase-3 (Figure S4).
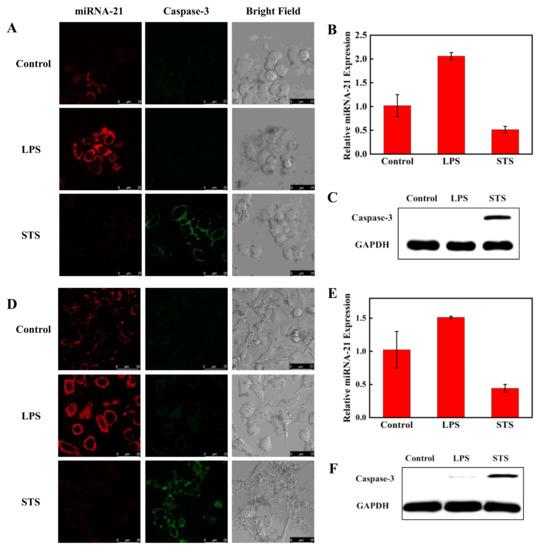
Figure 6.
Confocal fluorescence images of miRNA-21 and caspase-3 in Hela cells (A) and A549 cells (D). The cells were treated with LPS to increase miRNA-21 expression and with STS to increase caspase-3 expression. The treated and untreated cells were incubated with the nanoprobe for 4 h at 37 °C. The red and green channels were observed with 488 and 633 nm lasers, respectively. Scale bar is 25 μm. Detection of miRNA-21 level by RT-PCR in Hela cells (B) and A549 cells (E) after treatment with LPS and STS. The Western blot assay of caspase-3 expression in Hela cells (C) and A549 cells (F).
RT-PCR and WB methods were also applied to detect the relative expression of miRNA-21 and caspase-3 in Hela cells. As shown in Figure 6B,C, the results of RT-PCR and WB maintained consistency with the CLSM results. Meanwhile, the CLSM, PCR, and WB experiments in A549 cells were also performed, and all the results were similar to those obtained in Hela cells (Figure 6D–F). The results imply that the fluorescent nanoprobe can simultaneously detect miRNA-21 and caspase-3 protein in living cells.
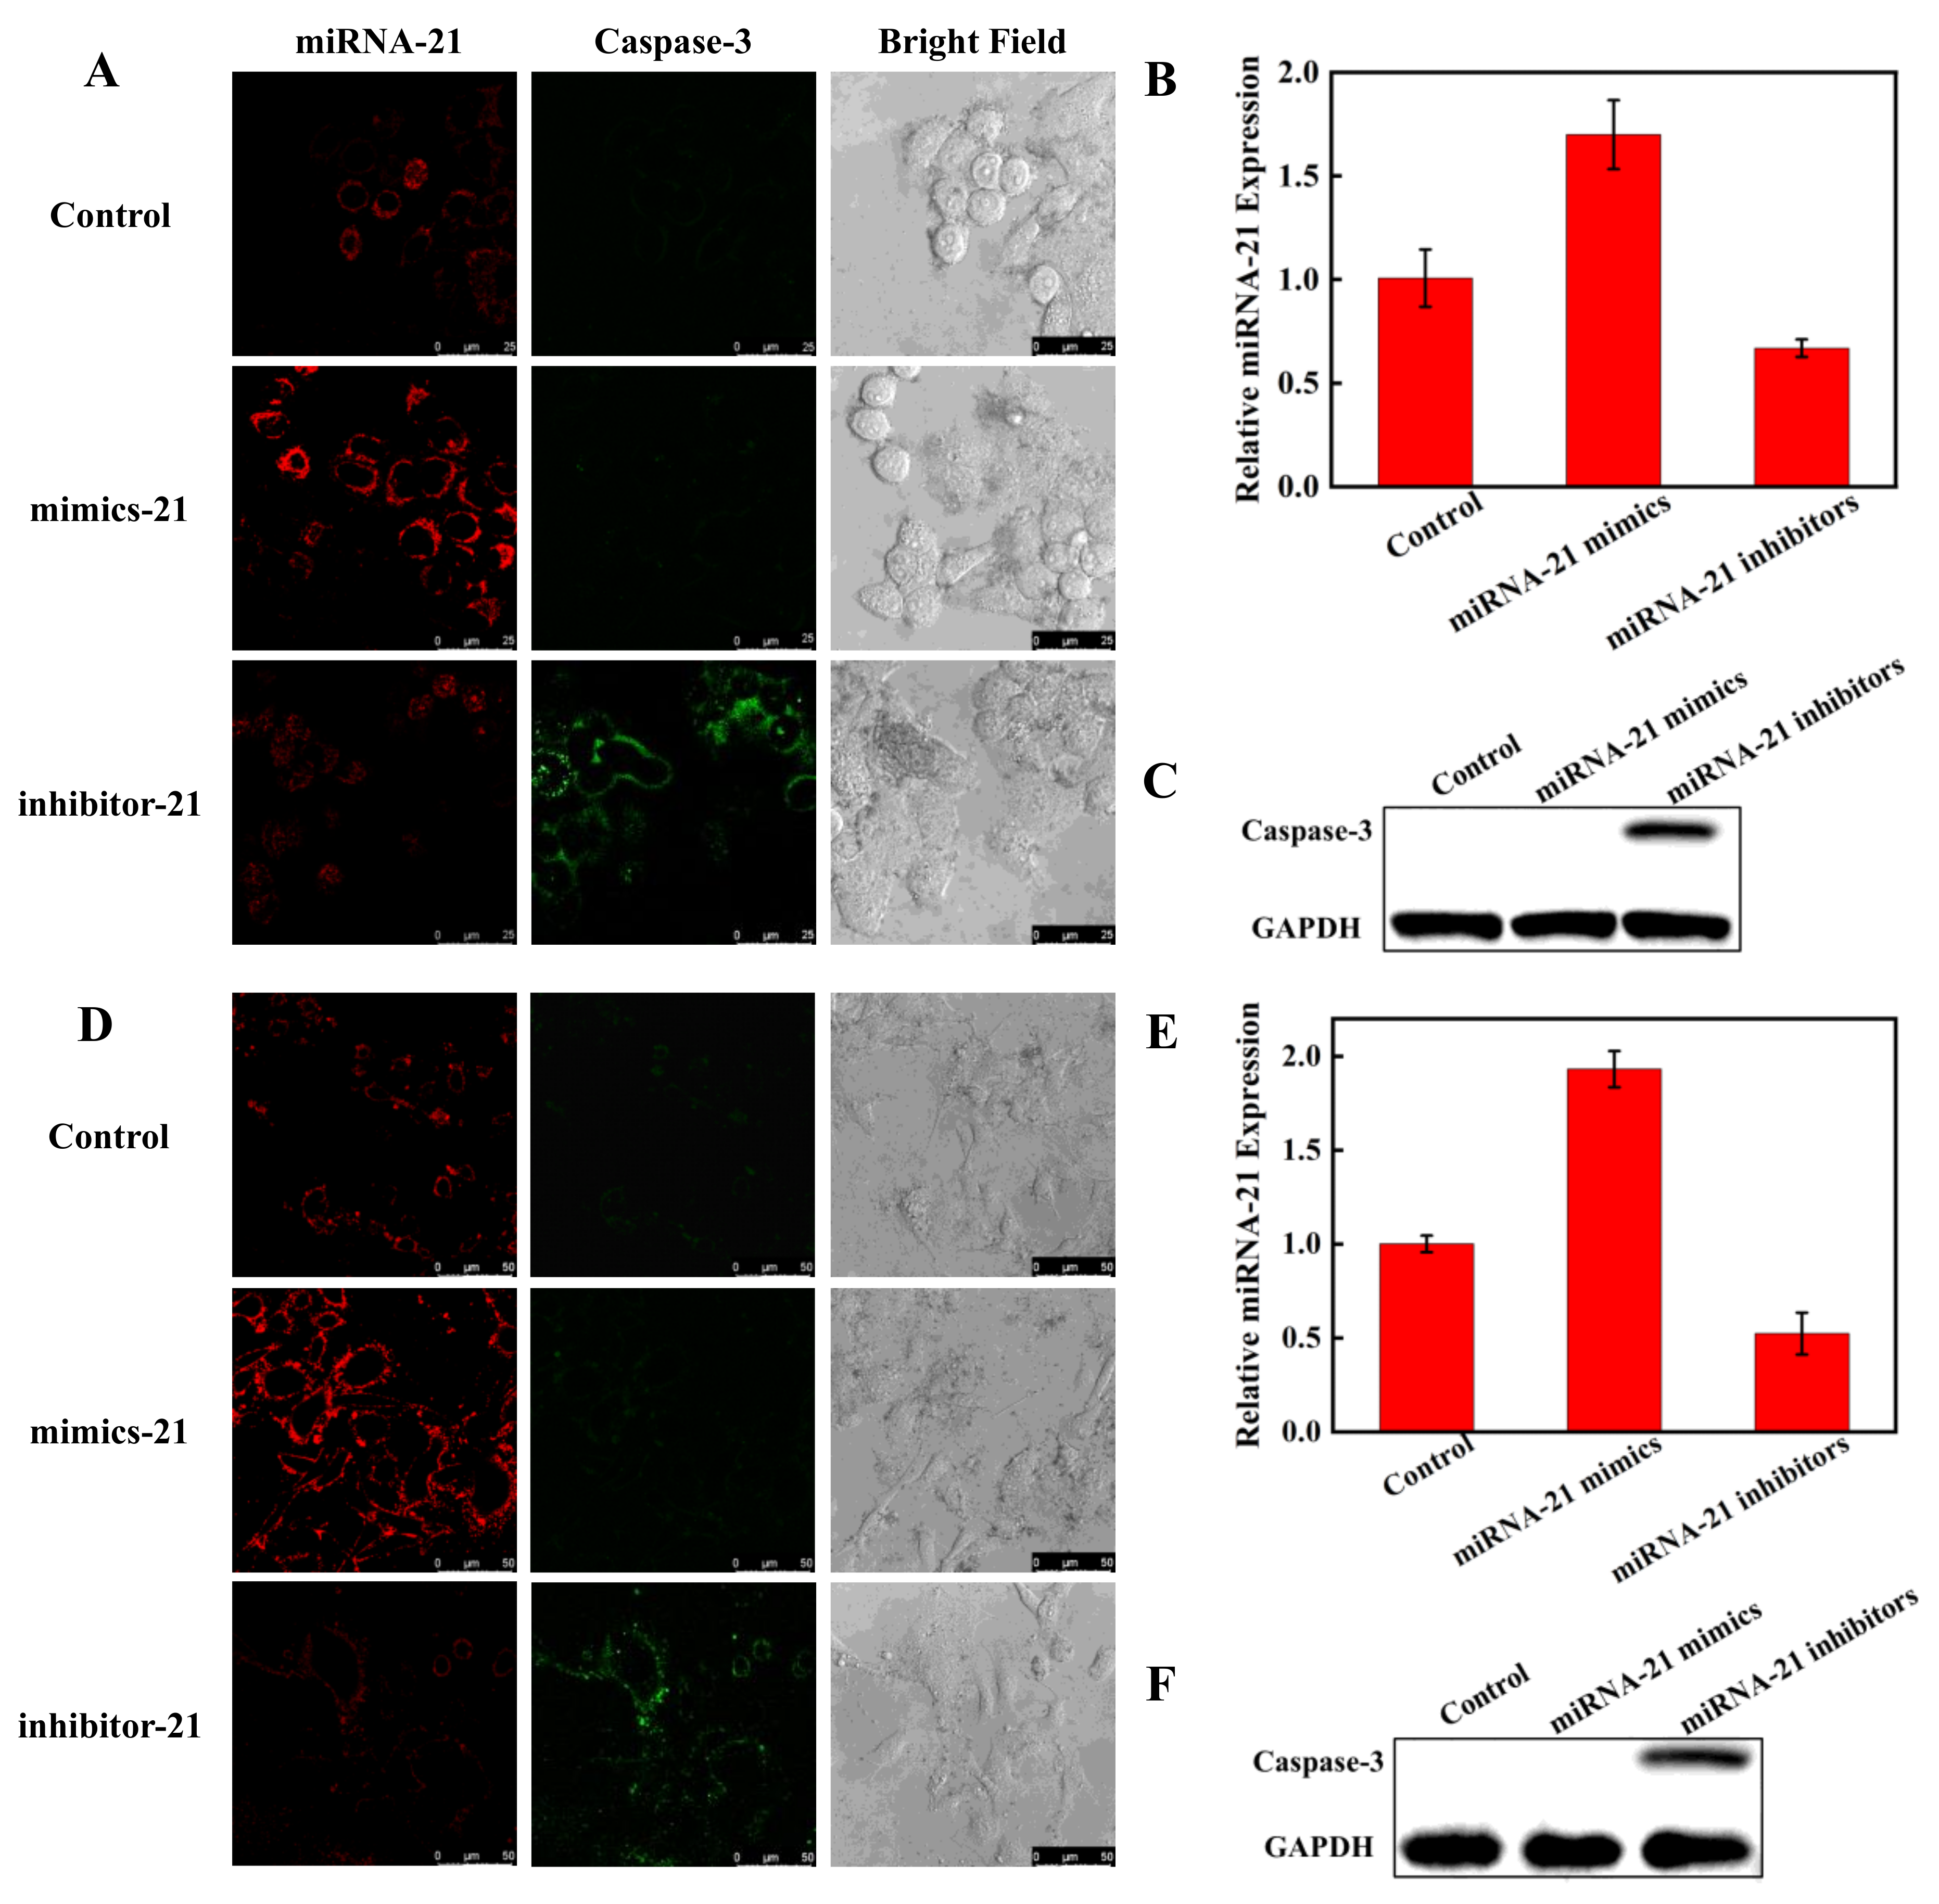
To explore the capability of the nanoprobe to monitor miRNA regulation of apoptosis in living cells, Hela cells and A549 cells transfected with miRNA-21 mimics or inhibitors were further tested for the impact of miRNA expression on caspase-3. Compared to Hela cells without transfection treatment, the red fluorescence was significantly enhanced and green fluorescence was not observed in the cells transfected with miRNA-21 mimics, while the cells transfected with miRNA-21 inhibitors showed decreased red fluorescence and enhanced green fluorescence (Figure 7A). Grayscale values of fluorescence intensities are shown in Figure S5. The CLSM results were further verified using RT-PCR (Figure 7B) and WB (Figure 7C), which indicated that the reduced expression of miRNA-21 caused apoptosis in Hela cells and that the nanoprobe could successfully visualize miRNA regulation of apoptosis in living cells. A549 cells behaved similarly to Hela cells in CLSM, PCR, and WB (Figure 7D–F). These results suggest that miRNA-21 could be a potential therapeutic target candidate for Hela cells and A549 cells.

Figure 7.
Visualizing miRNA regulation of apoptosis in Hela cells (A) by CLSM (scale bar: 25 μm). Visualization of miRNA regulation of apoptosis in A549 cells (D) by CLSM (scale bar: 50 μm). The cells were transfected with miRNA-21 mimics to increase miRNA-21 expression and transfected with miRNA-21 inhibitors to decrease miRNA-21 expression, respectively. Detection of miRNA-21 levels by RT-PCR in Hela cells (B) and A549 cells (E) after transfected with miRNA-21 mimics and miRNA-21 inhibitors. The Western blot assay of caspase-3 expression in Hela cells (C) and A549 cells (F).
4. Conclusions
In summary, we have designed a new type of fluorescent nanoprobe that enables the simultaneous detection and imaging of miRNA and apoptotic markers in living cells. The nanoprobe can overcome the limitations of molecular biology methods and simultaneously monitor the expression levels of intracellular miRNA-21 and caspase-3 with high specificity and good biocompatibility. Fluorescence imaging results showed that the nanoprobe could be successfully applied for real-time monitoring of the effect of miRNA-21 expression changes on apoptosis by dual-color imaging. This design strategy provides a new method for in situ monitoring of miRNA-regulated apoptosis in cancer cells that is beneficial for assessing the feasibility of miRNA-targeted therapy. We anticipate that the nanoprobe could be a promising tool for evaluating anti-cancer drugs targeting miRNA and personalized therapy.
Supplementary Materials
The following supporting information can be downloaded at: https://www.mdpi.com/article/10.3390/pharmaceutics14071349/s1. Figure S1: DLS spectra of AuNPs (red) and Au@PDA NPs (blue); Figure S2: The kinetic fluorescence spectra of the nanoprobe in the presence of miRNA-21 (A) and caspase-3 (B); Figure S3: Bright field images of cells treated with Au@PDA NPs or Au@PDA-ssDNA-peptide NPs; Figure S4: Grayscale values of fluorescence intensities obtained from CLSM to quantitatively reveal the different expression levels of miRNA-21 and caspase-3 in Hela and A549 cells after treated with different drugs; Figure S5: Grayscale values of fluorescence intensities obtained from CLSM to quantitatively reveal the different expression levels of miRNA-21 and caspase-3 in Hela and A549 cells after transfected with miRNA-21 mimics or inhibitor; Table S1: DNA sequence and peptide information.
Author Contributions
Conceptualization, M.L., M.R. and N.W.; methodology, M.L. and M.R.; software, M.R.; validation, M.L. and M.R.; formal analysis, M.L., M.R., Z.C. and C.G.; investigation, M.L., M.R., Z.C. and C.G.; resources, M.L.; data curation, M.R.; writing—original draft preparation, M.L. and M.R.; writing—review and editing, M.L., M.R., Z.C., C.G. and L.Y.; visualization, M.L. and M.R.; supervision, M.L.; funding acquisition, M.L., W.H., J.X. and L.Y. All authors have read and agreed to the published version of the manuscript.
Funding
This work was supported by the National Natural Science Foundation of China (Nos. 21904074, 22178184, 22073053, 22174083, and 21804077), the Natural Science Foundation of Shandong Province (No. ZR2021MB007), the Young Taishan Scholar Program of Shandong Province (No. tsqn201909139), the Program for Scientific Research Innovation Teams in Colleges and Universities of Jinan (No.2021GXRC042) and the Start-up Fund of Qilu University of Technology (Shandong Academy of Sciences).
Institutional Review Board Statement
Not applicable.
Informed Consent Statement
Not applicable.
Data Availability Statement
The authors confirm the data supporting the findings of this study.
Conflicts of Interest
The authors declare no conflict of interest.
References
- Hodson, R. Precision medicine. Nature 2016, 537, S49. [Google Scholar] [CrossRef] [PubMed] [Green Version]
- Ambros, V. The functions of animal microRNAs. Nature 2004, 431, 350–355. [Google Scholar] [CrossRef] [PubMed]
- Lu, J.; Getz, G.; Miska, E.A.; Alvarez-Saavedra, E.; Lamb, J.; Peck, D.; Sweet-Cordero, A.; Ebert, B.L.; Mak, R.H.; Ferrando, A.A.; et al. MicroRNA expression profiles classify human cancers. Nature 2005, 435, 834–838. [Google Scholar] [CrossRef] [PubMed]
- Yerukala Sathipati, S.; Ho, S.-Y. Identifying a miRNA signature for predicting the stage of breast cancer. Sci. Rep. UK 2018, 8, 16138. [Google Scholar] [CrossRef] [PubMed] [Green Version]
- Kouri, F.M.; Ritner, C.; Stegh, A.H. miRNA-182 and the regulation of the glioblastoma phenotype-toward miRNA-based precision therapeutics. Cell Cycle 2015, 14, 3794–3800. [Google Scholar] [CrossRef] [Green Version]
- Zhong, S.; Golpon, H.; Zardo, P.; Borlak, J. miRNAs in lung cancer. A systematic review identifies predictive and prognostic miRNA candidates for precision medicine in lung cancer. Transl. Res. 2021, 230, 164–196. [Google Scholar] [CrossRef]
- Zhang, Y.; Wang, H.; Mao, X.; Guo, Q.; Li, W.; Wang, X.; Li, G.; Jiang, Q.; Lin, N. A Novel Circulating miRNA-Based Model Predicts the Response to Tripterysium Glycosides Tablets: Moving Toward Model-Based Precision Medicine in Rheumatoid Arthritis. Front. Pharmacol. 2018, 9, 378. [Google Scholar] [CrossRef] [Green Version]
- Zhao, Q.; Chen, S.; Zhu, Z.; Yu, L.; Ren, Y.; Jiang, M.; Weng, J.; Li, B. miR-21 promotes EGF-induced pancreatic cancer cell proliferation by targeting Spry2. Cell Death Dis. 2018, 9, 1157. [Google Scholar] [CrossRef]
- Ma, Q.; Wu, H.; Xiao, Y.; Liang, Z.; Liu, T. Upregulation of exosomal microRNA-21 in pancreatic stellate cells promotes pancreatic cancer cell migration and enhances Ras/ERK pathway activity. Int. J. Oncol. 2020, 56, 1025–1033. [Google Scholar] [CrossRef]
- Chan, J.K.; Blansit, K.; Kiet, T.; Sherman, A.; Wong, G.; Earle, C.; Bourguignon, L.Y.W. The inhibition of miR-21 promotes apoptosis and chemosensitivity in ovarian cancer. Gynecol. Oncol. 2014, 132, 739–744. [Google Scholar] [CrossRef]
- Li, B.; Ren, S.; Li, X.; Wang, Y.; Garfield, D.; Zhou, S.; Chen, X.; Su, C.; Chen, M.; Kuang, P.; et al. MiR-21 overexpression is associated with acquired resistance of EGFR-TKI in non-small cell lung cancer. Lung Cancer 2014, 83, 146–153. [Google Scholar] [CrossRef]
- Liu, H.; Wang, J.; Tao, Y.; Li, X.; Qin, J.; Bai, Z.; Chi, B.; Yan, W.; Chen, X. Curcumol inhibits colorectal cancer proliferation by targeting miR-21 and modulated PTEN/PI3K/Akt pathways. Life Sci. 2019, 221, 354–361. [Google Scholar] [CrossRef]
- Boyerinas, B.; Park, S.-M.; Hau, A.; Murmann, A.E.; Peter, M.E. The role of let-7 in cell differentiation and cancer. Endocr. -Relat. Cancer 2010, 17, F19–F36. [Google Scholar] [CrossRef]
- Luo, C.; Qiu, J. miR-181a Inhibits Cervical Cancer Development via Downregulating GRP78. Oncol. Res. 2017, 25, 1341–1348. [Google Scholar] [CrossRef]
- Dong, H.; Lei, J.; Ding, L.; Wen, Y.; Ju, H.; Zhang, X. MicroRNA: Function, Detection, and Bioanalysis. Chem. Rev. 2013, 113, 6207–6233. [Google Scholar] [CrossRef]
- Pritchard, C.C.; Cheng, H.H.; Tewari, M. MicroRNA profiling: Approaches and considerations. Nat. Rev. Genet. 2012, 13, 358–369. [Google Scholar] [CrossRef]
- Skliris, G.P.; Parkes, A.T.; Limer, J.L.; Burdall, S.E.; Carder, P.J.; Speirs, V. Evaluation of seven oestrogen receptor β antibodies for immunohistochemistry, western blotting, and flow cytometry in human breast tissue. J. Pathol. 2002, 197, 155–162. [Google Scholar] [CrossRef]
- Huerta, S.; Goulet, E.J.; Huerta-Yepez, S.; Livingston, E.H. Screening and Detection of Apoptosis. J. Surg.Res. 2007, 139, 143–156. [Google Scholar] [CrossRef]
- Blankenberg, F.G. In Vivo Detection of Apoptosis. J. Nucl. Med. 2008, 49, 81S. [Google Scholar] [CrossRef] [Green Version]
- Niles, A.L.; Moravec, R.A.; Riss, T.L. Caspase activity assays. Apoptosis Cancer 2008, 137–150. [Google Scholar] [CrossRef]
- Lichtman, J.W.; Conchello, J.-A. Fluorescence microscopy. Nat. Methods 2005, 2, 910–919. [Google Scholar] [CrossRef]
- Afzalinia, A.; Mirzaee, M. Ultrasensitive Fluorescent miRNA Biosensor Based on a “Sandwich” Oligonucleotide Hybridization and Fluorescence Resonance Energy Transfer Process Using an Ln(III)-MOF and Ag Nanoparticles for Early Cancer Diagnosis: Application of Central Composite Design. ACS Appl. Mater. Inter. 2020, 12, 16076–16087. [Google Scholar] [CrossRef]
- Wu, Y.; Huang, J.; Yang, X.; Yang, Y.; Quan, K.; Xie, N.; Li, J.; Ma, C.; Wang, K. Gold Nanoparticle Loaded Split-DNAzyme Probe for Amplified miRNA Detection in Living Cells. Anal. Chem. 2017, 89, 8377–8383. [Google Scholar] [CrossRef]
- Chen, W.; Yue, X.; Zhang, H.; Li, W.; Zhang, L.; Xiao, Q.; Huang, C.; Sheng, J.; Song, X. Simultaneous Detection of Glutathione and Hydrogen Polysulfides from Different Emission Channels. Anal. Chem. 2017, 89, 12984–12991. [Google Scholar] [CrossRef]
- Pan, W.; Liu, X.; Wan, X.; Li, J.; Li, Y.; Lu, F.; Li, N.; Tang, B. Rapid Preparation of Au–Se–Peptide Nanoprobe Based on a Freezing Method for Bioimaging. Anal. Chem. 2019, 91, 15982–15987. [Google Scholar] [CrossRef]
- Luan, M.; Li, N.; Pan, W.; Yang, L.; Yu, Z.; Tang, B. Simultaneous detection of multiple targets involved in the PI3K/AKT pathway for investigating cellular migration and invasion with a multicolor fluorescent nanoprobe. Chem. Commun. 2017, 53, 356–359. [Google Scholar] [CrossRef]
- Yin, X.; Hou, T.; Huang, B.; Yang, L.; Li, F. Aptamer recognition-trigged label-free homogeneous electrochemical strategy for an ultrasensitive cancer-derived exosome assay. Chem. Commun. 2019, 55, 13705–13708. [Google Scholar] [CrossRef]
- Jiang, T.; Wang, X.; Wang, G.; Wang, Y.; Wang, K.; Xuan, X.; Chen, C.; Jiang, K.; Zhang, H. Light-activated “cycle-reversible intramolecular charge transfer” fluorescent probe: Monitoring of pHi trace change induced by UV light in programmed cell death. Chem. Commun. 2019, 55, 5279–5282. [Google Scholar] [CrossRef]
- Zhang, H.; Shi, L.; Li, K.; Liu, X.; Won, M.; Liu, Y.Z.; Choe, Y.; Liu, X.Y.; Liu, Y.H.; Chen, S.Y. Discovery of an Ultra-rapid and Sensitive Lysosomal Fluorescence Lipophagy Process. Angew. Chem. 2022, 134, e202116439. [Google Scholar]
- Zhao, C.; Qiu, L.; Lv, P.; Han, A.; Fang, G.; Liu, J.; Wang, S. AuNP-peptide probe for caspase-3 detection in living cells by SERS. Analyst 2019, 144, 1275–1281. [Google Scholar] [CrossRef]
- Liu, Y.; Jiang, L.; Fan, X.; Liu, P.; Xu, S.; Luo, X. Intracellular fluorometric determination of microRNA-21 by using a switch-on nanoprobe composed of carbon nanotubes and gold nanoclusters. Microchim. Acta 2019, 186, 447. [Google Scholar] [CrossRef] [PubMed]
- Zuo, C.; Guo, Y.; Li, J.; Peng, Z.; Bai, S.; Yang, S.; Wang, D.; Chen, H.; Xie, G. A nanoprobe for fluorescent monitoring of microRNA and targeted delivery of drugs. RSC Adv. 2021, 11, 8871–8878. [Google Scholar] [CrossRef] [PubMed]
- Yang, L.; Yin, X.; An, B.; Li, F. Precise Capture and Direct Quantification of Tumor Exosomes via a Highly Efficient Dual-Aptamer Recognition-Assisted Ratiometric Immobilization-Free Electrochemical Strategy. Anal. Chem. 2021, 93, 1709–1716. [Google Scholar] [CrossRef] [PubMed]
- Qiang, W.; Li, W.; Li, X.; Chen, X.; Xu, D. Bioinspired polydopamine nanospheres: A superquencher for fluorescence sensing of biomolecules. Chem. Sci. 2014, 5, 3018–3024. [Google Scholar] [CrossRef]
- Liu, X.; Cao, J.; Li, H.; Li, J.; Jin, Q.; Ren, K.; Ji, J. Mussel-Inspired Polydopamine: A Biocompatible and Ultrastable Coating for Nanoparticles in Vivo. ACS Nano 2013, 7, 9384–9395. [Google Scholar] [CrossRef]
- Xing, Y.; Zhang, J.; Chen, F.; Liu, J.; Cai, K. Mesoporous polydopamine nanoparticles with co-delivery function for overcoming multidrug resistance via synergistic chemo-photothermal therapy. Nanoscale 2017, 9, 8781–8790. [Google Scholar] [CrossRef]
- Armada-Moreira, A.; Taipaleenmäki, E.; Baekgaard-Laursen, M.; Schattling, P.S.; Sebastião, A.M.; Vaz, S.H.; Städler, B. Platinum Nanoparticle-Based Microreactors as Support for Neuroblastoma Cells. ACS Appl. Mater. Inter. 2018, 10, 7581–7592. [Google Scholar] [CrossRef]
- Black, K.C.L.; Yi, J.; Rivera, J.G.; Zelasko-Leon, D.C.; Messersmith, P.B. Polydopamine-enabled surface functionalization of gold nanorods for cancer cell-targeted imaging and photothermal therapy. Nanomedicine 2012, 8, 17–28. [Google Scholar] [CrossRef] [Green Version]
- Maxwell, D.J.; Taylor, J.R.; Nie, S. Self-Assembled Nanoparticle Probes for Recognition and Detection of Biomolecules. J. Am. Chem. Soc. 2002, 124, 9606–9612. [Google Scholar] [CrossRef]
- Grabar, K.C.; Freeman, R.G.; Hommer, M.B.; Natan, M.J. Preparation and characterization of Au colloid monolayers. Anal. Chem. 1995, 67, 735–743. [Google Scholar] [CrossRef]
- Rodembusch, F.S.; Leusin, F.P.; Campo, L.F.; Stefani, V. Excited state intramolecular proton transfer in amino 2-(2′-hydroxyphenyl)benzazole derivatives: Effects of the solvent and the amino group position. J. Lumin. 2007, 126, 728–734. [Google Scholar] [CrossRef]
- Shi, Y.; Yi, C.; Zhang, Z.; Zhang, H.; Li, M.; Yang, M.; Jiang, Q. Peptide-Bridged Assembly of Hybrid Nanomaterial and Its Application for Caspase-3 Detection. ACS Appl. Mater. Inter. 2013, 5, 6494–6501. [Google Scholar] [CrossRef]
- Shi, H.; Kwok, R.T.; Liu, J.; Xing, B.; Tang, B.Z.; Liu, B. Real-time monitoring of cell apoptosis and drug screening using fluorescent light-up probe with aggregation-induced emission characteristics. J. Am. Chem. Soc. 2012, 134, 17972–17981. [Google Scholar] [CrossRef]
- Qi, W.; Li, H.; Cai, X.-H.; Gu, J.-Q.; Meng, J.; Xie, H.-Q.; Zhang, J.-L.; Chen, J.; Jin, X.-G.; Tang, Q.; et al. Lipoxin A4 activates alveolar epithelial sodium channel gamma via the microRNA-21/PTEN/AKT pathway in lipopolysaccharide-induced inflammatory lung injury. Lab. Investig. 2015, 95, 1258–1268. [Google Scholar] [CrossRef] [Green Version]
- Bertrand, R.; Solary, E.; O’Connor, P.; Kohn, K.W.; Pommier, Y. Induction of a Common Pathway of Apoptosis by Staurosporine. Exp. Cell Res. 1994, 211, 314–321. [Google Scholar] [CrossRef]
Publisher’s Note: MDPI stays neutral with regard to jurisdictional claims in published maps and institutional affiliations. |
© 2022 by the authors. Licensee MDPI, Basel, Switzerland. This article is an open access article distributed under the terms and conditions of the Creative Commons Attribution (CC BY) license (https://creativecommons.org/licenses/by/4.0/).