
Potential Use of Quercus dalechampii Ten. and Q. frainetto Ten. Barks Extracts as Antimicrobial, Enzyme Inhibitory, Antioxidant and Cytotoxic Agents

 ,
,  ,
, 
 ,
,  ,
,  ,
, 
 and
and 
Abstract
1. Introduction
2. Materials and Methods
2.1. Chemicals, Reagents, and Bacterial Strains
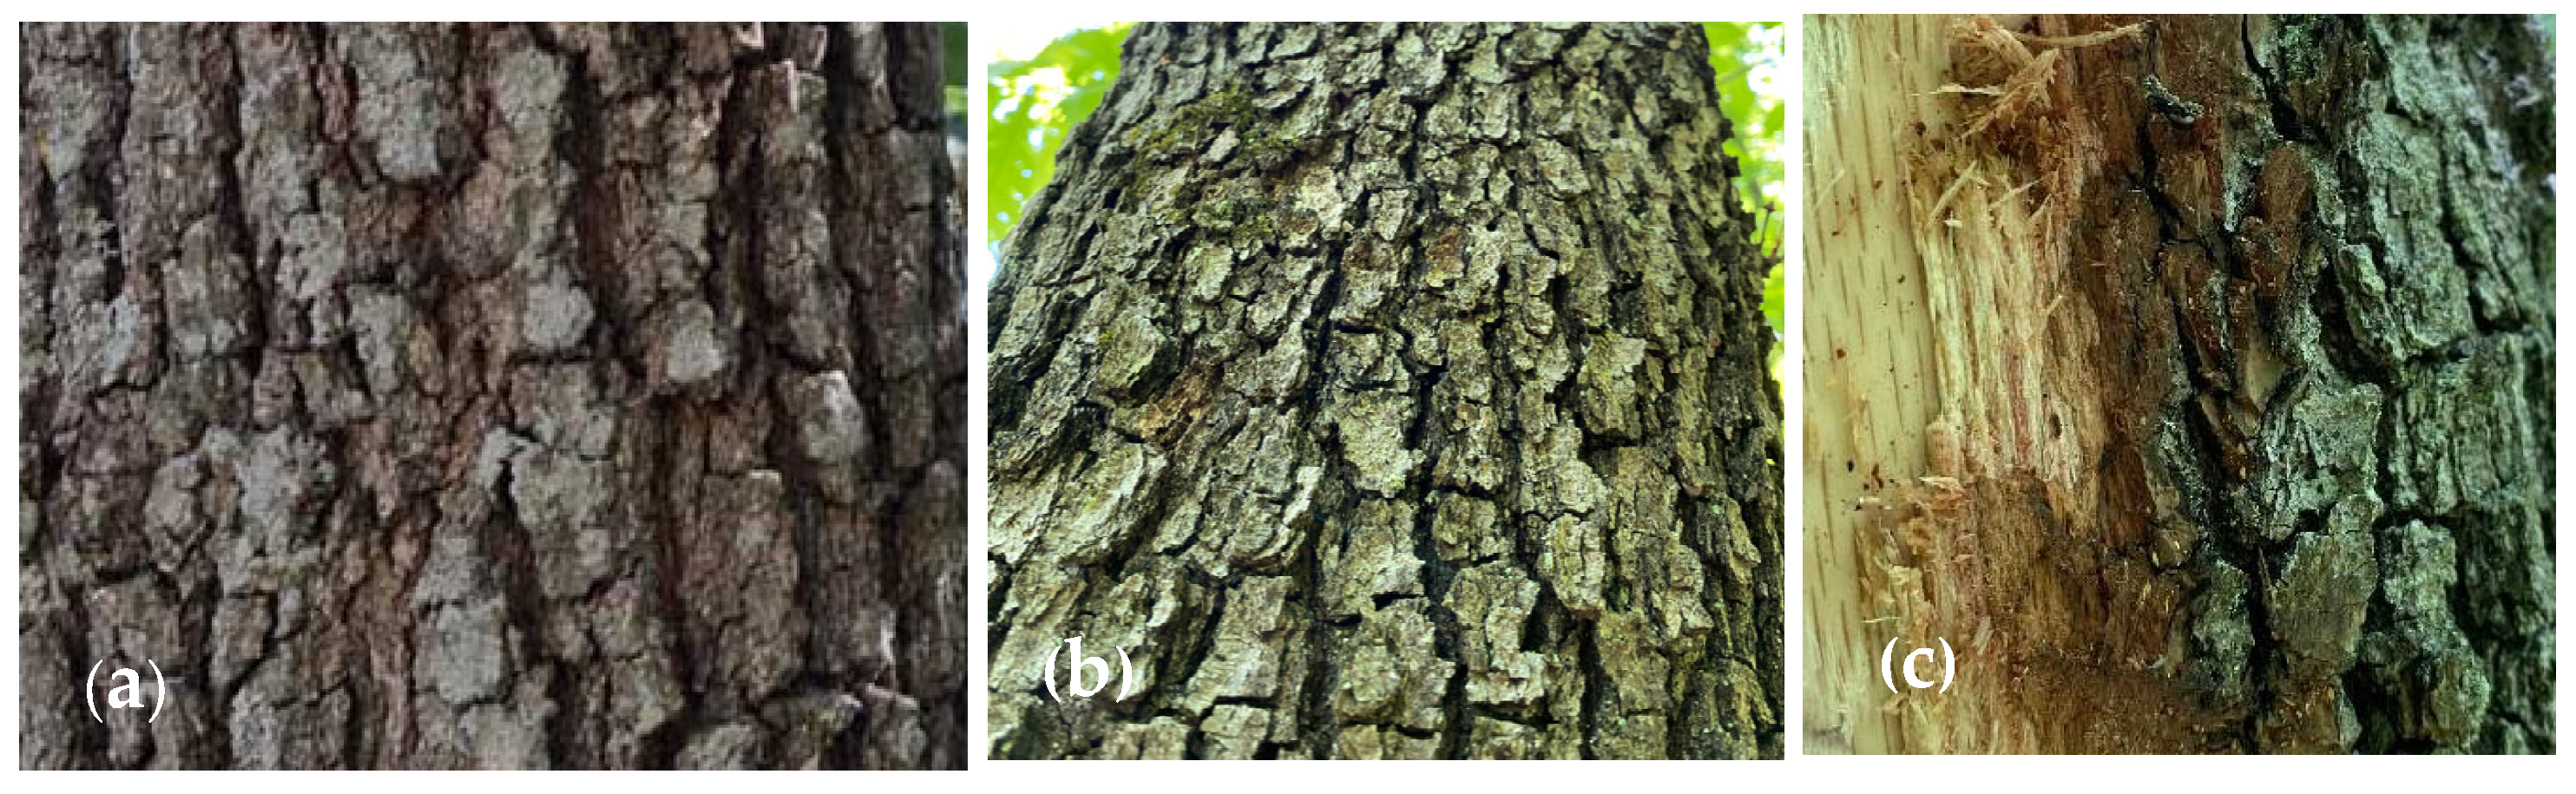
2.2. Plant Material Collection
2.3. Extraction Procedure
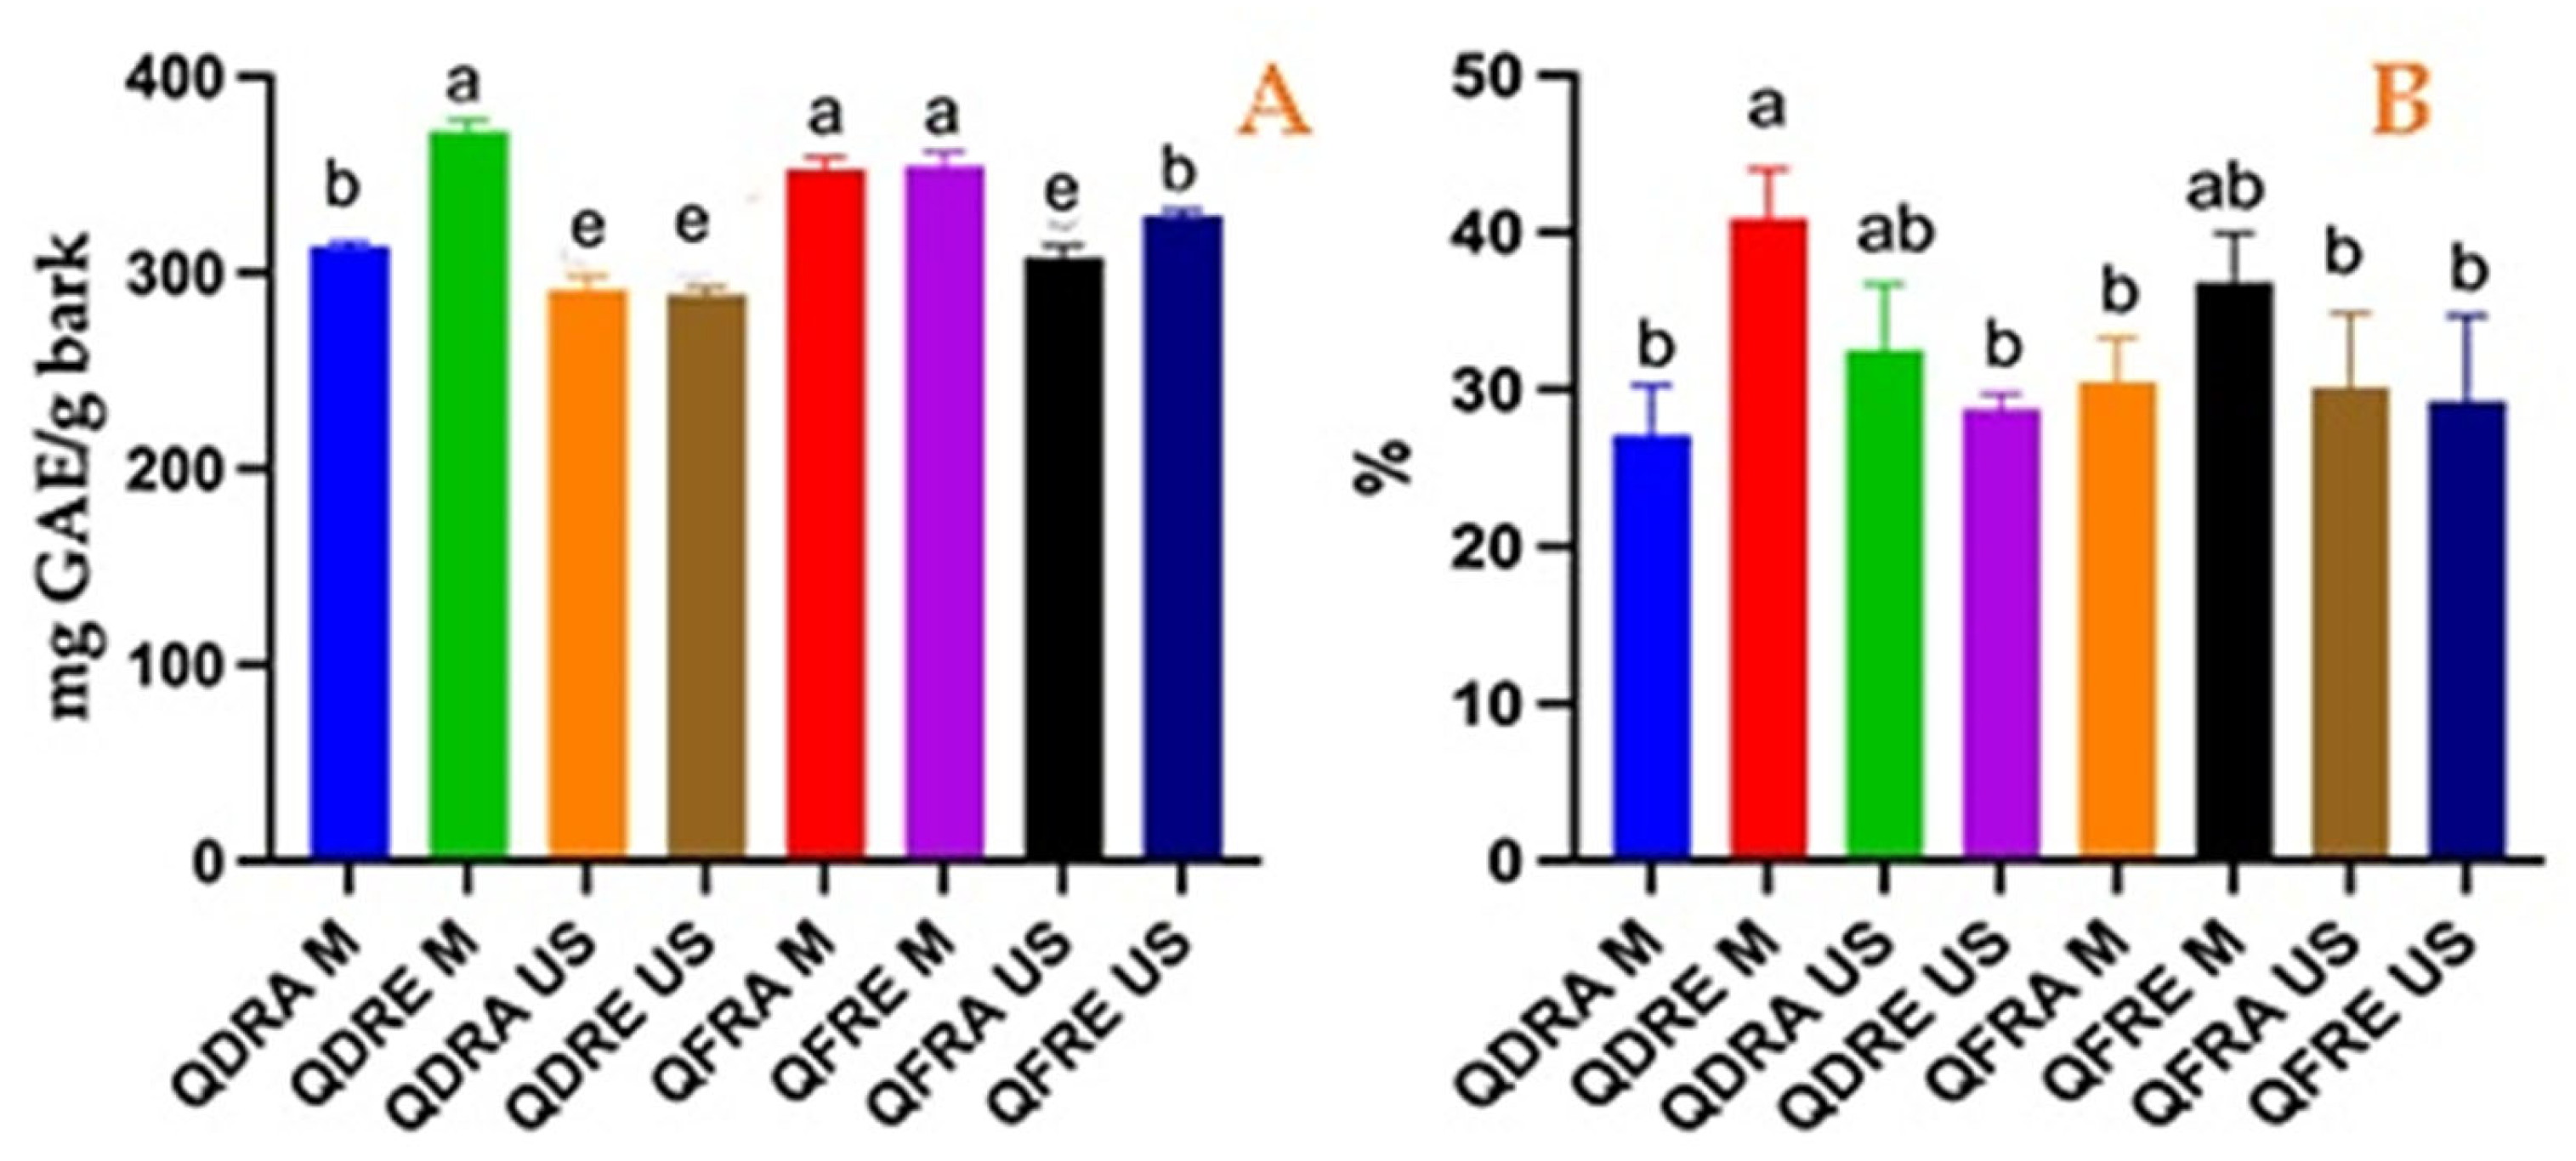
2.4. Quantification of Total Phenolic Compounds
2.5. Quantification of Total Tannins
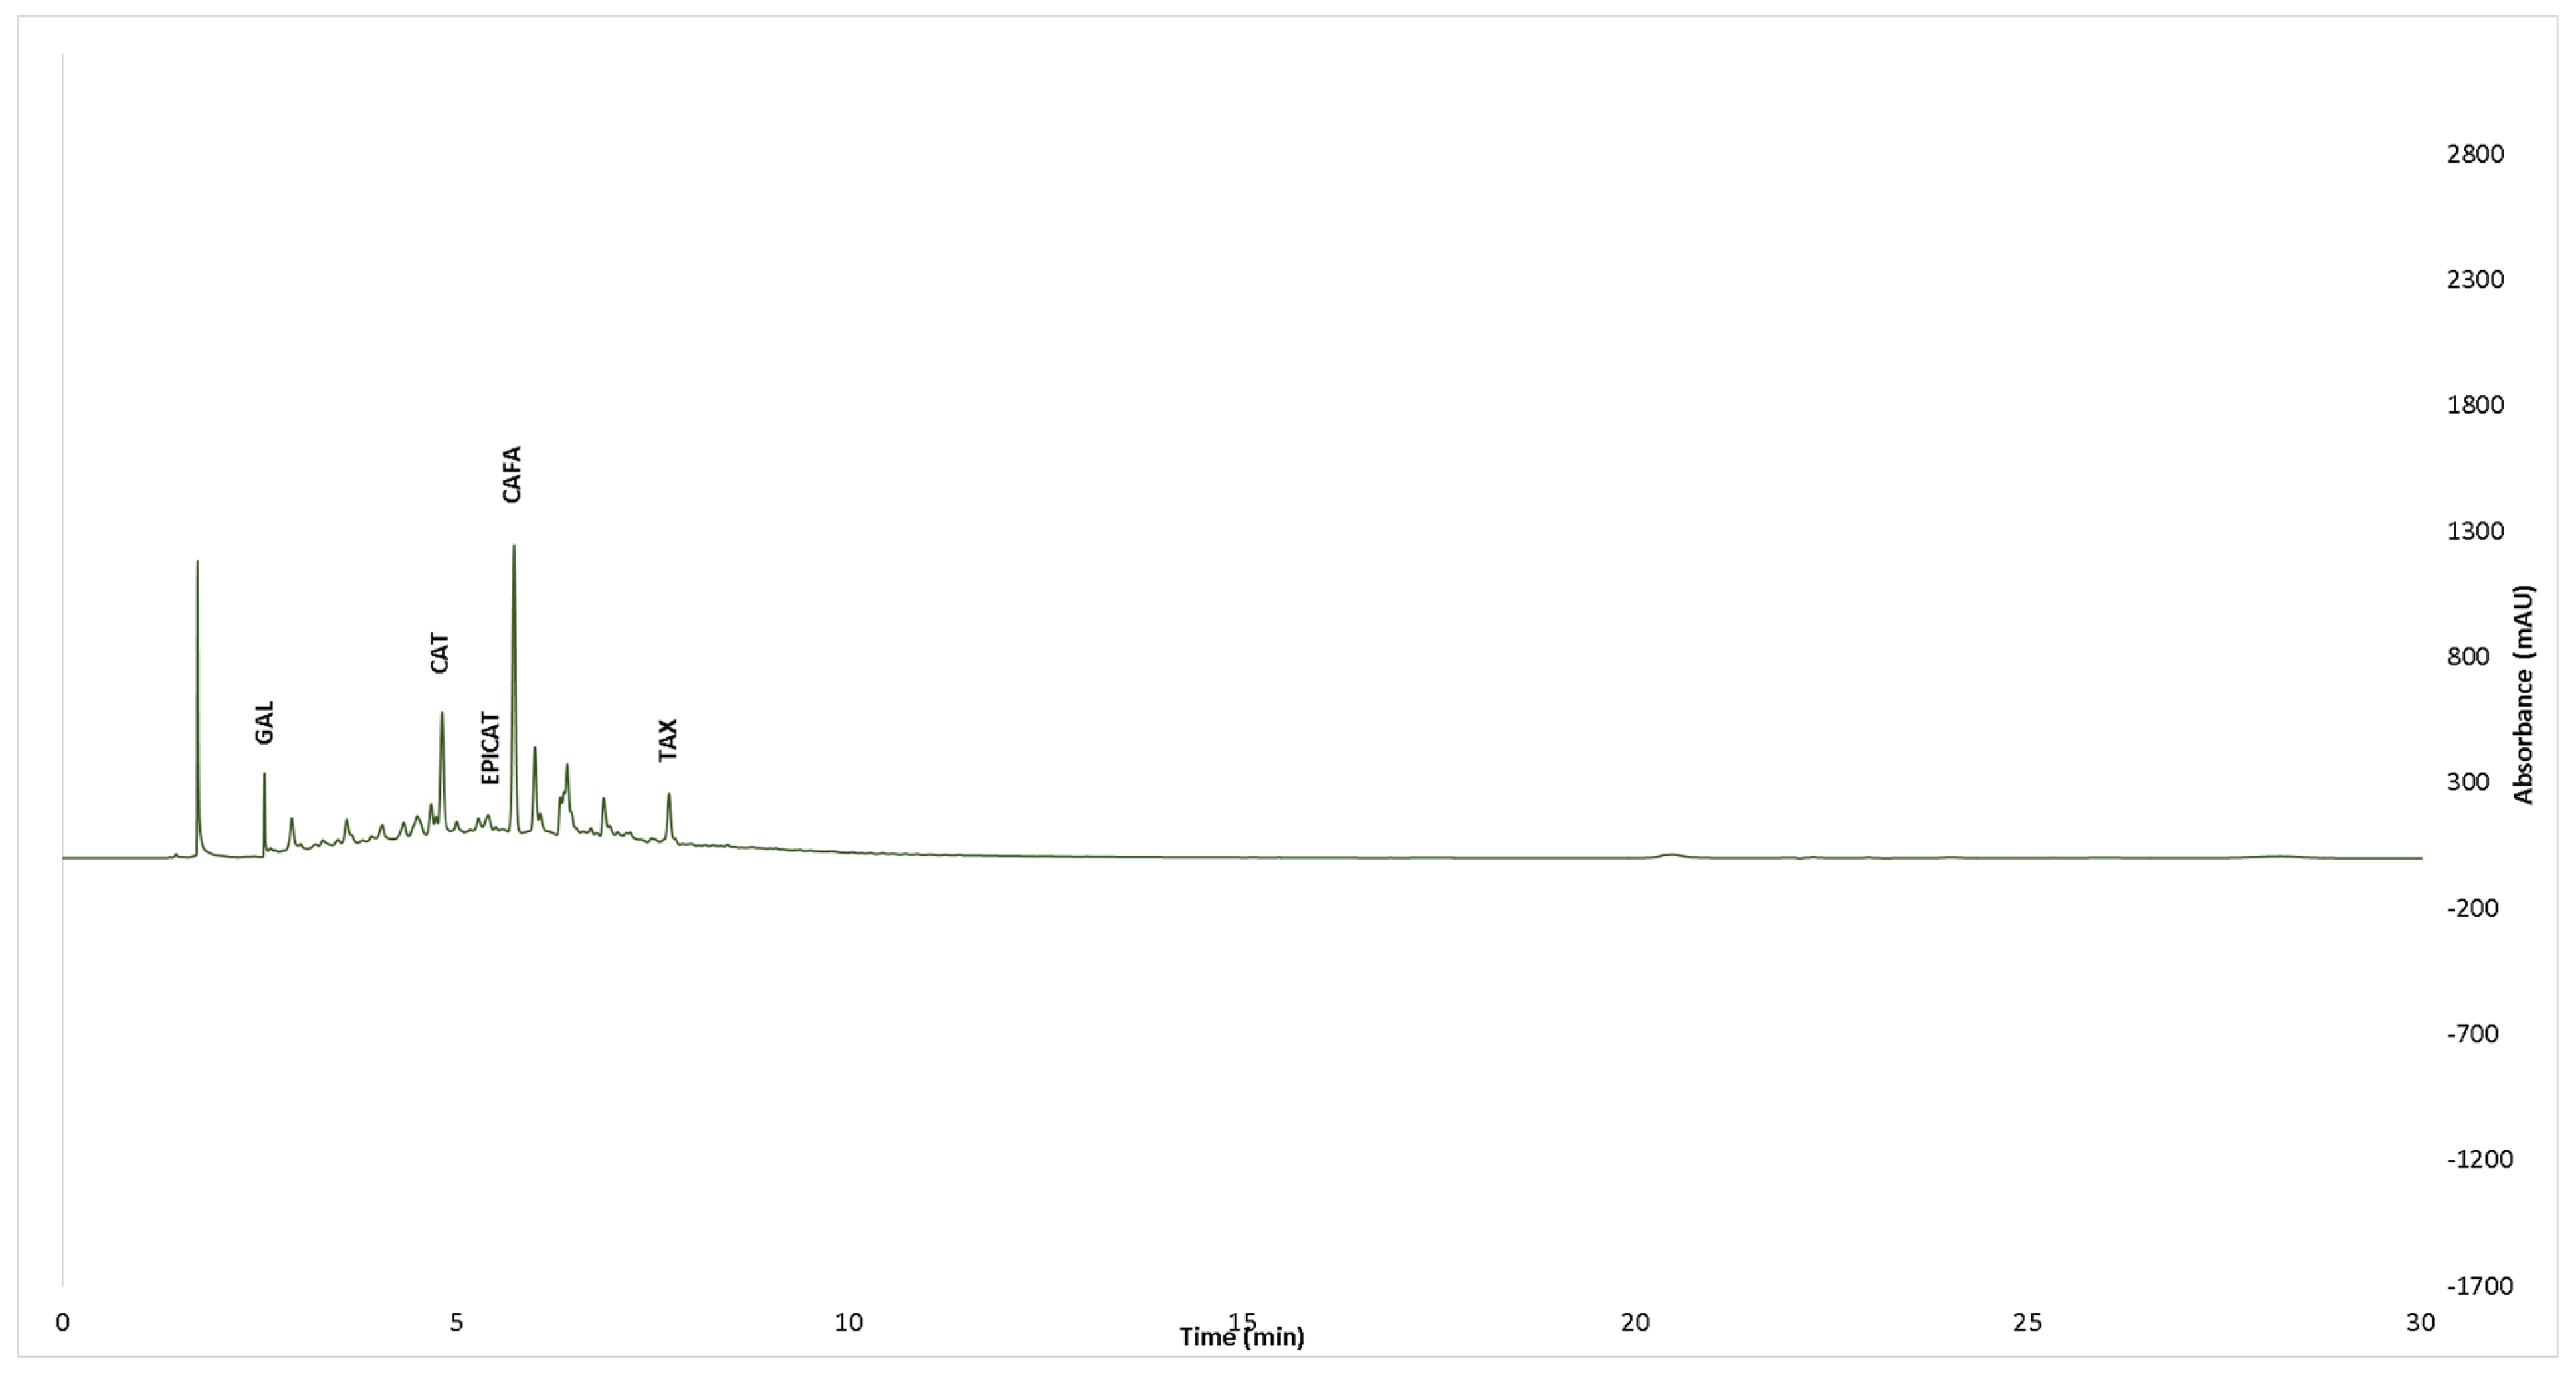
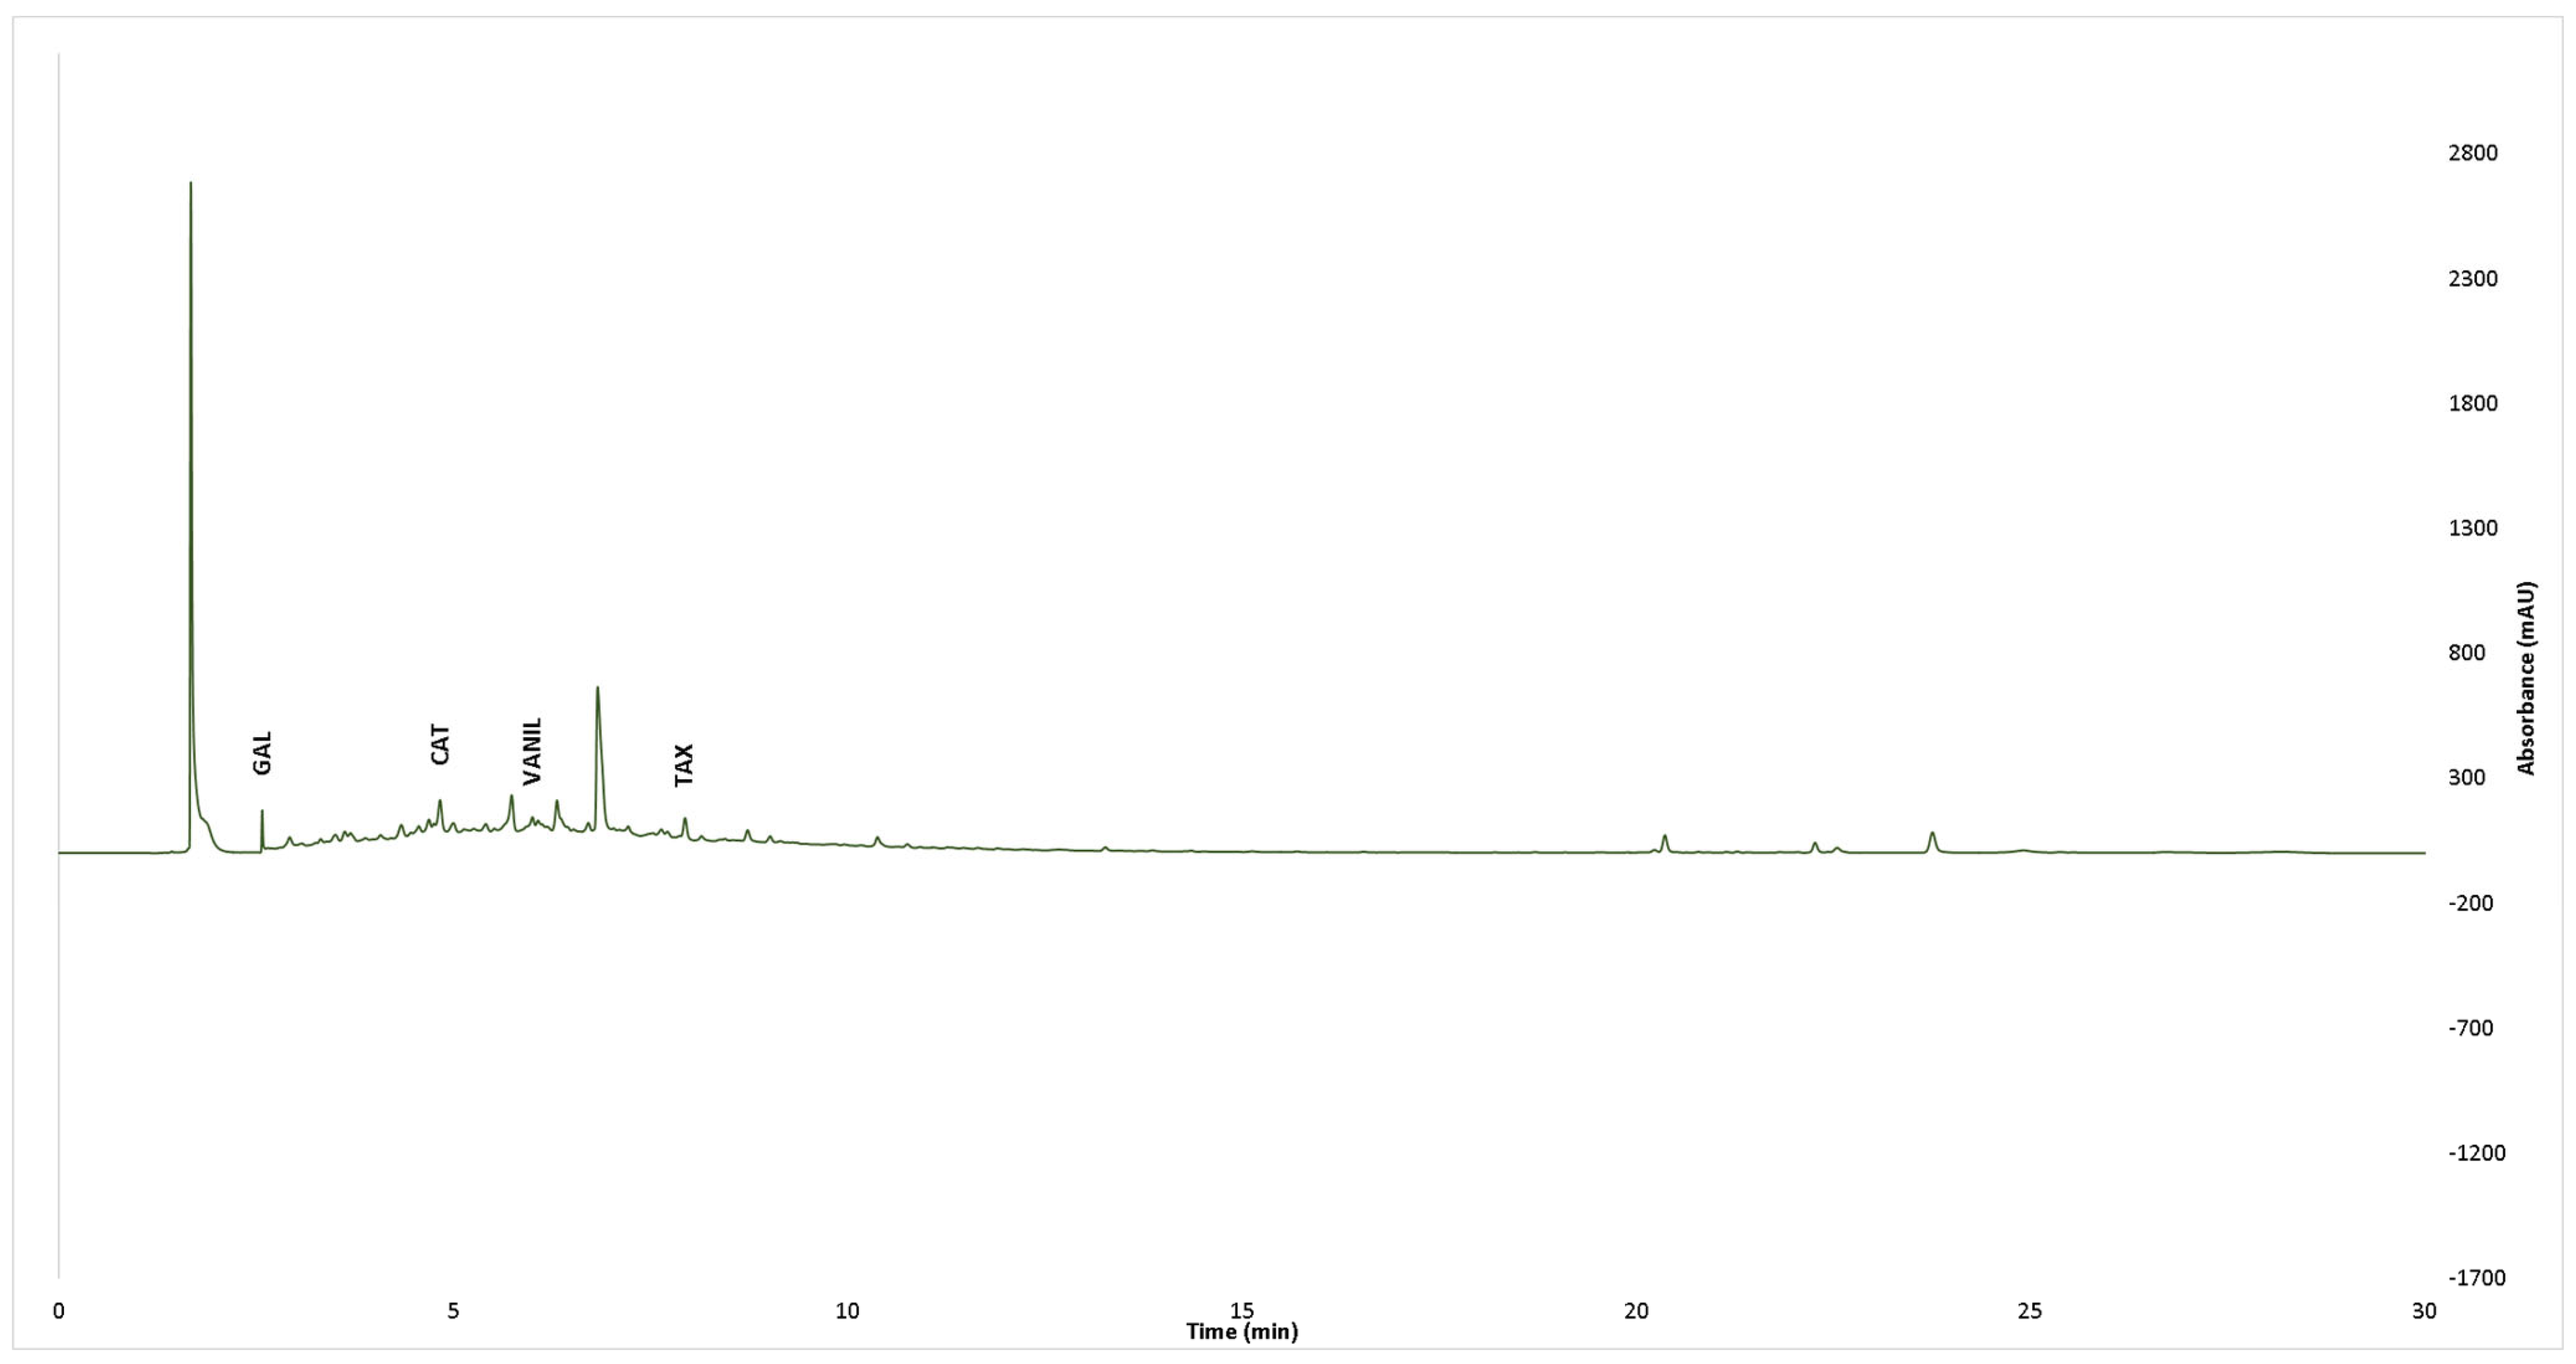
2.6. UPLC-PDA Analysis of Individual Phenolic Constituents
2.7. Antioxidant Assays
2.8. In Vitro Enzyme-Inhibitory Potential
2.9. Antimicrobial Activity Assessment
2.9.1. Antimicrobial Activity Parameters (MIC, MBC and MFC)
2.9.2. Inhibition of Biofilm Formation
2.9.3. MRSA Adhesion on Sutures
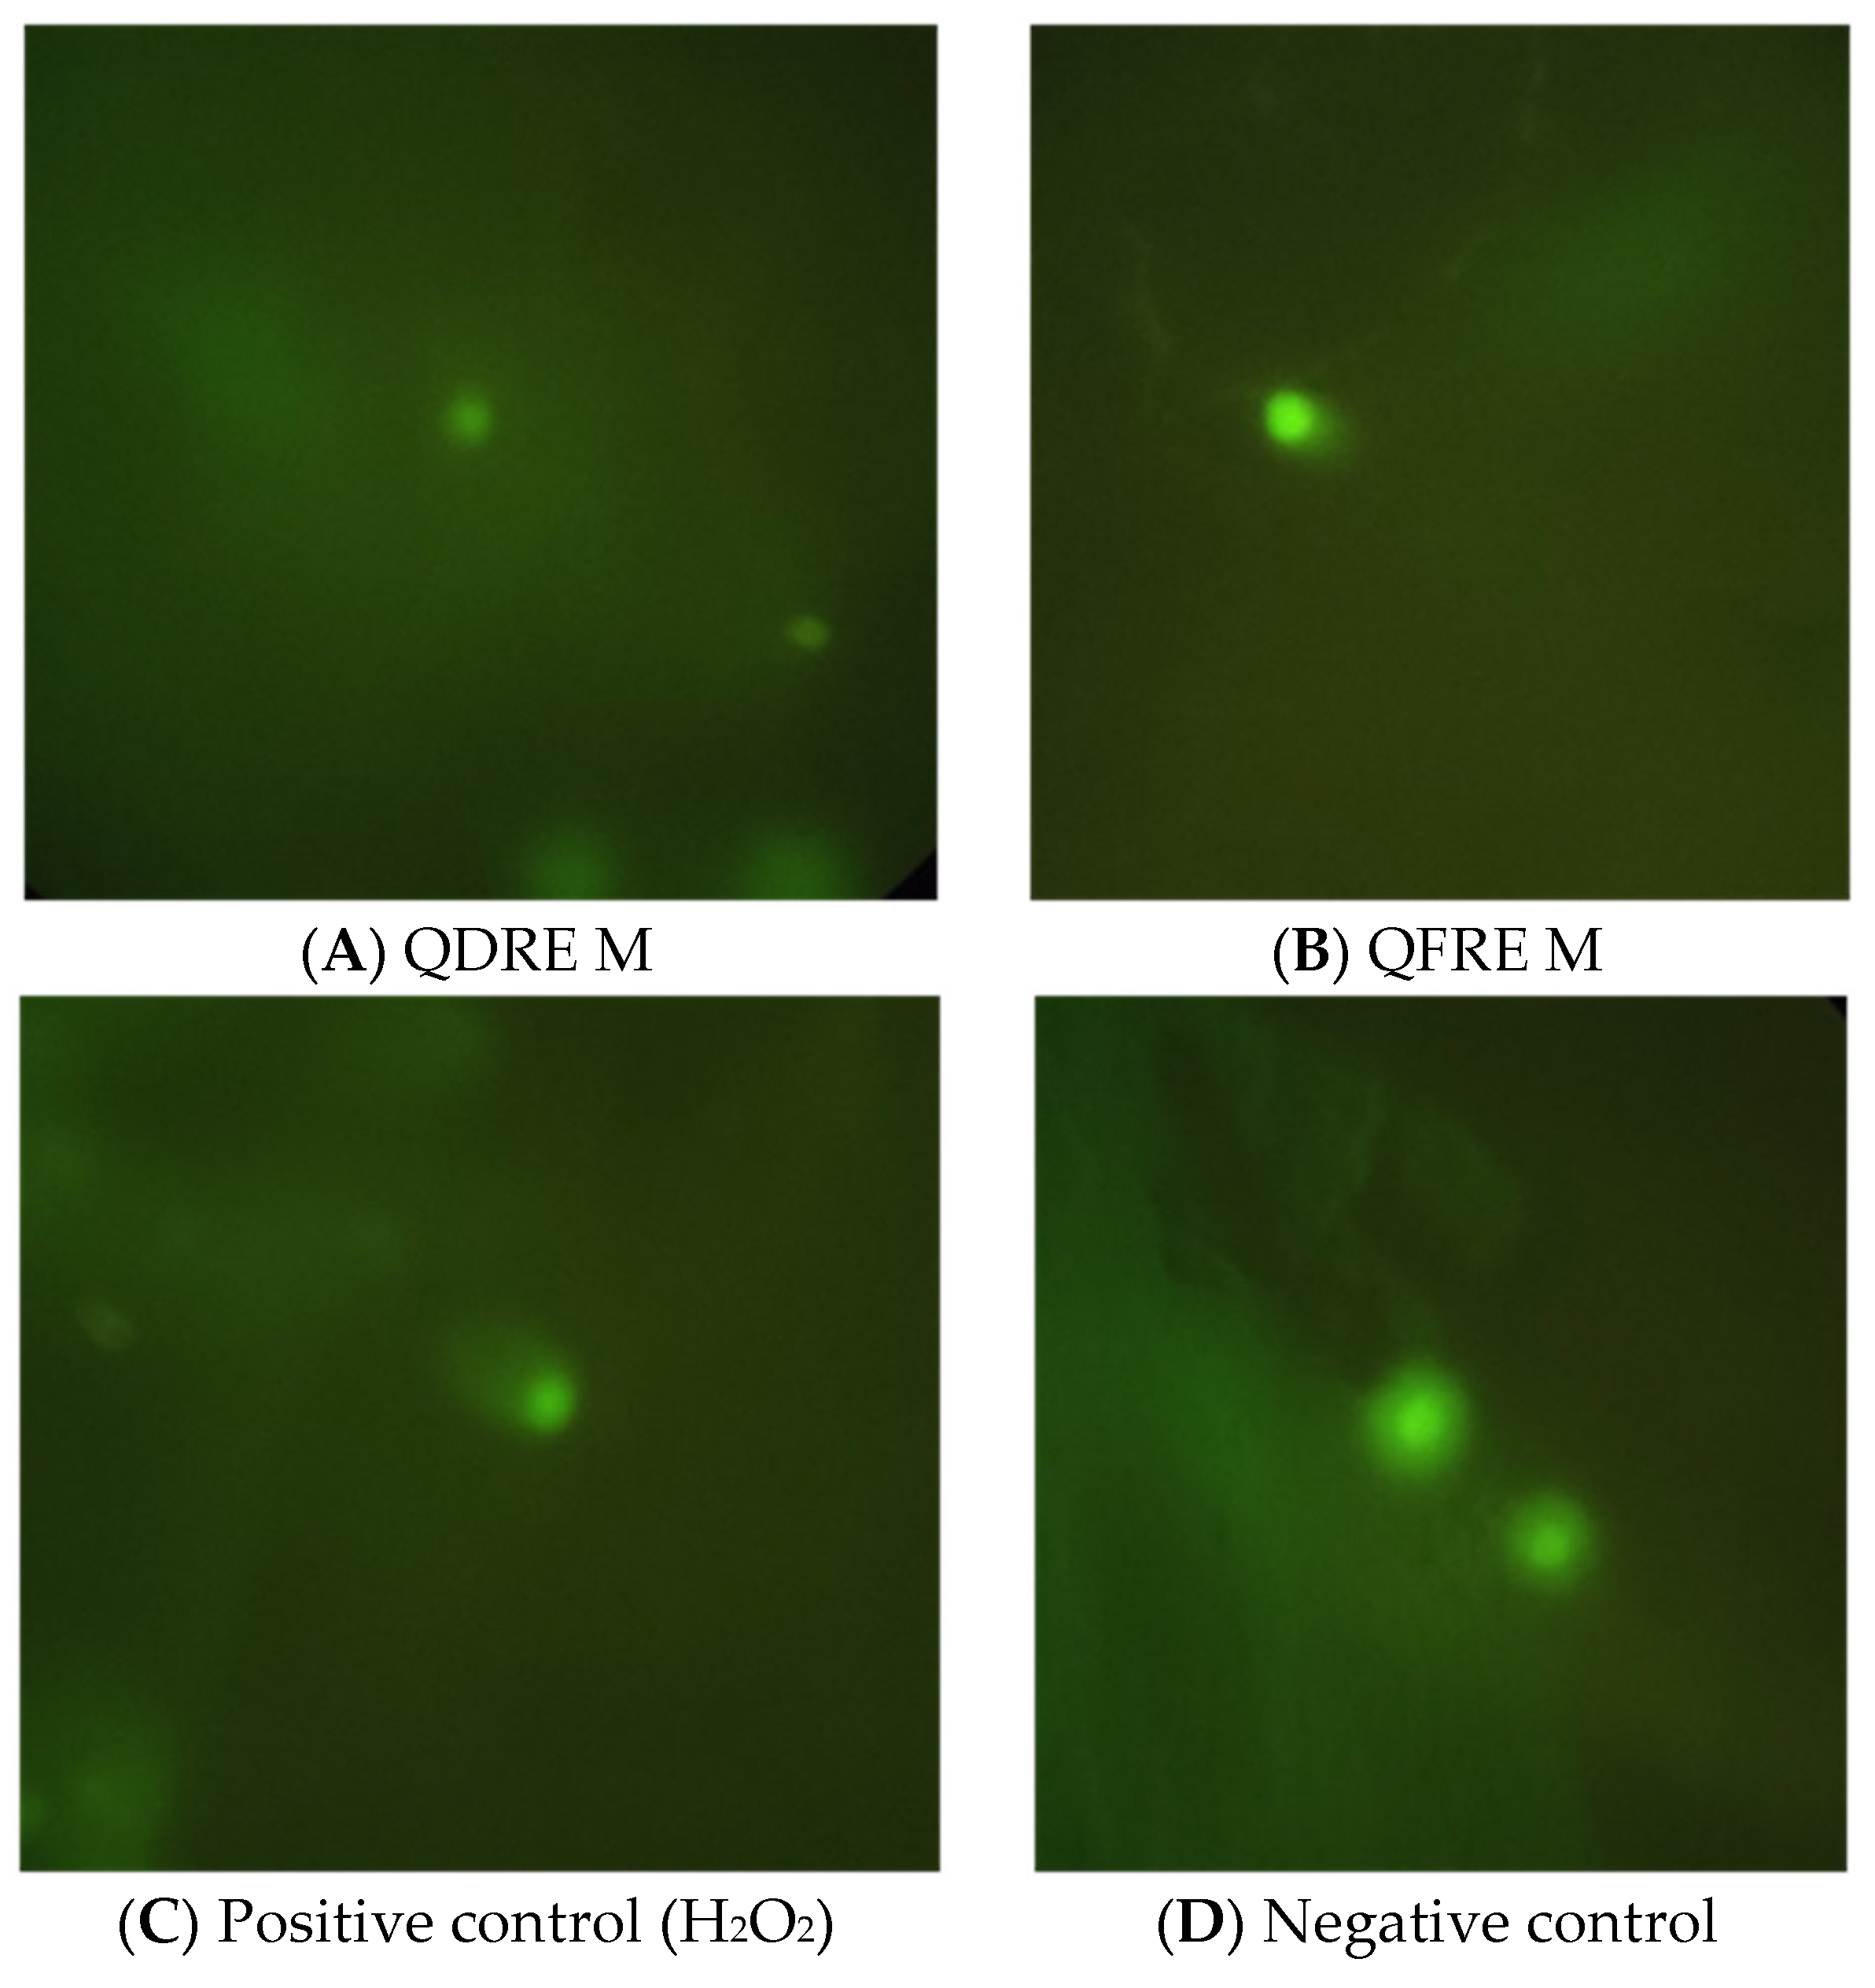
2.10. DNA Damage Assay
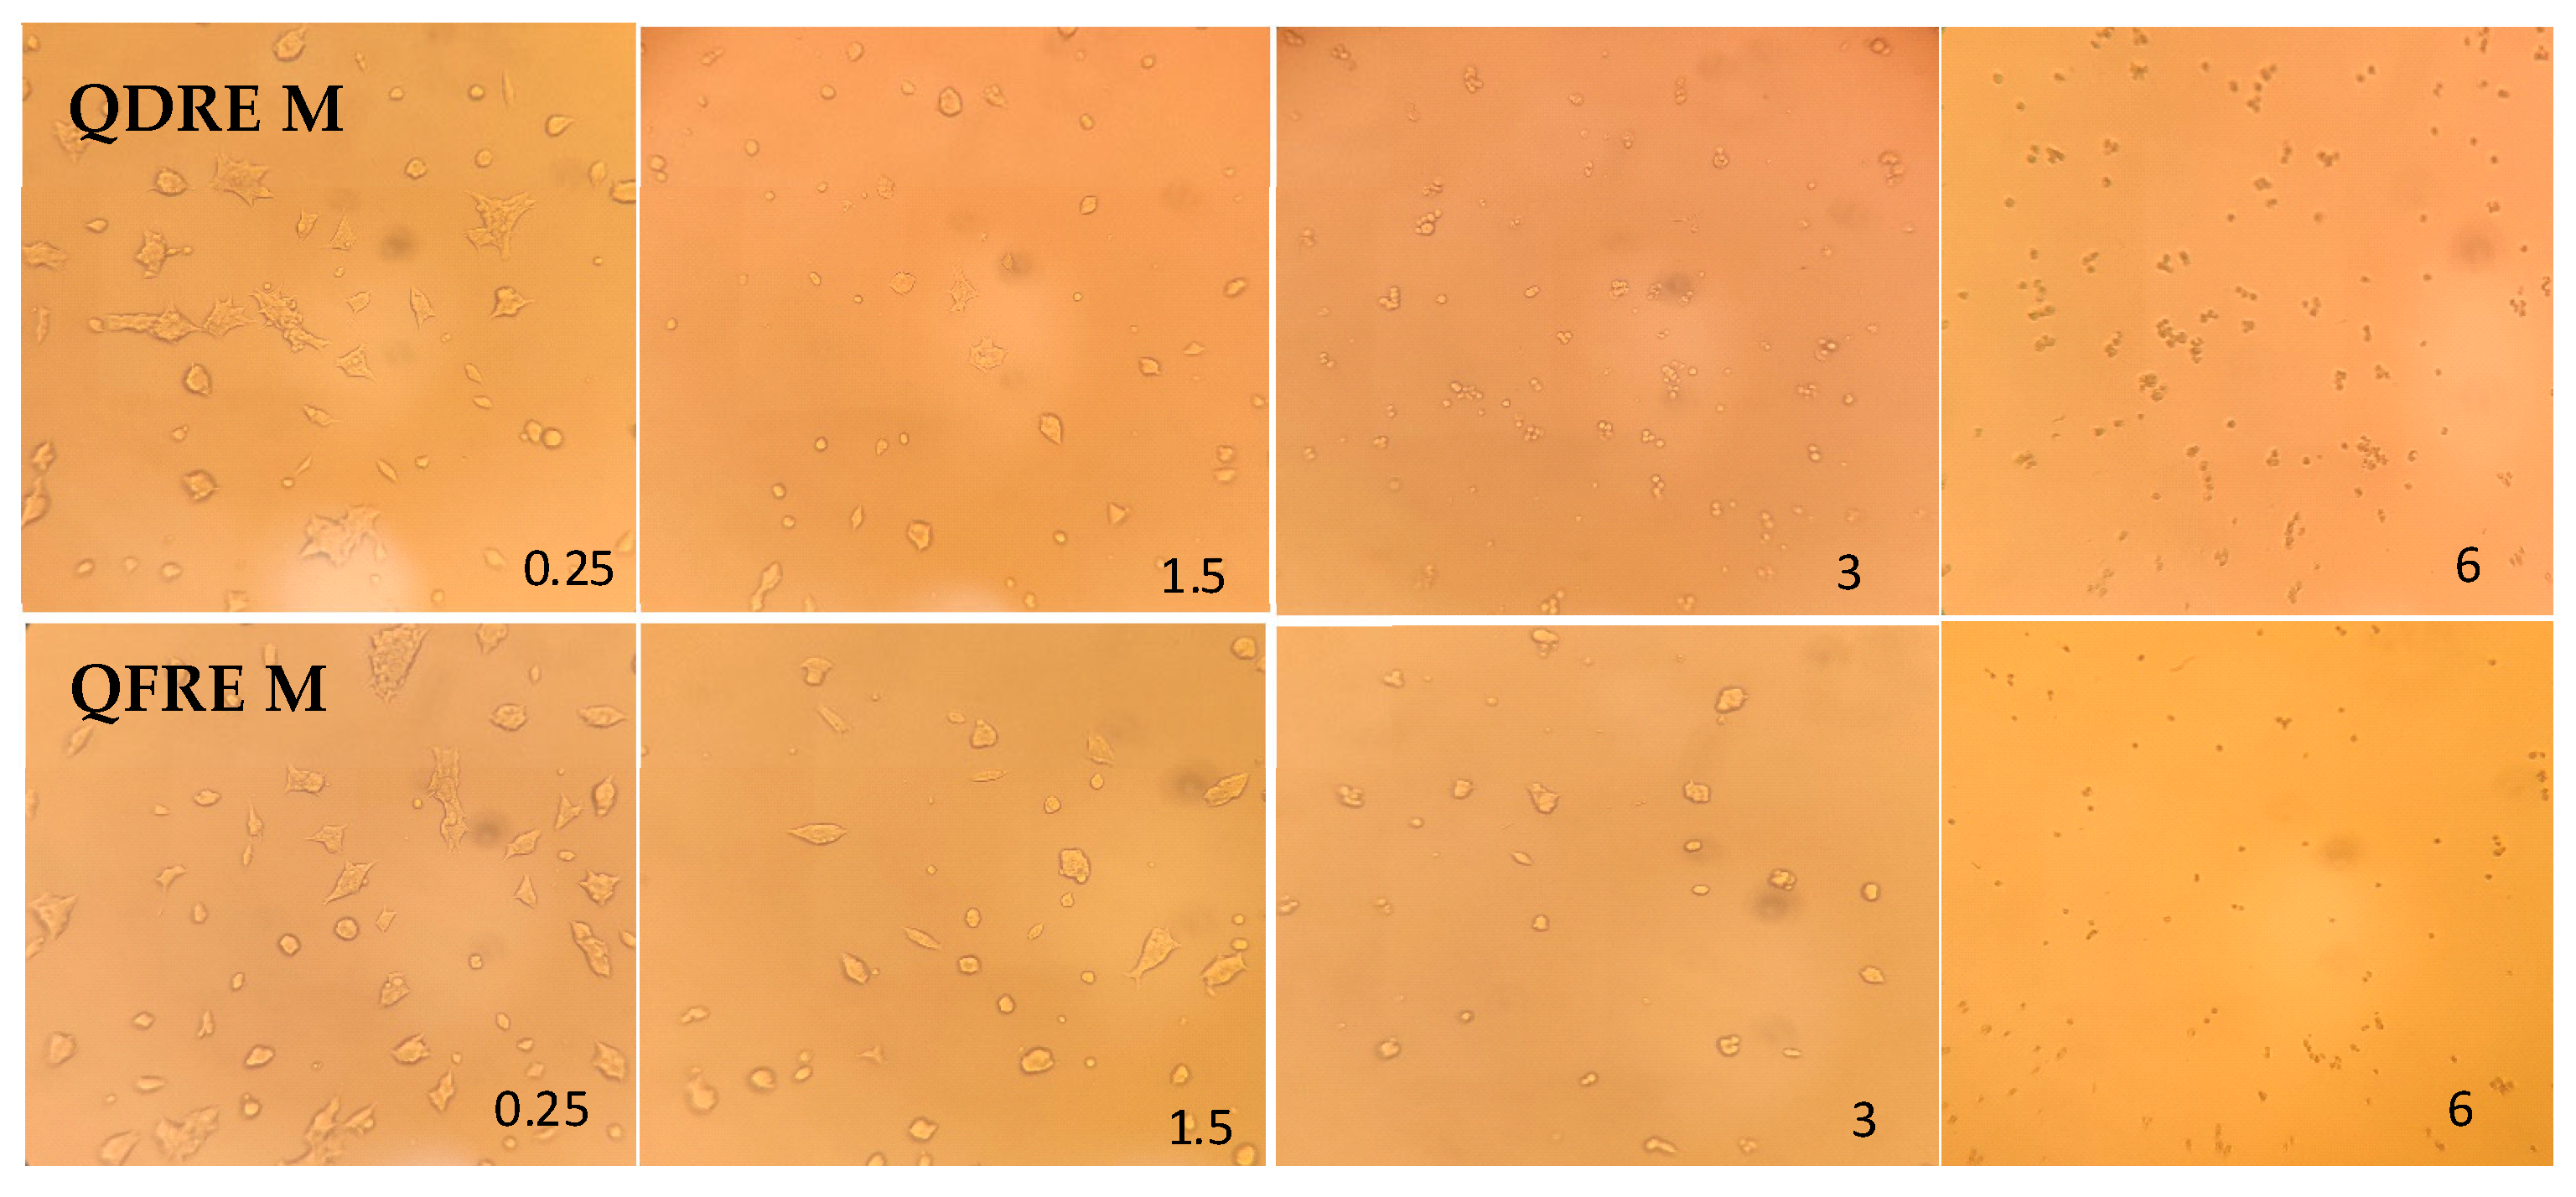
2.11. Cytotoxic Effect
2.12. Statistical Analysis
3. Results
3.1. Phytochemical Profile of the Tested Extracts
3.2. Antioxidant Potential
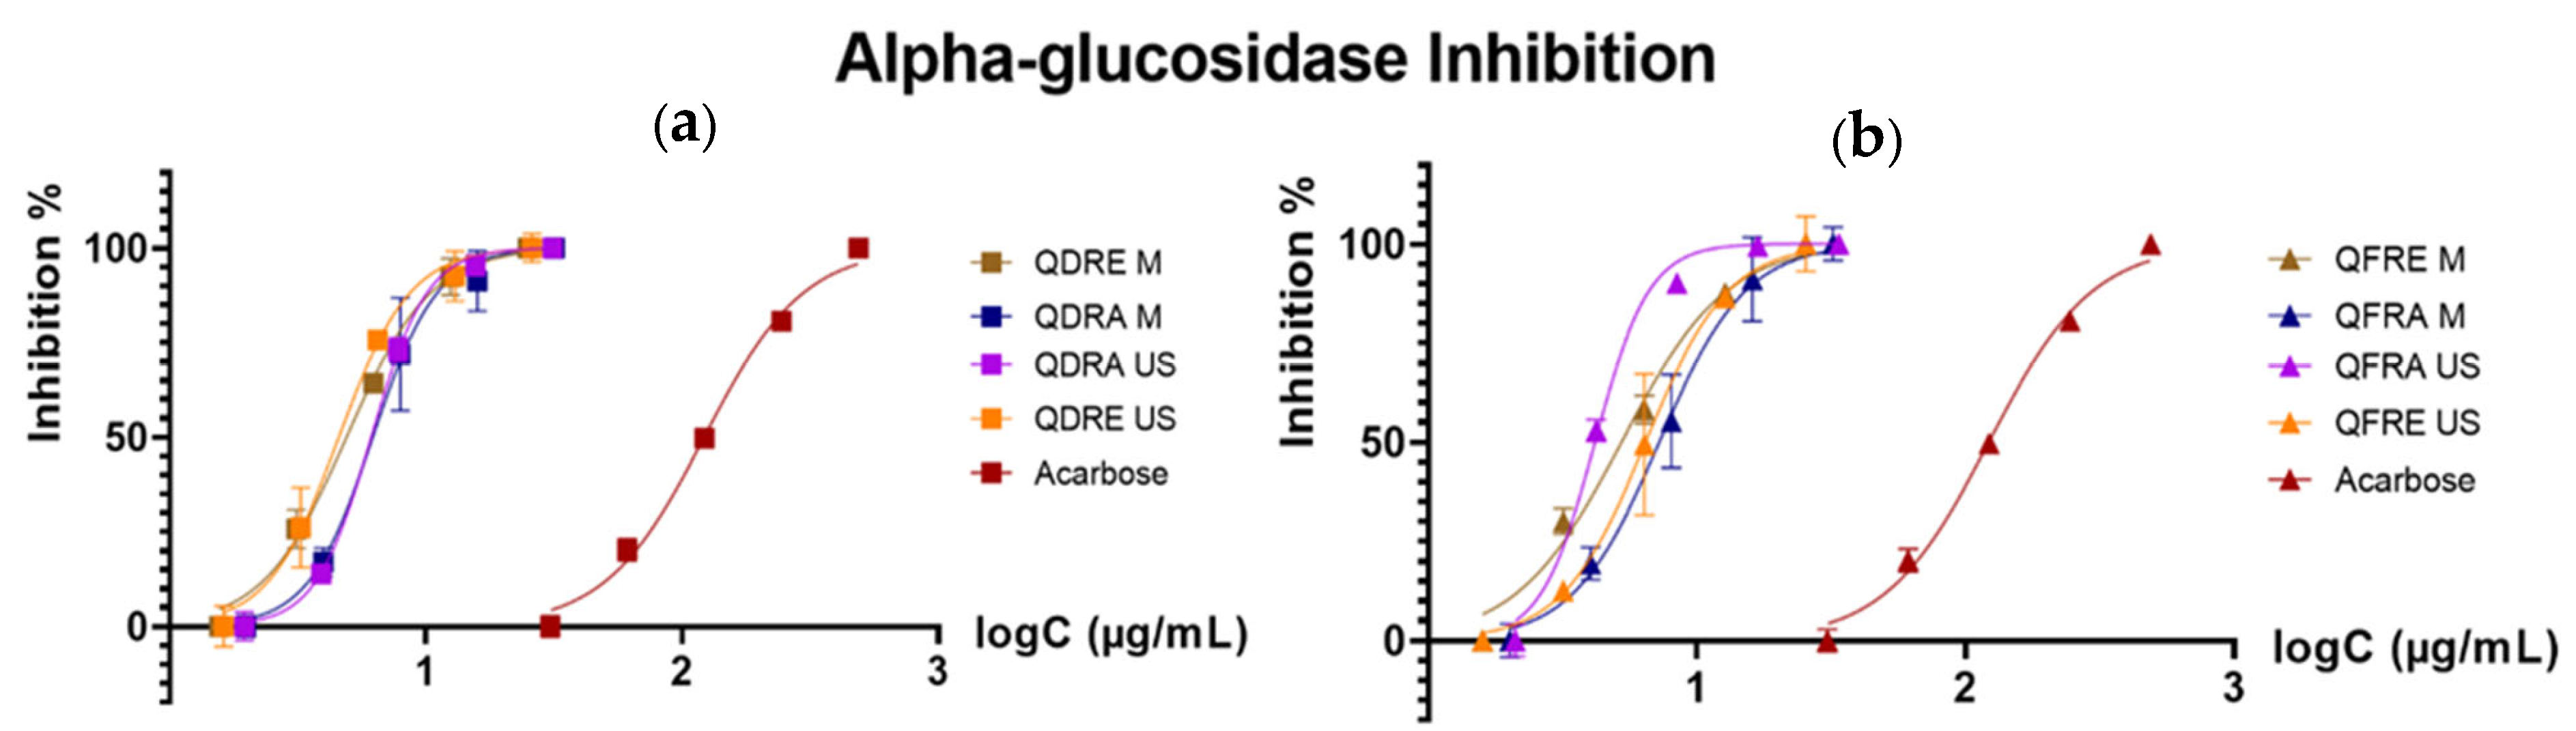
3.3. Inhibitory Potential against α-Glucosidase, Tyrosinase and Acetylcholinesterase
3.4. Antimicrobial and Antibiofilm Activity
3.5. Cytotoxicity and Damage DNA Testing for Human Embryonic Kidney Cells
4. Discussion
5. Conclusions
Author Contributions
Funding
Institutional Review Board Statement
Informed Consent Statement
Data Availability Statement
Conflicts of Interest
References
- Williamson, G. The role of polyphenols in modern nutrition. Nutr. Bull. 2017, 42, 226–235. [Google Scholar] [CrossRef]
- Bailey, R.L. Current regulatory guidelines and resources to support research of dietary supplements in the United States. Crit. Rev. Food Sci. Nutr. 2020, 60, 298–309. [Google Scholar] [CrossRef]
- Näyhä, A. Transition in the Finnish forest-based sector: Company perspectives on the bioeconomy, circular economy and sustainability. J. Clean. Prod. 2019, 209, 1294–1306. [Google Scholar] [CrossRef]
- Lazaridou, D.C.; Michailidis, A.; Trigkas, M. Exploring Environmental and Economic Costs and Benefits of a Forest-Based Circular Economy: A Literature Review. Forests 2021, 12, 436. [Google Scholar] [CrossRef]
- Gagnon, B.; Tanguay, X.; Amor, B.; Imbrogno, A.F. Forest Products and Circular Economy Strategies: A Canadian Perspective. Energies 2022, 15, 673. [Google Scholar] [CrossRef]
- Das, R.K.; Mizan, A.; Zohra, F.T.; Ahmed, S.; Ahmed, K.S.; Hossain, H. Extraction of a novel tanning agent from indigenous plant bark and its application in leather processing. J. Leather Sci. Eng. 2022, 4, 18. [Google Scholar] [CrossRef]
- Burlacu, E.; Nisca, A.; Tanase, C. A Comprehensive Review of Phytochemistry and Biological Activities of Quercus Species. Forests 2020, 11, 904. [Google Scholar] [CrossRef]
- European Medicines Agency. Assessment Report on Quercus Robur L., Quercus Petraea (Matt.) Liebl., Quercus Pubescens Willd., Cortex. Available online: https://www.ema.europa.eu/documents/herbal-report/final-assessment-report-quercus-robur-l-quercus-petraea-matt-liebl-quercus-pubescens-willd-cortex_en.pdf (accessed on 22 October 2022).
- Taib, M.; Rezzak, Y.; Bouyazza, L.; Lyoussi, B. Medicinal Uses, Phytochemistry, and Pharmacological Activities of Quercus Species. Evid. Based Complement. Altern. Med. 2020, 2020, 1–20. [Google Scholar] [CrossRef]
- Belcaro, G.; Dugall, M.; Hu, S.; Ledda, A.; Ippolito, E. French Oak Wood (Quercus robur) Extract (Robuvit) in Primary Lymphedema: A Supplement, Pilot, Registry Evaluation. Int. J. Angiol. 2014, 24, 47–54. [Google Scholar] [CrossRef]
- Belcaro, G.; Saggino, A.; Cornelli, U.; Luzzi, R.; Dugall, M.; Hosoi, M.; Feragalli, B.; Cesarone, M.R. Improvement in mood, oxidative stress, fatigue, and insomnia following supplementary management with Robuvit®. J. Neurosurg. Sci. 2018, 62, 423–427. [Google Scholar] [CrossRef]
- Quercus Cortex Monograph—European Pharmacopoeia 10.8. Available online: https://pheur.edqm.eu/app/10-8/content/10-8/1887E.htm?highlight=on&terms=quercus&terms=quercus (accessed on 15 January 2023).
- Volpp, L.; Ferianec, V.; Ježovičová, M.; Ďuračková, Z.; Scherf-Clavel, O.; Högger, P. Constituents and Metabolites of a French Oak Wood Extract (Robuvit®) in Serum and Blood Cell Samples of Women Undergoing Hysterectomy. Front. Pharmacol. 2020, 11, 74. [Google Scholar] [CrossRef] [PubMed]
- Belcaro, G.; Cornelli, U.; Luzzi, R.; Cesarone, M.R.; Dugall, M.; Feragalli, B.; Hu, S.; Pellegrini, L.; Ippolito, E. Improved management of primary chronic fatigue syndrome with the supplement French oak wood extract (Robuvit®): A pilot, registry evaluation. Panminerva Med. 2014, 56, 63–72. [Google Scholar] [PubMed]
- Weichmann, F.; Avaltroni, F.; Burki, C. Review of Clinical Effects and Presumed Mechanism of Action of the French Oak Wood Extract Robuvit. J. Med. Food 2021, 24, 897–907. [Google Scholar] [CrossRef] [PubMed]
- Mladenovic, N.; Mladenovic, A.; Pavlovic, S.; Baskic, D.; Zdravkovic, N. The aqueous extract of Quercus robur L. (Fagaceae) shows promising antibacterial activity against Klebsiella pneumoniae. Glob. J. Pathol. Microbiol. 2014, 2, 53–58. [Google Scholar]
- Şöhretoğlu, D.; Renda, G. The polyphenolic profile of Oak (Quercus) species: A phytochemical and pharmacological overview. Phytochem. Rev. 2020, 19, 1379–1426. [Google Scholar] [CrossRef]
- Şöhretoğlu, D.; Sabuncuoğlu, S.; Harput, Ü.Ş. Evaluation of antioxidative, protective effect against H2O2 induced cytotoxicity, and cytotoxic activities of three different Quercus species. Food Chem. Toxicol. 2012, 50, 141–146. [Google Scholar] [CrossRef]
- Tanase, C.; Nicolescu, A.; Nisca, A.; Ștefănescu, R.; Babotă, M.; Mare, A.D.; Ciurea, C.N.; Man, A. Biological Activity of Bark Extracts from Northern Red Oak (Quercus rubra L.): An Antioxidant, Antimicrobial and Enzymatic Inhibitory Evaluation. Plants 2022, 11, 2357. [Google Scholar] [CrossRef]
- Euro+Med Plantbase—Quercus Dalechampii Ten. Available online: https://europlusmed.org/cdm_dataportal/taxon/4f5cd723-6f34-4b42-ade3-b0532935e87b (accessed on 22 October 2022).
- Euro+Med Plantbase—Quercus Frainetto Ten. Available online: https://europlusmed.org/cdm_dataportal/taxon/6ae605f6-8e34-479a-93ac-2539ed179686 (accessed on 22 October 2022).
- Kučera, P. New name for Central Europaean oak formerly labelled as Quercus dalechampii. Biologia 2018, 73, 313–317. [Google Scholar] [CrossRef]
- Tanase, C.; Domokos, E.; Coşarcă, S.; Miklos, A.; Imre, S.; Domokos, J.; Dehelean, C.A. Study of the ultrasound-assisted extraction of polyphenols from beech (Fagus sylvatica L.) bark. BioResources 2018, 13, 2247–2267. [Google Scholar] [CrossRef]
- Nisca, A.; Ștefănescu, R.; Moldovan, C.; Mocan, A.; Mare, A.D.; Ciurea, C.N.; Man, A.; Muntean, D.-L.; Tanase, C. Optimization of Microwave Assisted Extraction Conditions to Improve Phenolic Content and In Vitro Antioxidant and Anti-Microbial Activity in Quercus cerris Bark Extracts. Plants 2022, 11, 240. [Google Scholar] [CrossRef]
- Tanase, C.; Cosarca, S.; Toma, F.; Mare, A.; Cosarca, A.; Man, A.; Miklos, A.; Imre, S. Antibacterial activities of spruce bark (Picea abies L.) extract and its components against human pathogens. Rev. Chim. 2018, 69, 1462–1467. [Google Scholar] [CrossRef]
- Laczkó-Zöld, E.; Komlósi, A.; Ülkei, T.; Fogarasi, E.; Croitoru, M.; Fülöp, I.; Domokos, E.; Ştefănescu, R.; Varga, E. Extractability of polyphenols from black currant, red currant and gooseberry and their antioxidant activity. Acta Biol. Hung. 2018, 69, 156–169. [Google Scholar] [CrossRef] [PubMed]
- Babotă, M.; Frumuzachi, O.; Mocan, A.; Tămaș, M.; Dias, M.I.; Pinela, J.; Stojković, D.; Soković, M.; Bădărău, A.S.; Crișan, G.; et al. Unravelling Phytochemical and Bioactive Potential of Three Hypericum Species from Romanian Spontaneous Flora: H. alpigenum, H. perforatum and H. rochelii. Plants 2022, 11, 2773. [Google Scholar] [CrossRef]
- Dubas, S.T.; Wacharanad, S.; Potiyaraj, P. Tunning of the antimicrobial activity of surgical sutures coated with silver nanoparticles. Colloids Surf. A Physicochem. Eng. Asp. 2011, 380, 25–28. [Google Scholar] [CrossRef]
- Santos, C.L.V.; Pourrut, B.; Ferreira de Oliveira, J.M.P. The use of comet assay in plant toxicology: Recent advances. Front. Genet. 2015, 6, 216. [Google Scholar] [CrossRef] [PubMed]
- Das, A.K.; Islam, M.N.; Faruk, M.O.; Ashaduzzaman, M.; Dungani, R. Review on tannins: Extraction processes, applications and possibilities. South African J. Bot. 2020, 135, 58–70. [Google Scholar] [CrossRef]
- Bouras, M.; Chadni, M.; Barba, F.J.; Grimi, N.; Bals, O.; Vorobiev, E. Optimization of microwave-assisted extraction of polyphenols from Quercus bark. Ind. Crops Prod. 2015, 77, 590–601. [Google Scholar] [CrossRef]
- Galiñanes, C.; Freire, M.S.; González-Álvarez, J. Antioxidant activity of phenolic extracts from chestnut fruit and forest industries residues. Eur. J. Wood Wood Prod. 2015, 73, 651–659. [Google Scholar] [CrossRef]
- Yin, P.; Yang, L.; Xue, Q.; Yu, M.; Yao, F.; Sun, L.; Liu, Y. Identification and inhibitory activities of ellagic acid- and kaempferol-derivatives from Mongolian oak cups against α-glucosidase, α-amylase and protein glycation linked to type II diabetes and its complications and their influence on HepG2 cells’ viabil. Arab. J. Chem. 2018, 11, 1247–1259. [Google Scholar] [CrossRef]
- Li, K.; Yao, F.; Du, J.; Deng, X.; Li, C. Persimmon Tannin Decreased the Glycemic Response through Decreasing the Digestibility of Starch and Inhibiting α-Amylase, α-Glucosidase, and Intestinal Glucose Uptake. J. Agric. Food Chem. 2018, 66, 1629–1637. [Google Scholar] [CrossRef]
- Farha, A.K.; Yang, Q.-Q.; Kim, G.; Li, H.-B.; Zhu, F.; Liu, H.-Y.; Gan, R.-Y.; Corke, H. Tannins as an alternative to antibiotics. Food Biosci. 2020, 38, 100751. [Google Scholar] [CrossRef]
- Liu, M.; Feng, M.; Yang, K.; Cao, Y.; Zhang, J.; Xu, J.; Hernández, S.H.; Wei, X.; Fan, M. Transcriptomic and metabolomic analyses reveal antibacterial mechanism of astringent persimmon tannin against Methicillin-resistant Staphylococcus aureus isolated from pork. Food Chem. 2020, 309, 125692. [Google Scholar] [CrossRef]
- Koleckar, V.; Kubikova, K.; Rehakova, Z.; Kuca, K.; Jun, D.; Jahodar, L.; Opletal, L. Condensed and hydrolysable tannins as antioxidants influencing the health. Mini Rev. Med. Chem. 2008, 8, 436–447. [Google Scholar] [CrossRef] [PubMed]
- Serrano, C.; García-Fernández, L.; Fernández-Blázquez, J.P.; Barbeck, M.; Ghanaati, S.; Unger, R.; Kirkpatrick, J.; Arzt, E.; Funk, L.; Turón, P.; et al. Nanostructured medical sutures with antibacterial properties. Biomaterials 2015, 52, 291–300. [Google Scholar] [CrossRef] [PubMed]
- Gallo, A.L.; Paladini, F.; Romano, A.; Verri, T.; Quattrini, A.; Sannino, A.; Pollini, M. Efficacy of silver coated surgical sutures on bacterial contamination, cellular response and wound healing. Mater. Sci. Eng. C 2016, 69, 884–893. [Google Scholar] [CrossRef] [PubMed]
- Teodor, E.D.; Ungureanu, O.; Gatea, F.; Radu, G.L. The Potential of Flavonoids and Tannins from Medicinal Plants as Anticancer Agents. Anticancer. Agents Med. Chem. 2020, 20, 2216–2227. [Google Scholar] [CrossRef]
- Albuquerque, B.R.; Heleno, S.A.; Oliveira, M.B.P.P.; Barros, L.; Ferreira, I.C.F.R. Phenolic compounds: Current industrial applications, limitations and future challenges. Food Funct. 2021, 12, 14–29. [Google Scholar] [CrossRef] [PubMed]
- Okuda, T. Systematics and health effects of chemically distinct tannins in medicinal plants. Phytochemistry 2005, 66, 2012–2031. [Google Scholar] [CrossRef]
- Langie, S.A.S.; Azqueta, A.; Collins, A.R. The comet assay: Past, present, and future. Front. Genet. 2015, 6, 266. [Google Scholar] [CrossRef]
- Kumaravel, T.S.; Vilhar, B.; Faux, S.P.; Jha, A.N. Comet Assay measurements: A perspective. Cell Biol. Toxicol. 2009, 25, 53–64. [Google Scholar] [CrossRef]


| Compound | Abbreviation | Retention Time |
|---|---|---|
| Gallic acid | GAL | 2.8 min |
| Catechin | CAT | 4.8 min |
| Taxifolin | TAX | 7.7 min |
| Caffeic acid | CAFA | 5.7 min |
| Epicatechin | EPICAT | 5.5. min |
| Sample | IC50 DPPH (µg/mL) | IC50 ABTS (µg/mL) |
|---|---|---|
| QDRA M | 2.27 ± 0.109 e | 8.453 ± 0.138 a |
| QDRE M | 9.153 ± 0.418 a | 7.856 ± 0.779 a |
| QDRA US | 3.86± 0.33 d | 2.49± 0.045 c |
| QDRE US | 2.8± 0.379 e | 2.194± 0.1 c |
| QFRA M | 8.036 ± 0.435 b | 6.556 ± 0.553 b |
| QFRE M | 9.399 ± 0.517 a | 6.135 ± 0.261 b |
| QFRA US | 4.07± 0.54 cd | 2.48±0.046 c |
| QFRE US | 2.66± 0.31 e | 2.37± 0.1 c |
| Ascorbic acid | 0.0044 ± 0.0002 f | - |
| Trolox | - | 1.06 ± 0.44 d |
| Enzyme | Species | Extract/ Positive Control | IC50 (µg/mL) |
|---|---|---|---|
| α-Glucosidase | Q. dalechampii | QDRE M | 4.91 |
| QDRA M | 6.21 | ||
| QDRE US | 4.58 | ||
| QDRA US | 6.12 | ||
| Q. frainetto | QFRE M | 5.24 | |
| QFRA M | 7.24 | ||
| QFRE US | 6.44 | ||
| QFRA US | 4.17 | ||
| Acarbose | 122.27 | ||
| Acetylcholinesterase | Q. dalechampii | QDREM | 133.4 |
| QDRAM | 139.2 | ||
| QDREU | 137.4 | ||
| QDRAU | 220.7 | ||
| Q. frainetto | QFREM | 147.3 | |
| QFRAM | 188.1 | ||
| QFREU | 136.1 | ||
| QFRAU | 170.7 | ||
| Galantamine | 0.0002 | ||
| Tyrosinase | Q. dalechampii | QDREM | 106.00 |
| QDRAM | 125.16 | ||
| QDREU | 67.2 | ||
| QDRAU | 224.00 | ||
| Q. frainetto | QFREM | 131.32 | |
| QFRAM | 147.02 | ||
| QFREU | 82.04 | ||
| QFRAU | 353.8 | ||
| Kojic acid | 4.44 |
| TPC | DPPH | ABTS | α-Glucosidase | Acetylcholinesterase | Tyrosinase | |
|---|---|---|---|---|---|---|
| Extracts obtained by microwave assisted extraction | ||||||
| TPC | 1.000 | 0.946 | −0.462 | −0.418 | 0.071 | −0.256 |
| DPPH | 0.946 | 1.000 | −0.713 | −0.360 | 0.188 | −0.034 |
| ABTS | −0.462 | −0.713 | 1.000 | −0.123 | −0.577 | −0.609 |
| α-Glucosidase | −0.418 | −0.360 | −0.123 | 1.000 | 0.846 | 0.827 |
| Acetylcholinesterase | 0.071 | 0.188 | −0.577 | 0.846 | 1.000 | 0.887 |
| Tyrosinase | −0.256 | −0.034 | −0.609 | 0.827 | 0.887 | 1.000 |
| Extracts obtained by ultrasounds assisted extraction | ||||||
| TPC | 1.000 | −0.320 | 0.198 | 0.395 | −0.454 | −0.089 |
| DPPH | −0.320 | 1.000 | 0.798 | −0.325 | 0.789 | 0.952 |
| ABTS | 0.198 | 0.798 | 1.000 | 0.215 | 0.739 | 0.794 |
| α-Glucosidase | 0.395 | −0.325 | 0.215 | 1.000 | 0.195 | −0.422 |
| Acetylcholinesterase | −0.454 | 0.789 | 0.739 | 0.195 | 1.000 | 0.585 |
| Tyrosinase | −0.089 | 0.952 | 0.794 | −0.422 | 0.585 | 1.000 |
| Species | Sapmple/ Control | S.aureus | MRSA | E. coli | K. pneumoniae | P. aeruginosa | |||||
|---|---|---|---|---|---|---|---|---|---|---|---|
| MIC | MBC | MIC | MBC | MIC | MBC | MIC | MBC | MIC | MBC | ||
| Q. dalechampii | QDRA M | 0.31 | 2.5 | 0.62 | 0.62 | >5 | >5 | 0.62 | 0.62 | 5 | 5 |
| QDRE M | 0.31 | 0.31 | 0.62 | 0.62 | >5 | >5 | 0.62 | 1.25 | 0.62 | 2.5 | |
| QDRA US | 2.5 | 0.62 | 0.62 | 0.62 | >5 | >5 | 0.62 | 0.62 | 2.5 | 5 | |
| QDRE US | 0.31 | 1.25 | 0.62 | 0.62 | >5 | >5 | 0.62 | 0.62 | 1.25 | 2.5 | |
| Q. frainetto | QFRA M | 0.31 | 5 | 0.62 | 1.25 | 5 | 5 | 0.62 | 0.62 | 2.5 | 5 |
| QFRE M | 0.31 | 0.16 | 0.62 | 0.62 | >5 | >5 | 0.62 | 2.5 | 0.62 | 2.5 | |
| QFRA US | 0.62 | 0.62 | 0.62 | 0.62 | >5 | >5 | 0.62 | 0.62 | 1.25 | >5 | |
| QFRE US | 0.31 | 0.62 | 0.62 | 0.62 | >5 | >5 | 0.62 | 2.5 | 1.25 | 5 | |
| Species | Sapmple/ Control | C. albicans | C. parapsilosis | C. krusei |
|---|---|---|---|---|
| MIC | MIC | MIC | ||
| Q. dalechampii | QDRA M | >5 | >5 | 5 |
| QDRE M | >5 | >5 | 2.5 | |
| QDRA US | >5 | 5 | >5 | |
| QDRE US | >5 | 5 | 2.5 | |
| Q. frainetto | QFRA M | >5 | >5 | 2.5 |
| QFRE M | >5 | >5 | 5 | |
| QFRA US | >5 | >5 | 5 | |
| QFRE US | >5 | >5 | 5 |
| Biofilm Inhibition | |||||||
|---|---|---|---|---|---|---|---|
| Sample | Concentration | S. aureus | MRSA | E. coli | K. pneumoniae | P. aeruginosa | |
| QDREM | 3 | 6.2 | −43.1 | 49.0 | 18.6 | −48.1 | |
| Q. dalechampii | 1.5 | 0 | −44.0 | 48.3 | 17.4 | 6.4 | |
| 0.75 | 2.1 | −45.7 | 65.8 | 16.8 | −6.6 | ||
| QDRAU | 3 | 19.0 | −35.1 | 102.7 | 44.3 | −23.9 | |
| 1.5 | 11.8 | −40.1 | 68.2 | 32.3 | −5.3 | ||
| 0.75 | 7.7 | −39.2 | 52.4 | 26.9 | 35.9 | ||
| QDREU | 3 | −3.6 | −40.1 | 16.8 | 20.4 | −45.7 | |
| 1.5 | −6.2 | −41.3 | 20.5 | 20.4 | −4.5 | ||
| 0.75 | −8.7 | −42.2 | 75.7 | 16.8 | −5.6 | ||
| QFREM | 3 | −2.1 | −41.3 | 55.8 | 15.6 | −49.7 | |
| Q. frainetto | 1.5 | −2.6 | −43.1 | 43.2 | 10.2 | −1.6 | |
| 0.25 | 0.5 | −51.9 | 57.5 | 11.4 | −5.1 | ||
| QFRAU | 3 | 17.4 | −34.8 | 64.7 | 41.9 | −35.1 | |
| 1.5 | 12.3 | −38.1 | 59.6 | 35.3 | 14.9 | ||
| 0.75 | 8.7 | −40.7 | 64.7 | 29.3 | 13.3 | ||
| QFREU | 3 | −7.2 | −45.4 | 8.2 | 8.4 | −50.3 | |
| 1.5 | −14.4 | −43.7 | 11.3 | 7.2 | −6.1 | ||
| 0.75 | −13.3 | −43.4 | 37.0 | 10.2 | −11.2 | ||
| Suture | QDREM | QFREM |
|---|---|---|
| A | +66 | +16 |
| B | +95 | +31 |
| C | +99 | +17 |
| D | +30 | −0.5 |
| Sample/Control | Concentration | Average Number of Cells after Treatment of Attached, Confluent Cells in Presence of Quercus Extracts for 24 h | Average Number of Cells after Cultivation of Non-Attached, Fresh Cells in Presence of Quercus Extracts for 24 h |
|---|---|---|---|
| QDRE M | 6% | 0 ± 0 | 0 ± 0 |
| 3% | 1 ± 1 | 0 ± 0 | |
| 1.5% | 30.7 ± 4.5 | 0 ± 0 | |
| 0.25% | 25.3 ± 4.5 | 0 ± 0 | |
| QFRA M | 6% | 0 ± 0 | 0 ± 0 |
| 3% | 1.3 ± 1.2 | 0.3 ± 0.6 | |
| 1.5% | 50.3 ± 1.5 | 0 ± 0 | |
| 0.25% | 46 ± 6.2 | 0 ± 0 | |
| H2O2 | - | 150 ± 15.6 | 9.7 ± 0.6 |
Disclaimer/Publisher’s Note: The statements, opinions and data contained in all publications are solely those of the individual author(s) and contributor(s) and not of MDPI and/or the editor(s). MDPI and/or the editor(s) disclaim responsibility for any injury to people or property resulting from any ideas, methods, instructions or products referred to in the content. |
© 2023 by the authors. Licensee MDPI, Basel, Switzerland. This article is an open access article distributed under the terms and conditions of the Creative Commons Attribution (CC BY) license (https://creativecommons.org/licenses/by/4.0/).
Share and Cite
Tanase, C.; Babotă, M.; Nișca, A.; Nicolescu, A.; Ștefănescu, R.; Mocan, A.; Farczadi, L.; Mare, A.D.; Ciurea, C.N.; Man, A. Potential Use of Quercus dalechampii Ten. and Q. frainetto Ten. Barks Extracts as Antimicrobial, Enzyme Inhibitory, Antioxidant and Cytotoxic Agents. Pharmaceutics 2023, 15, 343. https://doi.org/10.3390/pharmaceutics15020343
Tanase C, Babotă M, Nișca A, Nicolescu A, Ștefănescu R, Mocan A, Farczadi L, Mare AD, Ciurea CN, Man A. Potential Use of Quercus dalechampii Ten. and Q. frainetto Ten. Barks Extracts as Antimicrobial, Enzyme Inhibitory, Antioxidant and Cytotoxic Agents. Pharmaceutics. 2023; 15(2):343. https://doi.org/10.3390/pharmaceutics15020343
Chicago/Turabian StyleTanase, Corneliu, Mihai Babotă, Adrian Nișca, Alexandru Nicolescu, Ruxandra Ștefănescu, Andrei Mocan, Lenard Farczadi, Anca Delia Mare, Cristina Nicoleta Ciurea, and Adrian Man. 2023. "Potential Use of Quercus dalechampii Ten. and Q. frainetto Ten. Barks Extracts as Antimicrobial, Enzyme Inhibitory, Antioxidant and Cytotoxic Agents" Pharmaceutics 15, no. 2: 343. https://doi.org/10.3390/pharmaceutics15020343
APA StyleTanase, C., Babotă, M., Nișca, A., Nicolescu, A., Ștefănescu, R., Mocan, A., Farczadi, L., Mare, A. D., Ciurea, C. N., & Man, A. (2023). Potential Use of Quercus dalechampii Ten. and Q. frainetto Ten. Barks Extracts as Antimicrobial, Enzyme Inhibitory, Antioxidant and Cytotoxic Agents. Pharmaceutics, 15(2), 343. https://doi.org/10.3390/pharmaceutics15020343