

Peptide Engraftment on PEGylated Nanoliposomes for Bone Specific Delivery of PTH (1-34) in Osteoporosis

 ,
,  , , , ,
Abstract
:1. Introduction
2. Materials and Methods
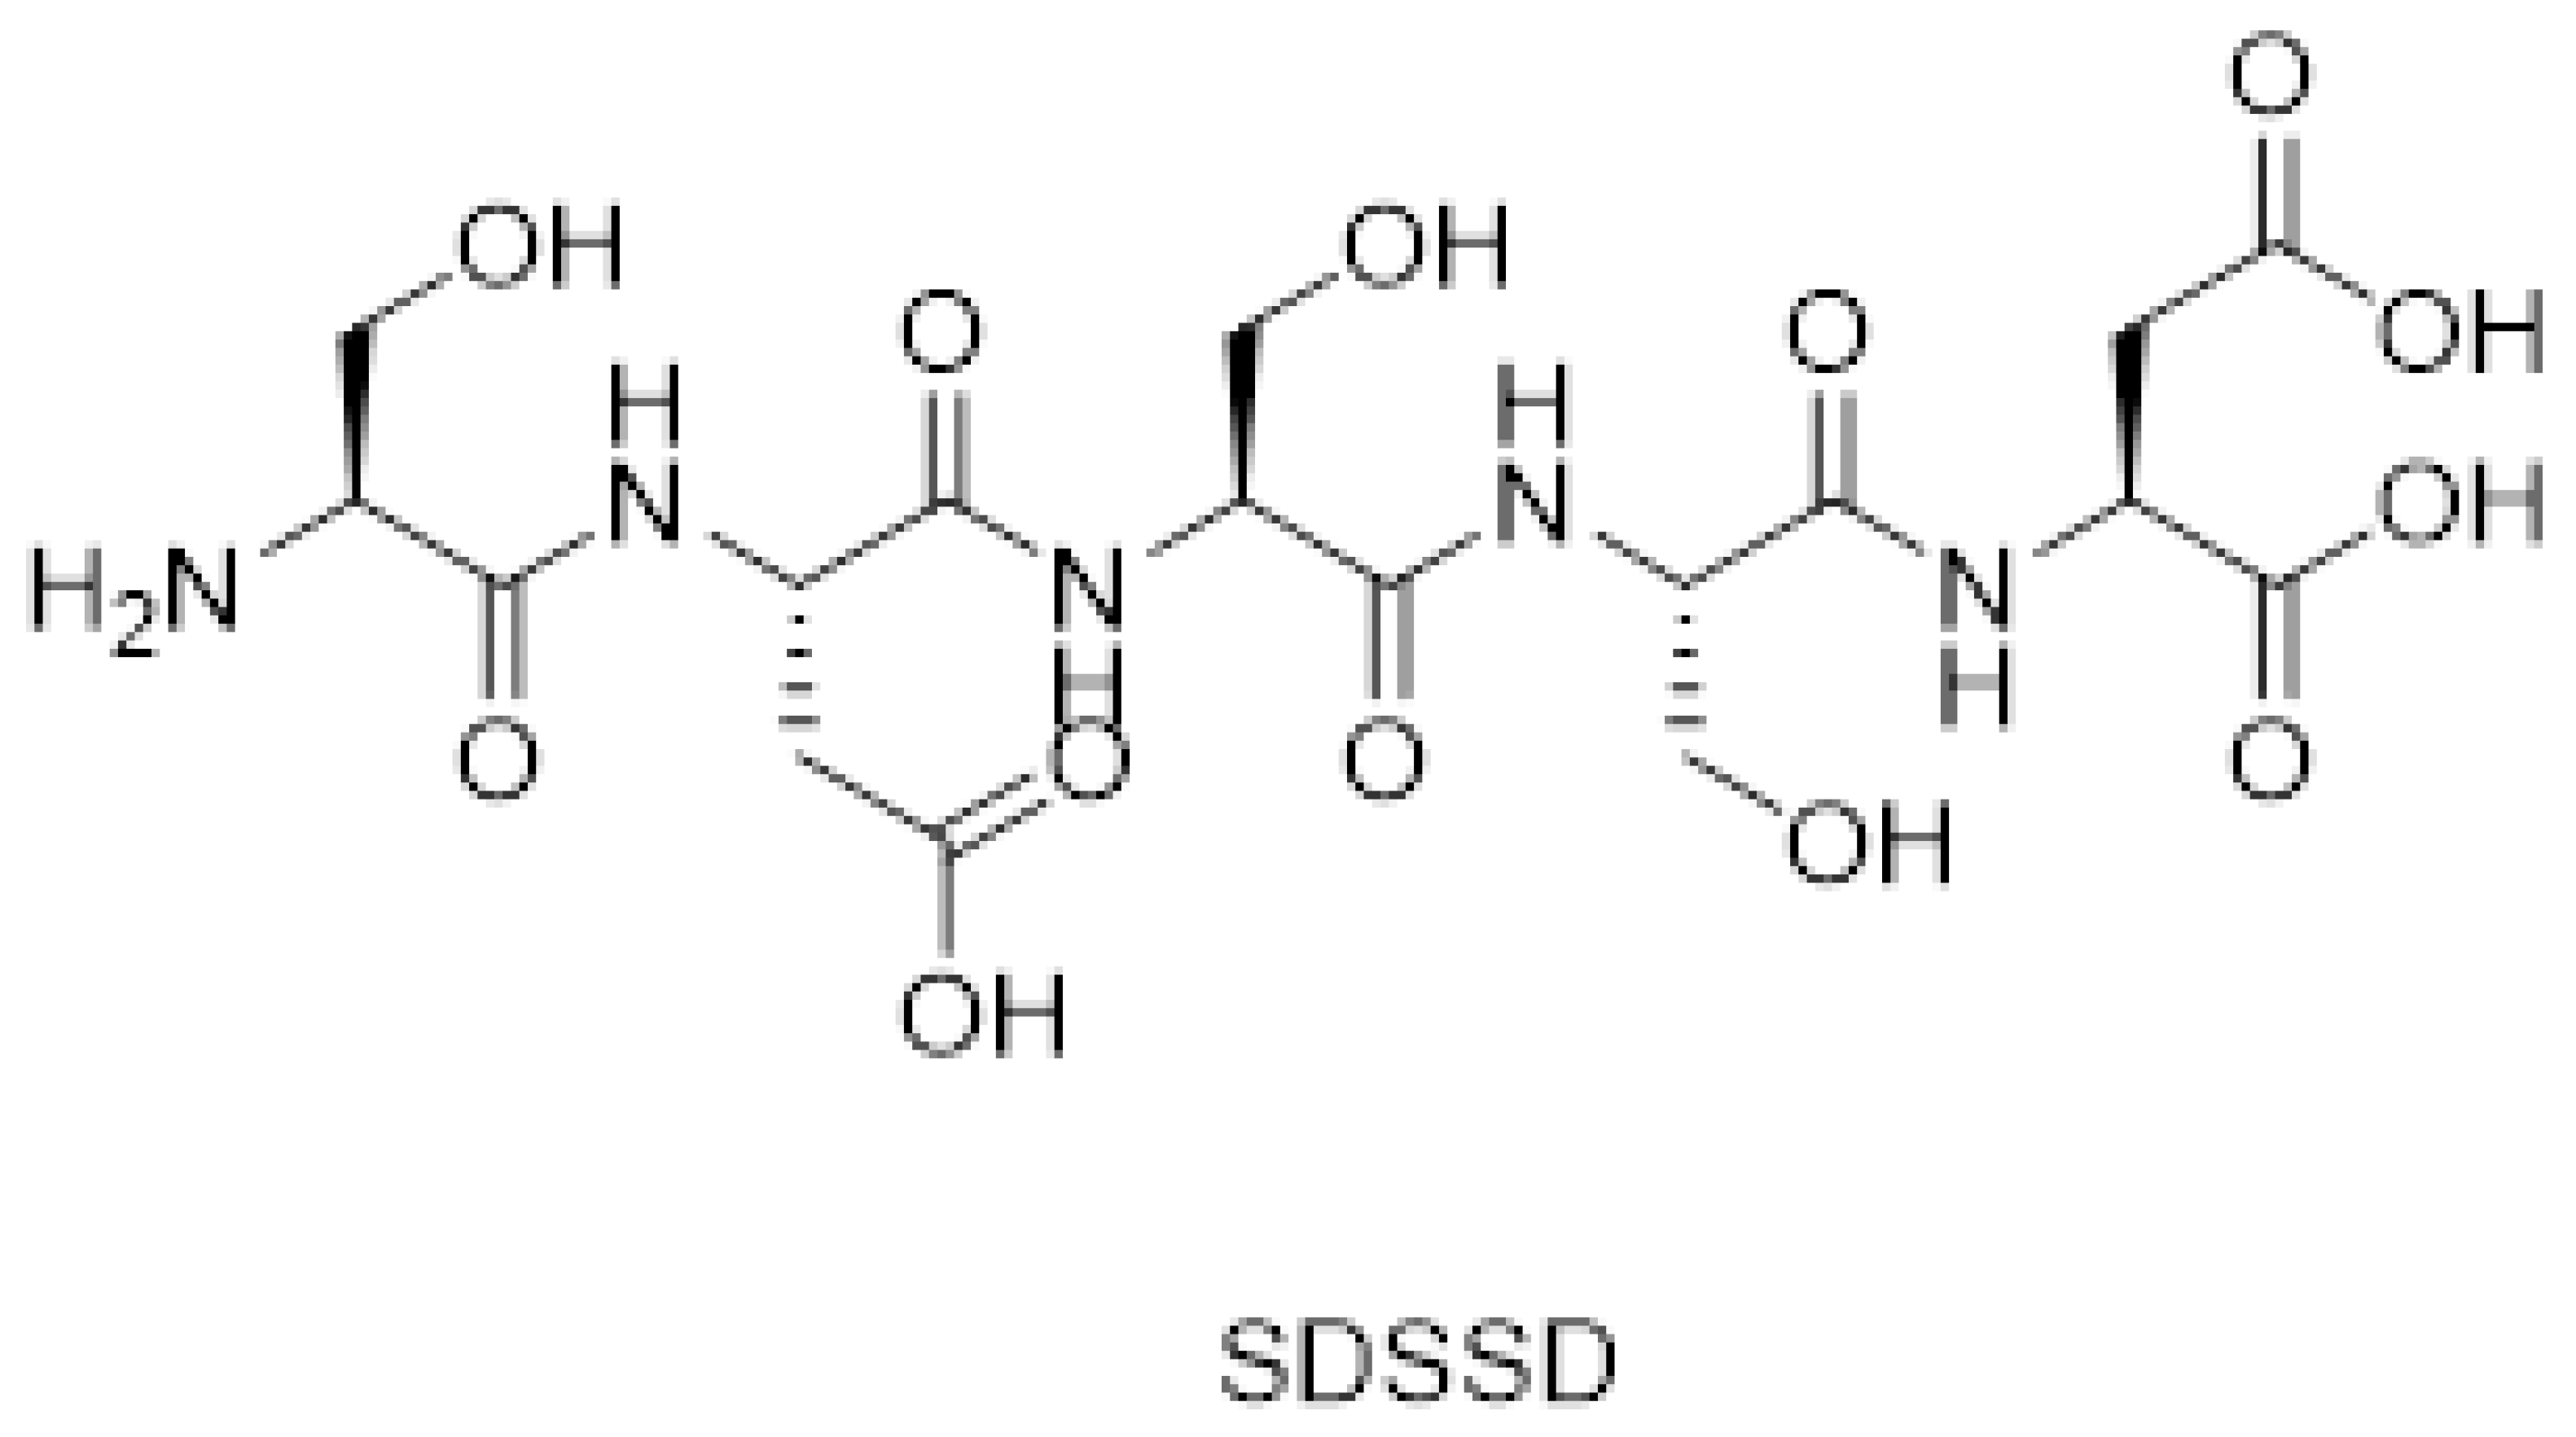
2.1. Synthesis of SDSSD
2.2. Synthesis of Conjugate (SDSSD-DSPE)
Determination of % Conjugation Efficiency
2.3. Analytical Method for PTH (1-34)
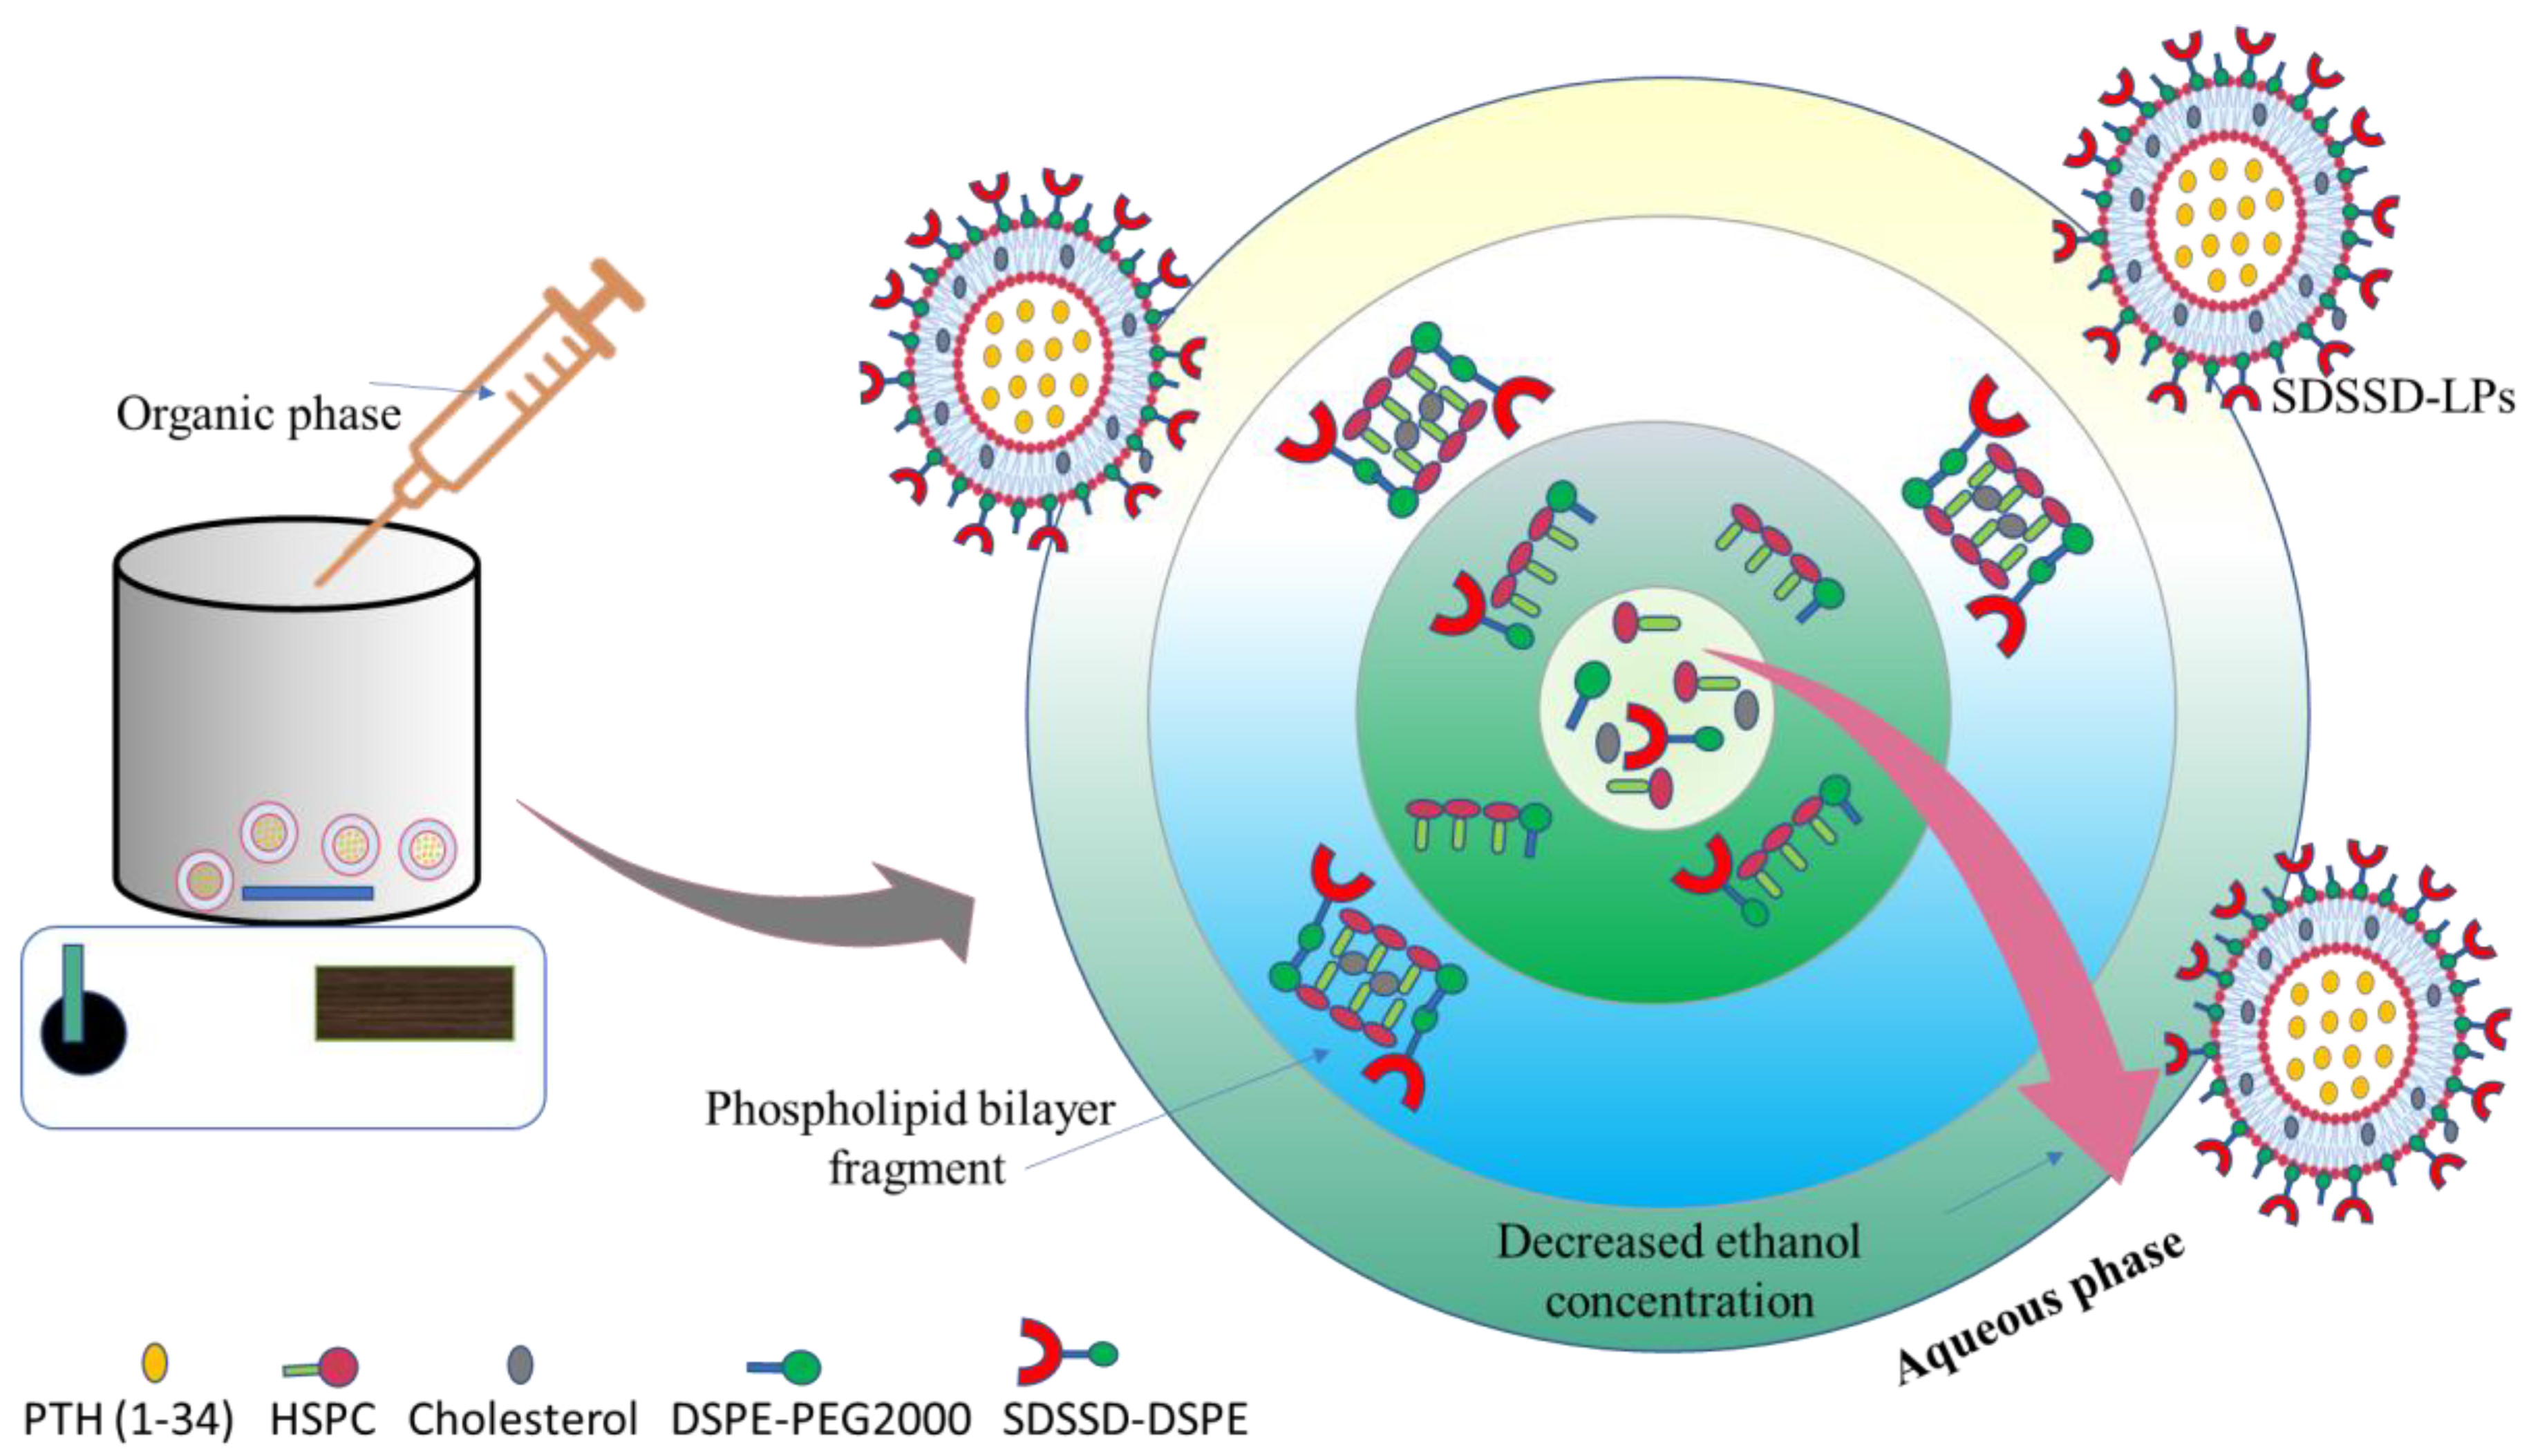
2.4. Development of SDSSD-LPs
2.5. Optimization of SDSSD-LPs
2.5.1. Statistical Analysis for CCD
2.5.2. Model Verification
2.6. Characterization of SDSSD-LPs
2.6.1. Particle Size and Zeta Potential
2.6.2. Determination of % Entrapment Efficiency
2.6.3. Morphological Assessment
2.6.4. In Vitro Drug Release
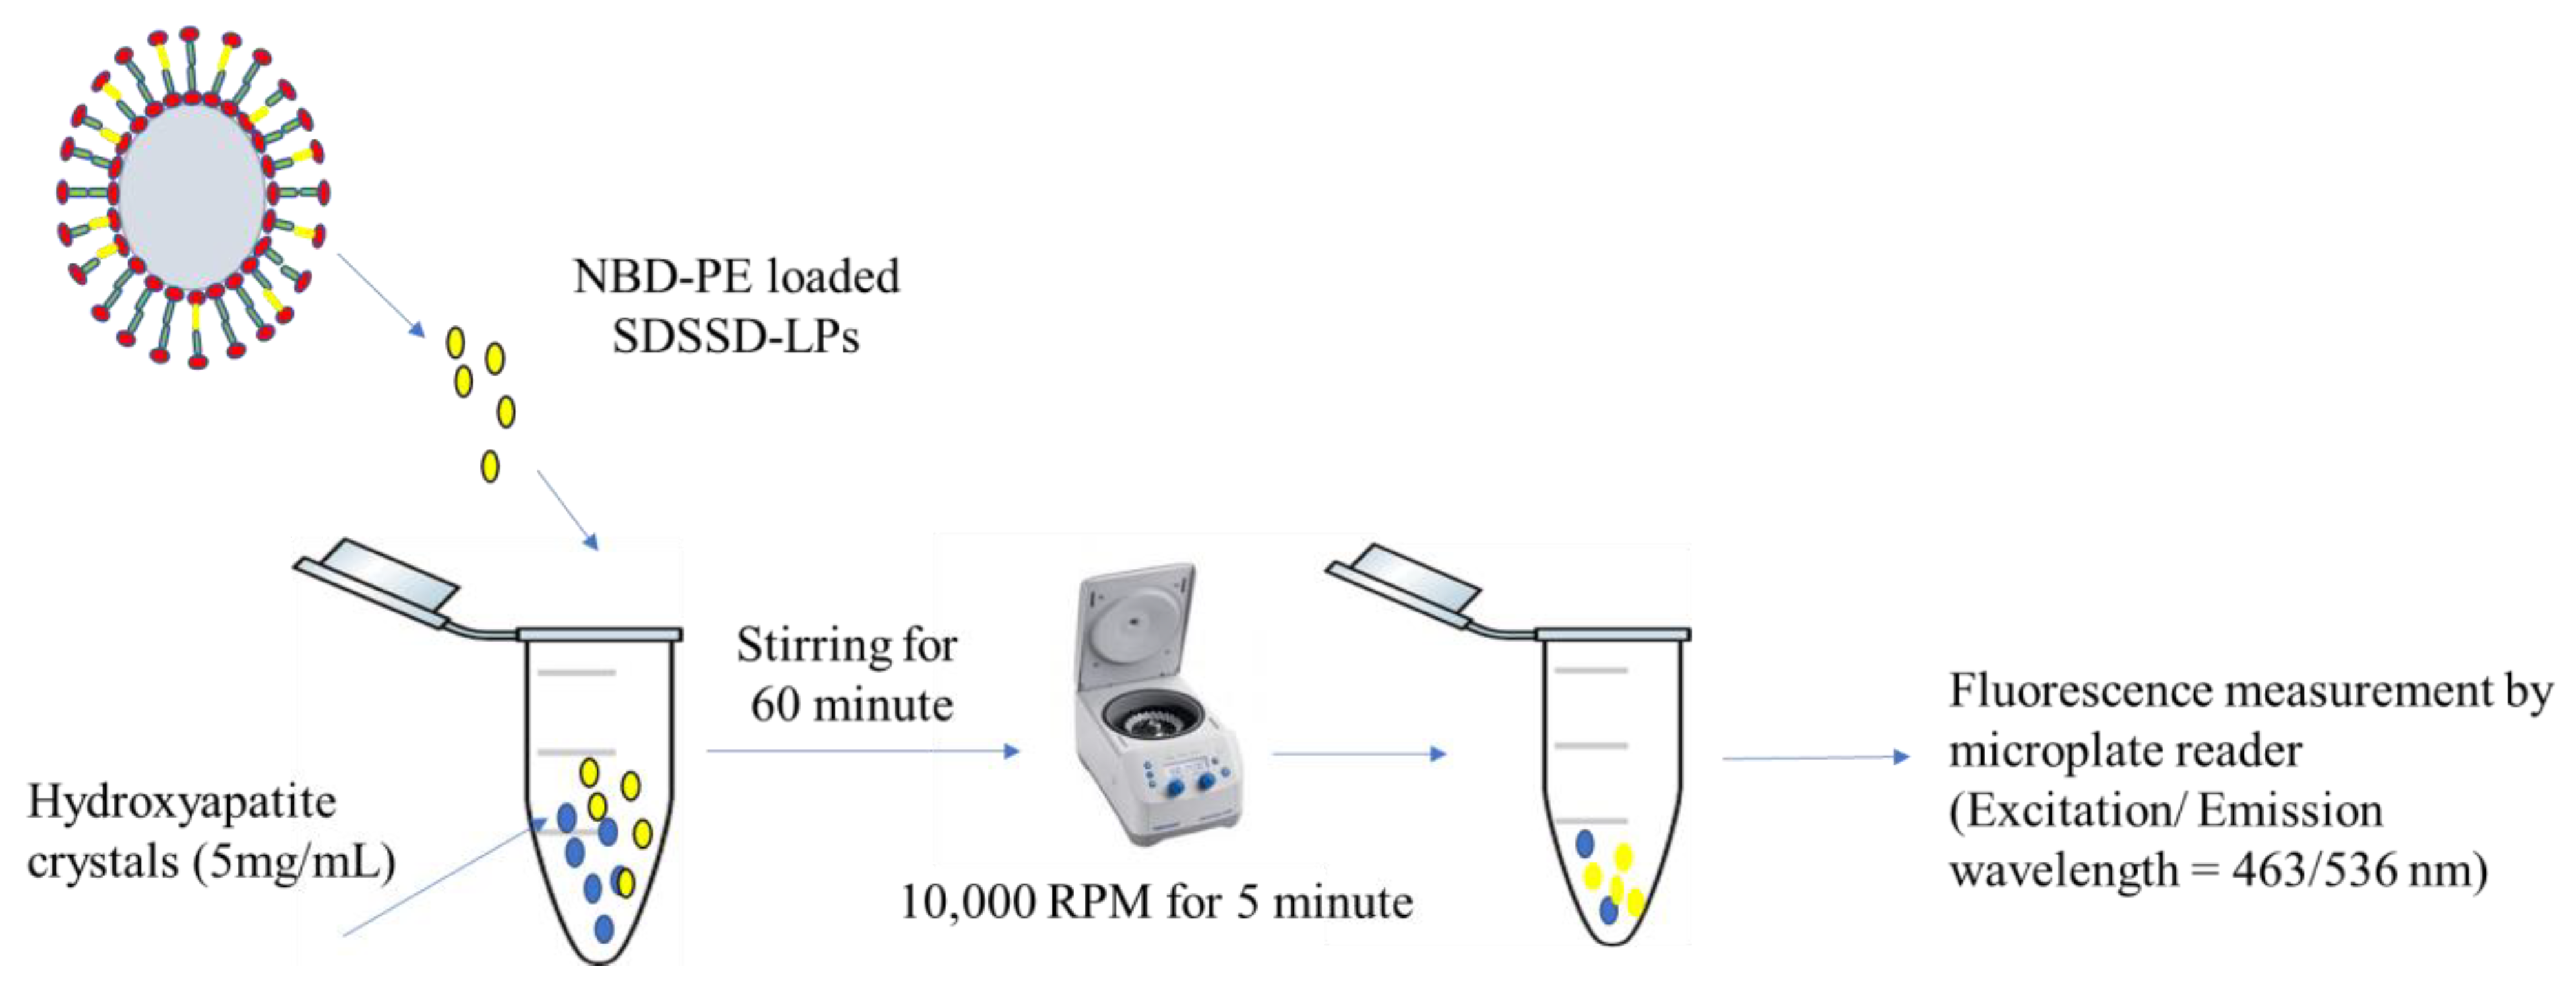
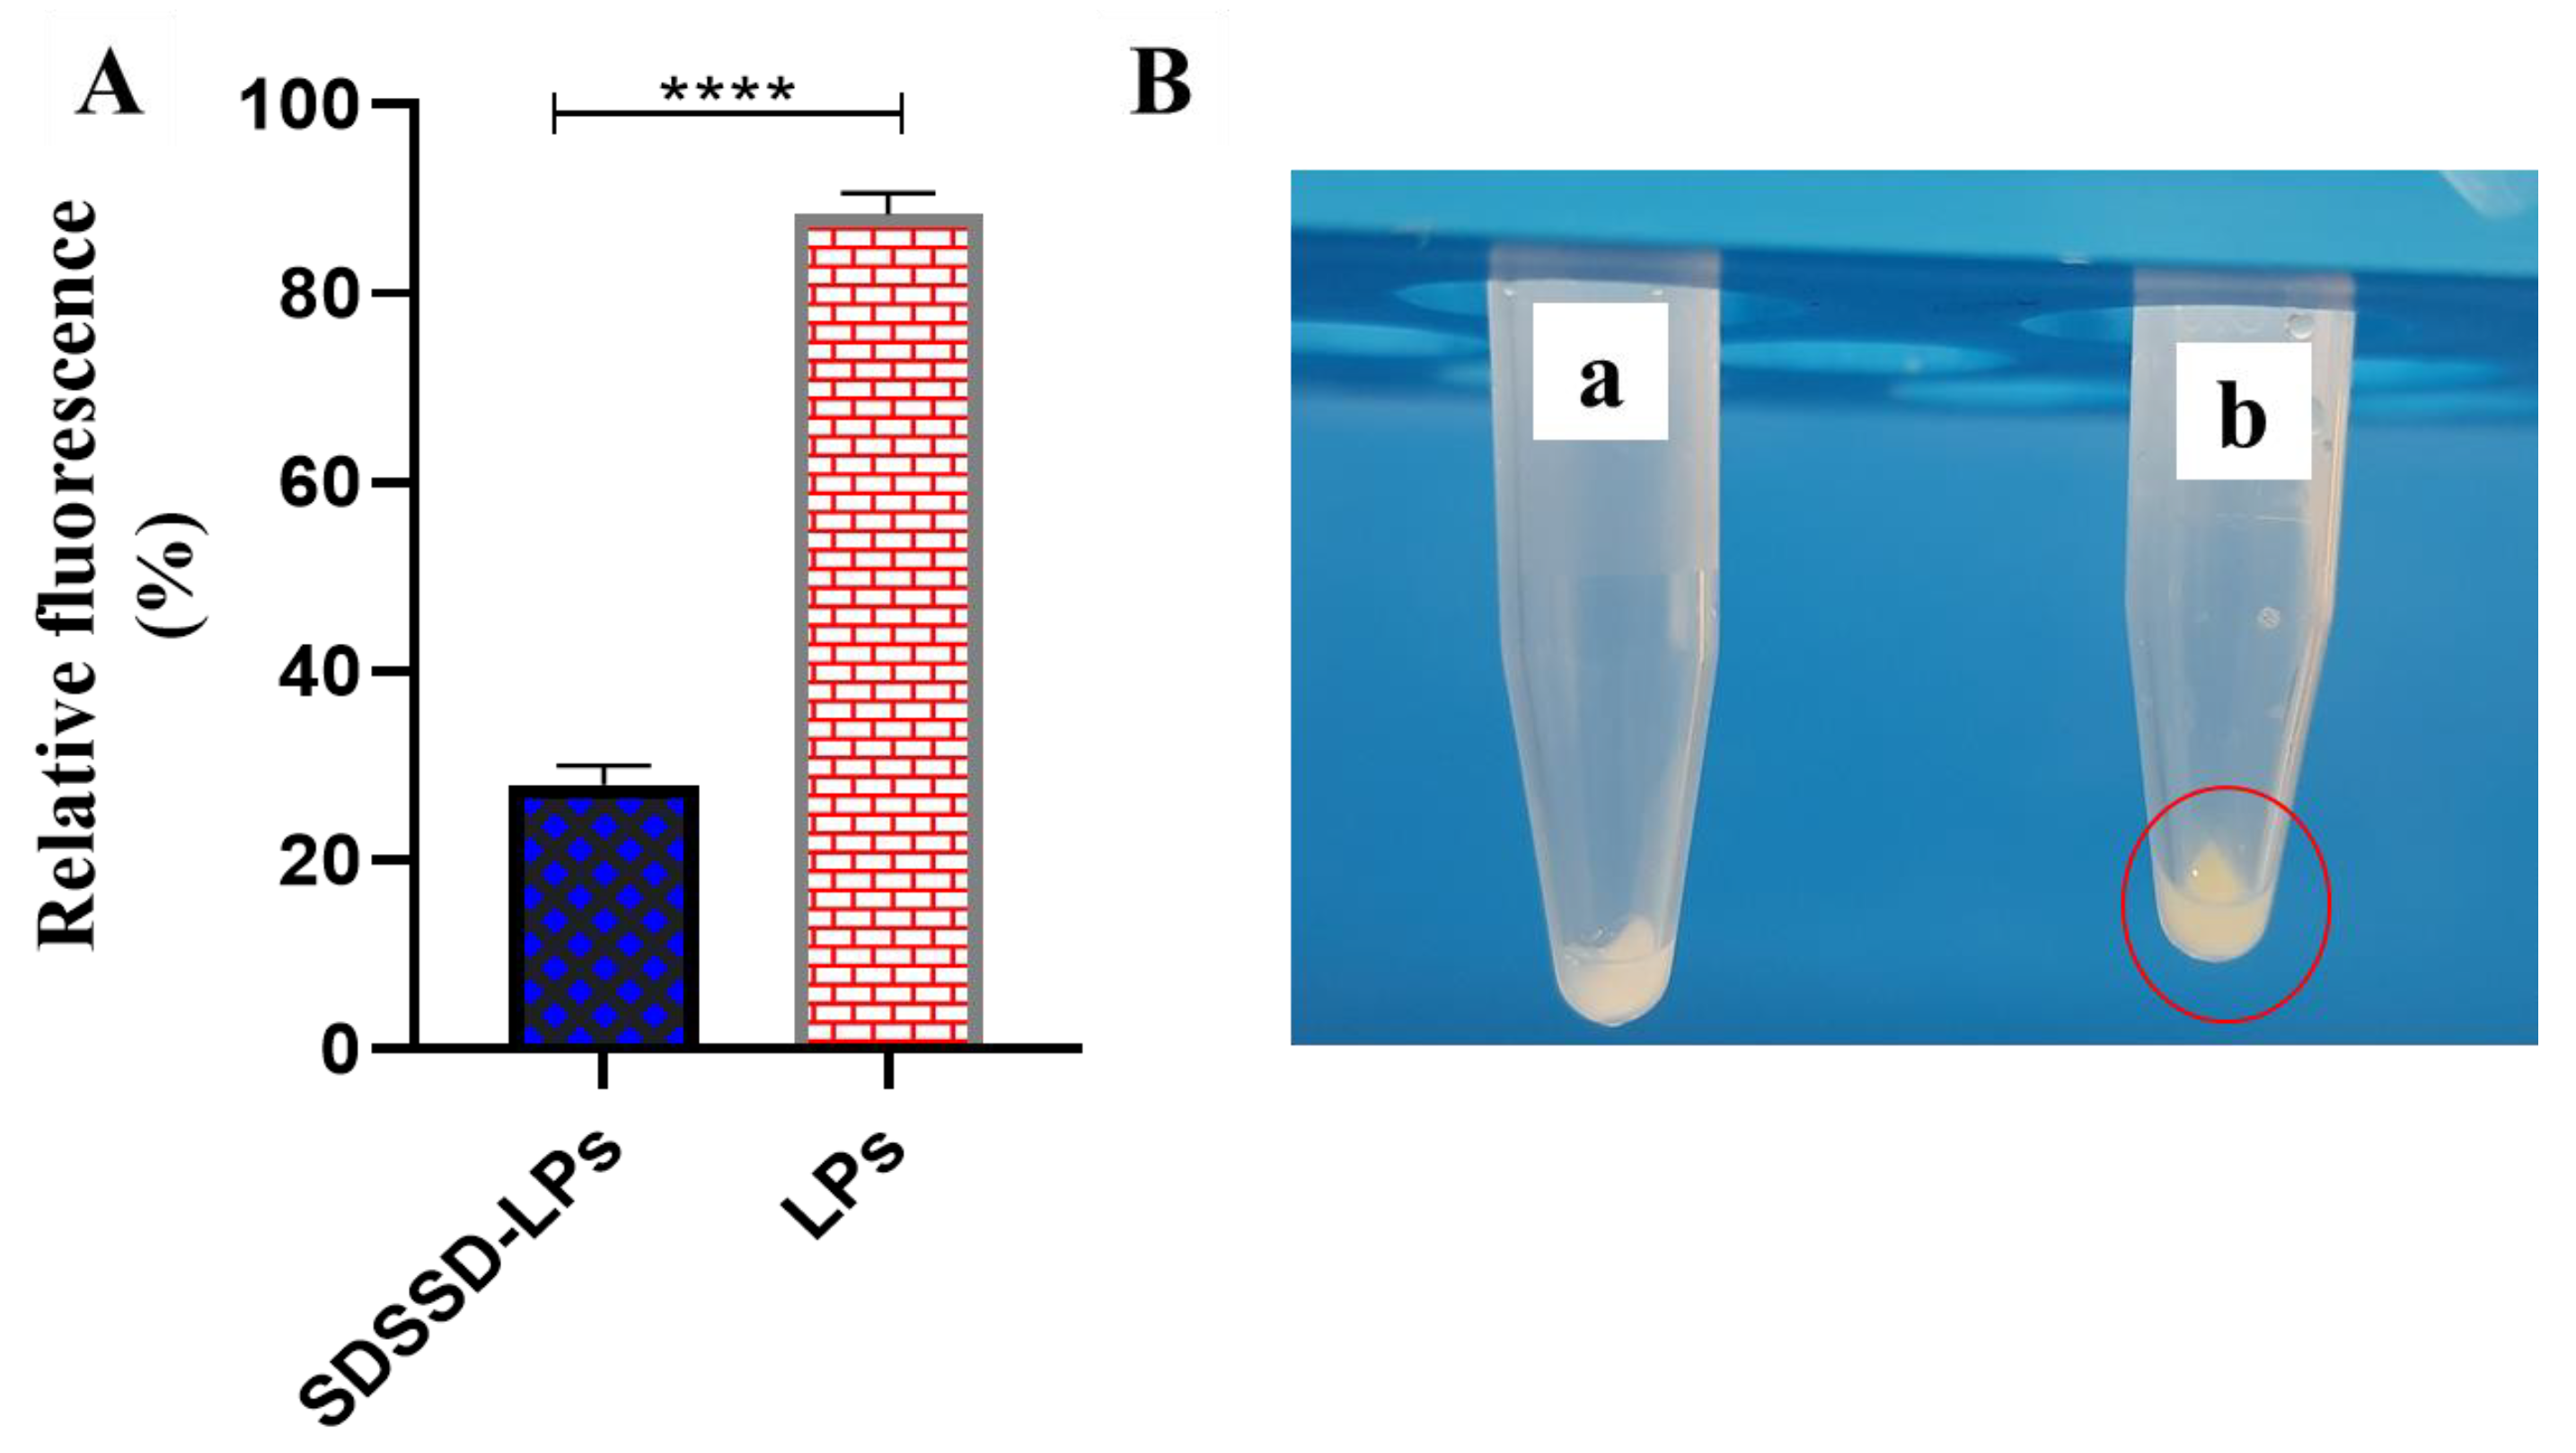
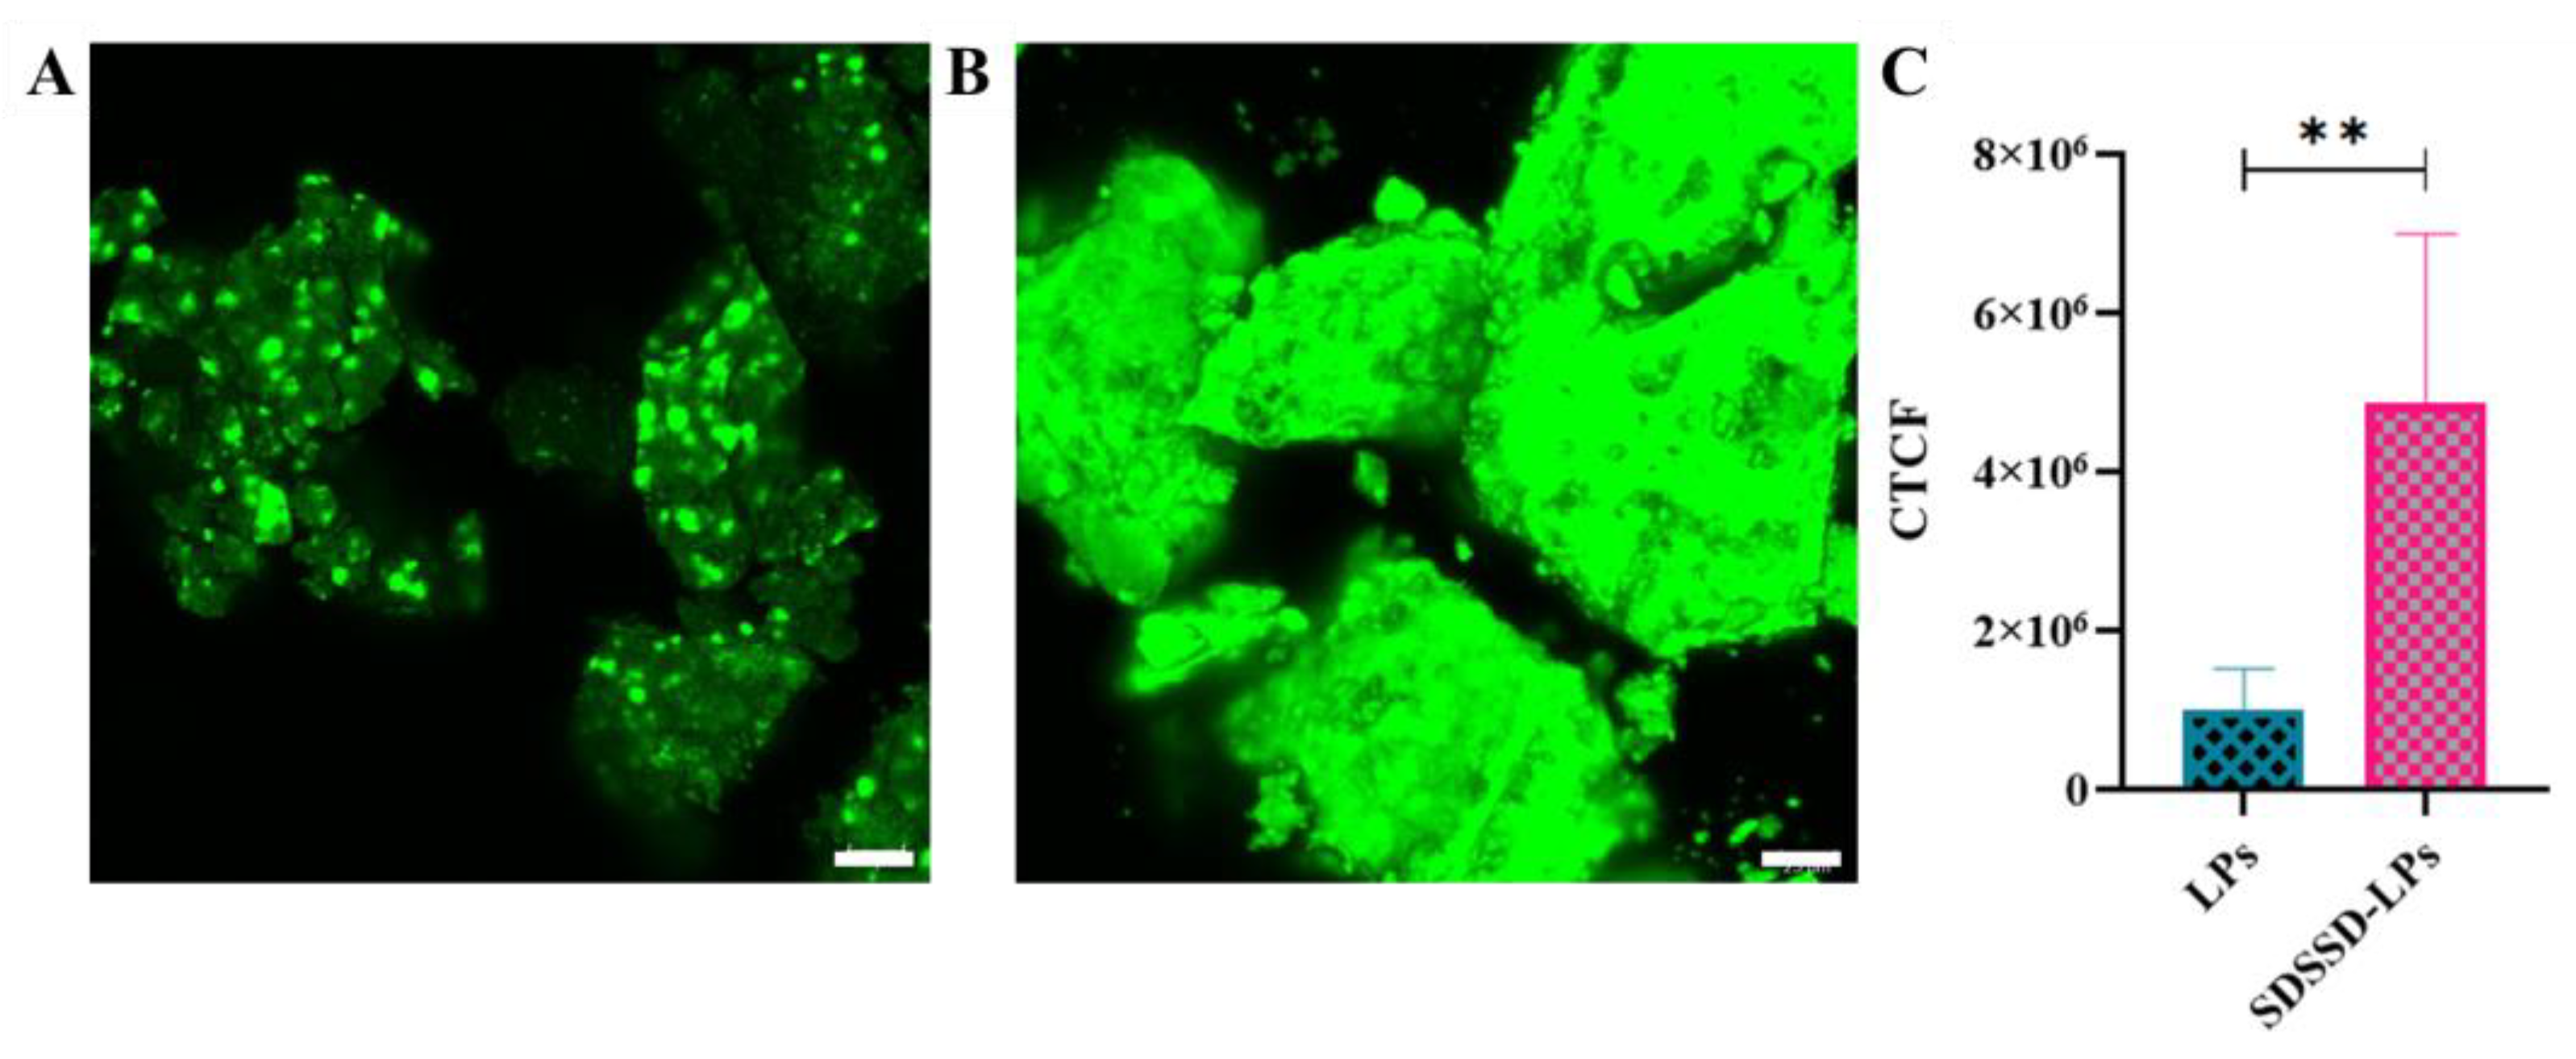
2.6.5. In Vitro Bone Mineral Binding Assay
Confocal Analysis
2.7. Statistical Analysis
3. Results and Discussion
3.1. Synthesis and Characterization of SDSSD
3.2. Characterization of SDSSD-DSPE
3.2.1. 1H NMR
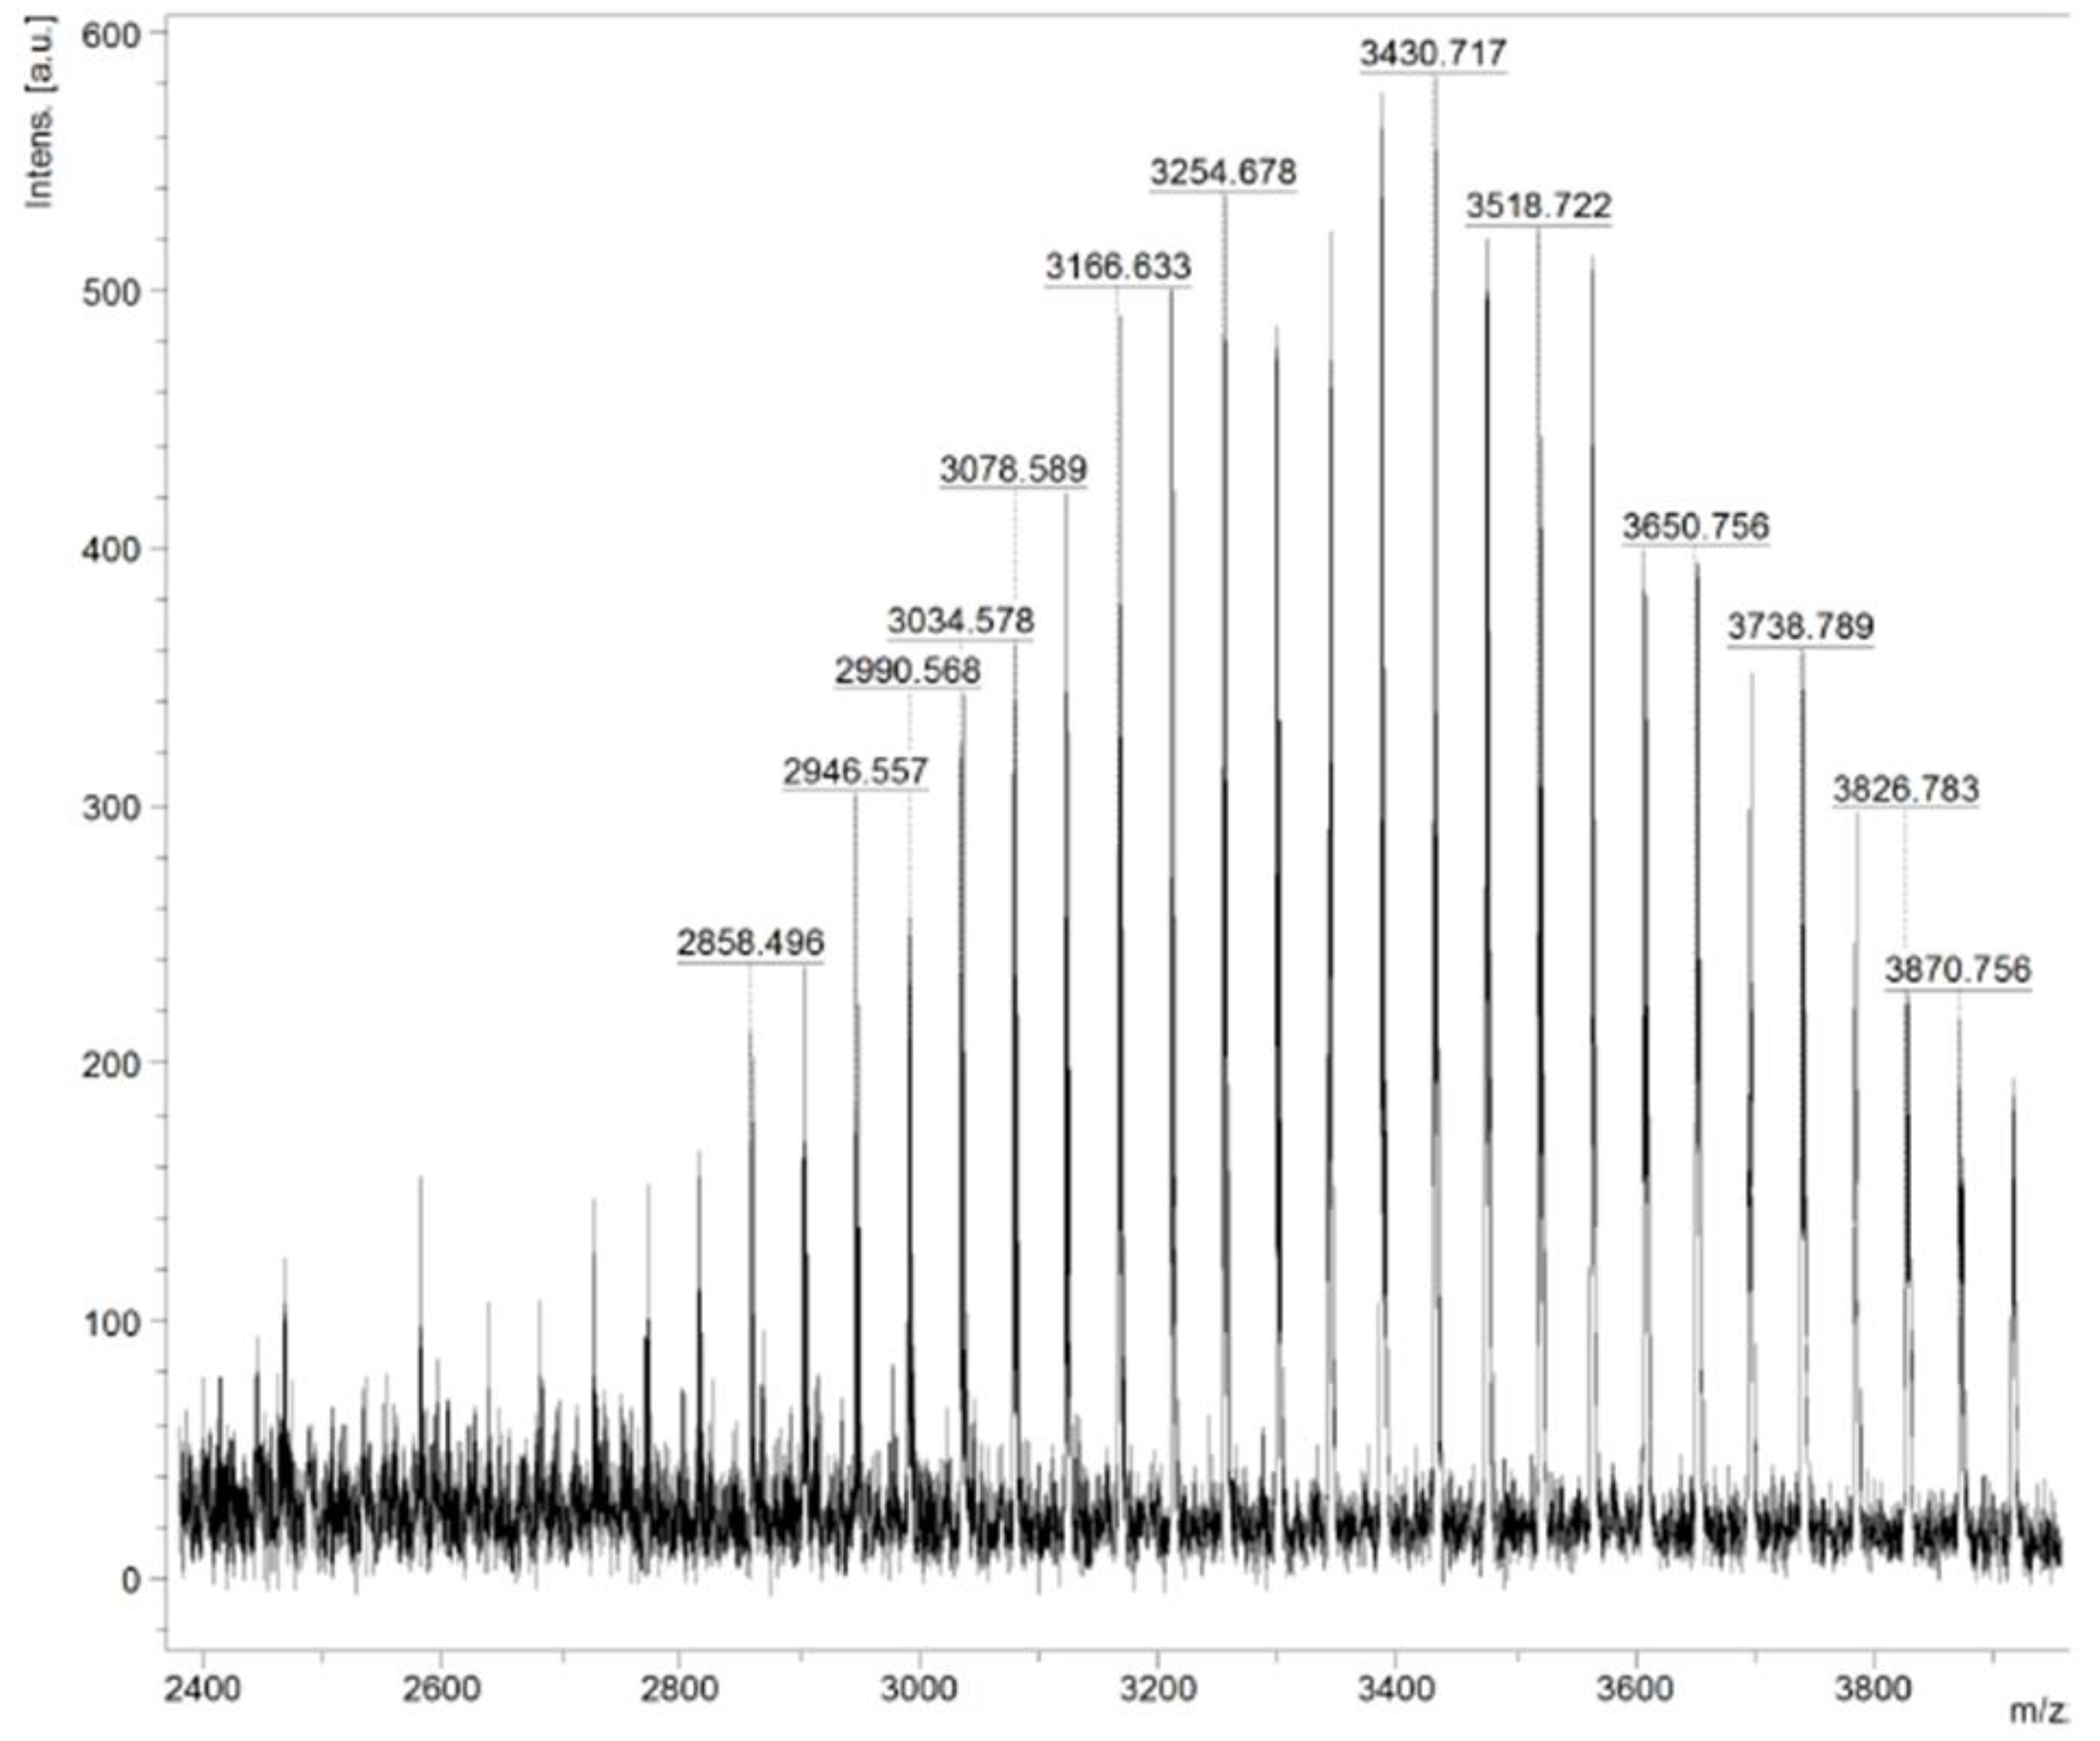
3.2.2. Maldi TOF
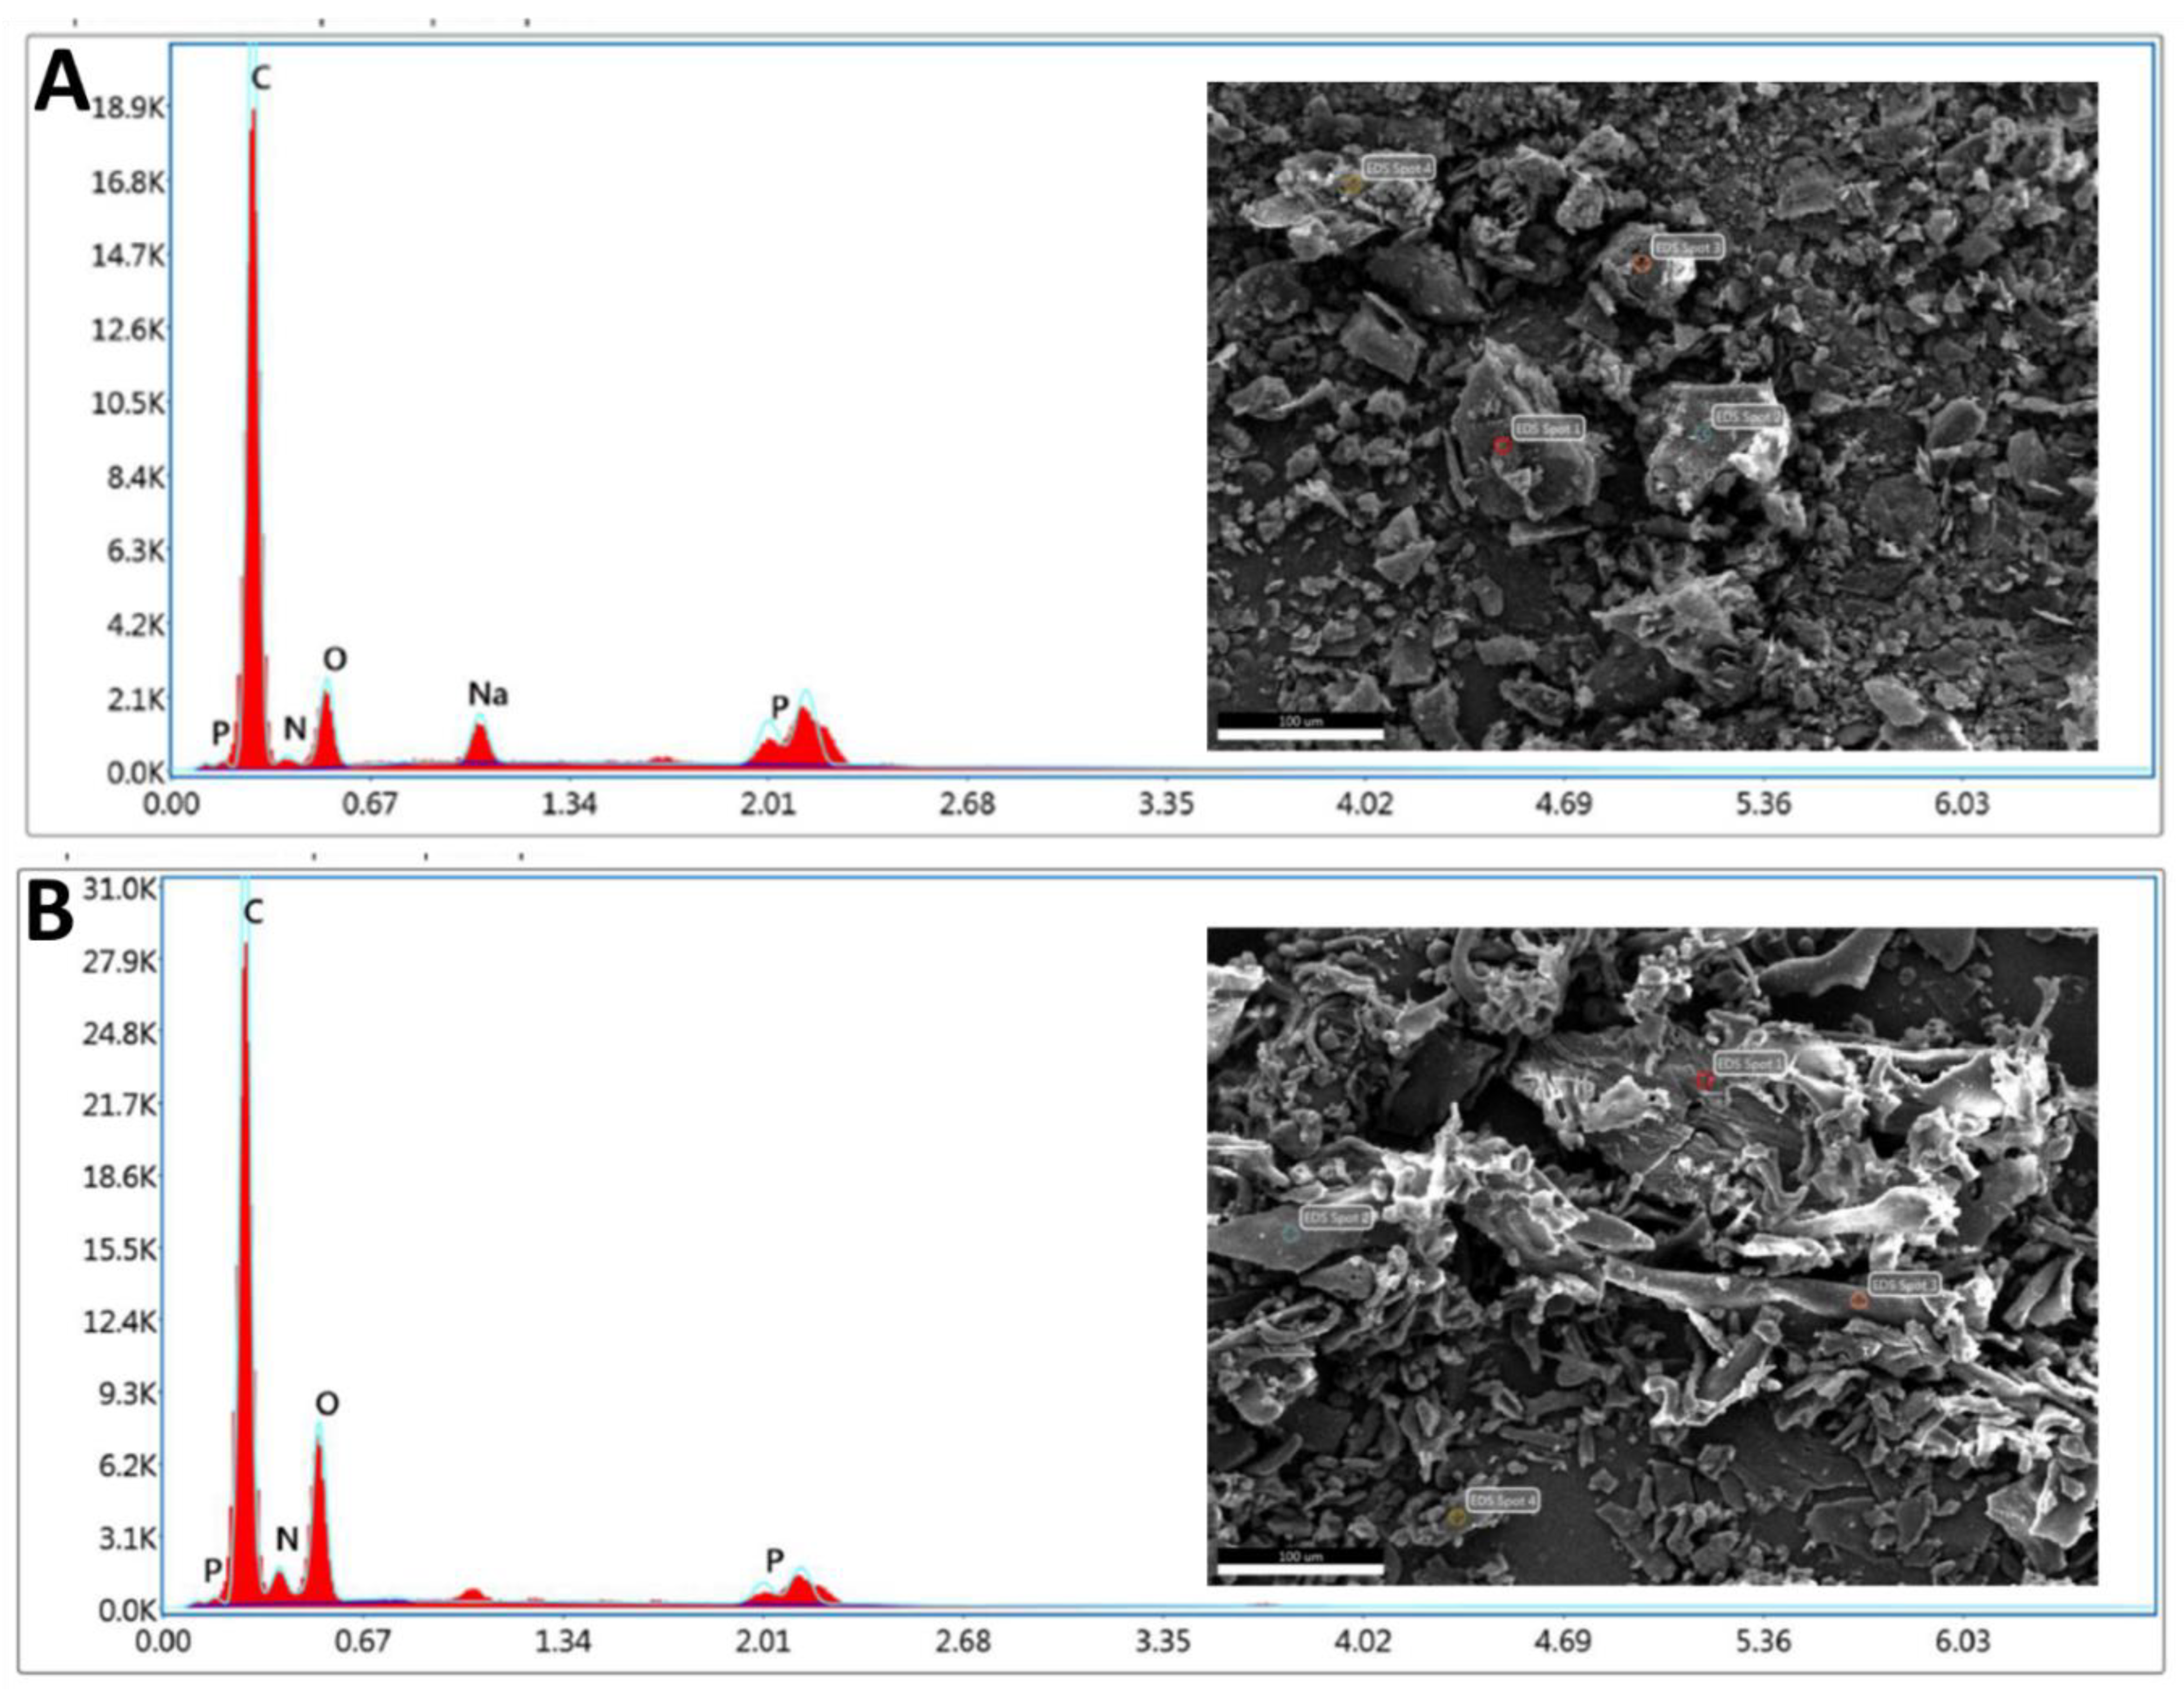
3.2.3. SEM/EDX
3.2.4. Percentage Conjugation Efficiency of SDSSD-DSPE
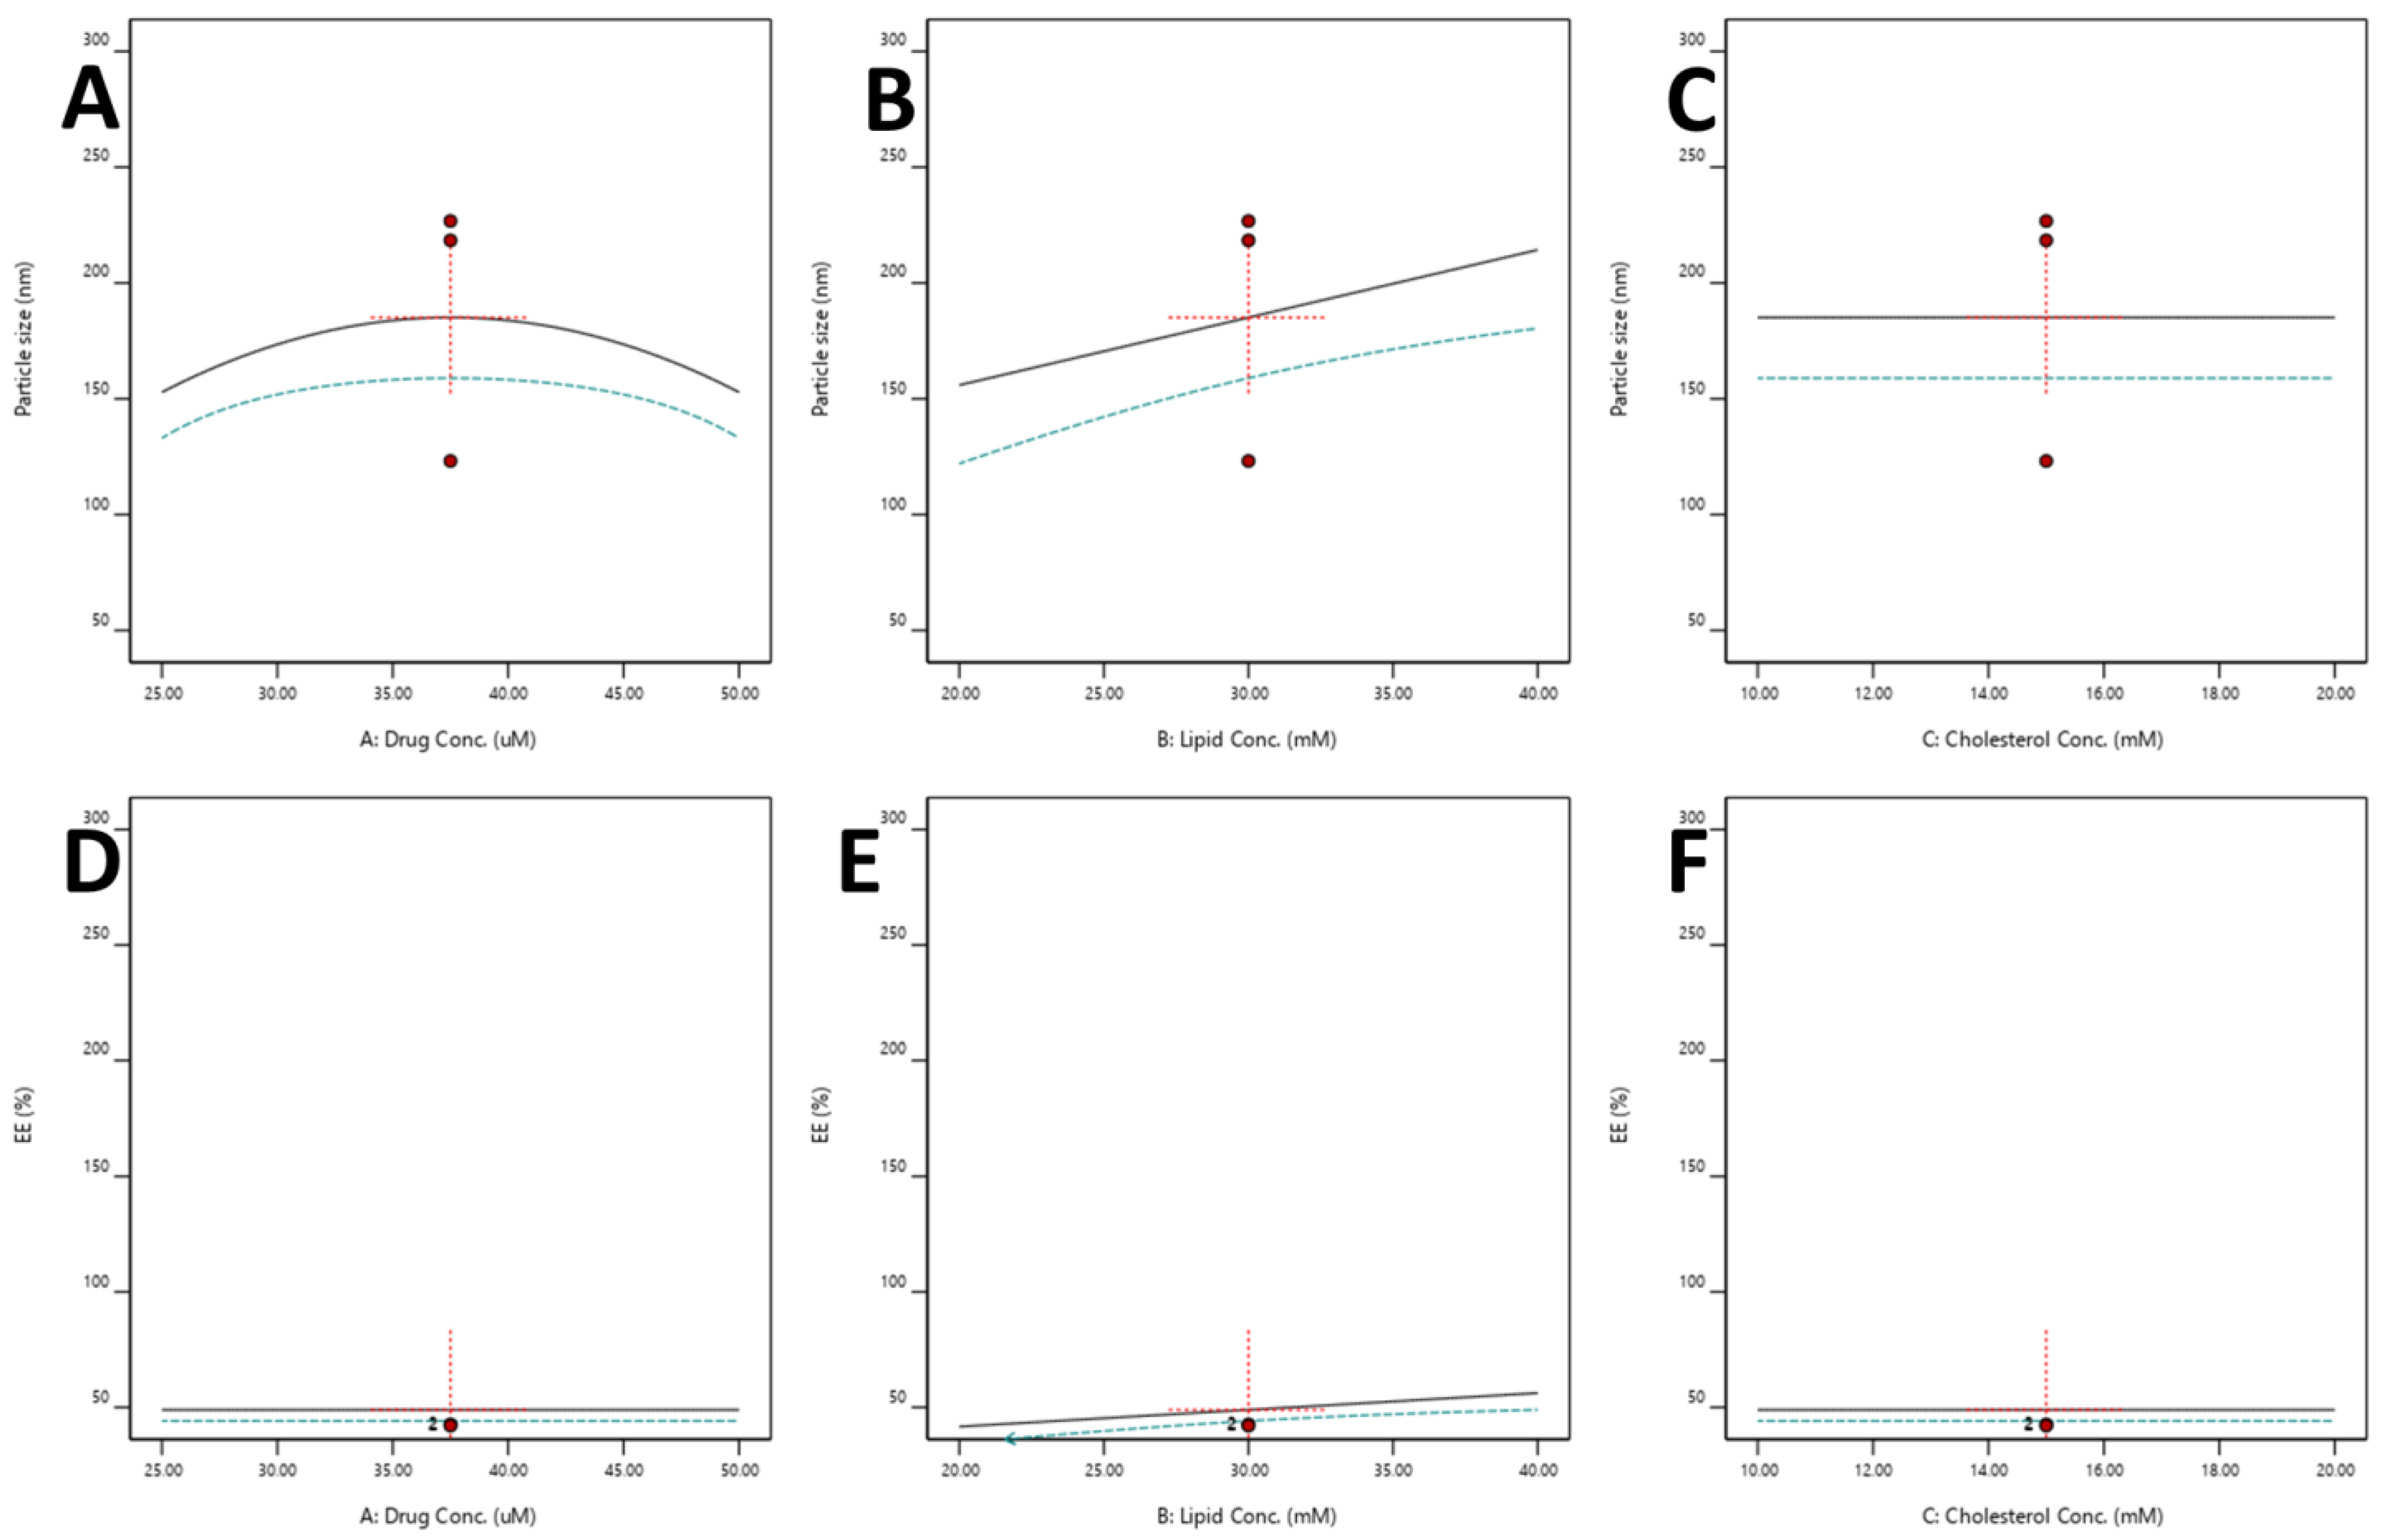
3.2.5. Optimization of SDSSD-LPs
Effect of Independent Variables on the Particle Size
Effect of Independent Variables on %EE
3.2.6. Model Verification
3.3. Characterization of SDSSD-LPs
3.3.1. Particle Size and Zeta Potential
3.3.2. % EE
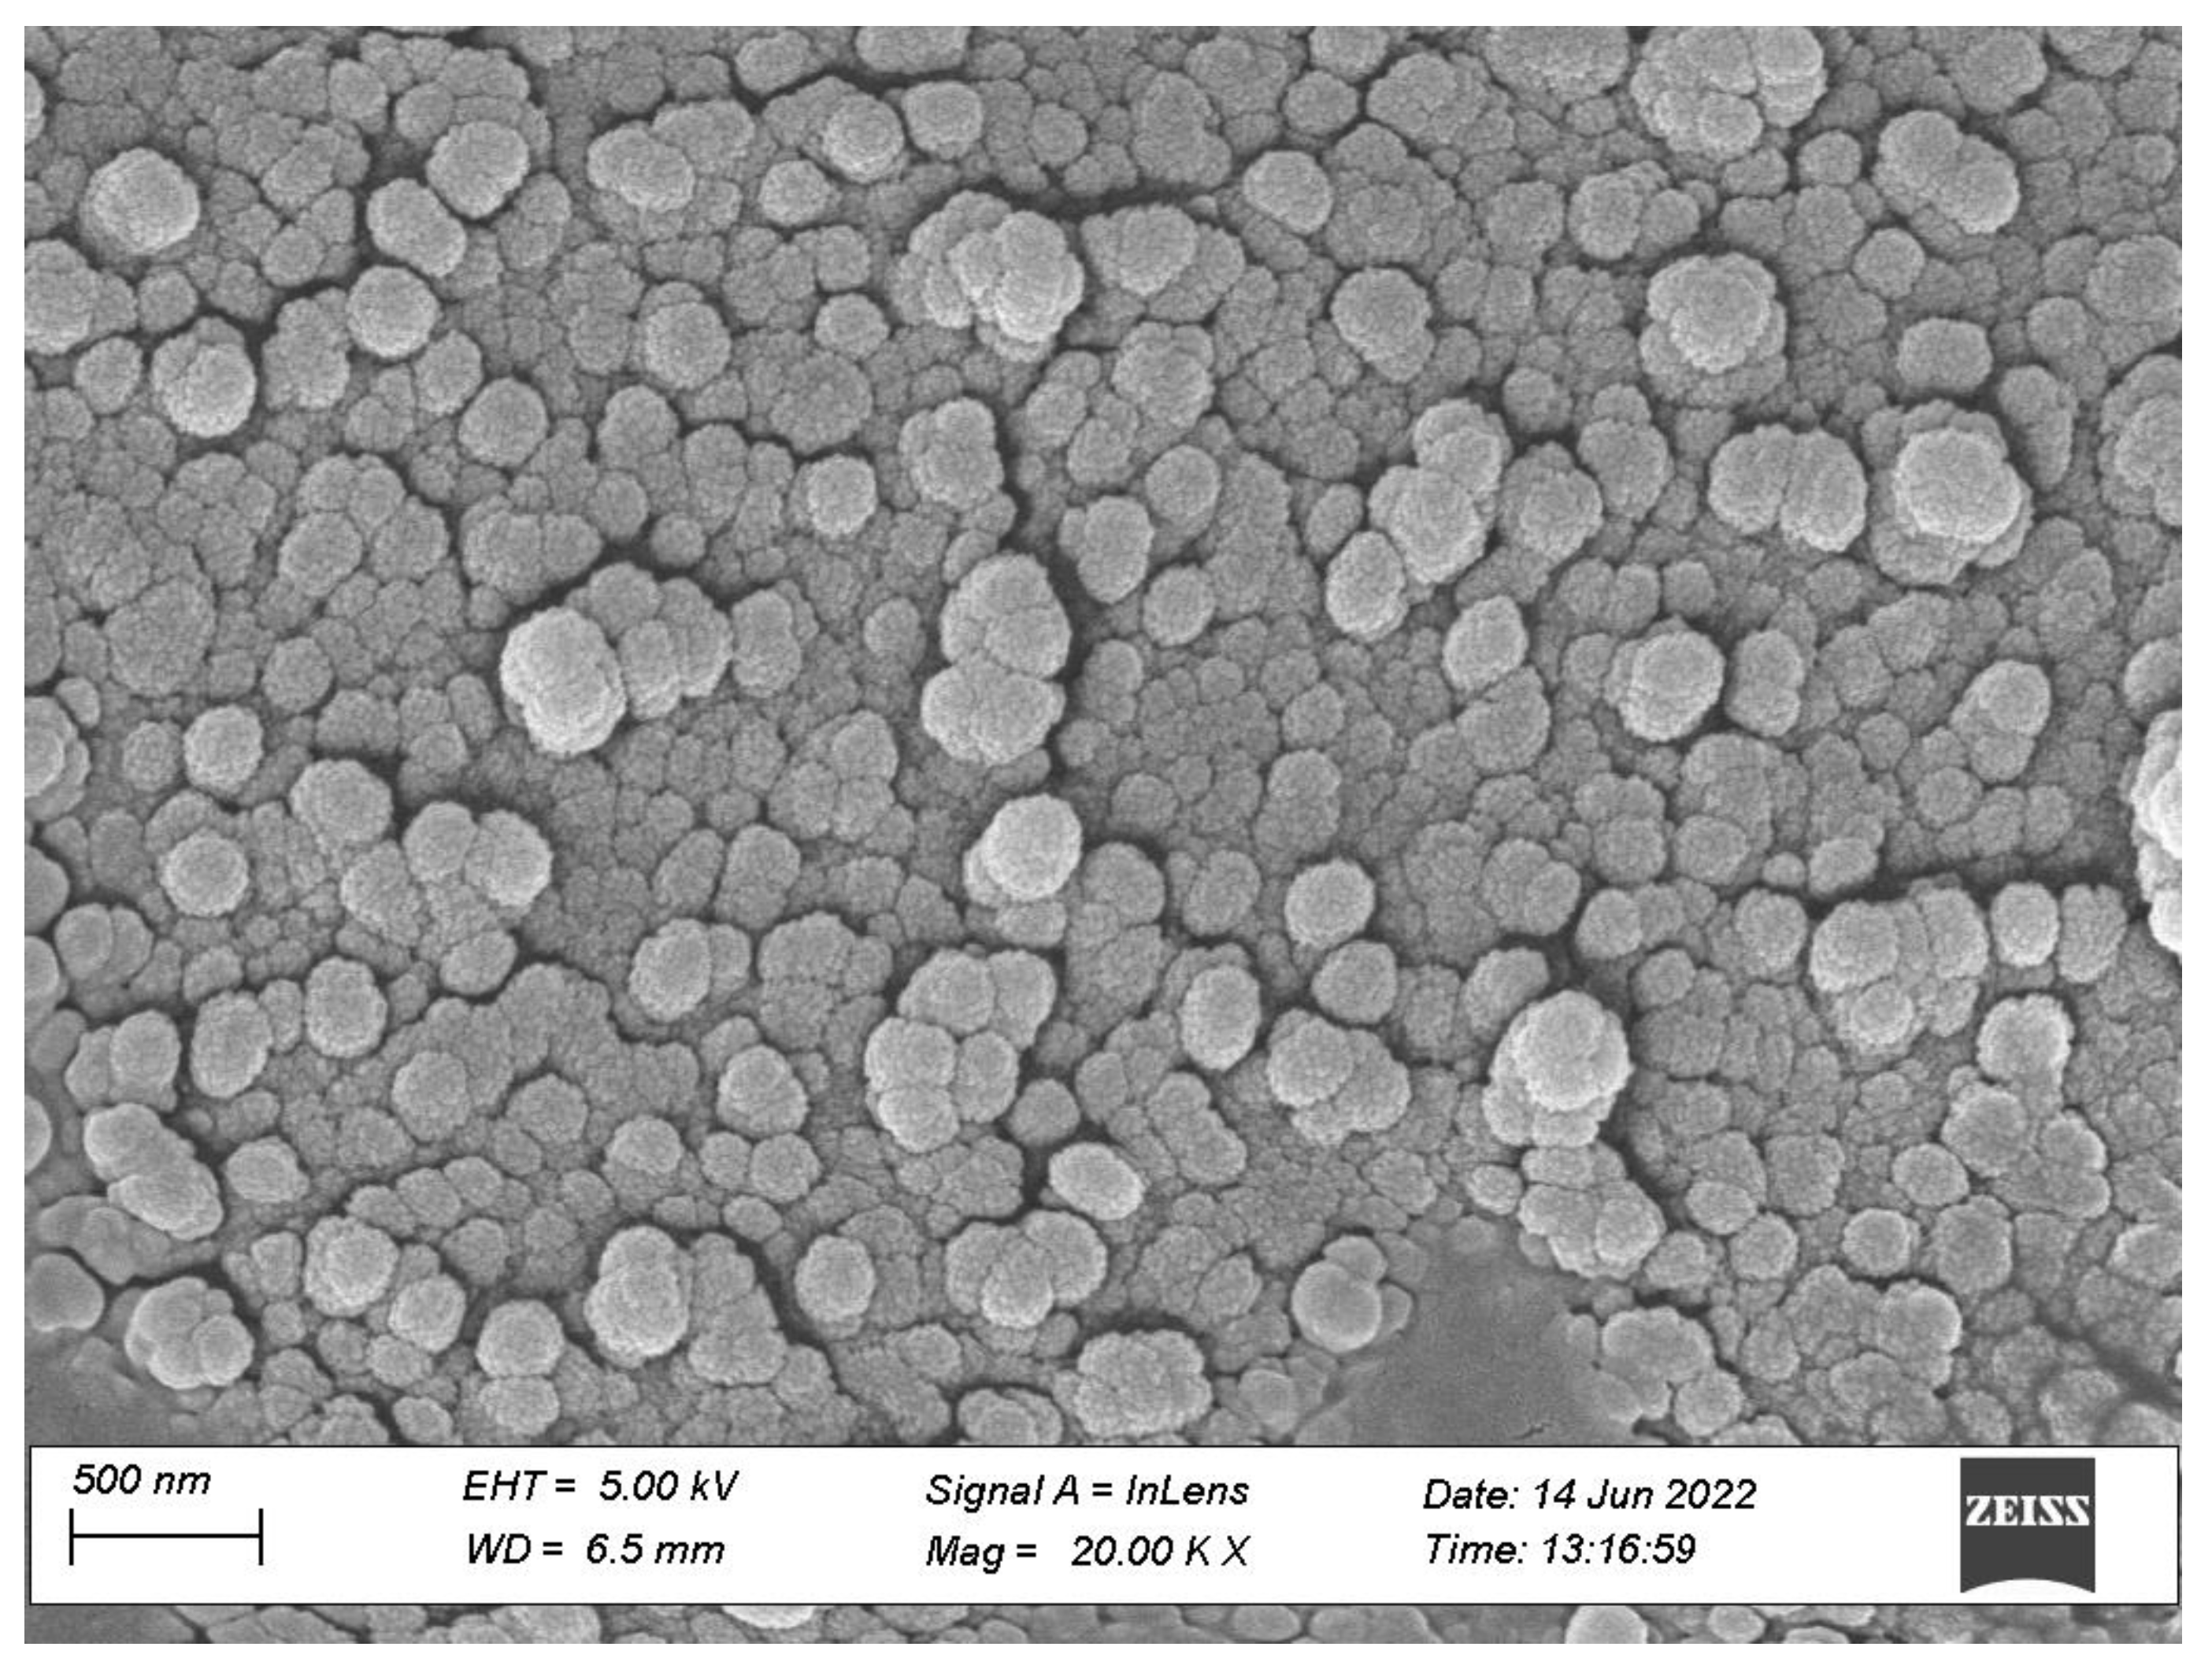
3.3.3. Morphological Characterization
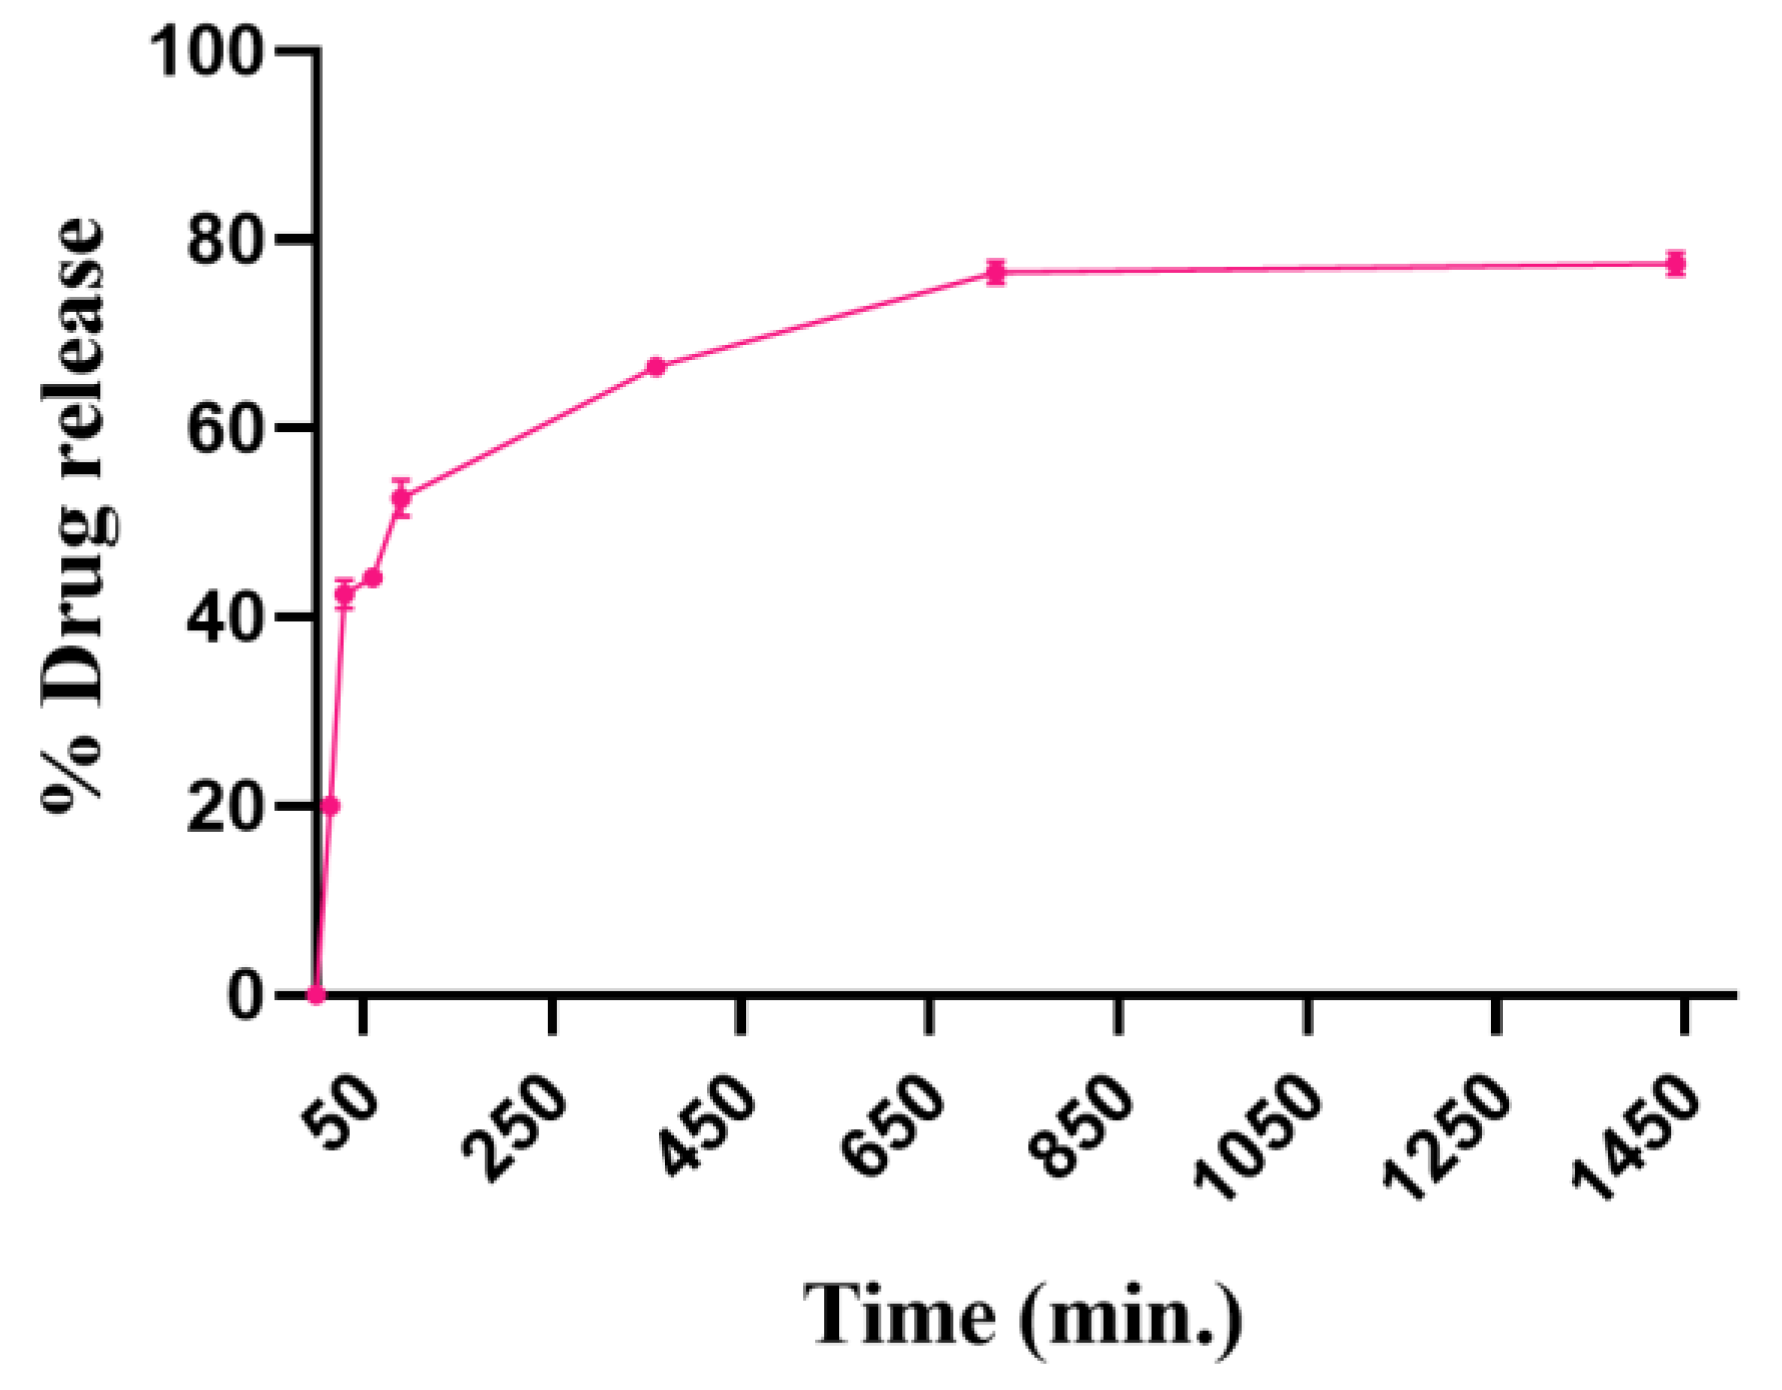
3.3.4. In Vitro Drug Release
3.3.5. In Vitro Bone Mineral Binding Assay
4. Conclusions and Future Perspective
Supplementary Materials
Author Contributions
Funding
Institutional Review Board Statement
Informed Consent Statement
Data Availability Statement
Acknowledgments
Conflicts of Interest
References
- Kanis, J.A. Diagnosis of Osteoporosis and Assessment of Fracture Risk. Lancet 2002, 359, 1929–1936. [Google Scholar] [CrossRef]
- Chen, J.S.; Sambrook, P.N. Antiresorptive Therapies for Osteoporosis: A Clinical Overview. Nat. Rev. Endocrinol. 2011, 8, 81–91. [Google Scholar] [CrossRef] [PubMed]
- Khosla, S.; Hofbauer, L.C. Osteoporosis Treatment: Recent Developments and Ongoing Challenges. Lancet Diabetes Endocrinol. 2017, 5, 898–907. [Google Scholar] [CrossRef] [PubMed]
- Augustine, M.; Horwitz, M.J. Parathyroid Hormone and Parathyroid Hormone-Related Protein Analogs as Therapies for Osteoporosis. Curr. Osteoporos. Rep. 2013, 11, 400–406. [Google Scholar] [CrossRef] [PubMed]
- Estell, E.G.; Rosen, C.J. Emerging Insights into the Comparative Effectiveness of Anabolic Therapies for Osteoporosis. Nat. Rev. Endocrinol. 2021, 17, 31–46. [Google Scholar] [CrossRef]
- Keshishi, D.; Makunts, T.; Abagyan, R. Common Osteoporosis Drug Associated with Increased Rates of Depression and Anxiety. Sci. Rep. 2021, 11, 23956. [Google Scholar] [CrossRef]
- Eastell, R.; Walsh, J.S. Anabolic Treatment for Osteoporosis: Teriparatide. Clin. Cases Miner. Bone Metab. 2017, 14, 173–178. [Google Scholar] [CrossRef]
- Komatsu, J.; Nagura, N.; Iwase, H.; Igarashi, M.; Ohbayashi, O.; Nagaoka, I.; Kaneko, K. Effect of Intermittent Administration of Teriparatide on the Mechanical and Histological Changes in Bone Grafted with β-Tricalcium Phosphate Using a Rabbit Bone Defect Model. Exp. Ther. Med. 2018, 15, 19–30. [Google Scholar] [CrossRef]
- Salave, S.; Rana, D.; Benival, D. Dual Targeting Anti-Osteoporotic Therapy through Potential Nanotherapeutic Approaches. Pharm. Nanotechnol. 2022, 10, 384–392. [Google Scholar]
- Salave, S.; Rana, D.; Benival, D. Peptide Functionalised Nanocarriers for Bone Specific Delivery of PTH (1-34) in Osteoporosis. Curr. Nanomedicine 2021, 11, 142–148. [Google Scholar] [CrossRef]
- Jack, K.S.; Vizcarra, T.G.; Trau, M. Characterization and Surface Properties of Amino-Acid-Modified Carbonate-Containing Hydroxyapatite Particles. Langmuir 2007, 23, 12233–12242. [Google Scholar] [CrossRef] [PubMed]
- Palazzo, B.; Walsh, D.; Iafisco, M.; Foresti, E.; Bertinetti, L.; Martra, G.; Bianchi, C.L.; Cappelletti, G.; Roveri, N. Amino Acid Synergetic Effect on Structure, Morphology and Surface Properties of Biomimetic Apatite Nanocrystals. Acta Biomater. 2009, 5, 1241–1252. [Google Scholar] [CrossRef]
- Rautaray, D.; Mandal, S.; Sastry, M. Synthesis of Hydroxyapatite Crystals Using Amino Acid-Capped Gold Nanoparticles as a Scaffold. Langmuir 2005, 21, 5185–5191. [Google Scholar] [CrossRef]
- Tavafoghi, M.; Cerruti, M. The Role of Amino Acids in Hydroxyapatite Mineralization. J. R. Soc. Interface 2016, 13, 20160462. [Google Scholar] [CrossRef]
- Yarbrough, D.K.; Hagerman, E.; Eckert, R.; He, J.; Choi, H.; Cao, N.; Le, K.; Hedger, J.; Qi, F.; Anderson, M.; et al. Specific Binding and Mineralization of Calcified Surfaces by Small Peptides. Calcif. Tissue Int. 2010, 86, 58–66. [Google Scholar] [CrossRef] [PubMed]
- Zhang, G.; Guo, B.; Wu, H.; Tang, T.; Zhang, B.T.; Zheng, L.; He, Y.; Yang, Z.; Pan, X.; Chow, H.; et al. A Delivery System Targeting Bone Formation Surfaces to Facilitate RNAi-Based Anabolic Therapy. Nat. Med. 2012, 18, 307–314. [Google Scholar] [CrossRef]
- Zhou, Z.; Cai, L.; Gao, P.; Yao, L.; Hii Ru Yie, K.; Al-Bishari, A.M.; Cai, L.; Cai, K.; Zhang, H.; Xu, L. Enhancing Osteoblast Bioactivity through SDSSD Peptide-Immobilized on the Surface of Zirconia Implants. Mater. Lett. 2022, 307, 131010. [Google Scholar] [CrossRef]
- Cai, M.; Liu, Y.; Tian, Y.; Liang, Y.; Xu, Z.; Liu, F.; Lai, R.; Zhou, Z.; Liu, M.; Dai, J.; et al. Osteogenic Peptides in Periodontal Ligament Stem Cell-Containing Three-Dimensional Bioscaffolds Promote Bone Healing. Biomater. Sci. 2022, 10, 1765–1775. [Google Scholar] [CrossRef] [PubMed]
- Tang, Y.; Chen, Y.; Huang, L.; Gao, F.; Sun, H.; Huang, C. Intramembranous Ossification Imitation Scaffold with the Function of Macrophage Polarization for Promoting Critical Bone Defect Repair. ACS Appl. Bio Mater. 2020, 3, 3569–3581. [Google Scholar] [CrossRef]
- Sun, Y.; Ye, X.; Cai, M.; Liu, X.; Xiao, J.; Zhang, C.; Wang, Y.; Yang, L.; Liu, J.; Li, S.; et al. Osteoblast-Targeting-Peptide Modified Nanoparticle for SiRNA/MicroRNA Delivery. ACS Nano 2016, 10, 5759–5768. [Google Scholar] [CrossRef]
- Cui, Y.; Guo, Y.; Kong, L.; Shi, J.; Liu, P.; Li, R.; Geng, Y.; Gao, W.; Zhang, Z.; Fu, D. A Bone-Targeted Engineered Exosome Platform Delivering SiRNA to Treat Osteoporosis. Bioact. Mater. 2022, 10, 207–221. [Google Scholar] [CrossRef] [PubMed]
- Liu, M.; Zhu, D.; Jin, F.; Li, S.; Liu, X.; Wang, X. Peptide Modified Geniposidic Acid Targets Bone and Effectively Promotes Osteogenesis. J. Orthop. Translat. 2023, 38, 23–31. [Google Scholar] [CrossRef]
- Kim, J.W.; Lee, K.K.; Park, K.W.; Kim, M.; Lee, C.S. Genetically Modified Ferritin Nanoparticles with Bone-Targeting Peptides for Bone Imaging. Int. J. Mol. Sci. 2021, 22, 4854. [Google Scholar] [CrossRef] [PubMed]
- Liang, H.; Xu, X.; Feng, X.; Ma, L.; Deng, X.; Wu, S.; Liu, X.; Yang, C. Gold Nanoparticles-Loaded Hydroxyapatite Composites Guide Osteogenic Differentiation of Human Mesenchymal Stem Cells through Wnt/β-Catenin Signaling Pathway. Int. J. Nanomed. 2019, 14, 6151–6163. [Google Scholar] [CrossRef]
- Shen, M.; Wang, L.; Feng, L.; Gao, Y.; Li, S.; Wu, Y.; Xu, C.; Pei, G. BFGF-Loaded Mesoporous Silica Nanoparticles Promote Bone Regeneration Through the Wnt/β-Catenin Signalling Pathway. Int. J. Nanomed. 2022, 17, 2593–2608. [Google Scholar] [CrossRef]
- Bulbake, U.; Doppalapudi, S.; Kommineni, N.; Khan, W. Liposomal Formulations in Clinical Use: An Updated Review. Pharmaceutics 2017, 9, 12. [Google Scholar] [CrossRef] [PubMed]
- Sainaga Jyothi, V.G.S.; Bulusu, R.; Venkata Krishna Rao, B.; Pranothi, M.; Banda, S.; Kumar Bolla, P.; Kommineni, N. Stability Characterization for Pharmaceutical Liposome Product Development with Focus on Regulatory Considerations: An Update. Int. J. Pharm. 2022, 624, 122022. [Google Scholar] [CrossRef]
- Bulbake, U.; Kommineni, N.; Khan, W. Liposomal Drug Delivery System and Its Clinically Available Products. In Handbook of Materials for Nanomedicine, 1st ed.; Torchilin, V., Ed.; Taylor & Francis Group: New York, NY, USA, 2020; p. 520. [Google Scholar]
- De Vita, A.; Liverani, C.; Molinaro, R.; Martinez, J.O.; Hartman, K.A.; Spadazzi, C.; Miserocchi, G.; Taraballi, F.; Evangelopoulos, M.; Pieri, F.; et al. Lysyl Oxidase Engineered Lipid Nanovesicles for the Treatment of Triple Negative Breast Cancer. Sci. Rep. 2021, 11, 5107. [Google Scholar] [CrossRef]
- Palomo, J.M. Solid-Phase Peptide Synthesis: An Overview Focused on the Preparation of Biologically Relevant Peptides. RSC Adv. 2014, 4, 32658–32672. [Google Scholar] [CrossRef]
- Merrifield, R.B. Solid Phase Peptide Synthesis. I. The Synthesis of a Tetrapeptide. J. Am. Chem. Soc. 1963, 85, 2149–2154. [Google Scholar] [CrossRef]
- Wang, S.; Zhao, C.; Liu, P.; Wang, Z.; Ding, J.; Zhou, W. Facile Construction of Dual-Targeting Delivery System by Using Lipid Capped Polymer Nanoparticles for Anti-Glioma Therapy. RSC Adv. 2017, 8, 444–453. [Google Scholar] [CrossRef] [Green Version]
- Salave, S.; Jain, S.; Shah, R.; Benival, D. Quantification of Anti-Osteoporotic Anabolic Peptide in Stealth Lipid Nanovesicles Through Validated RP-HPLC Method. J. AOAC Int. 2022, 106, 40–48. [Google Scholar] [CrossRef]
- Salave, S.; Rana, D.; Kumar, H.; Kommineni, N.; Benival, D. Anabolic Peptide-Enriched Stealth Nanoliposomes for Effective Anti-Osteoporotic Therapy. Pharmaceutics 2022, 14, 2417. [Google Scholar] [CrossRef] [PubMed]
- Salave, S.; Rana, D.; Benival, D. Encapsulation of Anabolic Peptide in Lipid Nano Vesicles for Osteoporosis. Curr. Protein Pept. Sci. 2022, 23, 495–503. [Google Scholar]
- Rana, D.; Salave, S.; Jain, S.; Shah, R.; Benival, D. Systematic Development and Optimization of Teriparatide-Loaded Nanoliposomes Employing Quality by Design Approach for Osteoporosis. J. Pharm. Innov. 2022, 1–15. [Google Scholar] [CrossRef]
- Hassan, H.; Adam, S.K.; Alias, E.; Affandi, M.M.R.M.M.; Shamsuddin, A.F.; Basir, R. Central Composite Design for Formulation and Optimization of Solid Lipid Nanoparticles to Enhance Oral Bioavailability of Acyclovir. Molecules 2021, 26, 5432. [Google Scholar] [CrossRef]
- Song, H.; Zhang, J.; Liu, X.; Deng, T.; Yao, P.; Zhou, S.; Yan, W. Development of a Bone Targeted Thermosensitive Liposomal Doxorubicin Formulation Based on a Bisphosphonate Modified Non-Ionic Surfactant. Pharm. Dev. Technol. 2016, 21, 680–687. [Google Scholar] [CrossRef]
- Hao, Q.; Xu, G.; Yang, Y.; Sun, Y.; Cong, D.; Li, H.; Liu, X.; Wang, Z.; Zhang, Z.; Chen, J.; et al. Oestrone-Targeted Liposomes for Mitoxantrone Delivery via Oestrogen Receptor—Synthesis, Physicochemical Characterization and in-Vitro Evaluation. J. Pharm. Pharmacol. 2017, 69, 991–1001. [Google Scholar] [CrossRef]
- Jaafar-Maalej, C.; Diab, R.; Andrieu, V.; Elaissari, A.; Fessi, H. Ethanol Injection Method for Hydrophilic and Lipophilic Drug-Loaded Liposome Preparation. J. Liposome Res. 2010, 20, 228–243. [Google Scholar] [CrossRef]
- Gouda, A.; Sakr, O.S.; Nasr, M.; Sammour, O. Ethanol Injection Technique for Liposomes Formulation: An Insight into Development, Influencing Factors, Challenges and Applications. J. Drug Deliv. Sci. Technol. 2021, 61, 102174. [Google Scholar] [CrossRef]
- Pons, M.; Foradada, M.; Estelrich, J. Liposomes Obtained by the Ethanol Injection Method. Int. J. Pharm. 1993, 95, 51–56. [Google Scholar] [CrossRef]
- Jain, S.K.; Gupta, Y.; Jain, A.; Bhola, M. Multivesicular Liposomes Bearing Celecoxib-β-Cyclodextrin Complex for Transdermal Delivery. Drug Deliv. 2007, 14, 327–335. [Google Scholar] [CrossRef] [PubMed]


| Factor | Name | Units | Levels | |
|---|---|---|---|---|
| Low (−1) | High (+1) | |||
| 1 | Drug concentration | μM | 16.48 | 58.52 |
| 2 | Lipid concentration | mM | 13.18 | 46.82 |
| 3 | Cholesterol concentration | mM | 6.59 | 23.41 |
| Constant parameters | ||||
| 4 | DSPE-PEG2000 | mM | 2 | |
| 5 | SDSSD-DSPE | mM | 1 | |
| 6 | Stirring rate | RPM | 500 | |
| Compound | DSPE-PEG2000-COOH | SDSSD-DSPE | ||
|---|---|---|---|---|
| Element counts | Nitrogen counts (NK) | Oxygen counts (OK) | Nitrogen counts (NK) | Oxygen counts (OK) |
| Weight % | 2.68 | 12.56 | 7.80 | 25.89 |
| Atomic % | 2.58 | 10.58 | 7.42 | 21.58 |
| Terms | Particle Size (nm) | EE (%) | Inference |
|---|---|---|---|
| Model p-value | 0.01 | 0.03 | Significant |
| Model F value | 6.18 | 5.58 | |
| Lack of Fit | 0.79 | 0.29 | Non-significant |
| R2 | 0.47 | 0.27 | |
| Adjusted R2 | 0.39 | 0.22 | |
| Predicted R2 | 0.22 | 0.08 | |
| Adeq Precision | 7.40 | 6.27 |
| Independent Variables | Values | Responses | Predicted Value | Experimental Values | Residual Values (%) |
|---|---|---|---|---|---|
| Drug conc. (µM) | 21.22 ± 0.86 | Particle size (nm) | 185.17 ± 1.43 | 183.07 ± 0.85 | 1.13 |
| Lipid conc. (mM) | 48.82 ± 1.42 | EE (%) | 62.64 ± 0.89 | 66.72 ± 4.22 | −6.49 |
Disclaimer/Publisher’s Note: The statements, opinions and data contained in all publications are solely those of the individual author(s) and contributor(s) and not of MDPI and/or the editor(s). MDPI and/or the editor(s) disclaim responsibility for any injury to people or property resulting from any ideas, methods, instructions or products referred to in the content. |
© 2023 by the authors. Licensee MDPI, Basel, Switzerland. This article is an open access article distributed under the terms and conditions of the Creative Commons Attribution (CC BY) license (https://creativecommons.org/licenses/by/4.0/).
Share and Cite
Salave, S.; Shinde, S.D.; Rana, D.; Sahu, B.; Kumar, H.; Patel, R.; Benival, D.; Kommineni, N. Peptide Engraftment on PEGylated Nanoliposomes for Bone Specific Delivery of PTH (1-34) in Osteoporosis. Pharmaceutics 2023, 15, 608. https://doi.org/10.3390/pharmaceutics15020608
Salave S, Shinde SD, Rana D, Sahu B, Kumar H, Patel R, Benival D, Kommineni N. Peptide Engraftment on PEGylated Nanoliposomes for Bone Specific Delivery of PTH (1-34) in Osteoporosis. Pharmaceutics. 2023; 15(2):608. https://doi.org/10.3390/pharmaceutics15020608
Chicago/Turabian StyleSalave, Sagar, Suchita Dattatray Shinde, Dhwani Rana, Bichismita Sahu, Hemant Kumar, Rikin Patel, Derajram Benival, and Nagavendra Kommineni. 2023. "Peptide Engraftment on PEGylated Nanoliposomes for Bone Specific Delivery of PTH (1-34) in Osteoporosis" Pharmaceutics 15, no. 2: 608. https://doi.org/10.3390/pharmaceutics15020608
APA StyleSalave, S., Shinde, S. D., Rana, D., Sahu, B., Kumar, H., Patel, R., Benival, D., & Kommineni, N. (2023). Peptide Engraftment on PEGylated Nanoliposomes for Bone Specific Delivery of PTH (1-34) in Osteoporosis. Pharmaceutics, 15(2), 608. https://doi.org/10.3390/pharmaceutics15020608