1. Introduction
Epirubicin is member of the anthracycline class of antineoplastic drugs. Anthracyclines are among the most broadly effective classes of antineoplastic drugs, and epirubicin is among the most clinically important drugs in this class. Epirubicin is primarily used in combination therapies for the treatment of breast, gastric, lung and ovarian cancers and lymphomas [
1]. Epirubicin has emerged as the preferred agent in this class due to the favourable cardiotoxicity profile and similar anti-tumour activity compared to other anthracyclines [
1,
2].
Epirubicin is administered intravenously (IV) over 3 to 5 min once every 21 days with dosing based on body surface area (BSA; mg/m
2). Despite accounting for BSA, marked inter-subject variability in circulating epirubicin plasma concentration has been reported. Eksborg [
3] reported 10-fold between-subject variability in the area under the plasma concentration time curve (AUC) for epirubicin despite normalising for dose and BSA. As with most antineoplastic drugs, epirubicin has a narrow therapeutic window whereby small differences in exposure can result in marked differences in treatment efficacy and tolerability [
4]. These factors underpin the value of better understanding the physiological and environmental covariates influencing epirubicin exposure, particularly those that can direct a more appropriate initial dose selection. Current initial dose selection for epirubicin based on BSA alone routinely overestimates dose requirement [
5] necessitating dose reductions in subsequent cycles due to cardiac and haematologic toxicities [
6]. Dose reductions and interruptions are most commonly due to reductions in neutrophil and platelet count [
7]. Grade 3–4 neutropenia occurs in 8.4–54.2% of patients receiving epirubicin and cyclophosphamide (EC) (90/600 mg/m
2) treatment; thus, haematological toxicity is monitored and dose reductions are implemented between cycles on a case-by-case basis [
8]. Therapeutic drug monitoring (TDM) may be utilised to guide epirubicin dosing, provided an exposure profile has been developed and a known target therapeutic window is established. Development of PK/PD models can be successfully deployed to inform TDM; however, the infrequent dosing schedule of epirubicin and relatively short terminal half-life (18–45 h) limit practicality in this setting [
9,
10]. Additionally, while TDM is appropriate to guide on-treatment dose adjustments for antineoplastic drugs [
11,
12], it does not support optimal initial (cycle 1) dose selection.
Recently, complementary precision dosing approaches that utilized model-informed initial dose selection (MIDS) have been proposed to support optimal initial dose selection [
13,
14,
15] and supplement on-treatment dose modification strategies such as TDM and toxicity-guided dosing [
16]. Two approaches may be applied to support MIDS: a top-down approach known as population pharmacokinetic (popPK) modelling, and a bottom-up approach known as a physiologically based pharmacokinetic (PBPK) modelling. With popPK modelling, non-linear mixed-effect models are used to describe variability in observed pharmacokinetic (PK) behaviour within a population based on covariates known to influence exposure; this approach may be used to predict future exposure by fitting limited a priori data. In PBPK modelling, physiological data for a population are combined with physiochemical and in vitro data for a drug under specific trial conditions to simulate exposure in a virtual population [
17,
18]. Simulated data may be compared to observed data from a matched population to define the performance of the PBPK model. Population PK models for epirubicin have been applied to describe the relation between epirubicin exposure and the incidence of haematologic toxicity [
19], and to associate routinely collected demographic characteristics with epirubicin exposure [
5,
20].
The development of a PBPK model for epirubicin provides the capacity to (i) define the impact of additional molecular and physiological characteristics that are not routinely collected on epirubicin exposure, (ii) simulate exposure in populations that have not been studied in clinical trials (e.g., different races, age groups, etc.), and (iii) define the likely impact of pharmacogenetic variability on epirubicin exposure. Epirubicin is predominantly cleared by the liver, with renal elimination accounting for 20 to 25% of the dose. The reported primary enzyme involved in the hepatic clearance of epirubicin is UDP-glucuronosyltransferase (UGT) 2B7 [
21]. In this regard, reduced UGT2B7 protein expression and/or activity caused by single nucleotide polymorphisms (SNPs) in the
UGT2B7 gene has been associated with increased epirubicin exposure and reduced metabolic clearance [
21]. The most notable example of pharmacogenomic-guided epirubicin dosing involved the
UGT2B7 -161C>T SNP. This SNP has been associated with a reduction in epirubicin clearance and increased AUC [
22,
23]; importantly, this SNP has also been demonstrated to predict grade ¾ leucopenia in early breast cancer patients treated with adjuvant or neoadjuvant FEC100 (5-fluorouracil 500 mg/m
2, Epirubicin 100 mg/m
2 and cyclophosphamide 500 mg/m
2).
The primary objective of this study was to identify physiological and molecular characteristics driving variability in epirubicin AUC using PBPK modelling. Identification of these characteristics informs analyses of ‘exposure biomarkers’ for epirubicin that can be evaluated using routinely collected samples from randomised controlled trials and can facilitate non-invasive optimal initial dose selection for this drug [
24,
25]. The second objective of this study was to define the association between epirubicin plasma concentration and tissue concentrations, with a focus on tissues relevant to either the therapeutic efficacy (adipose/breast tissue), or the incidence of toxicity (cardiac, hepatic) for this drug.
2. Materials and Methods
2.1. Materials and Chemical Information
Epirubicin (hydrochloride) was purchased from Cayman Chemical (Ann Arbor, MI, USA). UDP-glucuronic acid (UDPGA; trisodium salt) was purchased from Sigma-Aldrich (St Louis, MO, USA). Fluconazole was obtained from Pfizer Australia (Sydney, NSW, Australia). Alamethicin (from Trichoderma viridae) was purchased from AG Scientific (San Diego, CA, USA). Solvents and other reagents used were of analytical reagent grade or higher.
2.2. Human Liver Microsomes
Pooled human liver microsomes (HLMs) were prepared by mixing equal amounts of protein from five human livers (H7, 44-year-old female; H10, 67-year-old female; H12, 66-year-old male; H29, 45-year-old male; and H40, 54-year-old female), obtained from the human liver bank of the Department of Clinical Pharmacology of Flinders University. Approval for the use of human liver tissue in xenobiotic metabolism studies was obtained from the Flinders Clinical Research Ethics Committee. HLMs were prepared by differential centrifugation, as described by Bowalgaha et al. [
26]. Microsomes were activated by pre-incubating on ice for 30 min in the presence of alamethicin (50 μg/mg microsomal protein) prior to inclusion in the incubation matrix [
27].
2.3. Epirubicin Glucuronidation Assay
Assay conditions for epirubicin glucuronidation by HLMs were optimised for protein concentration, incubation time and epirubicin concentration range [
28,
29]. Incubations in a total volume of 200 µL contained MgCl
2 (4 mM), potassium phosphate (0.1 M; pH 7.4), epirubicin (in DMSO 2%
v/
v), activated HLMs (0.01 mg), and UDPGA (5 mM). A 5 min pre-incubation at 37 °C was performed to thermodynamically equilibrate the mixture; reactions were initiated by the addition of UDPGA. Reactions to form epirubicin glucuronide were performed over 120 min at 37 °C in a shaking water bath and were terminated by the addition of 400 µL of ice-cold methanol containing 0.1% formic acid. The reaction mix was centrifuged at 4000×
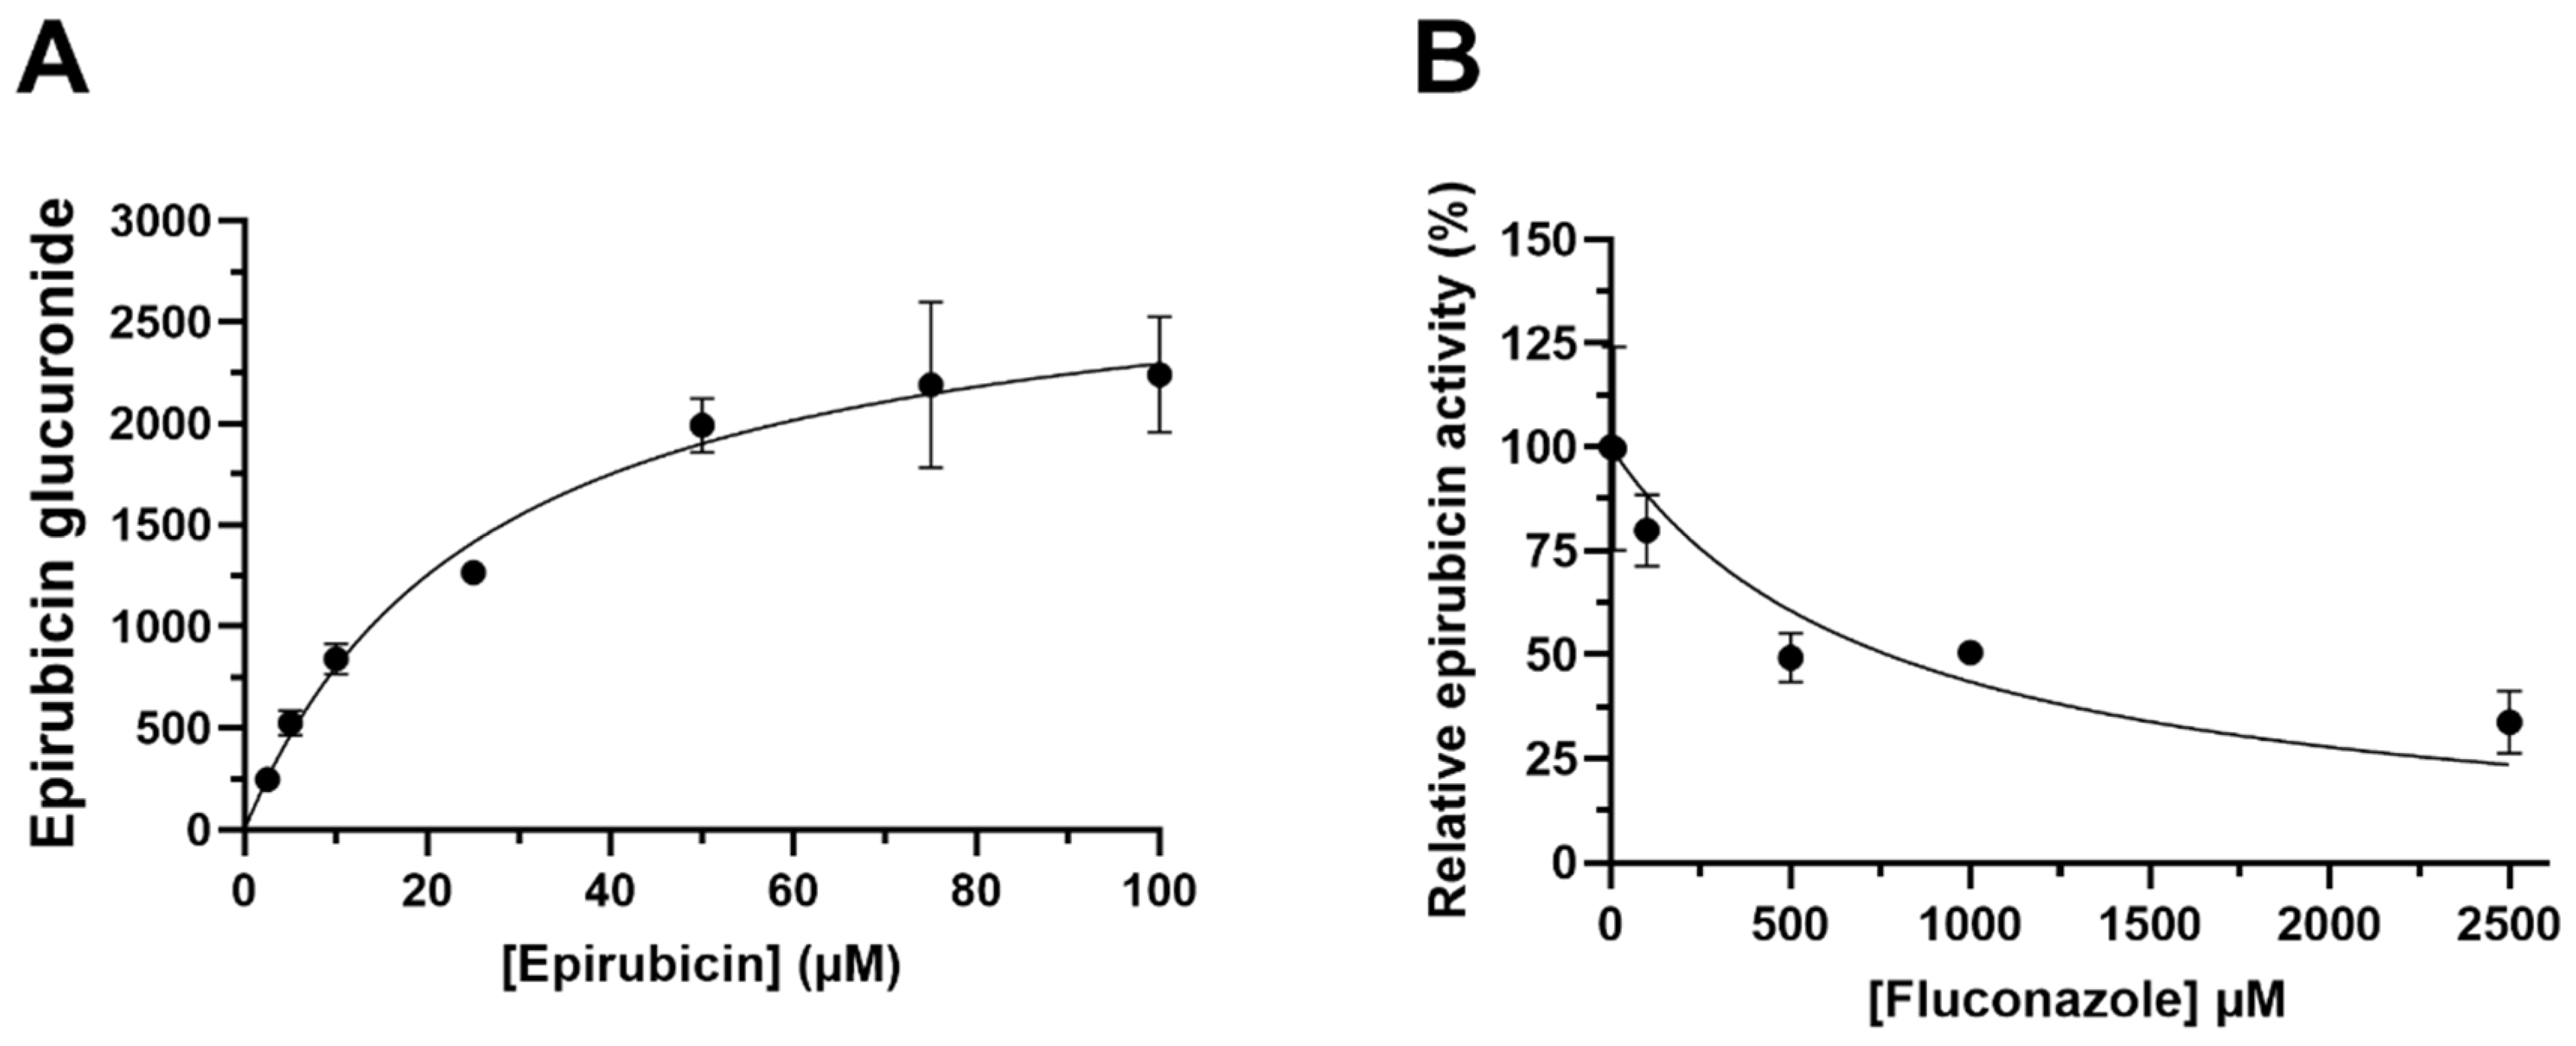
g for 10 min at 10 °C and a 300 µL aliquot of the supernatant fraction was transferred into LC-MS vials. Microsomal incubations were performed in the presence of fluconazole (10–2500 µM) to define the contribution of microsomal UGT2B7 to epirubicin glucuronidation by HLMs.
2.4. Quantification of Epirubicin Glucuronide Formation
Epirubicin glucuronide formation was quantified by liquid chromatography mass spectrometry (LC-MS) performed on an Agilent 1290 infinity liquid chromatography (LC) system coupled to an Agilent 6495B triple-quadrupole mass spectrometer (MS; Agilent Technologies, Santa Clara, CA, USA) fitted with a Zorbax Eclipse Plus C18 analytical column (1.8 µM, 2.1 mm × 50 mm; Agilent, Santa Clara, CA, USA). Epirubicin glucuronide was separated from the incubation matrix by using a mobile phase comprising 28% acetonitrile and 0.1% formic acid in water at a flow rate of 0.2 mL/min. Control incubations in the absence of the cofactor (UDPGA), substrate (epirubicin), and microsomal protein were analysed in parallel to incubation samples to confirm correct product detection.
The MS source parameters were as follows: sheath gas flow rate of 11 L/min, gas flow rate of 14 L/min, gas temperature of 200 °C, nebulizer pressure of 35 psi and capillary voltage of 1500 V. Multiple reaction monitoring (MRM) was used to monitor the precursor transition ion at 720.22 m/z, with the optimised conditions around the product ions listed in
Table 1. Epirubicin glucuronide was eluted at a retention time of 1.6 min.
2.5. Data Analysis (In Vitro Kinetics)
The kinetics of microsomal epirubicin glucuronidation (Michaelis constant, Km and maximal reaction velocity, Vmax) were determined by fitting experimental data using the Michaelis–Menten equation in GraphPad Prism 9.3.1 (San Diego, CA, USA). Fluconazole inhibition of microsomal epirubicin glucuronidation was determined by fitting experimental data to the competitive inhibition model using GraphPad Prism 9.3.1 (San Diego, CA, USA). In vitro kinetic data (Km and Vmax) generated in these microsomal incubations were used as input parameters in the PBPK model to describe epirubicin clearance by UGT2B7.
2.6. Development and Verification of Epirubicin PBPK Model
2.6.1. Structural Model
A full-body PBPK model to simulate the concentration time profile for epirubicin following a single IV dose infused over 3 min was developed using Simcyp
® version 19.1 (Certara, Sheffield, UK). The differential equations utilised by Simcyp to construct the PBPK model from physiochemical and in-vitro data have been described previously by [
30].
2.6.2. Development of Epirubicin Compound Profile
The physiochemical, blood binding, distribution and elimination parameters for epirubicin, along with parameters defining induction of UGT2B7 by epirubicin are summarized in
Table 2. Physiochemical parameters were based on published literature values [
31], unless specified blood binding and distribution parameters were predicted by the model based on the physiochemical parameters of the drug using in-built functions within the Simcyp simulator. Microsomal clearance data (assigned to UGT2B7 based on fluconazole inhibition) were based on in vitro incubations (see Methods section). Renal clearance (CL
R) was calculated based on published clearance values [
6]. Induction parameters for UGT2B7 were defined based on LC-MS proteomic data using HepG2 cells generated in this laboratory.
2.6.3. Population Profile
The epirubicin compound profile was built and verified using the Sim-Cancer population profile. The Sim-Cancer population profile was also used in simulations to characterise the association between epirubicin plasma and tissue concentrations, and to characterise the physiological and molecular parameters associated with variability in epirubicin exposure.
2.6.4. Simulated Trial Design
For development of the epirubicin profile, simulations comprised 90 subjects divided across 10 trials with 9 subjects in each trial. During verification of the epirubicin compound profile, simulations were performed in 10 trials comprising age-, sex-, and ethnicity-matched subjects according to the protocol for the observed trial (dosing regimen and number of subjects) described in the following section. Parameters describing epirubicin exposure were assessed over 24 h following a single dose at 9:00 a.m. on day 1.
2.6.5. Observed Clinical Data and Compound File Verification
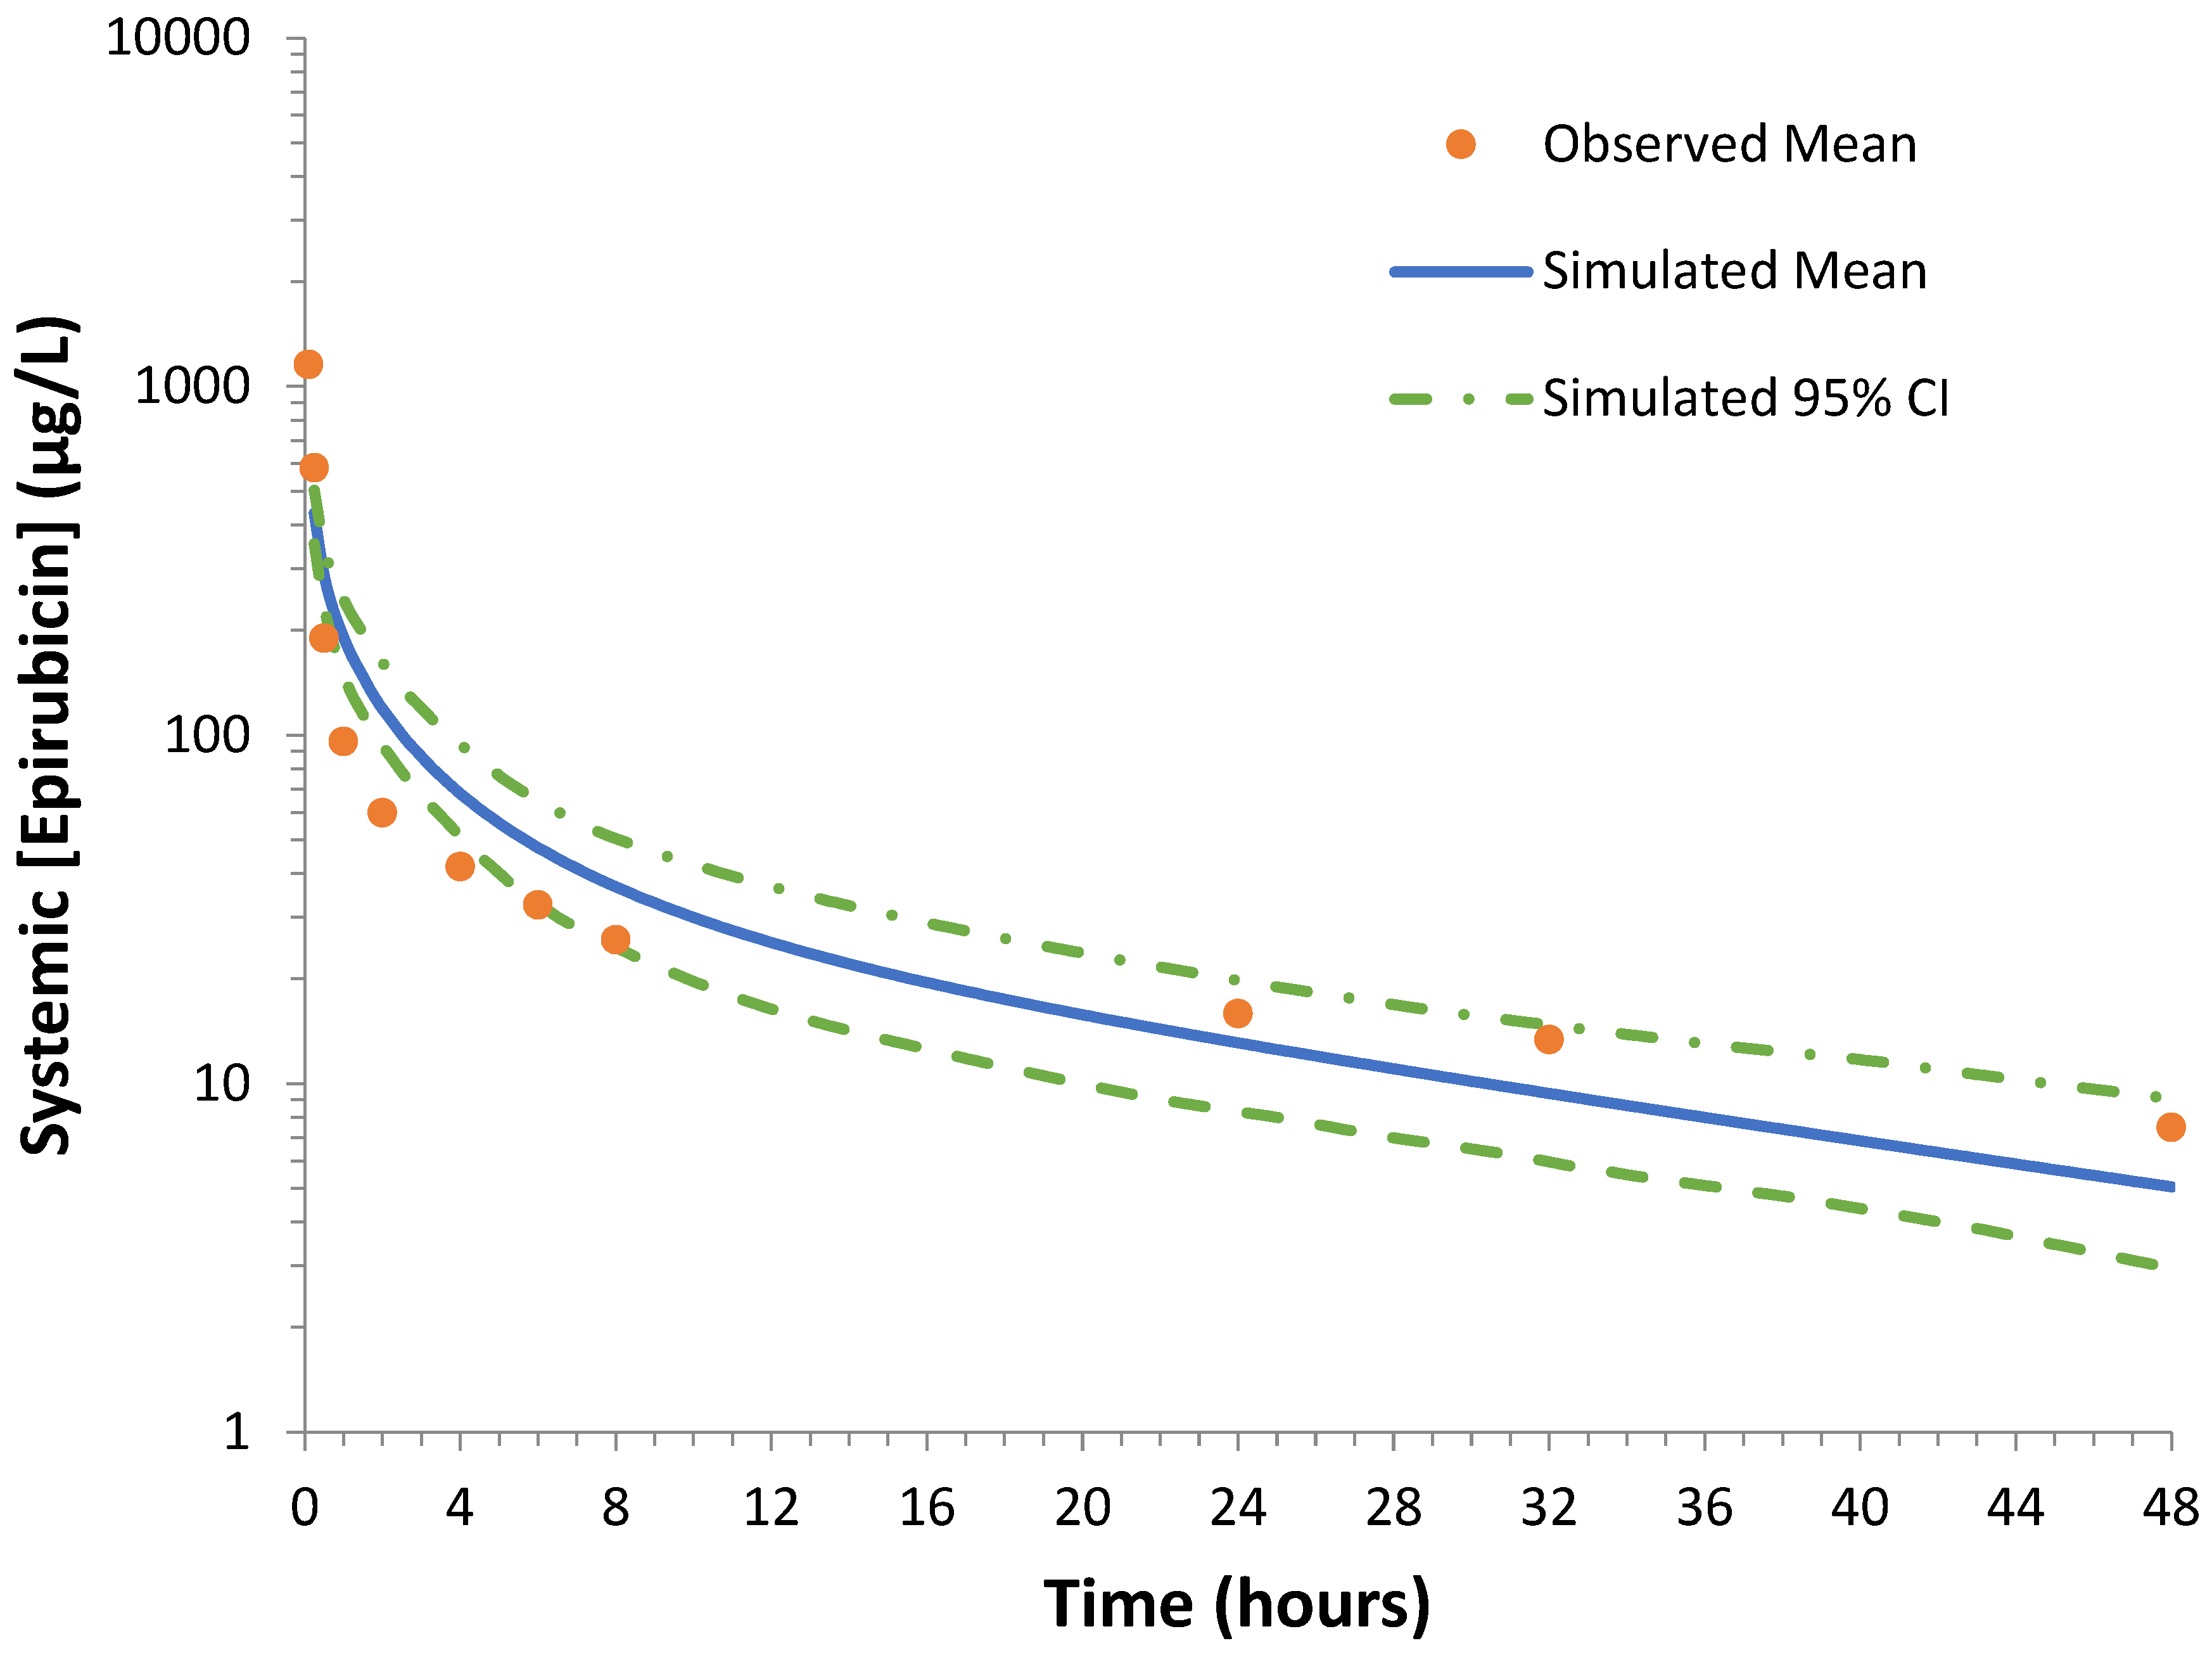
Observed epirubicin pharmacokinetics were obtained from values reported in the literature by Robert, Vrignaud [
33]. Sixteen metastatic breast carcinoma patients were subjected to a phase III comparative randomised protocol to assess the pharmacokinetics of epirubicin and doxorubicin. The epirubicin group received a combinatorial treatment of epirubicin (50 mg/m
2), 5-FU (500 mg/m
2), and cyclophosphamide (500 mg/m
2). The initial dose of epirubicin was used to study pharmacokinetics. Epirubicin was administered first, followed by administration of the remaining chemotherapies after 1–2 h. Therefore, additional treatment could impact epirubicin pharmacokinetics. Plasma samples were obtained after 5, 10, 20, and 40 min, and after 1, 2, 4, 8, 24, 32, and 48 h for HPLC analysis of the unchanged drug and metabolites. Raw data obtained from this trial were reproduced and plotted for evaluation of the simulated epirubicin compound file.
The epirubicin compound file was further verified by evaluating the impact of UGT2B7 inhibition, which was achieved by simulating the effect of fluconazole coadministration, and by evaluating the impact of renal function (evaluated as glomerular filtration rate; GFR).
2.7. Population Characteristics Associated with Variability in Epirubicin Exposure
The verified epirubicin profile was used to evaluate associations between physiological and molecular characteristics of the Sim-Cancer population and the logarithmically transformed epirubicin AUC (LnAUC). Ten trials from the Sim-Cancer population, each comprising 200 subjects, were simulated over 158 h, with a single 120 mg/m2 epirubicin dosed IV in a fasted state.
Univariate (simple) linear regression was performed using GraphPad Prism 9.3.1 (San Diego, CA, USA). Stepwise multivariate linear regression analysis was performed using IBM
® SPSS
® Statistics 26 (New York, NY, USA). Linear regression was used to evaluate associations between the physiological and molecular characteristics identified in
Supplemental Table S1 and epirubicin LnAUC. Continuous variables were evaluated for normality and non-linearity of association; binary characteristics (sex) were coded as nominal variables. A multivariable linear regression model was developed by stepwise forward inclusion of significant characteristics identified in the univariable regression analysis based on improvement in model R
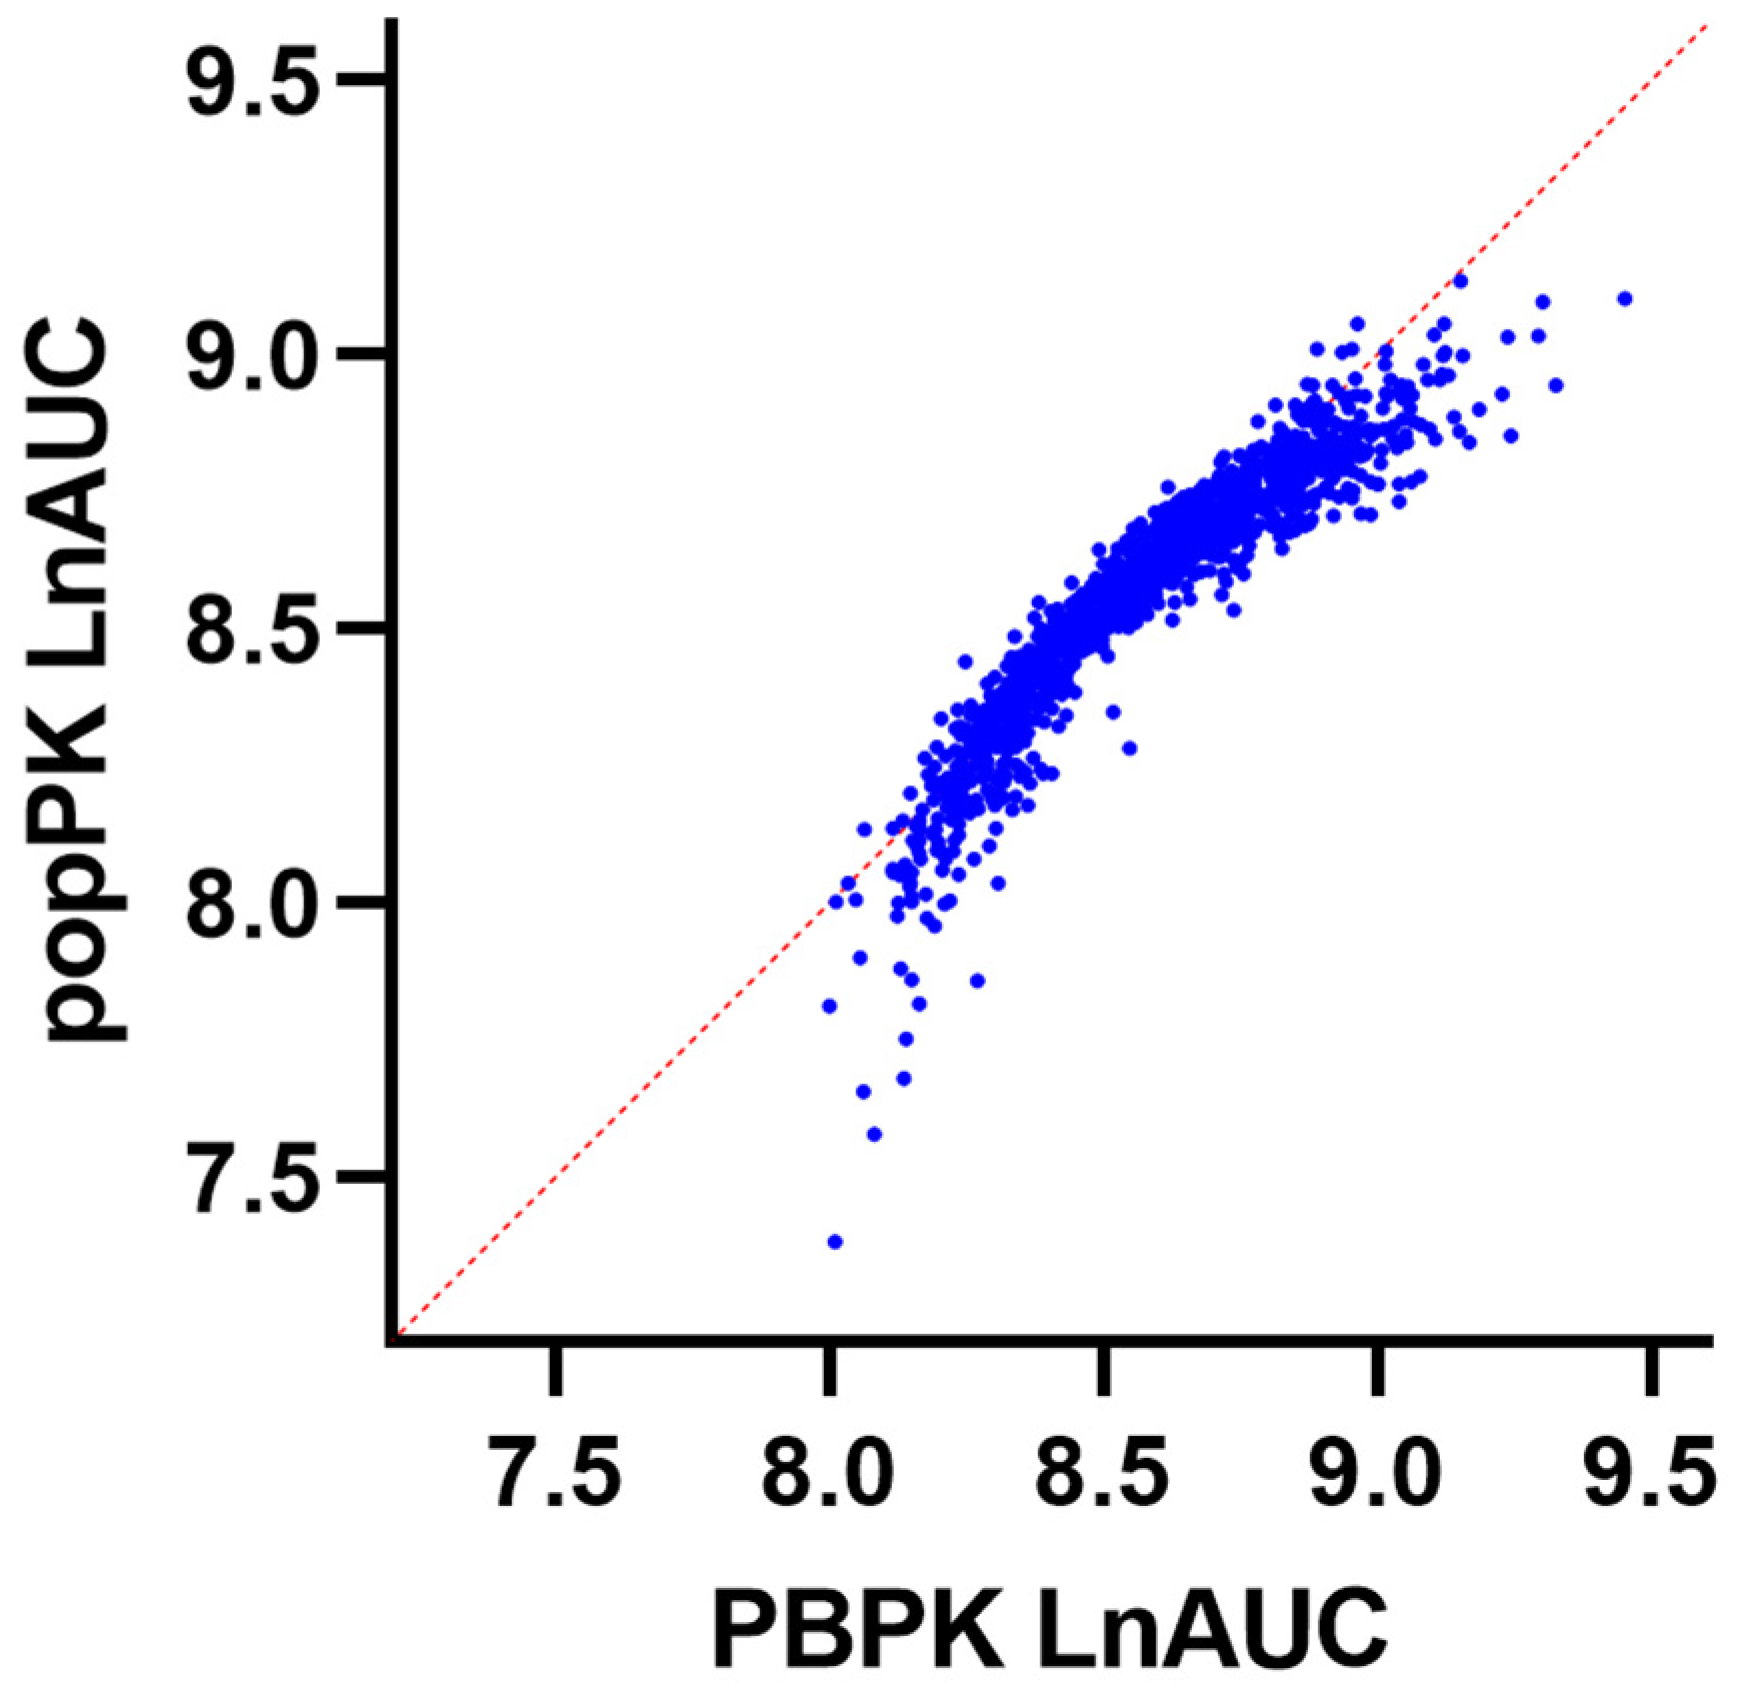
2. Back transformation of the model-predicted logarithmically transformed AUC was performed to plot correlations between the simulated and model-predicted AUC.
4. Discussion
The present study describes the development and evaluation of a full-body PBPK model to assess systemic and individual organ exposure to epirubicin. Multi-variable linear regression modelling demonstrated that variability in simulated systemic epirubicin exposure following intravenous injection was primarily driven by differences in hepatic and renal UGT2B7 expression, plasma albumin concentration, age, BSA, GFR, haematocrit and sex. By accounting for these factors, it was possible to explain 87% of the variability in epirubicin in a simulated cohort of 2000 oncology patients aged between 20 and 95 years. The single most important factor in defining simulated systemic epirubicin exposure was hepatic UGT2B7 expression, which alone accounted for 56% of variability in exposure within the simulated cohort.
Current dosing guidelines for epirubicin account for age, BSA, renal function and sex. Typically, epirubicin doses are reduced in patients with a serum creatinine > 5 mg/dL. Epirubicin is quite well tolerated in patients with chronic renal failure undergoing haemodialysis [
35]. Dose reductions in elderly patients are also well tolerated [
36]. Data regarding the value of BSA-guided epirubicin dosing are contentious, with multiple studies suggesting that BSA-guided dosing is of limited value [
5,
37]. In accordance with this, the data presented suggest that incorporating BSA-based dosing into the model only contributes to 4% of exposure variability. This highlights the importance of understanding other contributing variables in epirubicin dosage. Sexual dimorphism around DME expression could perhaps be driven by hormonal differences [
38] and may influence epirubicin metabolism; however, further understanding of this is required. Reassuringly, the major factors currently accounted for when guiding epirubicin dosing are consistent with the physiological parameters identified in the multiple linear regression modelling performed in the current study and with prior non-linear mixed-effects modelling (NONMEM) analyses involving epirubicin. Wade, Kelman [
4] demonstrated that by accounting for differences in sex and age it was possible to reduce unexplained variability in epirubicin clearance from 50 to 42%. Consistent with the major importance of UGT2B7 expression in defining epirubicin exposure, prior analyses have consistently demonstrated that a large proportion of the variability in epirubicin exposure cannot be accounted for based on routinely collected physiological parameters including age, sex, BSA and renal function. Currently, there is no reliable biomarker to define hepatic UGT2B7 expression in individual patients, and assessment of UGT2B7 genotype is of limited value [
25]. However, in recent years liver-derived extracellular vesicles (EVs) have emerged as a potential universal ADME biomarker [
39,
40,
41,
42,
43,
44]. It is plausible that quantification of UGT2B7 expression in EVs may serve as a robust approach to estimate hepatic UGT2B7 expression in individual patients, thereby supporting dose individualisation for drugs such as epirubicin.
PBPK modelling and simulation is an established tool to support drug discovery and development and is a core element of the regulatory approval process in many jurisdictions [
18]. Recent studies have further demonstrated the potential role of PBPK in predicting covariates affecting variability in drug exposure resulting from differences in patient characteristics [
14,
15,
45], giving rise to the intriguing potential for this platform to support model-informed precision dosing [
46,
47]. This model provides an important foundation for establishing a PK/PD relationship for epirubicin; however, further work on population-based dose predictive modelling is imperative to inform optimal therapeutic windows for individualized dosage. The major limitation of the current study is the lack of observed clinical data to support the validation of the regression models. Currently, these models are based on a mechanistic systems pharmacology understanding and would require confirmation with in vivo clinical data to warrant implementation. A second limitation of the current study is the lack of observed tissue concentration measurements to support the lack of concordance between plasma concentration and tissue concentrations. While the overall simulated volume of distribution (25.265 L/kg) for epirubicin is consistent with reported in vivo data [
6], the specific tissue distribution for this drug in vivo has not been reported.
Simulated epirubicin clearance was consistent with clinical observations of epirubicin plasma clearance as studied by Robert [
34]. Notably, there was limited concordance between systemic epirubicin exposure and the exposure of individual organs to epirubicin. Except for epirubicin concentration in the brain (R
2 = 0.56), there was limited concordance between tissue and systemic (plasma) epirubicin concentrations (R
2 < 0.22). The highest mean tissue AUC was observed in skeletal muscle (169,241 ng/mL·h); however, the comparatively slow distribution into this tissue resulted in a markedly lower C
max compared to other tissues. Indeed, despite comparable AUCs, the mean epirubicin C
max in cardiac tissue (31,952 ng/mL) was >10-fold higher than the epirubicin C
max in skeletal muscle (2868 ng/mL). The extensive distribution of epirubicin into cardiac tissue is consistent with the well-established cardiac toxicity profile for this drug [
10,
48]. The limited concordance between plasma and cardiac epirubicin concentrations (r
2 = 0.2188) indicates that evaluation of plasma epirubicin concentration is unlikely to be useful in identifying patients at greatest risk of suffering cardiac toxicity when administered epirubicin.


