
Coupled and Simultaneous Thermal Analysis Techniques in the Study of Pharmaceuticals


Abstract
1. Introduction
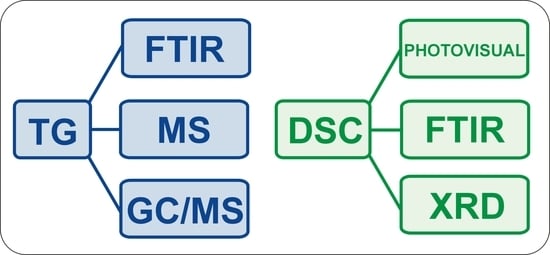
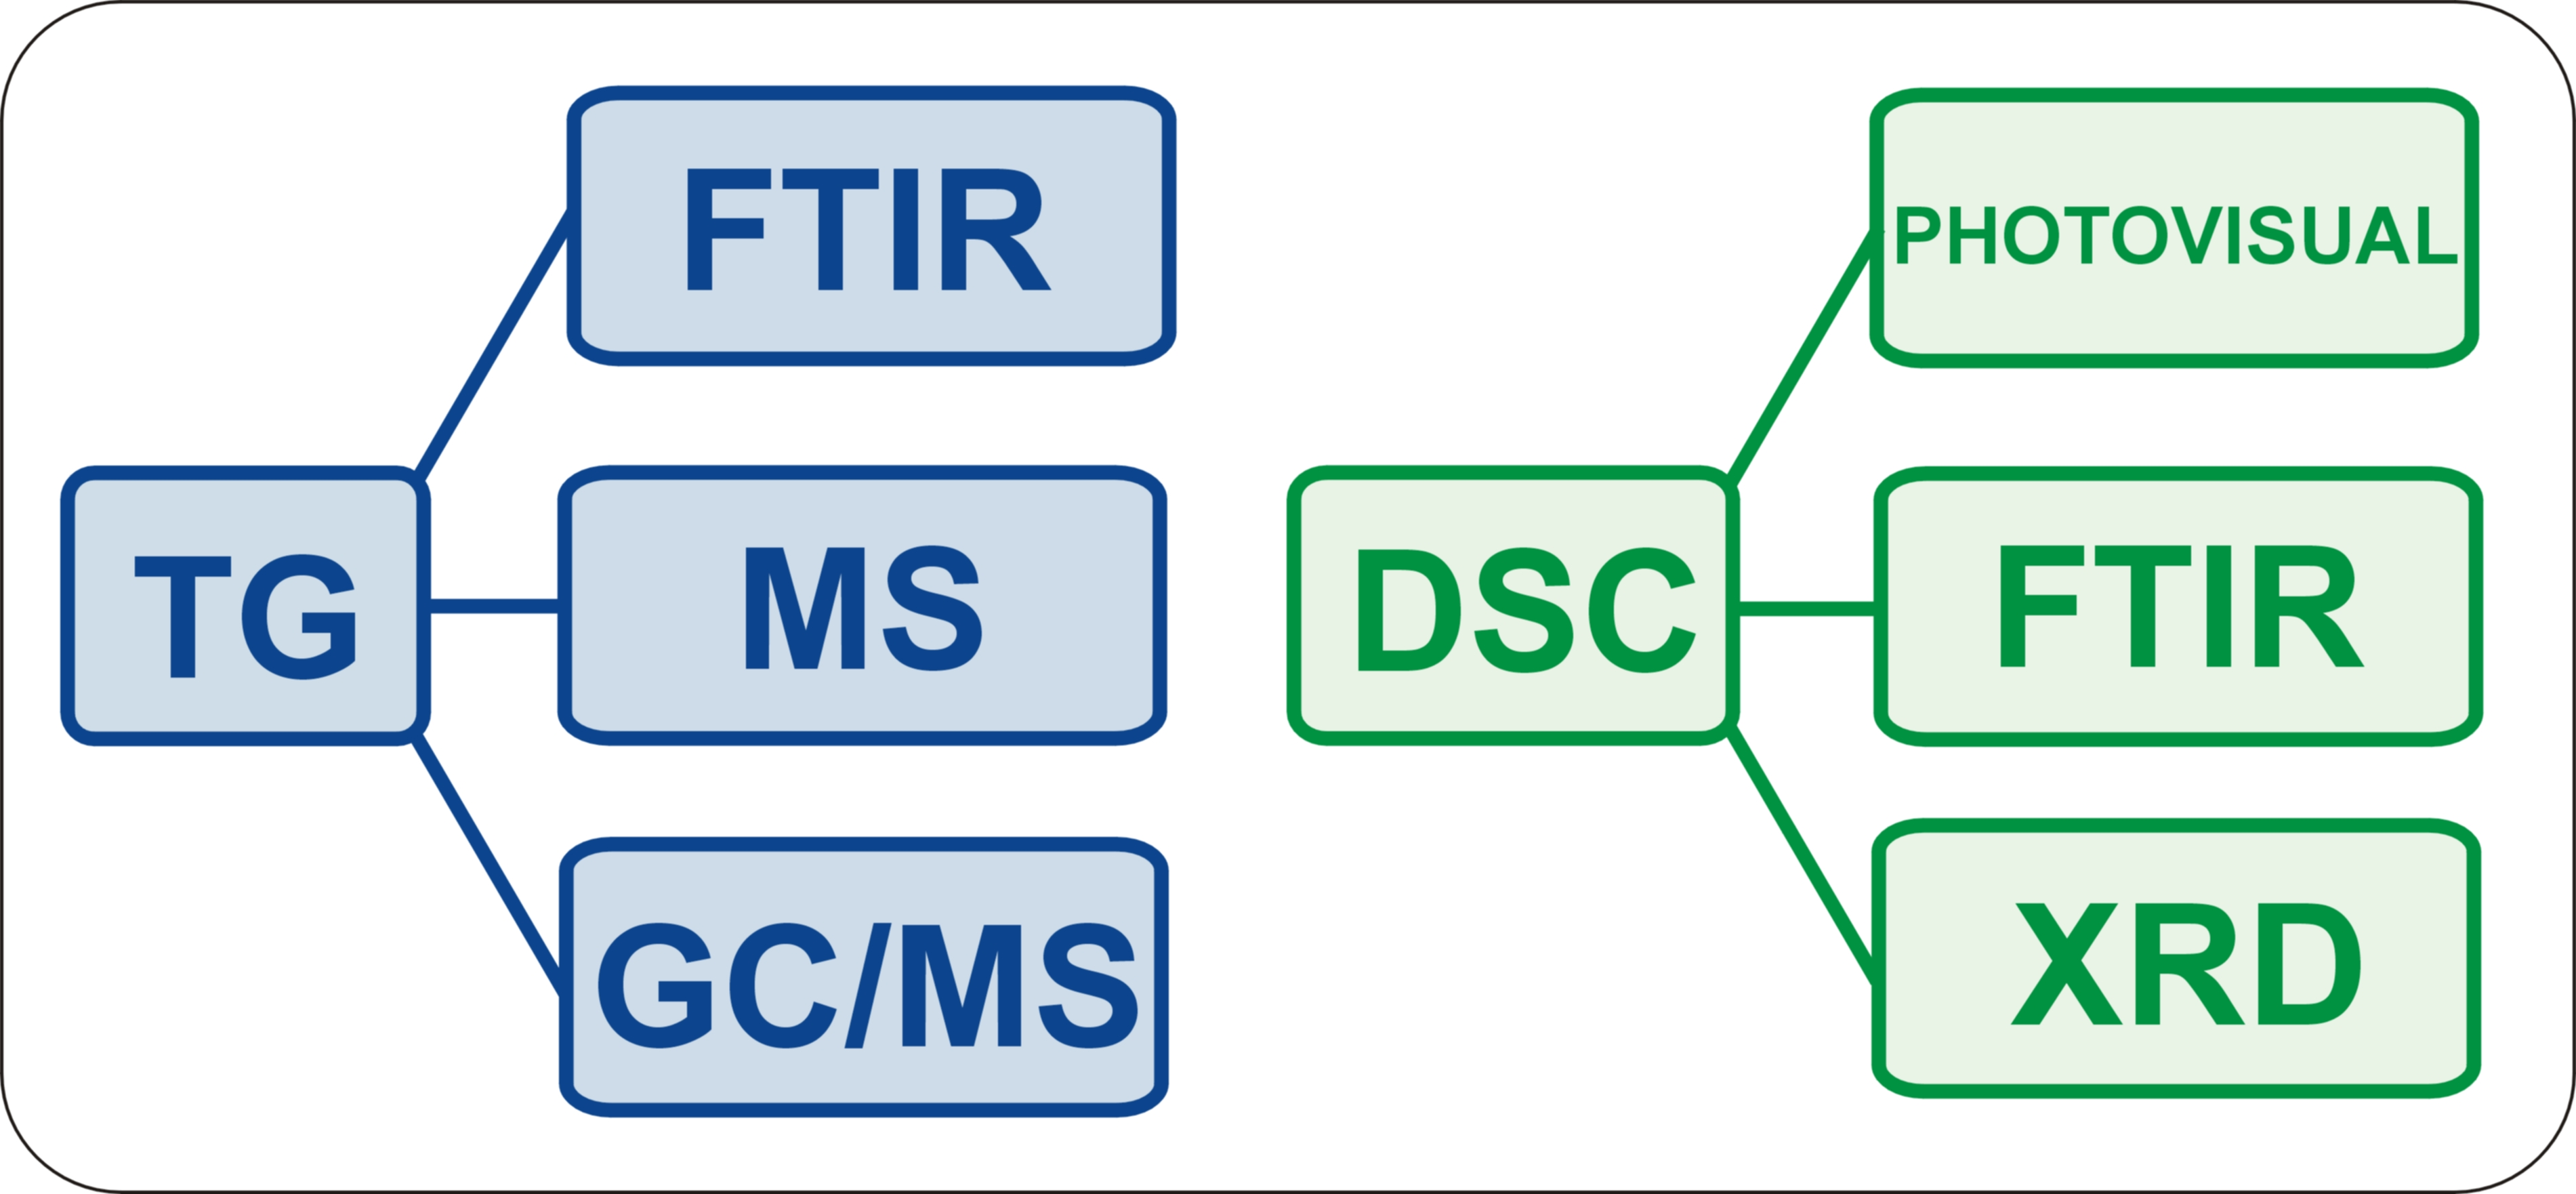
2. Coupled and Simultaneous Techniques
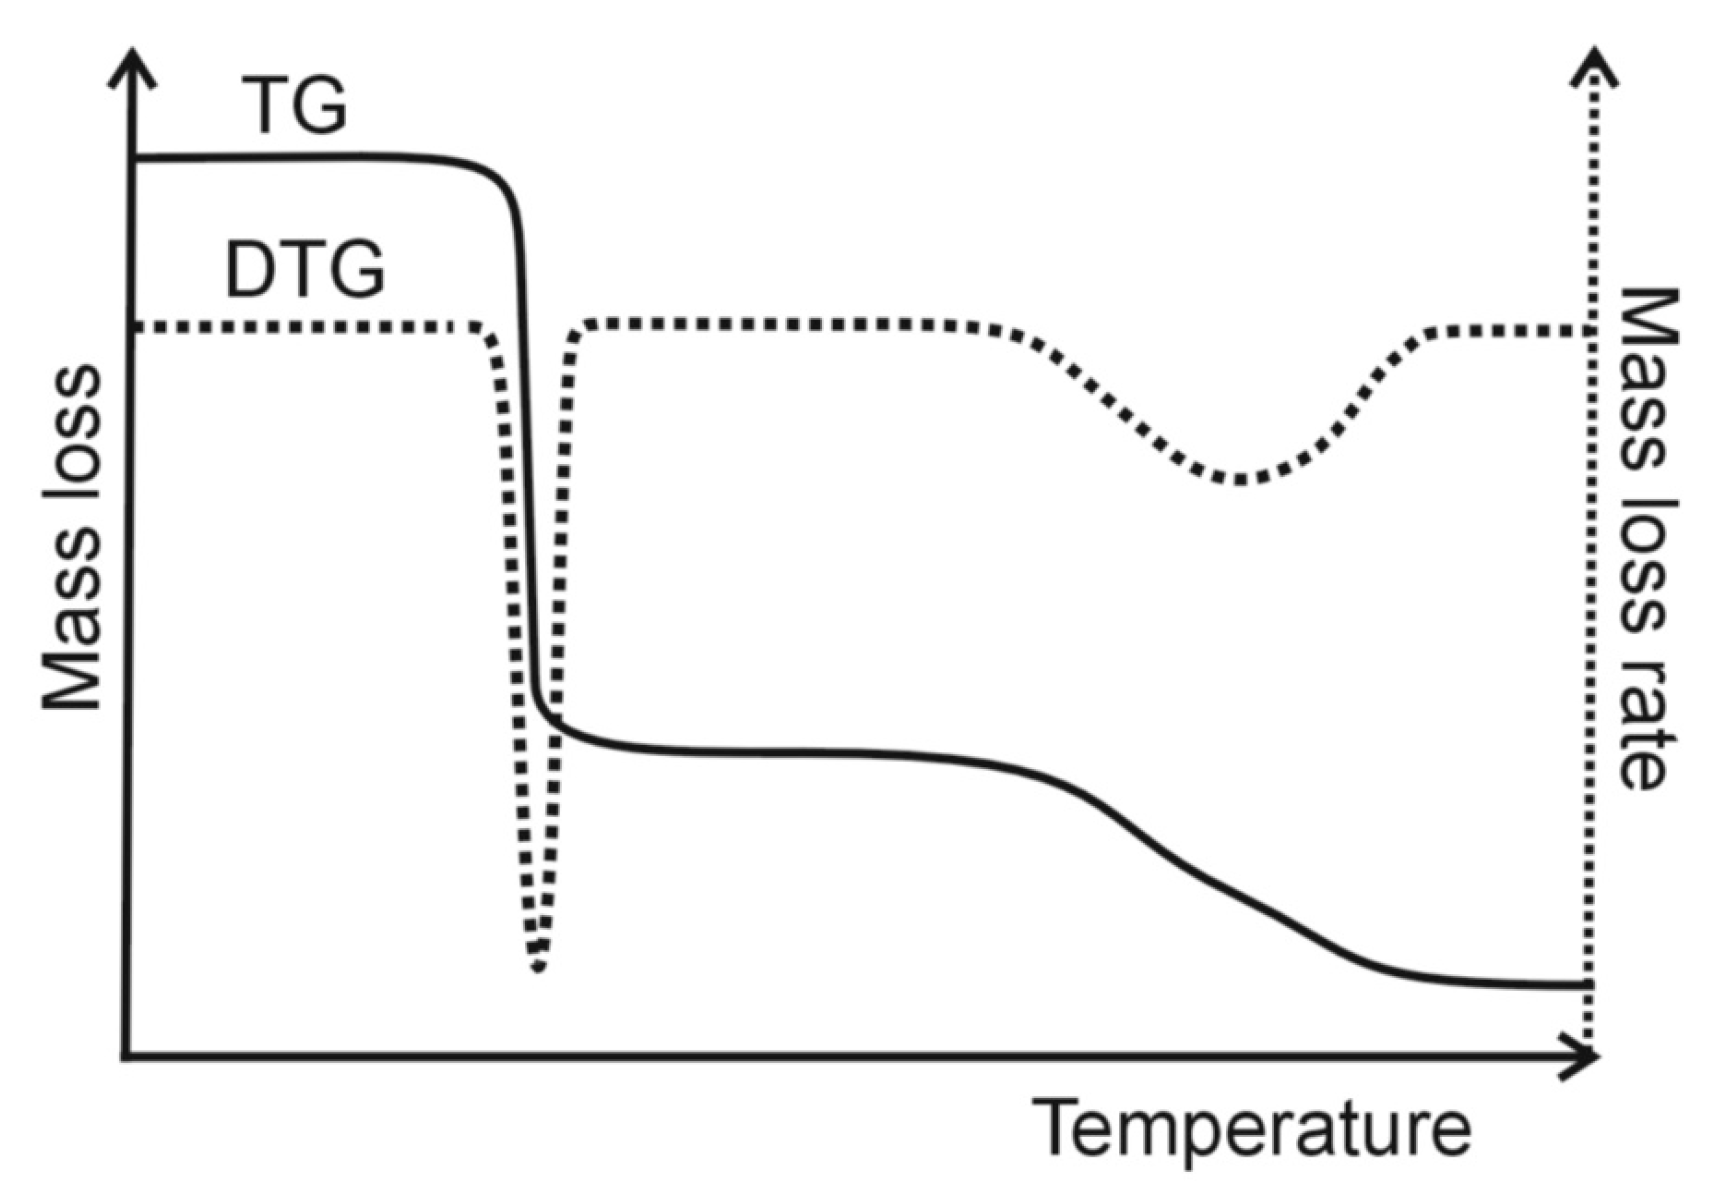
2.1. Thermogravimetry (TG)
2.2. Differential Scanning Calorimetry (DSC)
3. Coupled TG Measurements
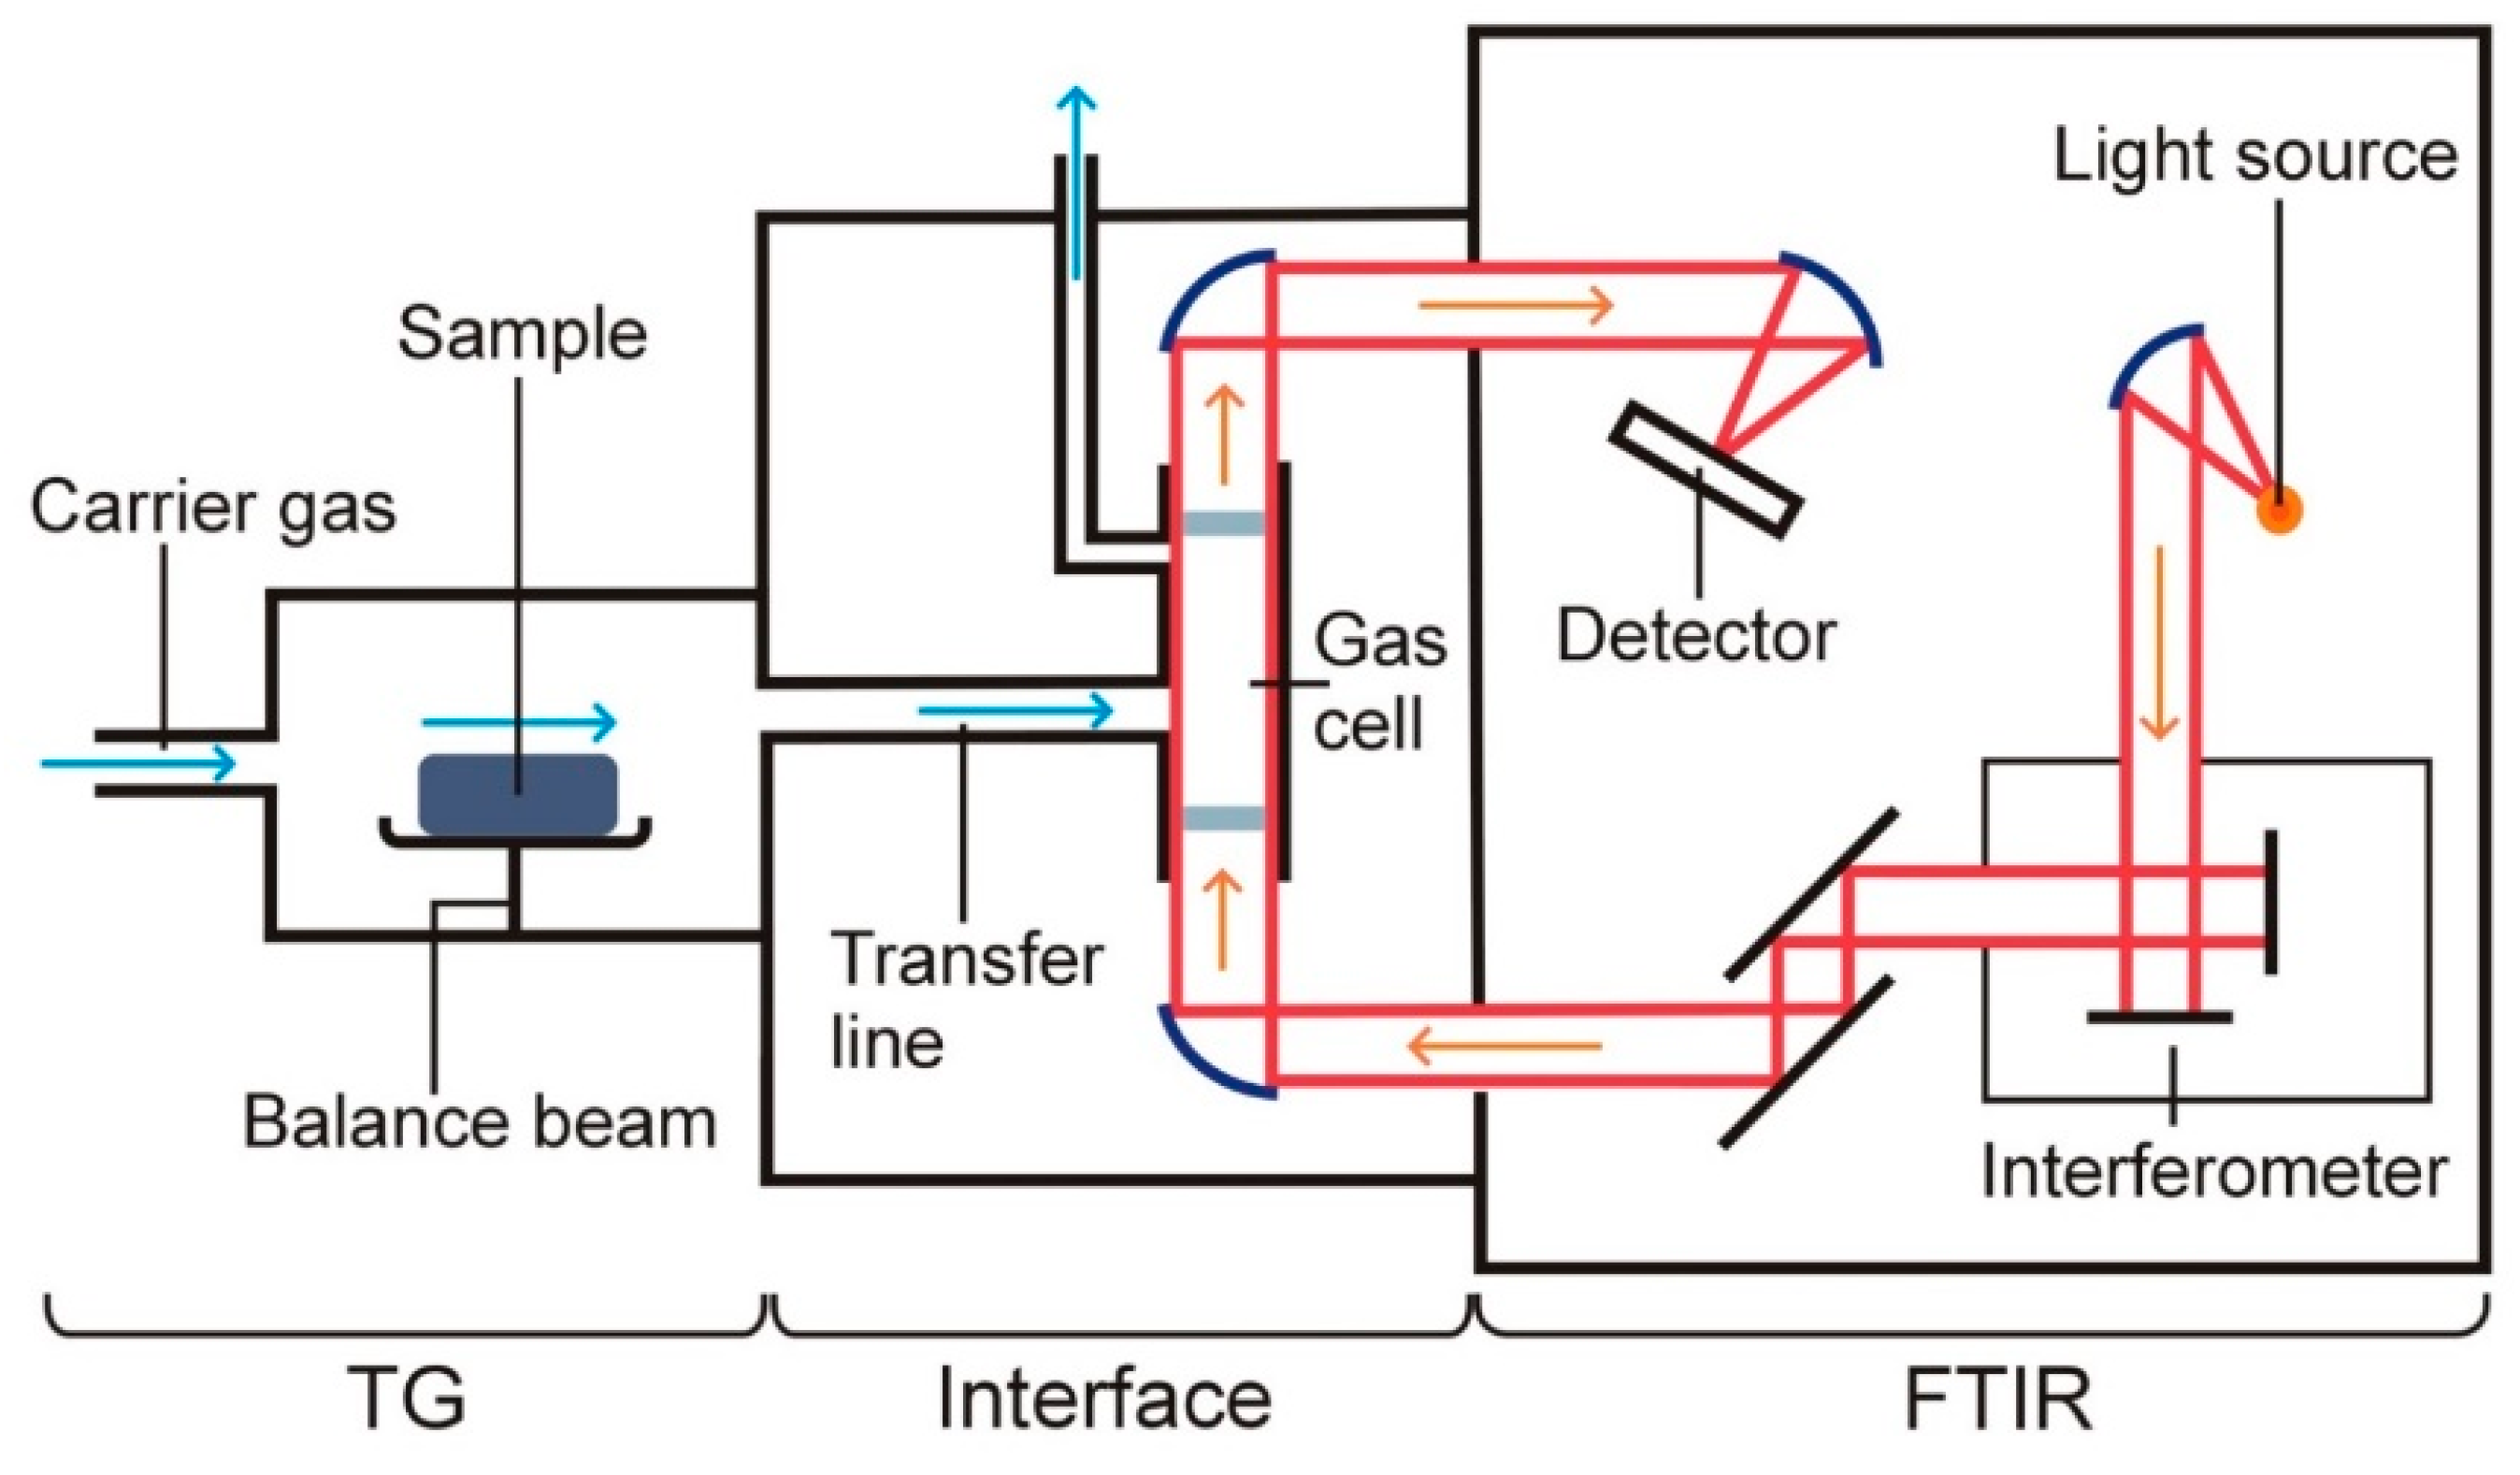
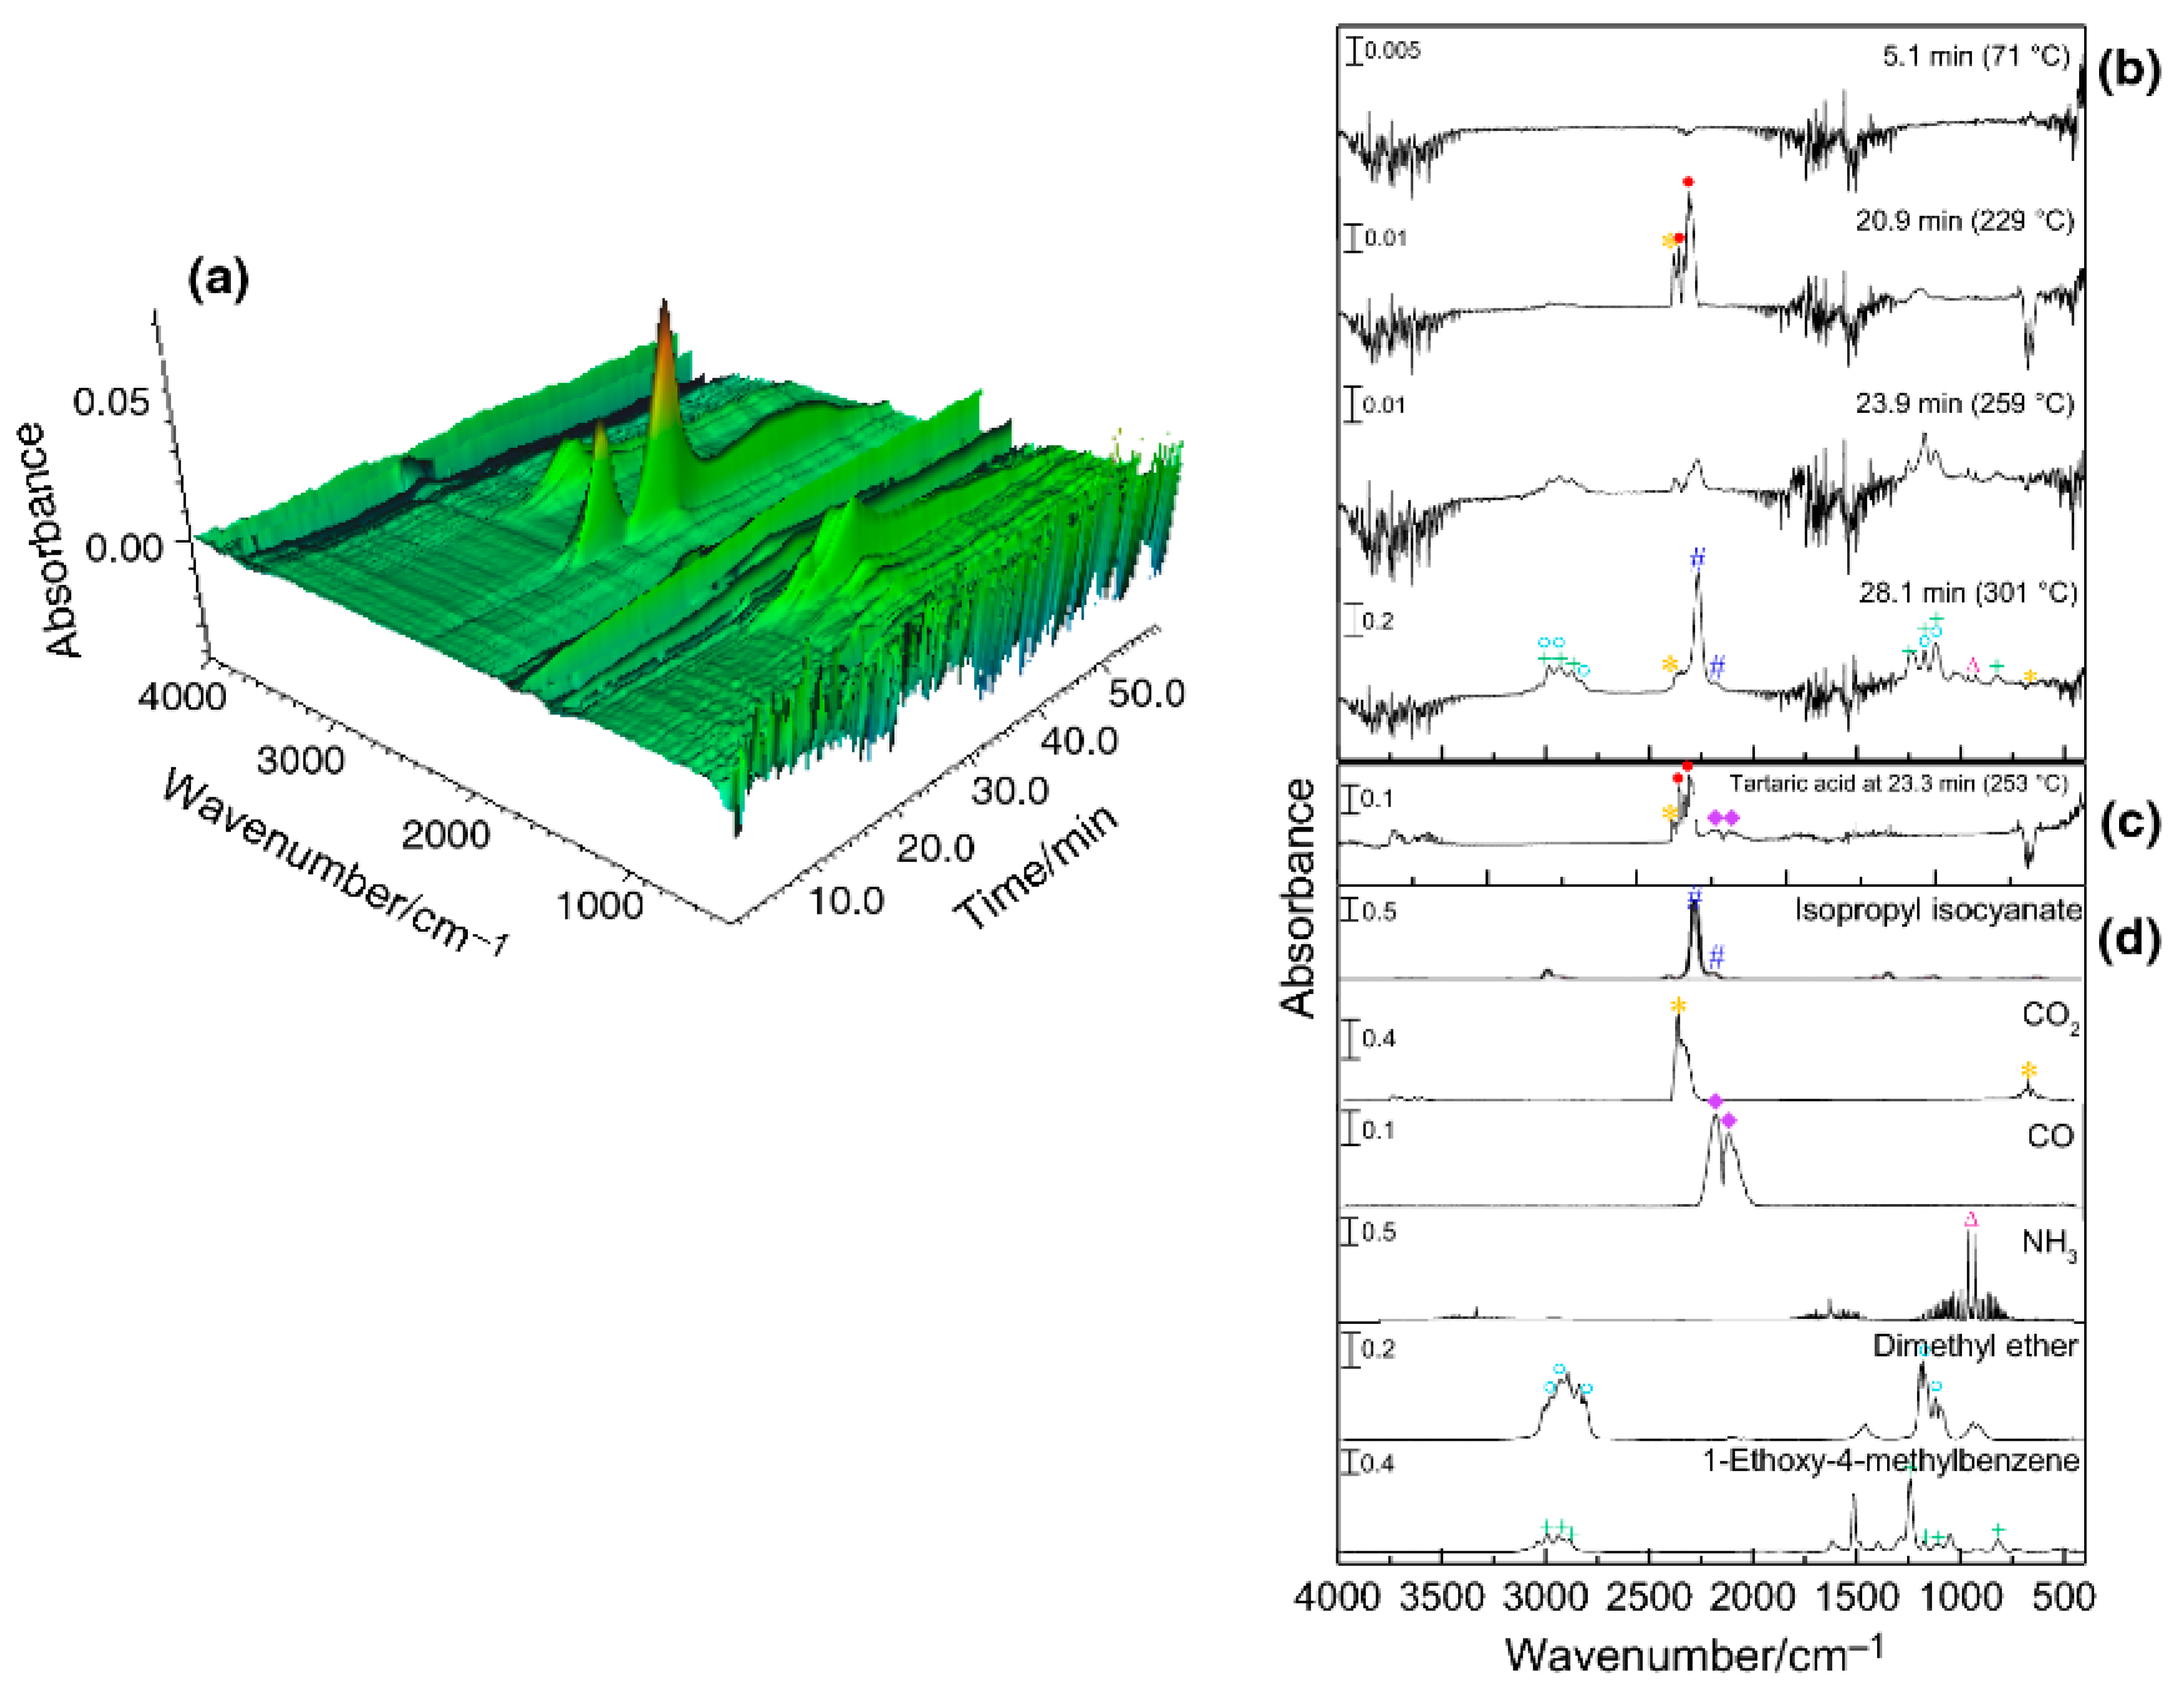
3.1. TG Coupled to FTIR Spectrometer

| TG Instruments | FTIR Spectrometers | Transfer Line | FTIR Spectra Measurements | References |
|---|---|---|---|---|
| SDT-Q600 TG/DTG/DTA (TA Instruments) | Nicolet iS10 FTIR (Thermo Scientific) | stainless steel tube, l = 120 cm, ø = 2 mm; 200 °C, 220 °C, 225 °C, 230 °C | 200 °C, 220 °C, 250 °C; nitrogen, flow rate 50 mL/min; 4000–500 cm–1, 32 scans, 4 cm–1, 6 cm–1; DTGS (KBr) | [22,23,28,29,30,31,32,35,36] |
| TGA/DSC Stare (Mettler-Toledo) | Nicolet iS10 FTIR (Thermo Scientific) | stainless steel tube, l = 120 cm, ø = 3 mm; 25 °C, 200 °C | 25 °C, 250 °C; air, flow rate 50 mL/min; 4000–600 cm–1, 32 scans, 4 cm–1; DTGS (KBr) | [24,25,37] |
| TGA/SDTA 851 (Mettler-Toledo) | Nicolet iS10 FTIR (Thermo Scientific) | [38] | ||
| TG-DSC 1 (Mettler-Toledo) | FTIR Nicolet (Thermo Scientific) | stainless steel tube, l = 120 cm, ø = 3 mm; 225 °C | 250 °C; air, nitrogen, flow rate 50 mL/min; 4000–675 cm–1, 16 scans, 4 cm–1; DTGS (ZnSe, KBr) | [39,40,41,42] |
| SDT-Q600 TG/DTG/DTA (TA Instruments) | Nicolet 6700 FTIR (Thermo Fisher Scientific) | 8 scans, 4 cm–1; MCT-A | [33] | |
| TGA 2950 (TA Instruments) | Nexus 470 FTIR (Thermo/Nicolet) | 250 °C | 250 °C; air; 4000–450 cm–1, 32 scans, 4 cm–1 | [43] |
| TG 2050 (TA Instruments) | FTS 3000 IR (BioRad Excalibur) | stainless steel tube | 4 cm–1 | [44] |
| STA 6000 TG (Perkin Elmer) | Frontier FTIR (Perkin Elmer) | 270 °C | 4000–450 cm–1 | [34] |
| Diamond TG/DTG/DTA (Perkin Elmer) | Spectrum 100 (Perkin Elmer) | [45] | ||
| STA 449 Jupiter F1 TG/DTG/DSC (Netzsch) | FTIR TGA 585 (Bruker) | Teflon transfer line, ø = 2 mm; 200 °C | 200 °C; 4000–600 cm–1, 16 scans, 4 cm–1 | [46] |
| TG 209 (Netzsch) | IFS 66 (Bruker) | [47] | ||
| Setsys 16 TG-DTA/DSC (Setaram) | Thermo Nicolet Nexus 670 FTIR (Thermo Scientific) | stainless steel tube, l = 100 cm, ø = 3 mm, 200 °C | 200 °C; 8 scans, 8 cm–1 | [26,27] |
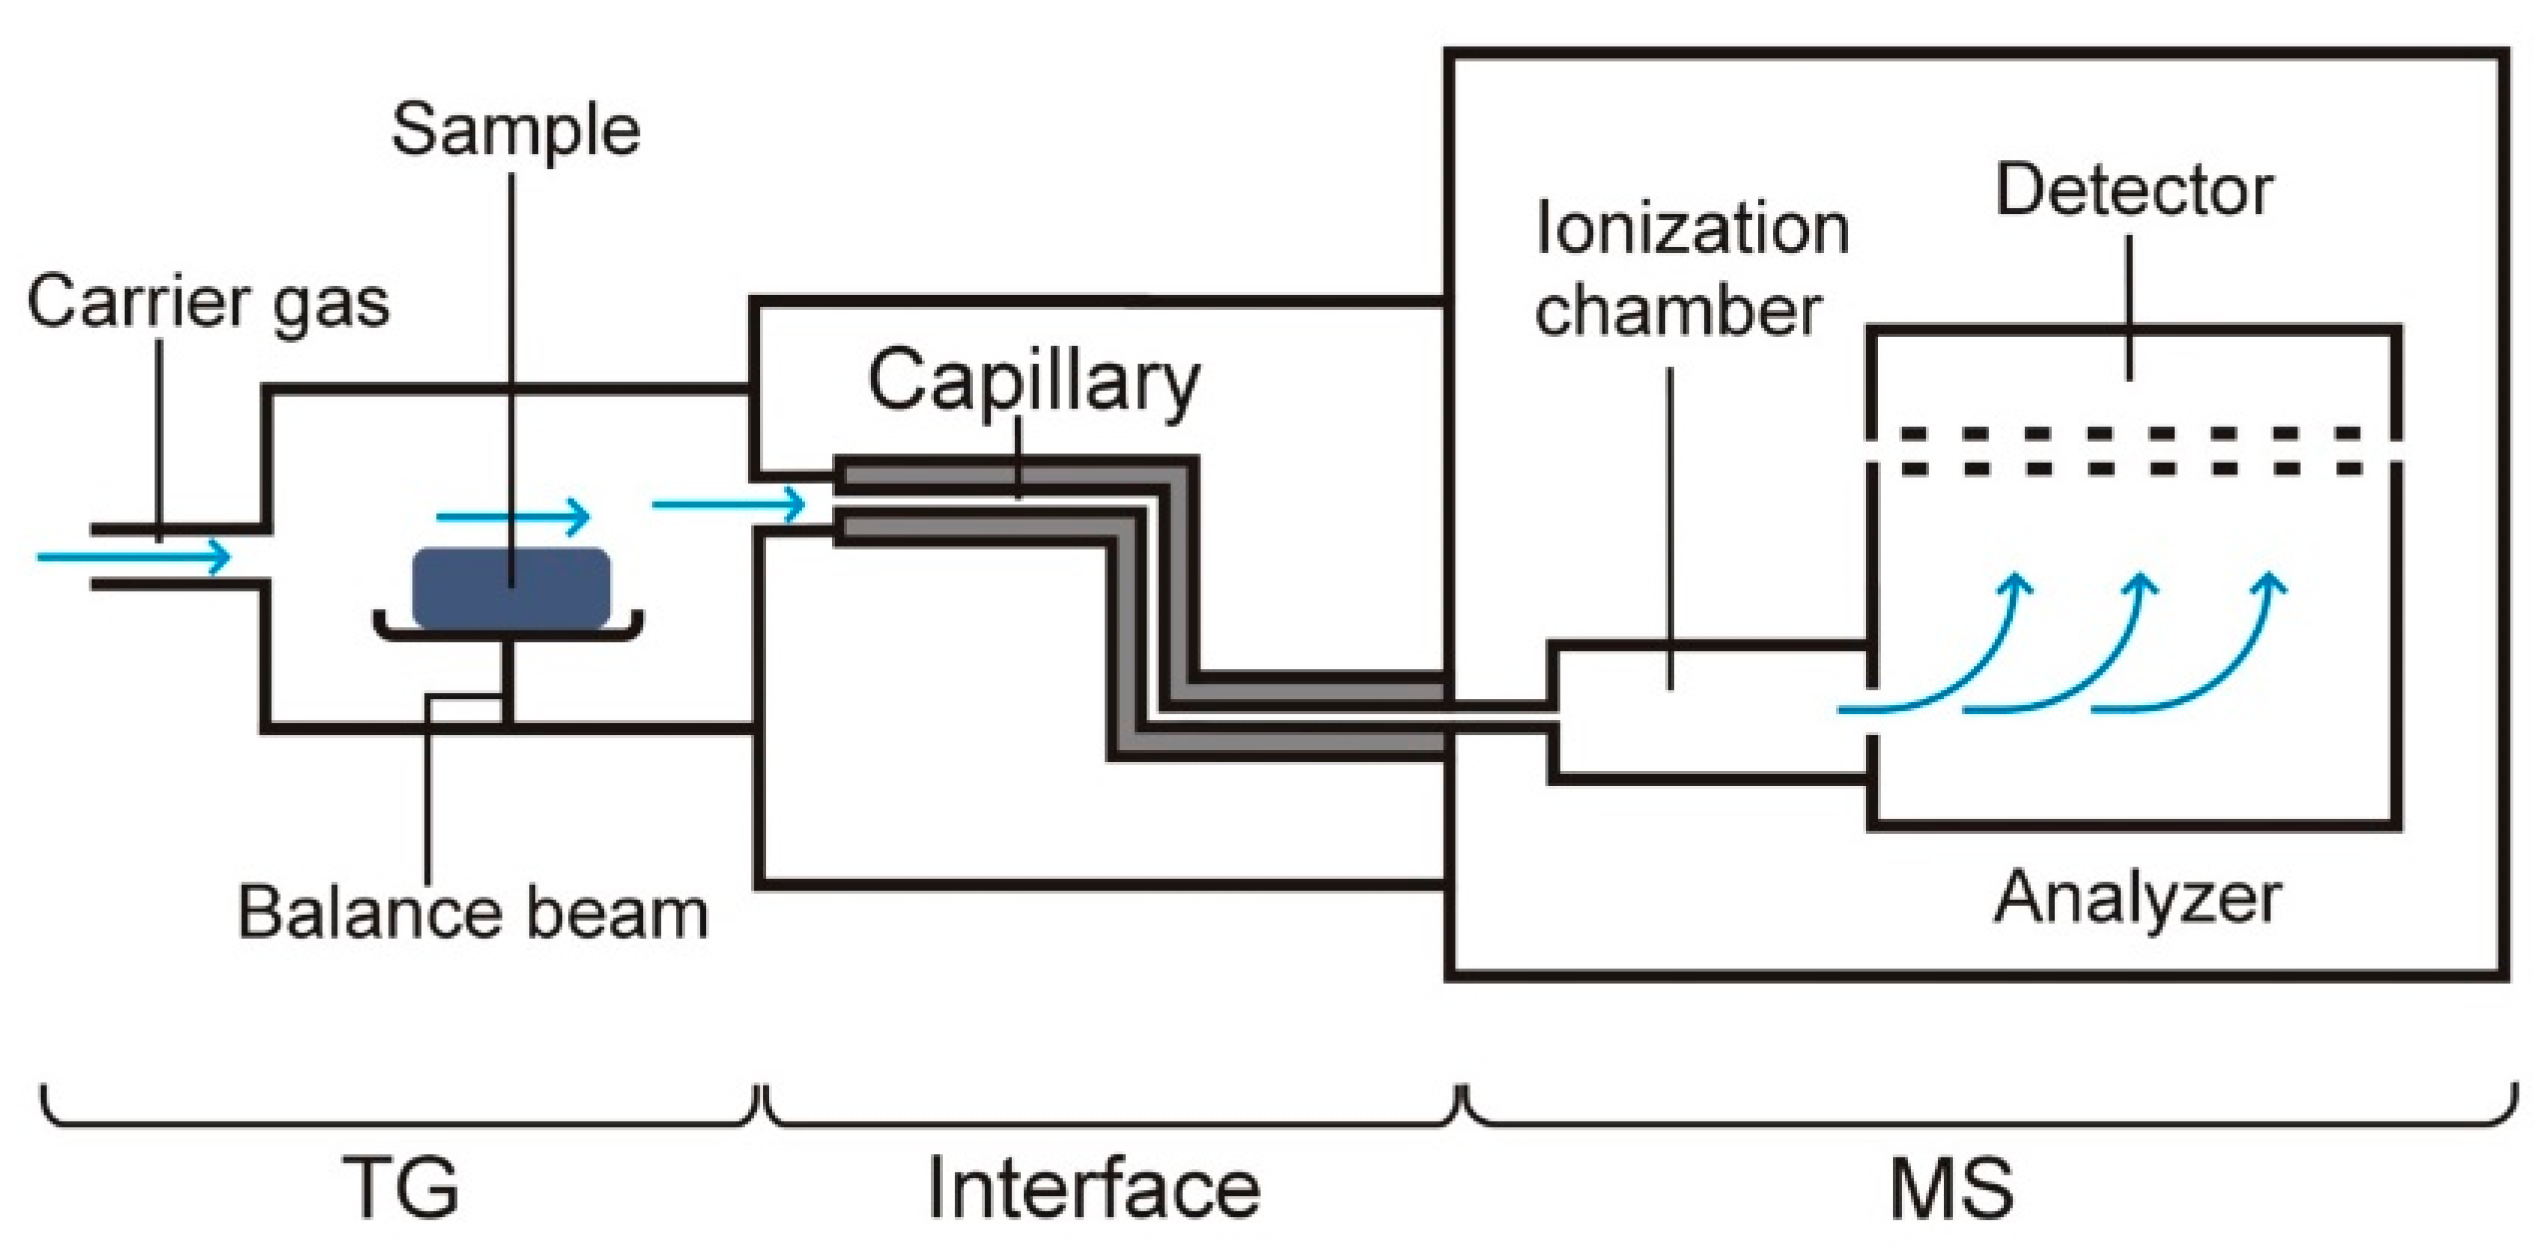
3.2. TG Coupled to Mass Spectrometry
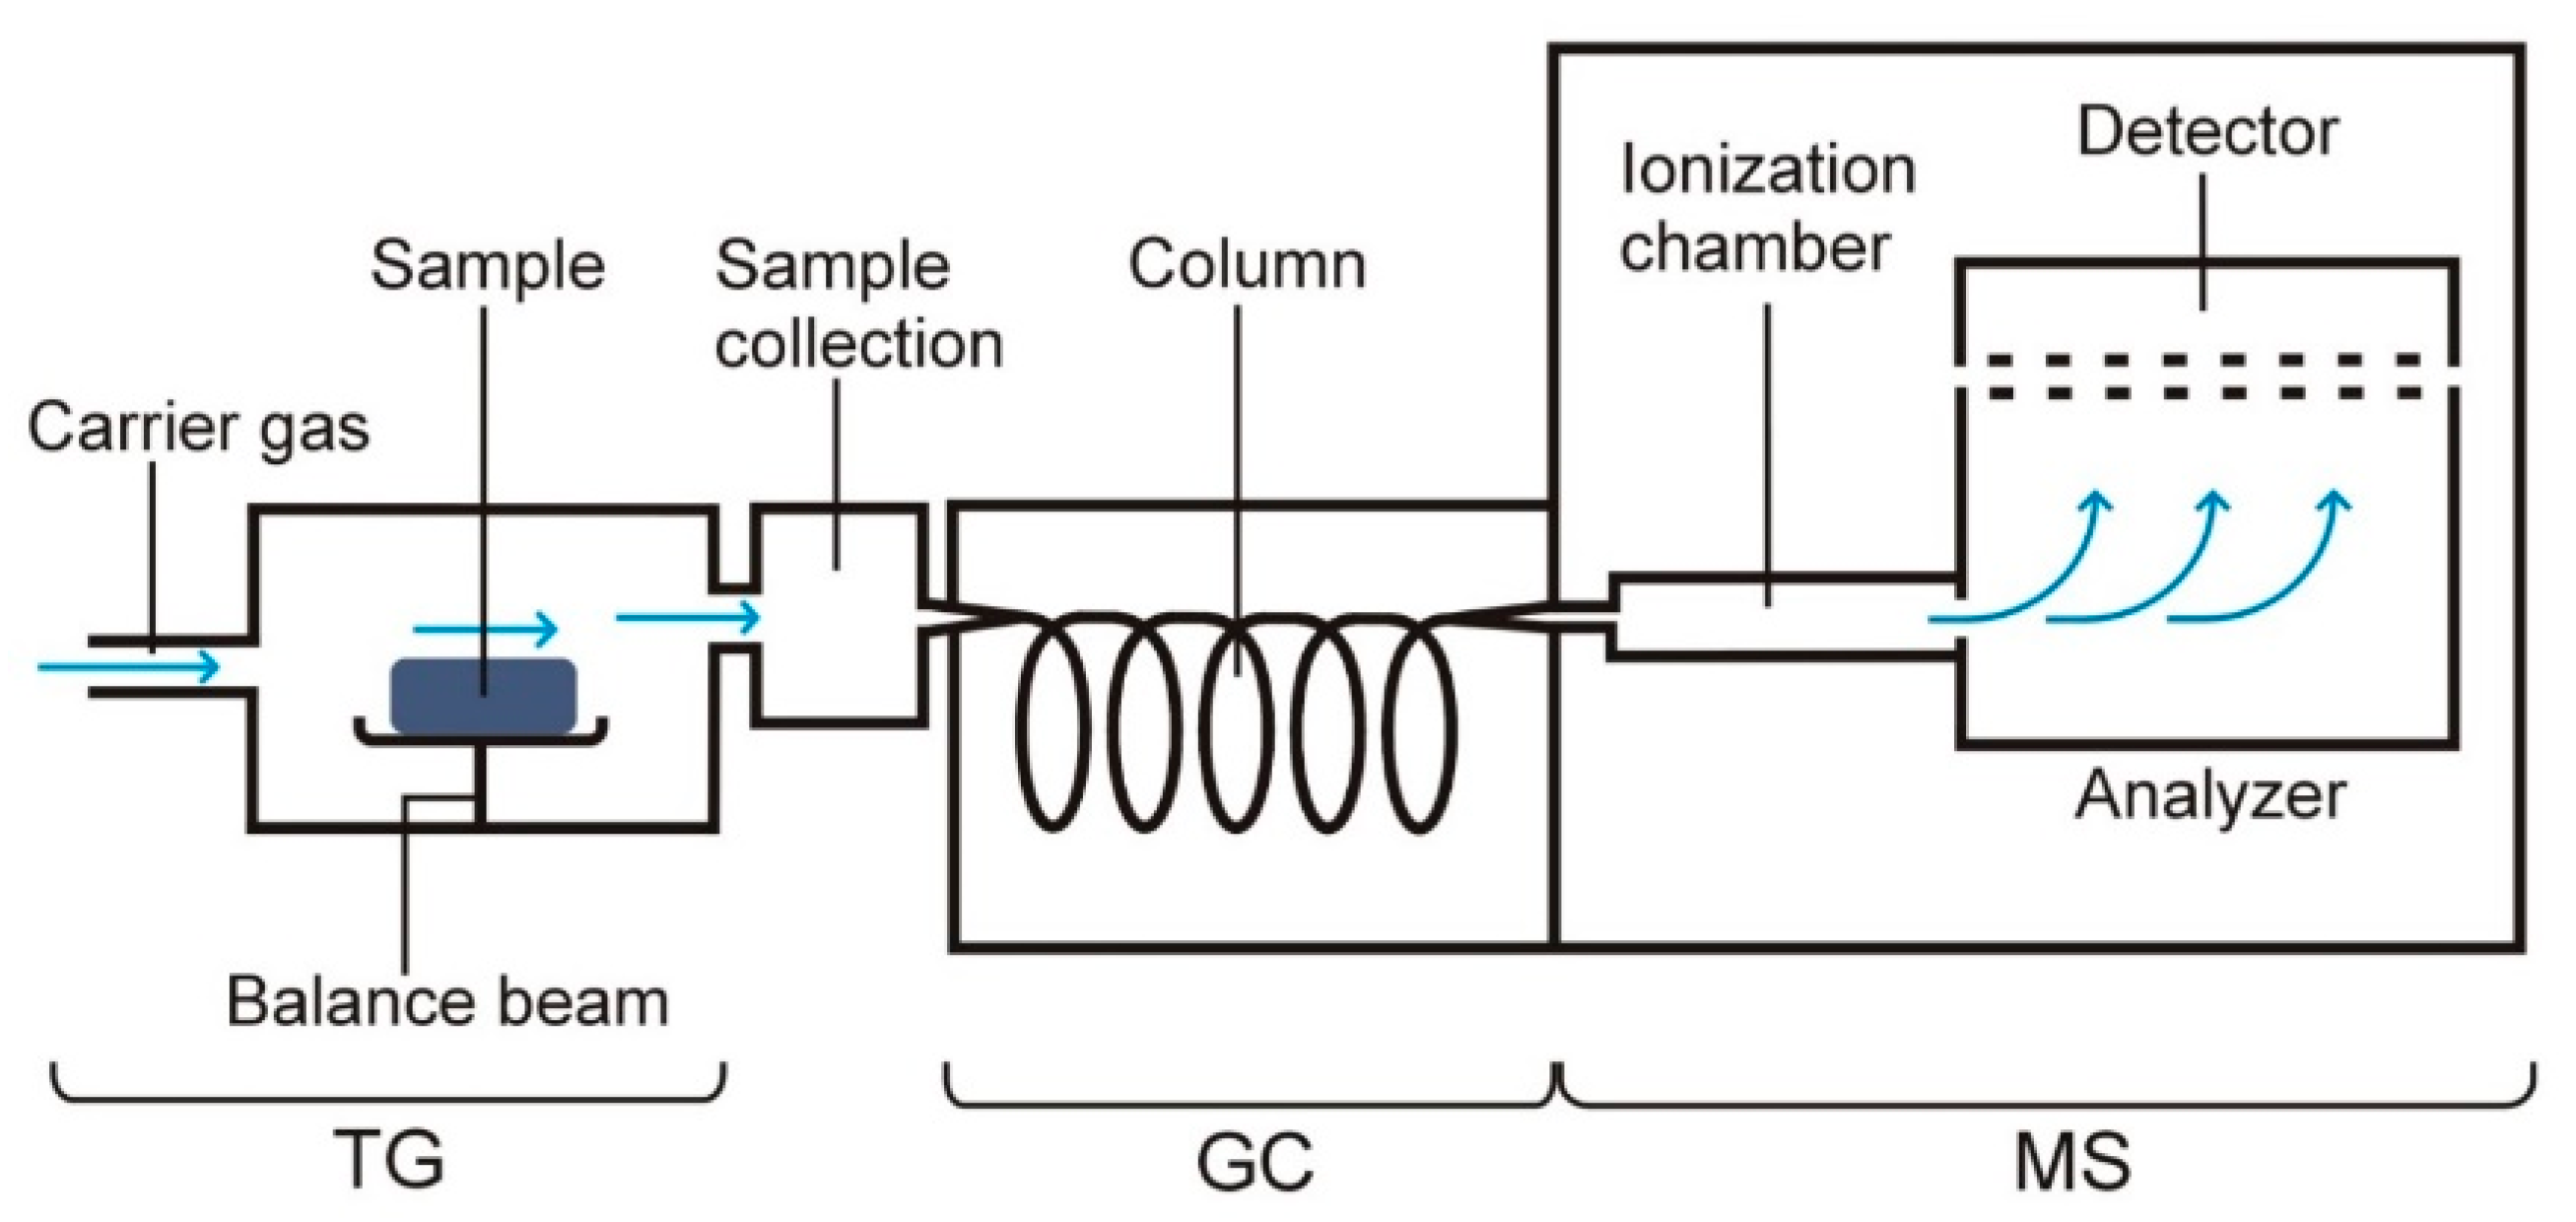
3.3. TG Coupled to GC/MS
4. Simultaneous DSC Measurements
4.1. DSC–Photovisual
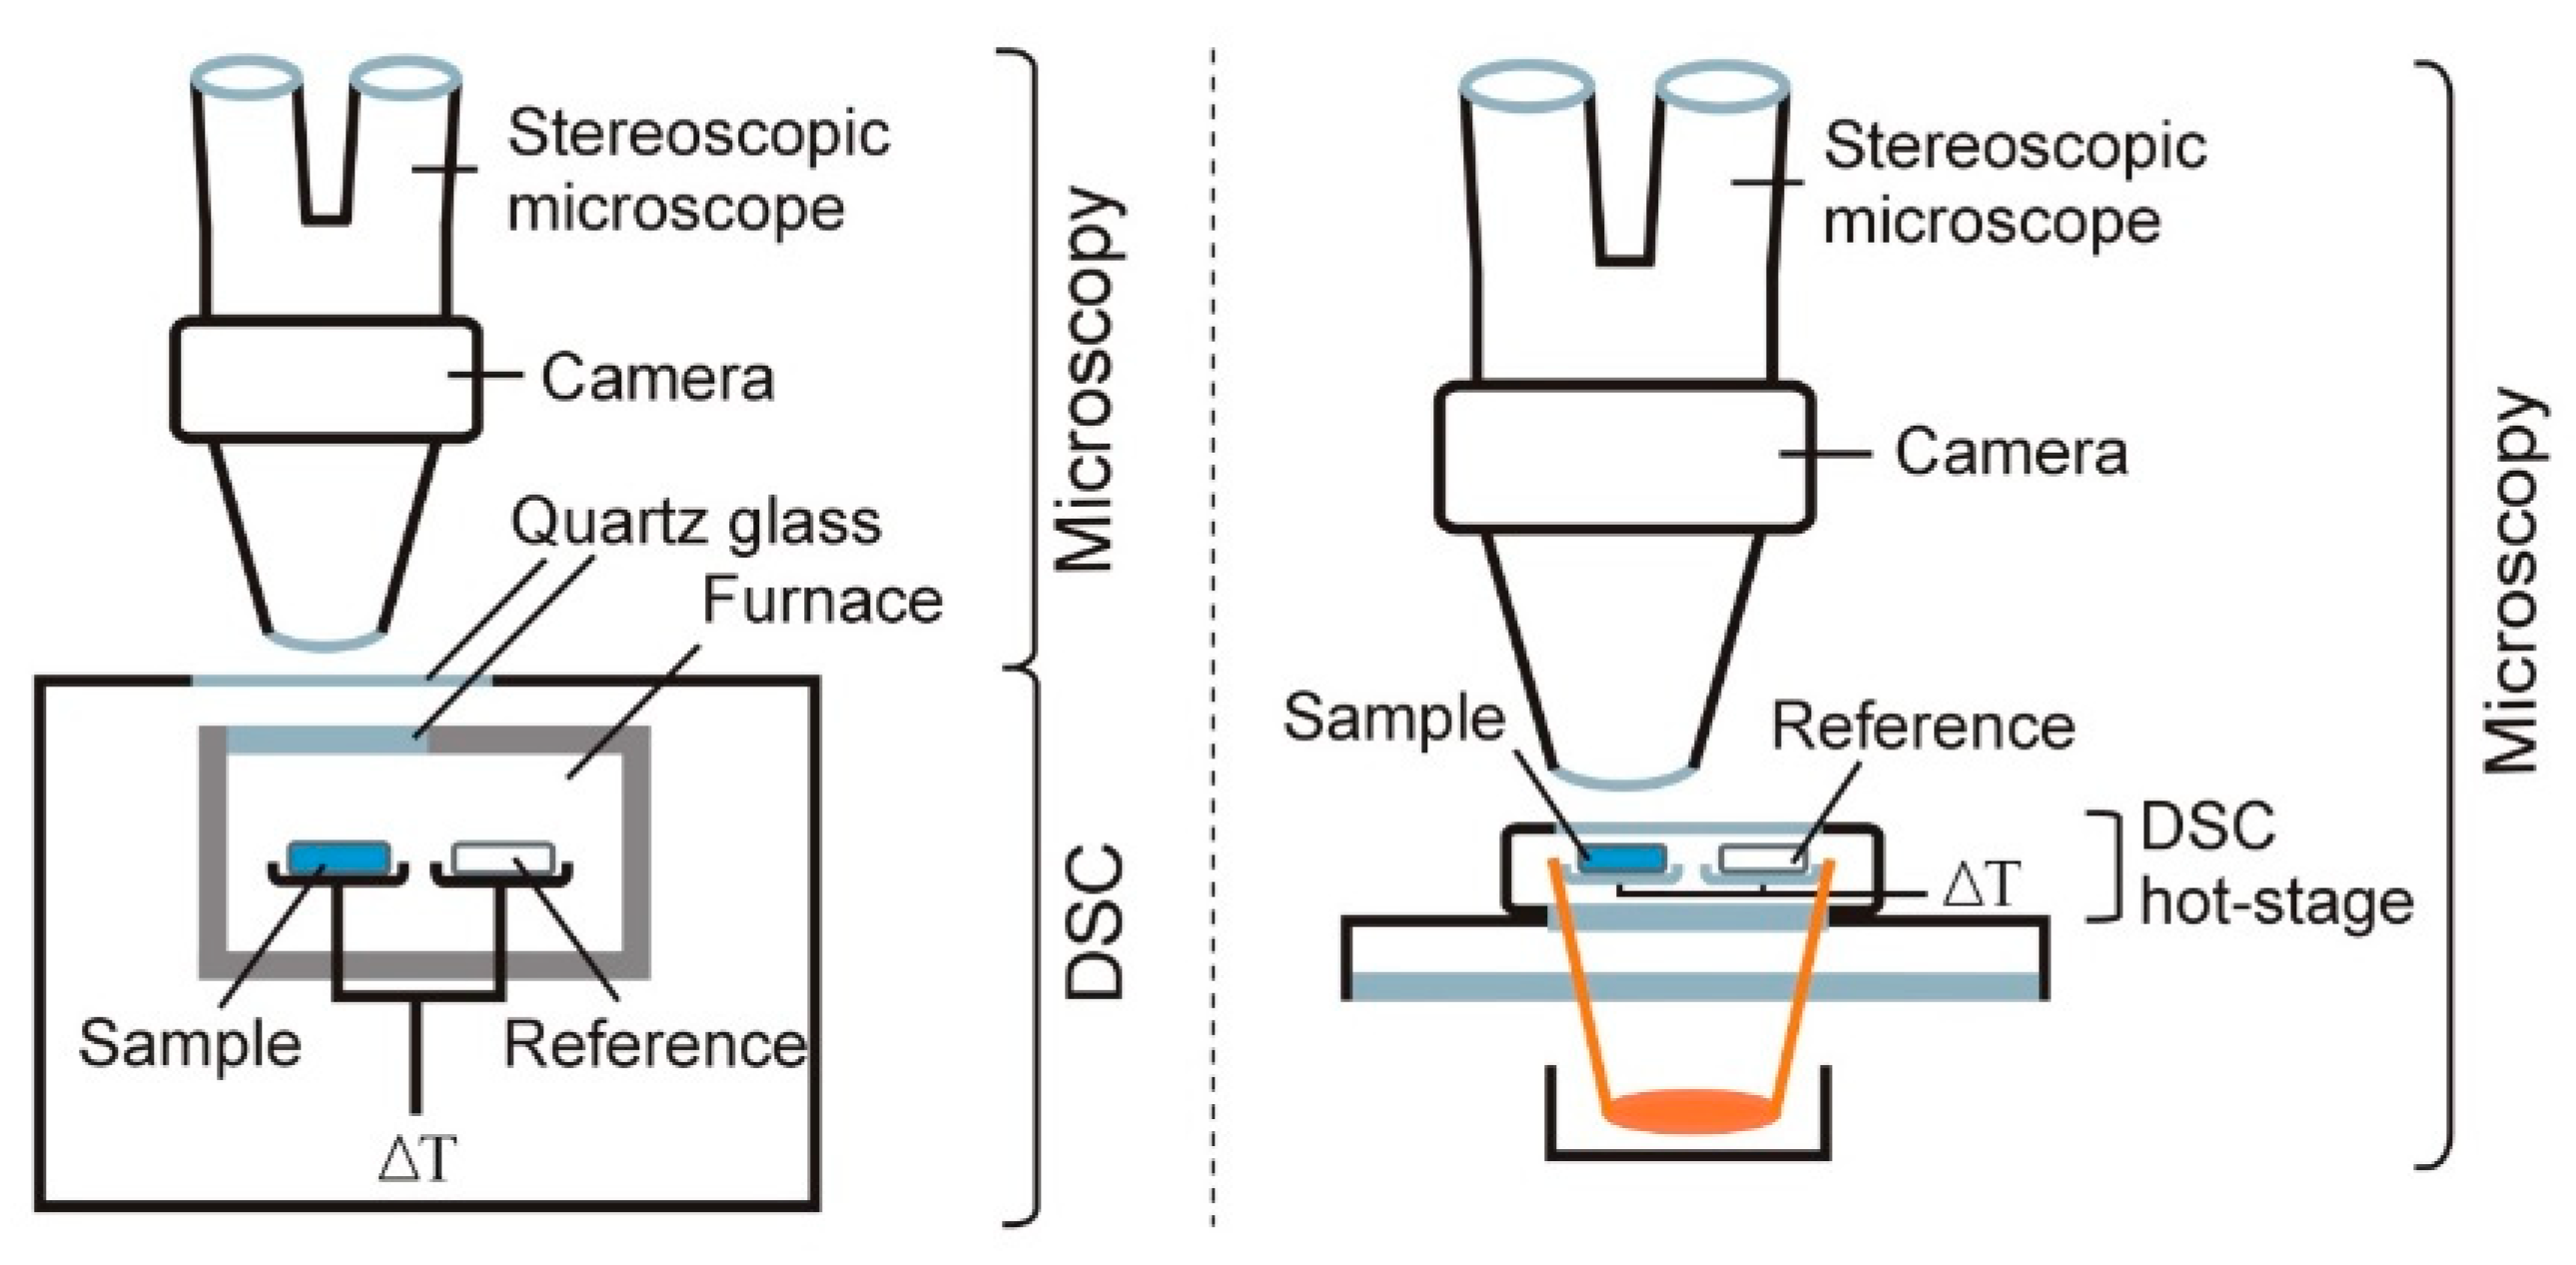
4.2. DSC–FTIR Microspectroscopy and DSC–XRD
5. Conclusions
Author Contributions
Funding
Institutional Review Board Statement
Informed Consent Statement
Data Availability Statement
Conflicts of Interest
References
- Maleki, A.; Karimpour, A.R.; MalekiDizaj, S. The role of mechanical engineering in the development of nano drug delivery systems; A review. Int. J. Nano Dimens. 2018, 9, 1–6. [Google Scholar]
- WHO. Definition of Active Pharmaceutical Ingredient. Working Document QAS/11.426/Rev. 1. 2011. Available online: https://da7648.approby.com/m/a6ae2665fe1326ef.pdf (accessed on 21 April 2023).
- Rowe, R.C.; Sheskey, P.J.; Quinn, M.E. Handbook of Pharmaceutical Excipients, 6th ed.; Pharmaceutical Press: London, UK, 2009. [Google Scholar]
- Adeyeye, M.C.; Brittain, H.G. Preformulation in Solid Dosage Form Development; Informa Healthcare: New York, NY, USA, 2008. [Google Scholar]
- EMEA. ICH Topic Q6A. Specifications: Test Procedures and Acceptance Criteria for New Drug Substances and New Drug Products: Chemical Substances. CPMP/ICH/367/96. 2000. Available online: https://www.ema.europa.eu/en/documents/scientific-guideline/ich-q-6-test-procedures-acceptance-criteria-new-drug-substances-new-drug-products-chemical_en.pdf (accessed on 21 April 2023).
- Vilegave, K.; Vidyasagar, G.; Chandankar, P. Preformulation studies of pharmaceutical new drug molecule and products: An overview. Am. J. Pharm. Health Res. 2013, 1, 1–20. [Google Scholar]
- Wesolowski, M. DSC of low molecular mass organic materials and pharmaceuticals. In Handbook of Differential Scanning Calorimetry: Techniques, Instrumentation, Inorganic, Organic and Pharmaceutical Substances; Menczel, J., Grebowicz, J., Eds.; Elsevier: Kidlington, UK, 2023; pp. 485–658. [Google Scholar]
- Saunders, M. Thermal analysis of pharmaceuticals. In Principles and Applications of Thermal Analysis; Gabbott, P., Ed.; Blackwell Publishing: Oxford, UK, 2008; pp. 286–329. [Google Scholar]
- Feist, M. Thermal analysis: Basics, applications, and benefit. ChemTexts 2015, 1, 8. [Google Scholar] [CrossRef]
- Kodre, K.V.; Attarde, S.R.; Yendhe, P.R.; Patil, R.Y.; Barge, V.U. Differential scanning calorimetry: A review. Res. Rev. J. Pharm. Anal. 2014, 3, 11–22. [Google Scholar]
- Mackenzie, R.C.; Keattch, C.J.; Daniels, T.; Dollimore, D.; Forrester, J.A.; Redfern, J.P.; Sharp, J.H. Nomenclature in thermal analysis, Part III. J. Therm. Anal. 1975, 8, 197–199. [Google Scholar] [CrossRef]
- Lever, T.; Haines, P.; Rouquerol, J.; Charsley, E.L.; Van Eckern, P.; Burlett, D.J. ICTAC nomenclature of thermal analysis (IUPAC Recommendations 2014). Pure Appl. Chem. 2014, 86, 545–553. [Google Scholar] [CrossRef]
- Bottom, R. Thermogravimetric analysis. In Principles and Applications of Thermal Analysis; Gabbott, P., Ed.; Blackwell Publishing: Oxford, UK, 2008; pp. 87–118. [Google Scholar]
- Pielichowska, K.; Nowicka, K. Analysis of nanomaterials and nanocomposites by thermoanalytical methods. Thermochim. Acta 2019, 675, 140–163. [Google Scholar] [CrossRef]
- Available online: https://www.hitachi-hightech.com/file/global/pdf/products/science/tech/ana/thermal/descriptions/TA2-3_CoupledSystem.pdf (accessed on 21 April 2023).
- Materazzi, S. Thermogravimetry. Infrared spectroscopy (TG-FTIR) coupled analysis. Appl. Spectrosc. Rev. 1997, 32, 385–404. [Google Scholar] [CrossRef]
- Materazzi, S. Mass spectrometry coupled to thermogravimetry (TG-MS) for evolved gas characterization: A review. Appl. Spectrosc. Rev. 1998, 33, 189–218. [Google Scholar] [CrossRef]
- Alencar, L.C.B.; Santana, C.P.; Silva, K.M.A.; Nóbrega, F.P.; Correia, L.P.; Santos, W.M.; Andrade, F.H.D.; Santos, F.S.; Macêdo, R.O.; Medeiros, A.C.D. Thermal study of active pharmaceutical ingredients used as analgesics by DSC and DSC coupled to photovisual system. Chem. Thermod. Therm. Anal. 2022, 7, 100072. [Google Scholar] [CrossRef]
- Lin, S.Y.; Wang, S.L.; Cheng, Y.D. Thermally induced structural changes of acetaminophen in phase transition between the solid and liquid states monitored by combination analysis of FT-IR/DSC microscopic system. J. Phys. Chem. Solids 2000, 61, 1889–1993. [Google Scholar] [CrossRef]
- Menczel, J.D.; Andre, R.; Kohl, W.S.; Krongauz, V.V.; Lőrinczy, D.; Reading, M.; Grebowicz, J. Fundamentals of DSC. In Handbook of Differential Scanning Calorimetry: Techniques, Instrumentation, Inorganic, Organic and Pharmaceutical Substances; Menczel, J.D., Grebowicz, J., Eds.; Elsevier: Kidlington, UK, 2023; pp. 1–189. [Google Scholar]
- Gabbott, P. A practical introduction to differential scanning calorimetry. In Principles and Applications of Thermal Analysis; Gabbott, P., Ed.; Blackwell Publishing: Oxford, UK, 2008; pp. 1–50. [Google Scholar]
- Wu, C.; You, J.; Wang, X. Thermal decomposition mechanism of tenofovir disoproxil fumarate. J. Therm. Anal. Calorim. 2018, 132, 471–482. [Google Scholar] [CrossRef]
- Wu, C.; You, J.; Wang, X. Study on the thermal decomposition of famciclovir. J. Therm. Anal. Calorim. 2018, 131, 1361–1371. [Google Scholar] [CrossRef]
- Silva, A.C.M.; Galico, D.A.; Guerra, R.B.; Legendre, A.O.; Rinaldo, D.; Galhiane, M.S.; Bannach, G. Study of some volatile compounds evolved from the thermal decomposition of atenolol. J. Therm. Anal. Calorim. 2014, 115, 2517–2520. [Google Scholar] [CrossRef]
- Silva, A.C.M.; Gálico, D.A.; Guerra, R.B.; Perpétuo, G.L.; Legendre, A.O.; Rinaldo, D.; Bannach, G. Thermal stability and thermal decomposition of the antihypertensive drug amlodipine besylate. J. Therm. Anal. Calorim. 2015, 120, 889–892. [Google Scholar] [CrossRef]
- Jingyan, S.; Zhiyong, W.; Yuwen, L.; Cunxin, W. Investigation of thermal behavior of enoxacin and its hydrochloride. J. Therm. Anal. Calorim. 2012, 108, 299–306. [Google Scholar] [CrossRef]
- Jingyan, S.; Jie, L.; Yun, D.; Ling, H.; Xi, Y.; Zhiyong, W.; Yuwen, L.; Cunxin, W. Investigation of thermal behavior of nicotinic acid. J. Therm. Anal. Calorim. 2008, 93, 403–409. [Google Scholar] [CrossRef]
- Gallo, R.C.; Ferreira, A.P.G.; Castro, R.E.A.; Cavalheiro, E.T.G. Studying the thermal decomposition of carvedilol by coupled TG-FTIR. J. Therm. Anal. Calorim. 2016, 123, 2307–2312. [Google Scholar] [CrossRef]
- Medeiros, R.S.; Ferreira, A.P.G.; Cavalheiro, E.T.G. Thermal behavior of naproxen and ketoprofen nonsteroidal anti-inflammatory drugs. J. Therm. Anal. Calorim. 2020, 142, 849–859. [Google Scholar] [CrossRef]
- Cervini, P.; Ambrozini, B.; Machado, L.C.M.; Ferreira, A.P.G.; Cavalheiro, E.T.G. Thermal behavior and decomposition of oxytetracycline hydrochloride. J. Therm. Anal. Calorim. 2015, 121, 347–352. [Google Scholar] [CrossRef]
- Ciciliati, M.A.; Cavalheiro, E.T.G. Studies of thermal behavior of metoprolol tartrate. J. Therm. Anal. Calorim. 2019, 138, 3653–3663. [Google Scholar] [CrossRef]
- Ciciliati, M.A.; Jesus, J.H.F.; Cavalheiro, E.T.G. Investigation of the thermal behavior of labetalol. Thermochim. Acta 2018, 668, 33–39. [Google Scholar] [CrossRef]
- Dołęga, A.; Juszyńska-Gałązka, E.; Osiecka-Drewniak, N.; Natkański, P.; Kuśtrowski, P.; Krupa, A.; Zieliński, P.M. Study on the thermal performance of carbamazepine at different temperatures, pressures and atmosphere conditions. Thermochim. Acta 2021, 703, 178990. [Google Scholar] [CrossRef]
- Sonvico, F.; Coleman, V.; Traini, D.; Young, P.M. Evolved gas analysis during thermal degradation of salbutanol sulphate. J. Therm. Anal. Calorim. 2015, 120, 789–794. [Google Scholar] [CrossRef]
- Wang, X.; You, J. Study on the thermal decomposition of capecitabine. J. Therm. Anal. Calorim. 2016, 123, 2485–2497. [Google Scholar] [CrossRef]
- Amorim, P.H.O.; Ferreira, A.P.G.; Machado, L.C.M.; Cervini, P.; Cavalheiro, E.T.G. Investigation on the thermal behavior of β-blockers antihypertensives atenolol and nadolol using TG/DTG, DTA, DSC, and TG-FTIR. J. Therm. Anal. Calorim. 2015, 120, 1035–1042. [Google Scholar] [CrossRef]
- Guerra, R.B.; Gálico, D.A.; Holanda, B.B.C.; Bannach, G. Solid-state thermal and spectroscopic studies of the anti-inflammatory drug sulindac using UV-Vis, MIR, NIR, DSC, simultaneous TG-DSC, and the coupled techniques TG-EGA-MIR and DSC-optical microscopy. J. Therm. Anal. Calorim. 2016, 123, 2523–2530. [Google Scholar] [CrossRef]
- Bannach, G.; Cervini, P.; Cavalheiro, É.T.G.; Ionashiro, M. Using thermal and spectroscopic data to investigate the thermal behavior of epinephrine. Thermochim. Acta 2010, 499, 123–127. [Google Scholar] [CrossRef]
- Ferreira, P.O.; Moura, A.; Almeida, A.C.; Santos, E.C.; Kogawa, A.C.; Caires, F.J. Mechanochemical synthesis, thermoanalytical study and characterization of new multicomponent solid forms of norfloxacin with saccharin. J. Therm. Anal. Calorim. 2022, 147, 1985–1997. [Google Scholar] [CrossRef]
- Fernandes, R.P.; Nascimento, A.L.C.S.; Carvalho, A.C.S.; Teixeira, J.A.; Ionashiro, M.; Caires, F.J. Mechanochemical synthesis, characterization, and thermal behavior of meloxicam cocrystals with salicylic acid, fumaric acid, and malic acid. J. Therm. Anal. Calorim. 2019, 138, 765–777. [Google Scholar] [CrossRef]
- Justino, A.; Carvalho, A.C.S.; Vasconcelos, L.G.; Gai, B.M.; Stein, A.L.; Siqueira, A.B. Tryptophan methyl ester: A proposal of the thermal decomposition mechanism. J. Therm. Anal. Calorim. 2022, 147, 7741–7748. [Google Scholar] [CrossRef]
- Carvalho, A.C.S.; Zangaro, G.A.C.; Fernandes, R.P.; Ekawa, B.; Nascimento, A.L.C.S.; Silva, B.F.; Ashton, G.P.; Parkes, G.M.B.; Ionashiro, M.; Caires, F.J. Lornoxicam drug—A new study of thermal degradation under oxidative and pyrolysis conditions using the thermoanalytical techniques, DRX and LC-MS/MS. Thermochim. Acta 2019, 680, 178353. [Google Scholar] [CrossRef]
- Mhoumadi, A.; Elkhashab, M.; Prillieux, S.; Dumas, J.B.; Collas, F.; Louvain, N.; Fraisse, B.; Espeau, P. Characterization of the heat behavior of amiodarone hydrochloride. Thermochim. Acta 2022, 708, 179121. [Google Scholar] [CrossRef]
- Rollinger, J.M.; Novák, C.; Éhen, Z.; Marthi, K. Thermal characterisation of torasemide using coupled techniques. J. Therm. Anal. Calorim. 2003, 73, 519–526. [Google Scholar] [CrossRef]
- Fulias, A.; Vlase, G.; Vlase, T.; Soica, C.; Heghes, A.; Craina, M.; Ledeti, I. Comparative kinetic analysis on thermal degradation of some cephalosporins using TG and DSC data. Chem. Central J. 2013, 7, 70–77. [Google Scholar] [CrossRef]
- Worzakowska, M.; Sztanke, M.; Sztanke, K. Thermal properties and decomposition mechanism of disubstituted fused 1,2,4-triazoles considered as potential anticancer and antibacterial agents. J. Therm. Anal. Calorim. 2022, 147, 14315–14327. [Google Scholar] [CrossRef]
- Wyrzykowski, D.; Hebanowska, E.; Nowak-Wiczk, G.; Makowski, M.; Chmurzyński, L. Thermal behaviour of citric acid and isomeric aconitic acids. J. Therm. Anal. Calorim. 2011, 104, 731–735. [Google Scholar] [CrossRef]
- Schindler, A.; Neumann, G.; Rager, A.; Füglein, E.; Blumm, J.; Denner, T. A novel direct coupling of simultaneous thermal analysis (STA) and Fourier transform-infrared (FT-IR) spectroscopy. J. Therm. Anal. Calorim. 2013, 113, 1091–1102. [Google Scholar] [CrossRef]
- Materazzi, S.; Curini, R. The coupling of mass spectrometry with thermoanalytical instruments: Applications of evolved gas analysis. Appl. Spectrosc. Rev. 2001, 36, 169–180. [Google Scholar] [CrossRef]
- Éhen, Z.; Novák, C.; Sztatisz, J.; Bene, O. Thermal characterization of hair using TG-MS combined thermoanalytical technique. J. Therm. Anal. Calorim. 2004, 78, 427–440. [Google Scholar] [CrossRef]
- Éhen, Z.; Giordano, F.; Sztatisz, J.; Jicsinszky, L.; Novák, C. Thermal characterization of natural and modified cyclodextrins using TG-MS combined technique. J. Therm. Anal. Calorim. 2005, 80, 419–424. [Google Scholar] [CrossRef]
- Turel, I.; Bukovec, P. Comparison of the thermal stability of ciprofloxacin and its compounds. Thermochim. Acta 1996, 287, 311–318. [Google Scholar] [CrossRef]
- Komesu, A.; Martinez, P.F.M.; Lunelli, B.H.; Oliveira, J.; Maciel, M.R.W.; Filho, R.M. Study of lactic acid thermal behavior using thermoanalytical techniques. J. Chem. 2017, 2017, 4149592. [Google Scholar] [CrossRef]
- Brecht, D.; Uteschil, F.; Schmitz, O.J. Thermogravimetry coupled to an atmospheric pressure photo ionization quadrupole mass spectrometry for the product control of pharmaceutical formulations and the analysis of plasticizers in polymers. Talanta 2019, 198, 440–446. [Google Scholar] [CrossRef]
- Koehler, T.; Ackermann, I.; Brecht, D.; Uteschil, F.; Wingender, J.; Telgheder, U.; Schmitz, O.J. Analysis of volatile metabolites from in vitro biofilms of Pseudomonas aeruginosa with thin-film microextraction by thermal desorption gas chromatography-mass spectrometry. Anal. Bioanal. Chem. 2020, 412, 2881–2892. [Google Scholar] [CrossRef] [PubMed]
- Zhang, H.; Jiang, J.C.; Ni, L.; Shu, C.M. Thermal hazard and pyrolysis mechanism investigation using thermal analysis coupled with quantum-chemical DFT simulation for 1-hydroxy-7-azabenzotriazole. J. Therm. Anal. Calorim. 2023, 148, 4867–4881. [Google Scholar] [CrossRef]
- Boguta, P.; Sokolowska, Z.; Skic, K. Use of thermal analysis coupled with differential scanning calorimetry, quadrupole mass spectrometry and infrared spectroscopy (TG-DSC-QMS-FTIR) to monitor chemical properties and thermal stability of fulvic and humic acids. PLoS ONE 2017, 12, 189653. [Google Scholar] [CrossRef]
- Araújo, A.A.S.; Storpirtis, S.; Mercuri, L.P.; Carvalho, F.M.S.; Santos-Filho, M.; Matos, J.R. Thermal analysis of the antiretroviral zidovudine (AZT) and evaluation of the compatibility with excipients used in solid dosage forms. Int. J. Pharm. 2003, 260, 303–314. [Google Scholar] [CrossRef]
- Procópio, J.V.V.; Souza, V.G.; Costa, R.A.; Correia, L.P.; Souza, F.S.; Macêdo, R.O. Application of thermal analysis and pyrolysis coupled to GC/MC in the qualification of simvastatin pharmaceutical raw material. J. Therm. Anal. Calorim. 2011, 106, 665–670. [Google Scholar] [CrossRef]
- Böer, T.M.; Procópio, J.V.V.; Nascimento, T.G.; Macêdo, R.O. Correlation of thermal analysis and pyrolysis coupled to GC-MS in the characterization of tacrolimus. J. Pharm. Biomed. Anal. 2013, 73, 18–23. [Google Scholar] [CrossRef]
- Moura, E.A.; Correia, L.P.; Pinto, M.F.; Procópio, J.V.V.; Souza, F.S.; Macêdo, R.O. Thermal characterization of the solid state and raw materials fluconazole by thermal analysis and pyrolysis coupled to GC/MS. J. Therm. Anal. Calorim. 2010, 100, 289–293. [Google Scholar] [CrossRef]
- Costa, S.P.M.; Gomes, T.A.; Silva, K.E.R.; Silva, P.C.D.; Yun, A.E.H.K.; Melo, T.B.L.; Andrade, F.H.D.; Santos, F.S.; Silva, R.M.F.; Rolim, L.A.; et al. Characterization and thermal stability study of efavirenz and solid dispersion with PVPVA 64 by means of thermal analysis and pyrolysis coupled with GC/MS. J. Therm. Anal. Calorim. 2021, 146, 2169–2182. [Google Scholar] [CrossRef]
- Correia, L.P.; Procópio, J.V.V.; Santana, C.P.; Santos, A.F.O.; Cavalcante, H.M.M.; Macêdo, R.O. Characterization of herbal medicine with different particle sizes using pyrolysis GC/MS, SEM, and thermal techniques. J. Therm. Anal. Calorim. 2013, 111, 1691–1698. [Google Scholar] [CrossRef]
- Kumar, A.; Singh, P.; Nanda, A. Hot stage microscopy and its applications in pharmaceutical characterization. Appl. Microsc. 2020, 50, 1–11. [Google Scholar] [CrossRef] [PubMed]
- Chadha, R.; Arora, P.; Bhandari, S.; Bala, M. Thermomicroscopy and its pharmaceuticals applications. In Current Microscopy Contributions to Advances in Science and Technology; Méndez-Vilas, A., Ed.; Formatex Research Center: Badajoz, Spain, 2012; Volume 2, pp. 1013–1024. [Google Scholar]
- Stieger, N.; Aucamp, M.; Zhang, S.W.; Villiers, M.M. Hot-stage optical microscopy as an analytical tool to understand solid-state changes in pharmaceutical materials. Am. Pharm. Rev. 2012, 15, 32–36. [Google Scholar]
- Vitez, I.M.; Newman, A.W.; Davidovich, M.; Kiesnowski, C. The evolution of hot stage microscopy to aid solid-state characterizations of pharmaceutical solids. Thermochim. Acta 1998, 324, 187–196. [Google Scholar] [CrossRef]
- Souza, F.S.; Barreto, A.P.G.; Macêdo, R.O. Characterization of starch pharmaceuticals by DSC coupled to a photovisual system. J. Therm. Anal. Calorim. 2001, 64, 739–743. [Google Scholar] [CrossRef]
- Medeiros, A.C.D.; Cervantes, N.A.B.; Gomes, A.P.B.; Macêdo, R.O. Thermal stability of prednisone drug and tablets. J. Therm. Anal. Calorim. 2001, 64, 745–750. [Google Scholar] [CrossRef]
- Macêdo, R.O.; Nascimento, T.G.; Veras, J.W.E. Comparison of generic hydrochlorothiazide formulations by means of TG and DSC coupled to a photovisual system. J. Therm. Anal. Calorim. 2001, 64, 757–763. [Google Scholar] [CrossRef]
- Macêdo, R.O.; Nascimento, T.G.; Veras, J.W.E. Compatibility and stability studies of propranolol hydrochloride binary mixtures and tablets for TG and DSC-photovisual. J. Therm. Anal. Calorim. 2002, 67, 483–489. [Google Scholar] [CrossRef]
- Costa, E.M.; Filho, J.M.B.; Nascimento, T.G.; Macêdo, R.O. Thermal characterization of the quercetin and rutin flavonoids. Thermochim. Acta 2002, 392–393, 79–84. [Google Scholar] [CrossRef]
- Macêdo, R.O.; Nascimento, T.G. Quality control of thiabendazole pre-formulation and tablets by TG and DSC coupled to the photovisual system. Thermochim. Acta 2002, 392–393, 85–92. [Google Scholar] [CrossRef]
- Medeiros, A.C.D.; Medeiros, I.A.; Macédo, R.O. Thermal studies of Albizia inopinata crude extract in the presence of cyclodextrin and Aerosol® by TG and DSC coupled to the photovisual system. Thermochim. Acta 2002, 392–393, 93–98. [Google Scholar] [CrossRef]
- Souza, F.S.; Macedo, R.O.; Veras, J.W.E. Studies of cimetidine pre-formulation and tablets for TG and DSC coupled to the photovisual system. Thermochim. Acta 2002, 392–393, 99–106. [Google Scholar] [CrossRef]
- Souza, N.A.B.; Medeiros, A.C.D.; Santos, A.F.O.; Macêdo, R.O. Thermal stability of metronidazole drug and tablets. J. Therm. Anal. Calorim. 2003, 72, 535–538. [Google Scholar] [CrossRef]
- Medeiros, A.F.D.; Santos, A.F.O.; Souza, F.S.; Jứnior, I.D.B.; Valdilânio, J.; Procópio, J.V.V.; Santana, D.P.; Macêdo, R.O. Thermal studies of pre-formulates of metronizadole obtained by spray drying technique. J. Therm. Anal. Calorim. 2007, 89, 775–781. [Google Scholar] [CrossRef]
- Silva, R.M.F.; Medeiros, F.P.M.; Nascimento, T.G.; Macêdo, R.O.; Neto, P.J.R. Thermal characterization of indinavir sulfate using TG, DSC and DSC-photovisual. J. Therm. Anal. Calorim. 2009, 95, 965–968. [Google Scholar] [CrossRef]
- Grundner, C.L.; Poiesz, K.B.; Redman-Furey, N.L. Development and use of a TG-DTA-microscope for evaluation of pharmaceutical materials. J. Therm. Anal. Calorim. 2006, 85, 91–98. [Google Scholar] [CrossRef]
- Mettler-Toledo. Hot Stage Microscope Brochure. Available online: https://www.mt.com/us/en/home/products/Laboratory_Analytics_Browse/TA_Family_Browse/hot-stage_systems.html (accessed on 21 April 2023).
- Lin, S.Y.; Wang, S.L.; Chen, T.F.; Hu, T.C. Intramolecular cyclization of diketopiperazine formation in solid-state enalapril maleate studied by thermal FT-IR microscopic system. Eur. J. Pharm. Biopharm. 2002, 54, 249–254. [Google Scholar] [CrossRef]
- Lin, S.Y.; Chien, J.L. In vitro simulation of solid-solid dehydration, rehydration, and solidification of trehalose dihydrate using thermal and vibrational spectroscopic techniques. Pharm. Res. 2003, 20, 1926–1931. [Google Scholar] [CrossRef]
- Lin, S.Y.; Cheng, W.T.; Wang, S.L. Thermodynamic and kinetic characterization of polymorphic transformation of famotidine during grinding. Int. J. Pharm. 2006, 318, 86–91. [Google Scholar] [CrossRef] [PubMed]
- Wang, S.L.; Lin, S.Y.; Hsieh, T.F.; Chanb, S.A. Thermal behavior and thermal decarboxylation of 10-hydroxycamptothecin in the solid state. J. Pharm. Biomed. Anal. 2007, 43, 457–463. [Google Scholar] [CrossRef] [PubMed]
- Hsu, C.H.; Lin, S.Y. Rapid examination of the kinetic process of intramolecular lactamization of gabapentin using DSC-FTIR. Thermochim. Acta 2009, 486, 5–10. [Google Scholar] [CrossRef]
- Hsu, C.H.; Ke, W.T.; Lin, S.Y. Progressive steps of polymorphic transformation of gabapentin polymorphs studied by hot-stage FTIR microspectroscopy. J. Pharm. Pharm. Sci. 2010, 13, 67–77. [Google Scholar] [CrossRef] [PubMed]
- Gao, G.Y.; Lin, S.Y. Thermodynamic investigations of nitroxoline sublimation by simultaneous DSC-FTIR method and isothermal TG analysis. J. Pharm. Sci. 2010, 99, 255–261. [Google Scholar] [CrossRef] [PubMed]
- Wu, T.K.; Lin, S.Y.; Lin, H.L.; Huang, Y.T. Simultaneous DSC-FTIR microspectroscopy used to screen and detect the co-crystal formation in real time. Bioorg. Med. Chem. Lett. 2011, 21, 3148–3151. [Google Scholar] [CrossRef]
- Lin, S.-Y.; Cheng, W.-T.; Wei, Y.-S.; Lin, H.-L. DSC-FTIR microspectroscopy used to investigate the heat-induced intramolecular cyclic anhydride formation between Eudragit E and PVA copolymer. Polym. J. 2011, 43, 577–580. [Google Scholar] [CrossRef]
- Wang, S.-L.; Wong, Y.-C.; Cheng, W.-T.; Lin, S.-Y. A continuous process for solid-state dehydration, amorphization and recrystallization of metoclopramide HCl monohydrate studied by simultaneous DSC-FTIR microspectroscopy. J. Therm. Anal. Calorim. 2011, 104, 261–264. [Google Scholar] [CrossRef]
- Lin, H.-L.; Hsu, P.-C.; Lin, S.-Y. Theophylline-citric acid co-crystals easily induced by DSC-FTIR microspectroscopy or different storage conditions. Asian J. Pharm. Sci. 2013, 8, 19–27. [Google Scholar] [CrossRef]
- Lin, H.-L.; Zhang, G.-C.; Lin, S.-Y. Real-time co-crystal screening and formation between indomethacin and saccharin via DSC analytical technique or DSC-FTIR microspectroscopy. J. Therm. Anal. Calorim. 2015, 120, 679–687. [Google Scholar] [CrossRef]
- Lin, H.-L.; Huang, Y.-T.; Lin, S.-Y. Spectroscopic and thermal approaches to investigate the formation mechanism of piroxicam-saccharin co-crystal induced by liquid-assisted grinding or thermal stress. J. Therm. Anal. Calorim. 2016, 123, 2345–2356. [Google Scholar] [CrossRef]
- Roque-Flores, R.L.; Matos, J.R. Simultaneous measurements of X-ray diffraction-differential scanning calorimetry. J. Therm. Anal. Calorim. 2019, 137, 1347–1358. [Google Scholar] [CrossRef]
- Lin, S.-Y.; Wang, S.-L. Advances in simultaneous DSC-FTIR microspectroscopy for rapid solid-state chemical stability studies: Some dipeptide drugs as examples. Adv. Drug Deliv. Rev. 2012, 64, 461–478. [Google Scholar] [CrossRef] [PubMed]
- Lin, S.-Y. Simultaneous screening and detection of pharmaceutical co-crystals by the one-step DSC-FTIR microspectroscopic technique. Drug Discov. Today 2017, 22, 718–728. [Google Scholar] [CrossRef] [PubMed]
- Lin, S.-Y. Current and potential applications of simultaneous DSC-FTIR microspectroscopy for pharmaceutical analysis. J. Food Drug Anal. 2021, 29, 182–202. [Google Scholar] [CrossRef]
- Rigaku Pharmaceutical Technologies Showcase. Simultaneous XRD-DSC-Humidity Analysis for Pharmaceutical Samples. Available online: https://pharma.rigaku.com/applications/simultaneous-xrd-dsc-humidity-analysis (accessed on 21 April 2023).
- Clout, A.; Buanz, A.B.M.; Prior, T.J.; Reinhard, C.; Wu, Y.; O’Hare, D.; Williams, G.R.; Gaisford, S. Simultaneous differential scanning calorimetry-synchrotron X-ray powder diffraction: A powerful technique for physical form characterization in pharmaceutical materials. Anal. Chem. 2016, 88, 10111–10117. [Google Scholar] [CrossRef]


| Active Pharmaceutical Ingredients | Therapeutic Activity | Purpose of Research | Supporting Techniques | References |
|---|---|---|---|---|
| Atenolol | antihypertensive drug | volatile degradation products | TG/DSC | [24] |
| Sulindac acid | nonsteroidal anti-inflammatory agent | thermal behavior, volatile degradation products, thermal stability | TG/DSC, DSC–photovisual, FTIR, NIR, UV-Vis | [37] |
| Amlodipine besylate | antihypertensive drug | TG/DSC, DSC | [25] | |
| Amiodarone hydrochloride | antiarrhythmic and vasodilatory drug | TG, DSC, Flash DSC, XRPD | [43] | |
| Di-disubstituted 1,2,4-triazoles | potential antitumor and antibacterial drug | TG/DTG/DSC | [46] | |
| Cephalosporins | antibacterial drug | thermal decomposition, volatile degradation products, the kinetics of thermal decomposition | TG/DTG/DTA, DSC | [45] |
| Enoxacin, hydrochloride | TG/DTG/DSC, FTIR | [26] | ||
| Nicotinic acid | B group vitamin | [27] | ||
| Carbamazepine | antiepileptic drug | impact of sample pans and atmosphere on the kinetics of thermal decomposition | TG/DTG/DTA, DSC, FTIR, HPLC | [33] |
| Naproxen, ketoprofen | nonsteroidal anti-inflammatory agents | thermal decomposition, volatile degradation products, mechanism of thermal decomposition | TG/DTG/DTA, DSC, HSM | [29] |
| Oxytetracycline hydrochloride | antibiotic | TG/DTG/DTA, DSC | [30] | |
| Carvedilol | antihypertensive drug | [28] | ||
| Atenolol, nadolol | [36] | |||
| Metoprolol tartrate | antihypertensive drug | thermal decomposition, volatile and solid degradation products, mechanism of thermal decomposition | TG/DTG/DTA, DSC, HSM, HPLC-MS | [31] |
| Labetalol | TG/DTG/DTA, DSC, HSM, GC/MS | [32] | ||
| Tenofovir disoproxil fumarate | antiretroviral agent | TG/DTG/DSC, FTIR, HPLC, LC-MS | [22] | |
| Famciclovir | [23] | |||
| Capecitabine | antitumor drug | [25] | ||
| Epinephrine | neurotransmitter | TG/DTG/DTA, DSC, MS, PXRD, FTIR | [38] | |
| Tryptophan methyl ester | amino acid ester, the precursor of bioactive compounds | TG/DTG/DTA, TG/DSC, FTIR, NMR, HPLC-MS | [41] | |
| Norfloxacin, co-crystal with saccharin, solvate | antibiotic | impact of solvent and synthesis method on the co-crystallization product | TG/DTA, DSC, DSC–photovisual, PXRD, FTIR | [39] |
| Meloxicam, co-crystals with organic acids | nonsteroidal anti-inflammatory agent | thermal behavior, identification of co-crystal composition, polymorphic transitions | TG/DSC, DSC–photovisual, PXRD, FTIR, Raman | [40] |
| TG Instruments | Mass Spectrometers | Transfer Line, MS Measurements | References |
|---|---|---|---|
| SDT 2960 DSC-TGA (TA Instruments) | Balzers ThermoStar GSD 300T Quadrupole MS (Pfeiffer Vacuum) | heated silica capillary; SAC mode, MID mode | [44,50,51] |
| STA 409 Thermobalance (Netzsch) | Leybold Infiction 200 MS | capillary coupling; 150 °C | [52] |
| STA 449 Jupiter F3 TGA-DSC/DTA (Netzsch) | QMS 403 C Aëolos Quadrupole MS (Netzsch) | [47] | |
| TGA/SDTA 1150 (Mettler-Toledo) | HPR20 Quadrupole MS (Hiden) | capillary coupling; 250 °C; nitrogen, air, flow rate 60 mL/min; EI, 70 eV, SEM | [42] |
| Setsys 16/18 Evolution TG-DTA/DSC (Setaram) | Balzers ThermoStar Quadrupole MS (Pfeiffer Vacuum) | capillary coupling; 198 °C | [34] |
| Setsys 16/18 Evolution TG-DTA/DSC (Setaram) | ThermoStar GSD 301T Quadrupole MS (Pfeiffer Vacuum) | [53] | |
| STA 7200 TG/DTG/DTA (Hitachi) | Chromaster 5610 MS Detector (Hitachi) | l = 500 mm, highly flexible, small dead volume, heated via electric resistance; APPI | [54,55] |
| Thermo plus EV02 TG-DTA (Rigaku) | Photo ionization Mass Spectrometer (Rigaku) | quartz capillary; 200 °C; helium, flow rate 100 mL/min; PI; 70 eV; m/z range 1–400 | [56] |
| Materials Examined | Therapeutic Activity | Purpose of Research | Supporting Techniques | References |
|---|---|---|---|---|
| Human hair | potential diagnostic material | preliminary thermal characteristics of various hair samples | TG/DTA, DSC | [50] |
| Biofilms of the strain of Pseudomonas aeruginosa | potential diagnostic material | identification of the Pseudomonas aeruginosa strain under clinical conditions | TG/DTG/DTA | [55] |
| Acetylsalicylic acid, drug formulations | nonsteroidal anti-inflammatory agent | quality control and identification of falsified drug formulations | TG/DTG/DTA | [54] |
| Cyclodextrins, natural and modified | excipients | thermal behavior, the difference in fragmentation profiles of native and substituted products | TG/DTA, XRPD | [51] |
| Ciprofloxacin, salts | antibacterial drugs | thermal behavior, rearrangement of hydrogen bonds | TG, DSC, FTIR, EA | [52] |
| Lactic acid | used in skin, gastrointestinal and gynecological diseases | thermal decomposition, kinetics of thermal decomposition | TG/DTG, DSC | [53] |
| Torasemide | diuretic and antihypertensive drug | crystal transitions, solvate, volatile degradation products, mechanism of thermal decomposition | TG/DTG, DTA, TG–FTIR, HSM, SEM | [44] |
| Salbutamol sulfate | used in acute and chronic bronchoconstriction | thermal decomposition, volatile degradation products, mechanism of thermal decomposition | TG/DTG, DSC, TG–FTIR | [34] |
| Lornoxicam | nonsteroidal anti-inflammatory agent | thermal decomposition, volatile and solid degradation products, mechanism of thermal decomposition | TG/DSC, TG–FTIR, DSC–photovisual, HSM, PXRD, LC-MS/MS | [42] |
| Citric acid, isomers of aconitic acid | excipient | impact of chemical structure and geometrical configuration of acids on the degradation products’ stability and the course of their decomposition | TG, TG–FTIR, DSC | [47] |
| 1-Hydroxy-7-azabenzotriazole | peptide coupling reagent | thermal decomposition, volatile and solid degradation products, mechanism of thermal decomposition, thermal safety during manufacture, transport, use and storage | TG, DSC, ARC, FTIR, SEM-EDS, XPS | [56] |
| DSC Instruments | Second Techniques | Measurement Conditions | References |
|---|---|---|---|
| DSC–photovisual | |||
| DSC-50 photovisual system (Shimadzu) | microscope (Olympus), microscope SZ-CTV60 (Olympus); camera VCC-D520 (Sanyo), camera VCC-520 (Sony) | β = 5 °C/min, 10 °C/min, 15 °C/min, 20 °C/min; ΔT = 20–250 °C, 25–300 °C, 25–400 °C, 25–500 °C; nitrogen, flow rate 50 mL/min | [18,68,69,70,71,72,73,74,75,76,77,78] |
| TG-DSC 1 (Mettler-Toledo) | camera SC30, 3.3-megapixel CMOS sensor, 6.5 × zoom (Olympus) | β = 10 °C/min; 20–225°, 20–300 °C; nitrogen, air, flow rate 50 mL/min | [37,39,40,42] |
| DSC–FTIR microspectroscopy | |||
| HS84 DSC hot-stage system (Mettler) | FTIR microscopic spectrometer Micro FTIR-200 (Jasco) | β = 3 °C/min, 5 °C/min; ΔT = 25–160 °C, 25–270 °C, 30–120 °C, 30–200 °C, 30–300 °C; transmission mode; MCT detector | [19,81,82,83,84,85,86,87,88] |
| HS84 DSC hot-stage system (Mettler) | FTIR microscopic spectrometer IRT-5000-16/FTIR 6200 (Jasco) | β = 3 °C/min; ΔT = 30–200 °C, 30–240 °C, 30–250 °C, 30–300 °C, 30–320 °C; transmission mode; MCT detector, 4 cm–1 resolution | [89,90,91,92,93] |
| DSC–XRD | |||
| Thermo Plus DSC (Rigaku) | SmartLab Multipurpose Diffractometer (Rigaku) | β = 5 °C/min; ΔT = 25–350 °C; nitrogen, flow rate 50 mL/min; X-ray source Cu Kα; step size 0.02° between 3 and 35° (2θ) | [94] |
| Pharmaceuticals | Therapeutic Activity | Purpose of Research | Supporting Tools | References |
|---|---|---|---|---|
| DSC–photovisual | ||||
| Powdered starch | excipient | evaluation of the gelatinization process | DSC | [68] |
| Indinavir sulfate | antiretroviral agent | thermal behavior, quality assessment | DSC, TG/DTG | [78] |
| Prednisone, tablets | anti-inflammatory and immunosuppressant agent | thermal behavior, interactions between tablets’ ingredients | DTA, DSC, TG, XRPD, FTIR | [69] |
| Dipyrone sodium, caffeine, orphenadrine citrate | analgesics drugs | [18] | ||
| Hydrochlorothiazide, tablets | diuretic used in hypertension | thermal behavior, interactions between tablets’ ingredients, thermal stability, the kinetic parameters | DSC, TG | [70] |
| Propranolol hydrochloride, tablets | used to treat heart problems | [71] | ||
| Cimetidine, tablets | used in peptic ulcer disease and indigestion | [75] | ||
| Metronidazole, tablets | antibiotic (gastrointestinal infections) | [76,77] | ||
| Thiabendazole, tablets | antifungal and antiparasitic agent | DSC, TG, FTIR | [73] | |
| Quercetin, rutin | health-promoting flavonoids | thermal decomposition, the kinetic parameters | DSC, TG | [72] |
| Simvastatin | used in hypercholesterolemia | thermal decomposition, volatile degradation products, thermal stability, the kinetic parameters | DSC, TG, Pyr-GC/MS | [59] |
| Fluconazole | antifungal drug | [61] | ||
| Efavirenz | antiretroviral agent | [62] | ||
| Crude extract of Albizia inopinata | potential antihypertensive and vasodilation action | influence of stabilizers on the thermal decomposition, kinetic parameters | DSC, TG | [74] |
| DSC–FTIR microspectroscopy | ||||
| Acetaminophen | analgesic and antipyretic drug | effect of temperature on the intermolecular hydrogen bonding at solid and liquid states | DSC | [19] |
| Famotidine | histamine H2-receptor antagonist | effect of grinding on the polymorphic transitions | DSC, FTIR | [83] |
| Gabapentin | anticonvulsant agent | heat-induced polymorphic interconversions | DSC, TG, PXRD, FTIR | [86] |
| heat-induced intramolecular lactamization, kinetics | DSC, TG, FTIR | [85] | ||
| Enalapril maleate | used in hypertension and congestive heart failure | formation of diketopiperazine via heat-induced intramolecular cyclization | DSC, TG | [81] |
| Eudragit E | excipient | heat-induced intramolecular anhydride formation | [89] | |
| Nitroxoline | urinary antibacterial drug | solid-state characteristics, sublimation, kinetic parameters | DSC, TG, FTIR | [87] |
| Metoclopramide hydrochloride | used in stomach and esophageal problems | thermal behavior (dehydration, amorphization, recrystallization) | DSC, TG | [90] |
| Trehalose dihydrate | excipient | dehydration, rehydration, polymorphic transition | DSC, TG | [82] |
| 10-Hydroxycamptothecin | used in cancer therapy | thermal behavior (dehydration, rehydration, decarboxylation, polymorphism), thermal stability | DSC, TG, FTIR, ES-IT-MS | [84] |
| Co-crystals of APIs with various co-formers | improved physicochemical properties of APIs | direct screening of thermally-induced co-crystals’ formation via specific intermolecular interaction | DSC | [88,91,92,93] |
| DSC–XRD | ||||
| Ganciclovir | antiviral drug | effect of temperature on the structural changes of crystal forms, polymorphic transitions | DSC, TG/DTG, HSM, SEM, PXRD, FTIR, EA | [94] |
Disclaimer/Publisher’s Note: The statements, opinions and data contained in all publications are solely those of the individual author(s) and contributor(s) and not of MDPI and/or the editor(s). MDPI and/or the editor(s) disclaim responsibility for any injury to people or property resulting from any ideas, methods, instructions or products referred to in the content. |
© 2023 by the authors. Licensee MDPI, Basel, Switzerland. This article is an open access article distributed under the terms and conditions of the Creative Commons Attribution (CC BY) license (https://creativecommons.org/licenses/by/4.0/).
Share and Cite
Wesolowski, M.; Leyk, E. Coupled and Simultaneous Thermal Analysis Techniques in the Study of Pharmaceuticals. Pharmaceutics 2023, 15, 1596. https://doi.org/10.3390/pharmaceutics15061596
Wesolowski M, Leyk E. Coupled and Simultaneous Thermal Analysis Techniques in the Study of Pharmaceuticals. Pharmaceutics. 2023; 15(6):1596. https://doi.org/10.3390/pharmaceutics15061596
Chicago/Turabian StyleWesolowski, Marek, and Edyta Leyk. 2023. "Coupled and Simultaneous Thermal Analysis Techniques in the Study of Pharmaceuticals" Pharmaceutics 15, no. 6: 1596. https://doi.org/10.3390/pharmaceutics15061596
APA StyleWesolowski, M., & Leyk, E. (2023). Coupled and Simultaneous Thermal Analysis Techniques in the Study of Pharmaceuticals. Pharmaceutics, 15(6), 1596. https://doi.org/10.3390/pharmaceutics15061596