
Bicontinuous Cubic Liquid Crystals as Potential Matrices for Non-Invasive Topical Sampling of Low-Molecular-Weight Biomarkers


Abstract
:1. Introduction
2. Materials and Methods
2.1. Materials
2.2. Sample Preparation
2.3. Small-Angle X-ray Diffraction (SAXD)
2.4. Humidity Scanning (HS) QCM-D
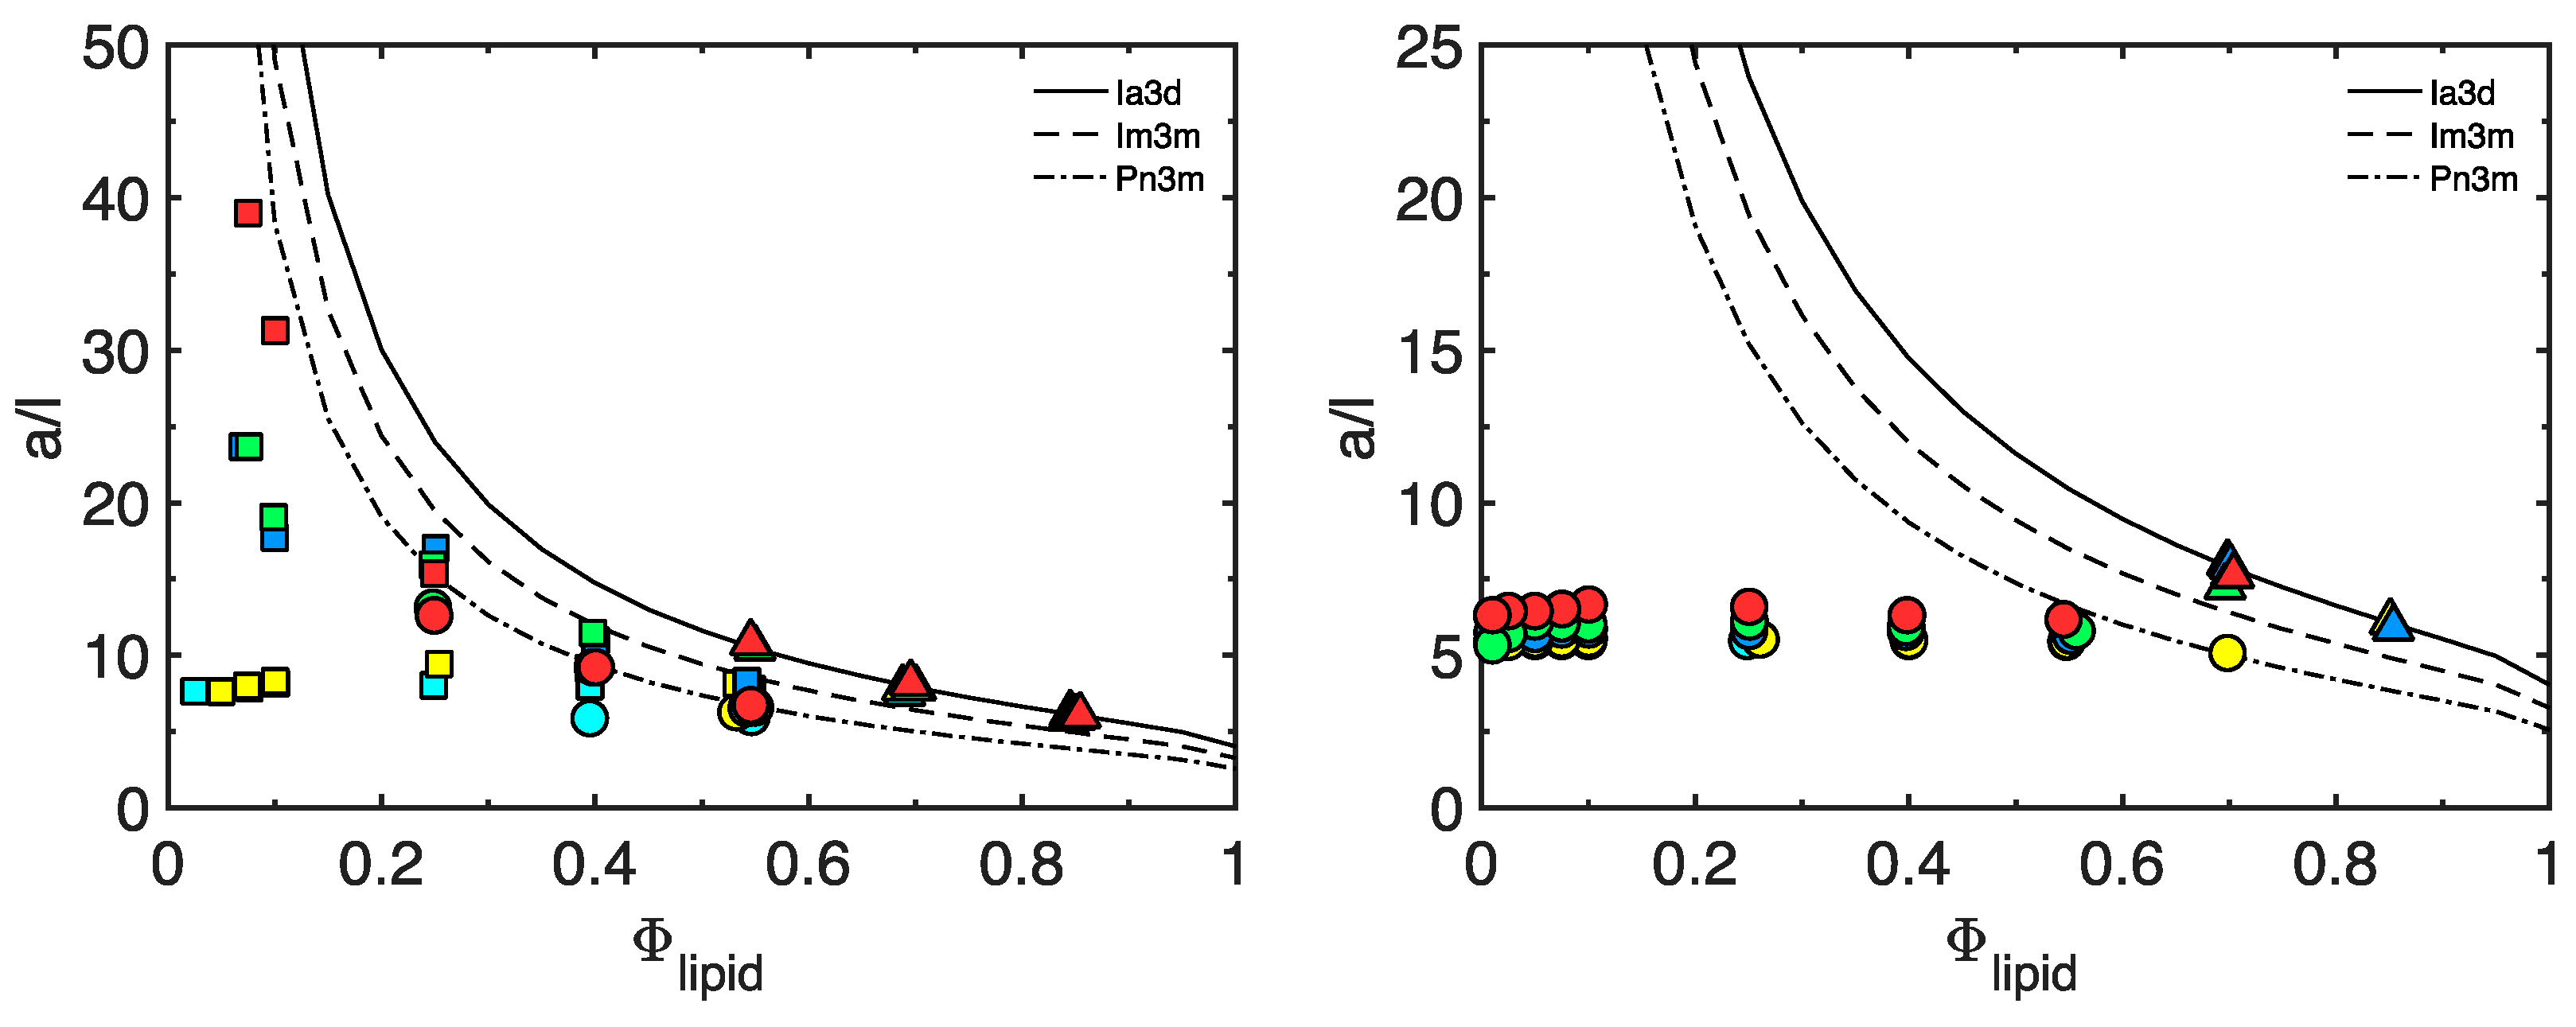
2.5. Swelling of Bicontinuous Liquid Crystalline Aqueous Phases
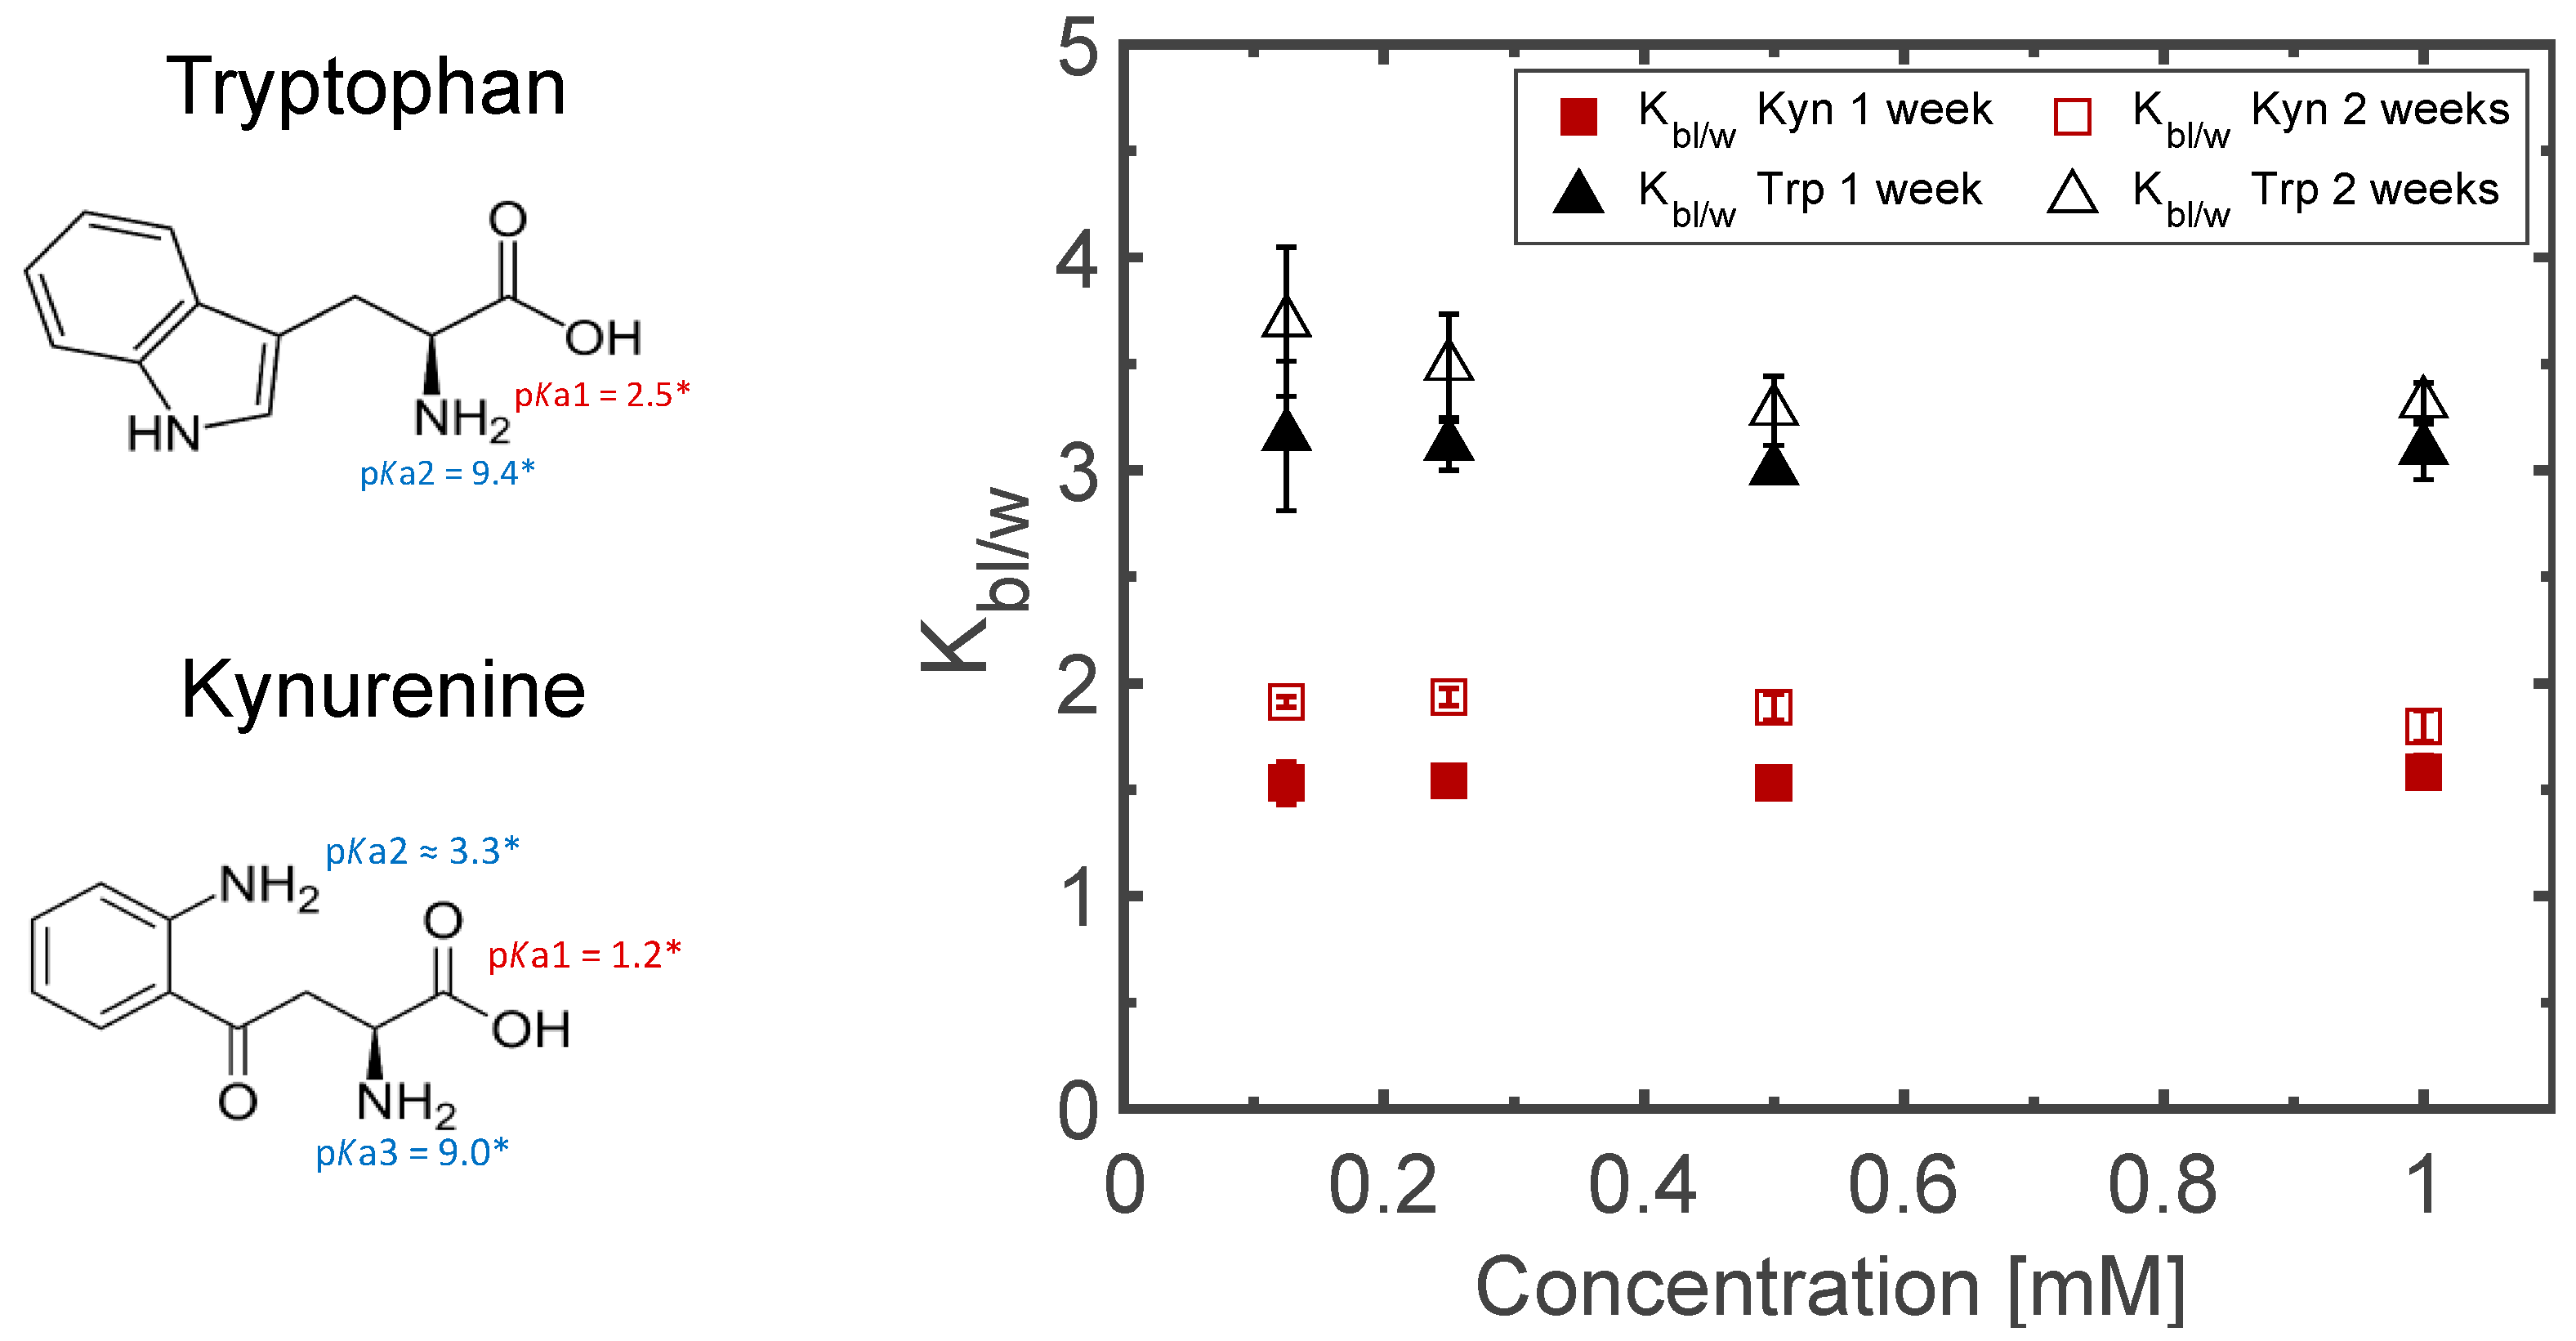
2.6. Partitioning of Trp and Kyn into Lipid Bilayer
2.7. Bilayer Partition Coefficient
2.8. HPLC-UV Analysis
3. Results
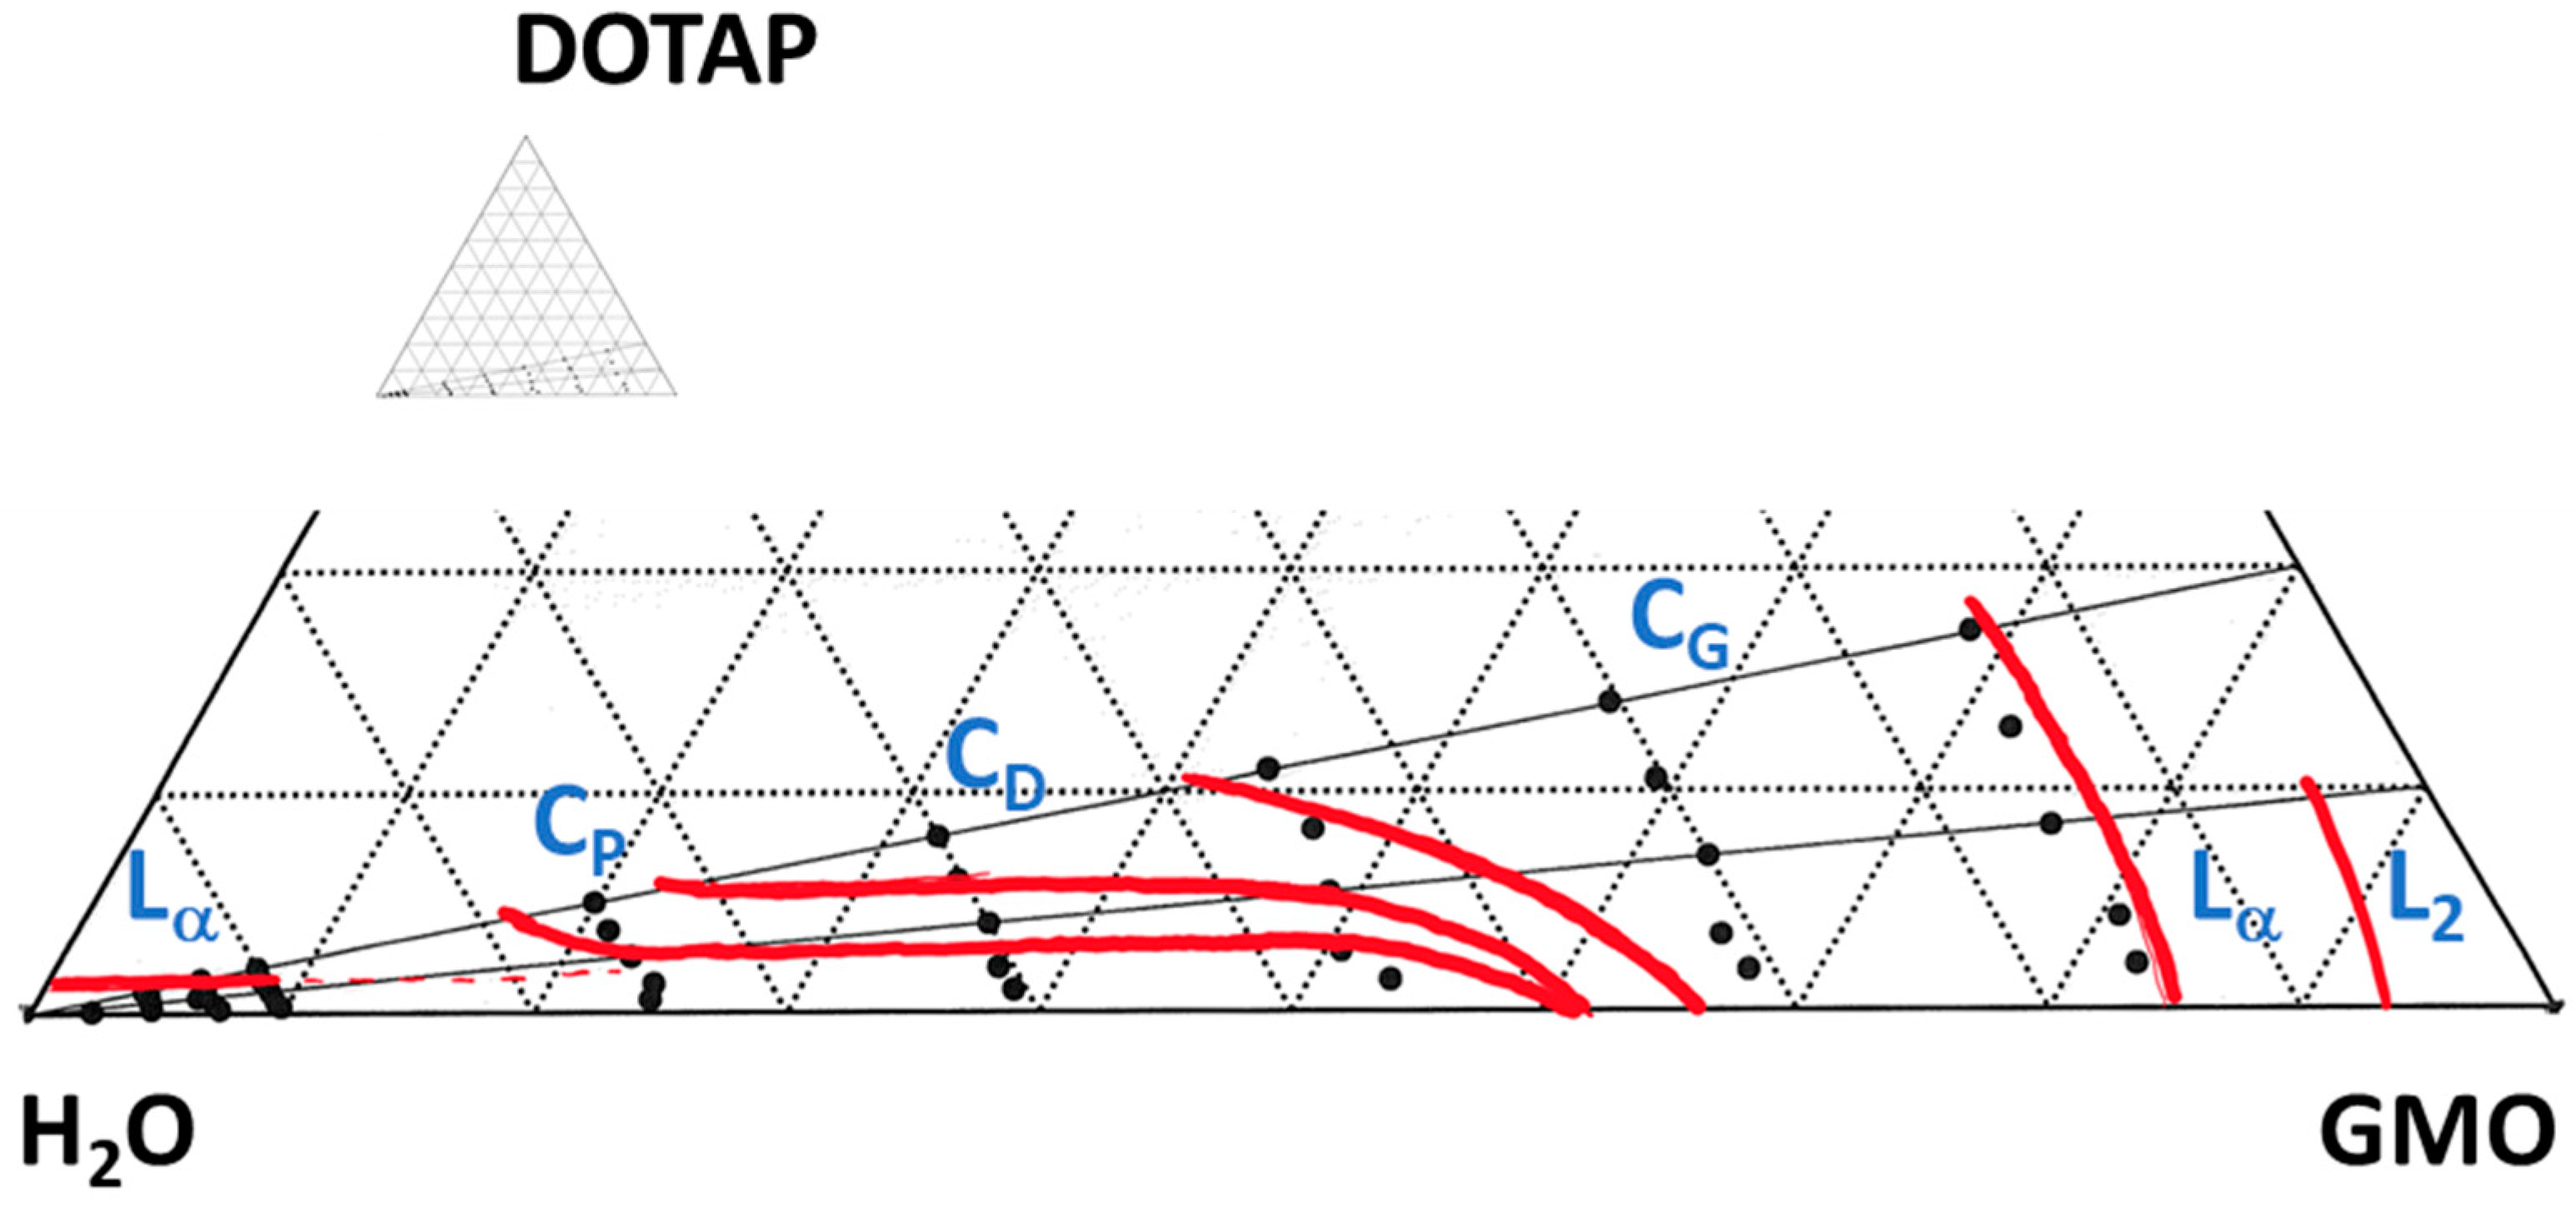
3.1. The Matrix
3.2. Matrix Interactions with Skin
3.3. Sampling for Analysis
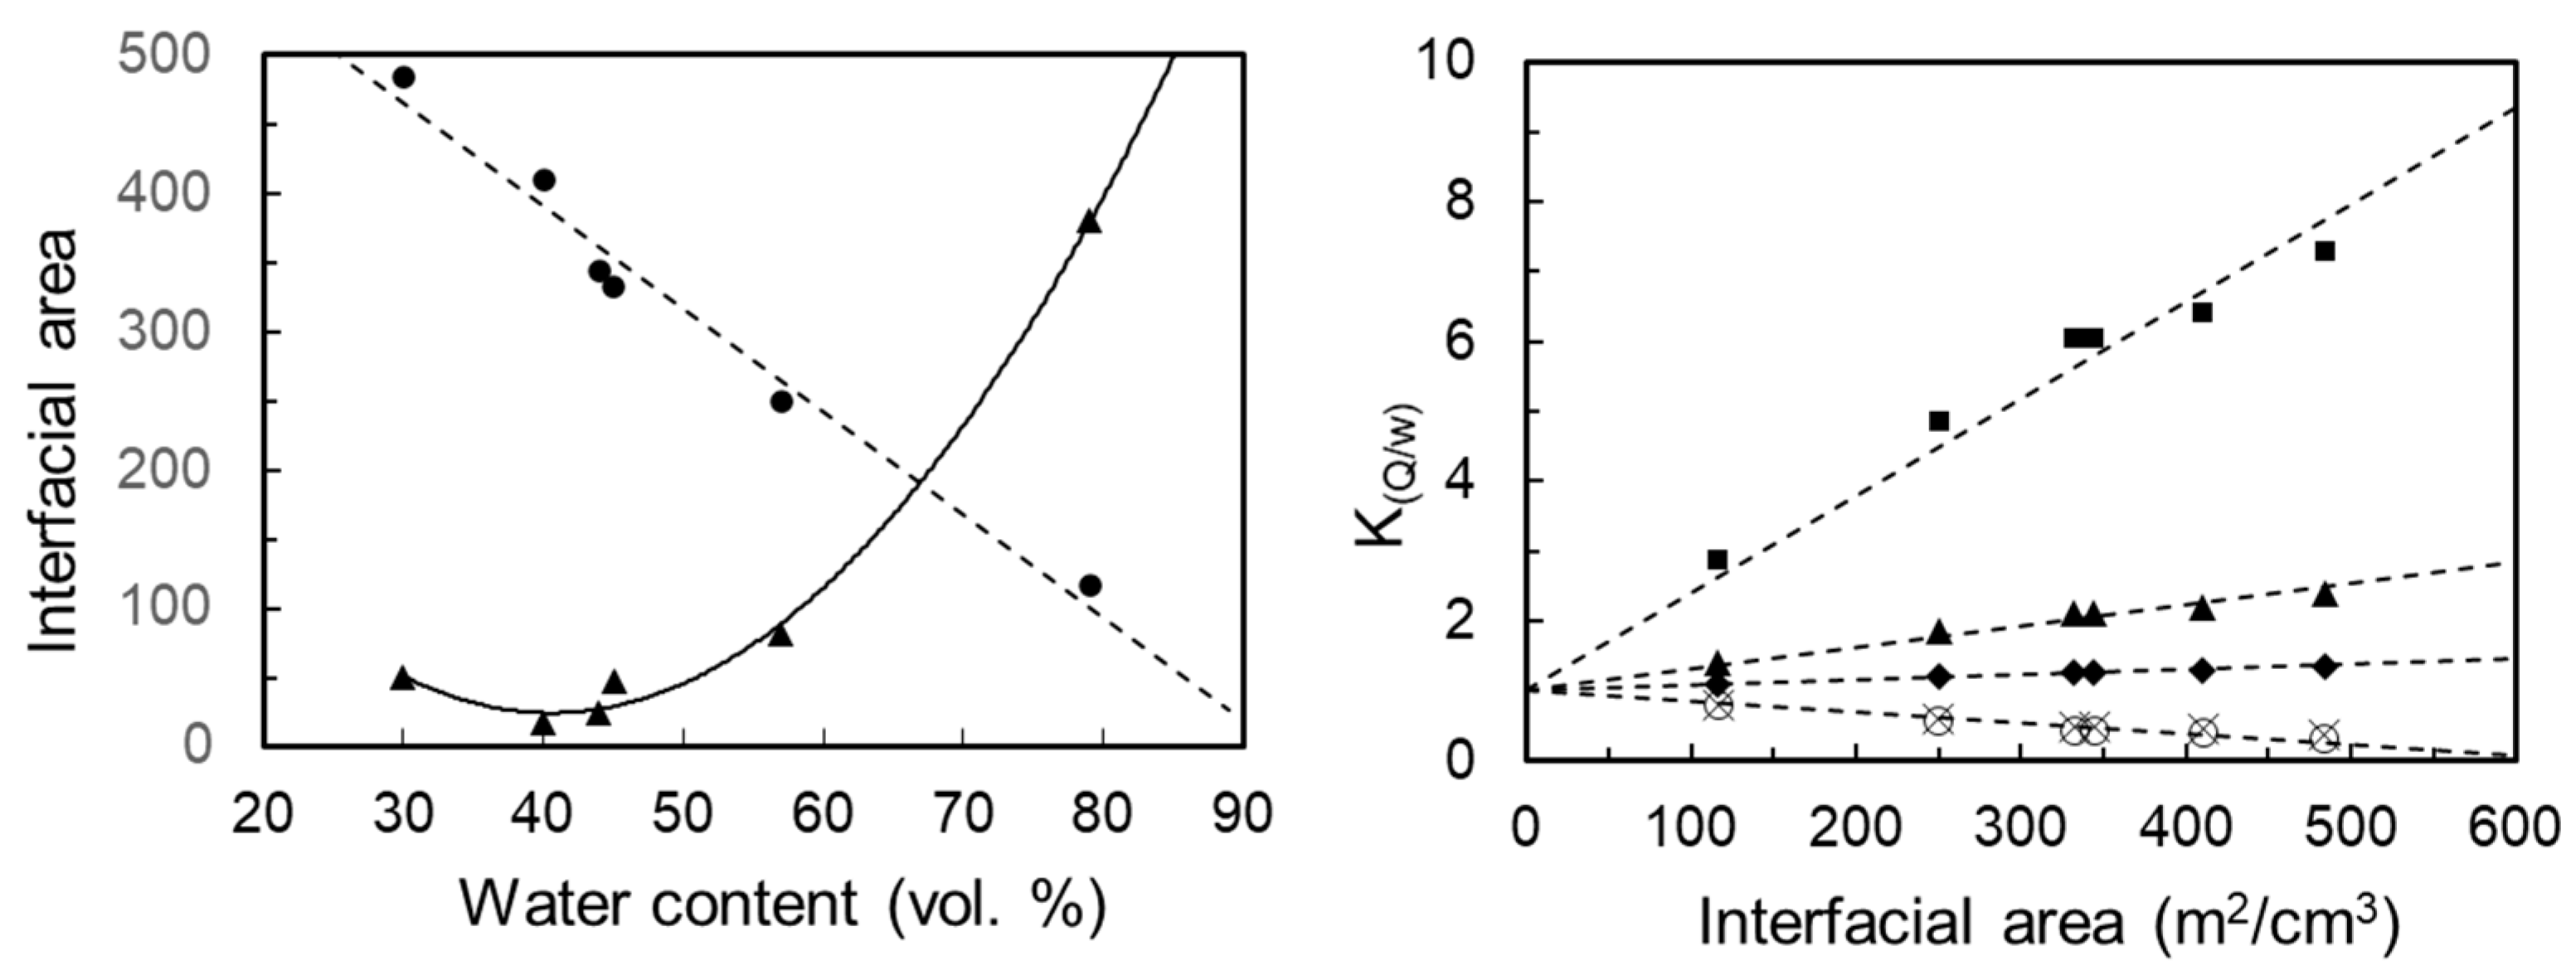
3.4. Matrix Optimization
4. Conclusions
5. Patents
Supplementary Materials
Author Contributions
Funding
Institutional Review Board Statement
Informed Consent Statement
Data Availability Statement
Acknowledgments
Conflicts of Interest
References
- Lui, H.; Zhao, J.; McLean, D.; Zeng, H. Real-time Raman Spectroscopy for In Vivo Skin Cancer Diagnosis. Cancer Res. 2012, 72, 2491–2500. [Google Scholar] [CrossRef] [PubMed] [Green Version]
- Kittler, H.; Pehamberger, H.; Wolff, K.; Binder, M. Accuracy of the clinical diagnosis for melanoma with and without dermoscopy. J. Investig. Dermatol. 2002, 119, 238. [Google Scholar]
- Grin, C.M.; Kopf, A.W.; Welkovich, B.; Bart, R.S.; Levenstein, M.J. Accuracy in the Clinical-Diagnosis of Malignant-Melanoma. Arch. Dermatol. 1990, 126, 763–766. [Google Scholar] [CrossRef]
- Carrera, C.; Segura, S.; Aguilera, P.; Takigami, C.M.; Gomes, A.; Barreiro, A.; Scalvenzi, M.; Longo, C.; Cavicchini, S.; Thomas, L.; et al. Dermoscopy Improves the Diagnostic Accuracy of Melanomas Clinically Resembling Seborrheic Keratosis: Cross-Sectional Study of the Ability to Detect Seborrheic Keratosis-Like Melanomas by a Group of Dermatologists with Varying Degrees of Experience. Dermatology 2017, 233, 471–479. [Google Scholar] [CrossRef] [PubMed]
- Morton, C.A.; Mackie, R.M. Clinical accuracy of the diagnosis of cutaneous malignant melanoma. Br. J. Dermatol. 1998, 138, 283–287. [Google Scholar] [CrossRef]
- Diepgen, T.L.; Mahler, V. The epidemiology of skin cancer. Br. J. Dermatol. 2002, 146 (Suppl. 61), 1–6. [Google Scholar] [CrossRef] [PubMed]
- Maru, G.B.; Gandhi, K.; Ramchandani, A.; Kumar, G. The Role of Inflammation in Skin Cancer. In Inflammation and Cancer; Aggarwal, B.B., Sung, B., Gupta, S.C., Eds.; Springer: Basel, Switzerland, 2014; pp. 437–469. [Google Scholar]
- Hussain, S.P.; Harris, C.C. Inflammation and cancer: An ancient link with novel potentials. Int. J. Cancer 2007, 121, 2373–2380. [Google Scholar] [CrossRef] [PubMed]
- Mantovani, A.; Allavena, P.; Sica, A.; Balkwill, F. Cancer-related inflammation. Nature 2008, 454, 436–444. [Google Scholar] [CrossRef] [PubMed]
- Sumimoto, H.; Imabayashi, F.; Iwata, T.; Kawakami, Y. The BRAF-MAPK signaling pathway is essential for cancer-immune evasion in human melanoma cells. J. Exp. Med. 2006, 203, 1651–1656. [Google Scholar] [CrossRef]
- Bos, J.D.; Meinardi, M.M. The 500 Dalton rule for the skin penetration of chemical compounds and drugs. Exp. Dermatol. Viewp. 2000, 9, 165–169. [Google Scholar] [CrossRef]
- Scheuplein, R.J.; Blank, I.H. Permeability of the skin. Physiol. Rev. 1971, 51, 702–747. [Google Scholar] [CrossRef] [PubMed]
- Mbongue, J.C.; Nicholas, D.A.; Torrez, T.W.; Kim, N.S.; Firek, A.F.; Langridge, W.H. The Role of Indoleamine 2, 3-Dioxygenase in Immune Suppression and Autoimmunity. Vaccines 2015, 3, 703–729. [Google Scholar] [CrossRef] [PubMed] [Green Version]
- Wirthgen, E.; Hoeflich, A. Endotoxin-Induced Tryptophan Degradation along the Kynurenine Pathway: The Role of Indolamine 2,3-Dioxygenase and Aryl Hydrocarbon Receptor-Mediated Immunosuppressive Effects in Endotoxin Tolerance and Cancer and Its Implications for Immunoparalysis. J. Amino Acids 2015, 2015, 973548. [Google Scholar] [CrossRef] [PubMed] [Green Version]
- Liu, M.; Wang, X.; Wang, L.; Ma, X.; Gong, Z.; Zhang, S.; Li, Y. Targeting the IDO1 pathway in cancer: From bench to bedside. J. Hematol. Oncol. 2018, 11, 100. [Google Scholar] [CrossRef] [PubMed] [Green Version]
- Suzuki, Y.; Suda, T.; Furuhashi, K.; Suzuki, M.; Fujie, M.; Hahimoto, D.; Nakamura, Y.; Inui, N.; Nakamura, H.; Chida, K. Increased serum kynurenine/tryptophan ratio correlates with disease progression in lung cancer. Lung Cancer 2010, 67, 361–365. [Google Scholar] [CrossRef] [PubMed]
- Li, H.; Bullock, K.; Gurjao, C.; Braun, D.; Shukla, S.A.; Bosse, D.; Lalani, A.A.; Gopal, S.; Jin, C.; Horak, C.; et al. Metabolomic adaptations and correlates of survival to immune checkpoint blockade. Nat. Commun. 2019, 10, 4346. [Google Scholar] [CrossRef] [PubMed] [Green Version]
- Uyttenhove, C.; Pilotte, L.; Théate, I.; Stroobant, V.; Colau, D.; Parmentier, N.; Boon, T.; Van den Eynde, B.J. Evidence for a tumoral immune resistance mechanism based on tryptophan degradation by indoleamine 2, 3-dioxygenase. Nat. Med. 2003, 9, 1269–1274. [Google Scholar] [CrossRef]
- Bosnyak, E.; Kamson, D.O.; Guastella, A.R.; Varadarajan, K.; Robinette, N.L.; Kupsky, W.J.; Muzik, O.; Michelhaugh, S.K.; Mittal, S.; Juhasz, C. Molecular imaging correlates of tryptophan metabolism via the kynurenine pathway in human meningiomas. Neuro-Oncology 2015, 17, 1284–1292. [Google Scholar] [CrossRef] [Green Version]
- Björklund, S.; Engblom, J.; Thuresson, K.; Sparr, E. A water gradient can be used to regulate drug transport across skin. J. Control. Release 2010, 143, 191–200. [Google Scholar] [CrossRef]
- Zhai, H.; Maibach, H.I. Occlusion vs. skin barrier function. Ski. Res. Technol. 2002, 8, 1–6. [Google Scholar] [CrossRef]
- Larsson, K. Cubic Lipid-Water Phases—Structures and Biomembrane Aspects. J. Phys. Chem. 1989, 93, 7304–7314. [Google Scholar] [CrossRef]
- Hyde, S.T.; Andersson, S.; Ericsson, B.; Larsson, K. A Cubic Structure Consisting of a Lipid Bilayer Forming an Infinite Periodic Minimum Surface of the Gyroid Type in the Glycerolmonooleate-Water System. Z. Krist. 1984, 168, 213–219. [Google Scholar] [CrossRef]
- Geraghty, P.B.; Attwood, D.; Collett, J.H.; Dandiker, Y. The in vitro release of some antimuscarinic drugs from monoolein/water lyotropic liquid crystalline gels. Pharm. Res. 1996, 13, 1265–1271. [Google Scholar] [CrossRef]
- Rummel, G.; Hardmeyer, A.; Widmer, C.; Chiu, M.L.; Nollert, P.; Locher, K.P.; Pedruzzi, I.I.; Landau, E.M.; Rosenbusch, J.P. Lipidic Cubic Phases: New Matrices for the Three-Dimensional Crystallization of Membrane Proteins. J. Struct. Biol. 1998, 121, 82–91. [Google Scholar] [CrossRef] [PubMed]
- Angelov, B.; Angelova, A.; Mutafchieva, R.; Lesieur, S.; Vainio, U.; Garamus, V.M.; Jensen, G.V.; Pedersen, J.S. SAXS investigation of a cubic to a sponge (L3) phase transition in self-assembled lipid nanocarriers. Phys. Chem. Chem. Phys. 2011, 13, 3073–3081. [Google Scholar] [CrossRef] [PubMed] [Green Version]
- Rizwan, S.B.; Boyd, B.J.; Rades, T.; Hook, S. Bicontinuous cubic liquid crystals as sustained delivery systems for peptides and proteins. Expert Opin. Drug Deliv. 2010, 7, 1133–1144. [Google Scholar] [CrossRef]
- Barauskas, J.; Landh, T. Phase behavior of the phytantriol/water system. Langmuir 2003, 19, 9562–9565. [Google Scholar] [CrossRef]
- Barauskas, J.; Cervin, C.; Jankunec, M.; Spandyreva, M.; Ribokaite, K.; Tiberg, F.; Johnsson, M. Interactions of lipid-based liquid crystalline nanoparticles with model and cell membranes. Int. J. Pharm. 2010, 391, 284–291. [Google Scholar] [CrossRef]
- Nguyen, T.-H.; Hanley, T.; Porter, C.J.H.; Larson, I.; Boyd, B.J. Phytantriol and glyceryl monooleate cubic liquid crystalline phases as sustained-release oral drug delivery systems for poorly water soluble drugs I. Phase behaviour in physiologically-relevant media. J. Pharm. Pharmacol. 2010, 62, 844–855. [Google Scholar] [CrossRef]
- Engblom, J.; Miezis, Y.; Nylander, T.; Razumas, V.; Larsson, K. On the swelling of monoolein liquid-crystalline aqueous phases in the presence of distearoylphosphatidylglycerol. In Surface and Colloid Science; Springer: Berlin/Heidelberg, Germany, 2001; pp. 9–15. [Google Scholar]
- Tyler, A.I.; Barriga, H.M.; Parsons, E.S.; McCarthy, N.L.; Ces, O.; Law, R.V.; Seddon, J.M.; Brooks, N.J. Electrostatic swelling of bicontinuous cubic lipid phases. Soft Matter 2015, 11, 3279–3286. [Google Scholar] [CrossRef] [Green Version]
- Shah, J.C.; Sadhale, Y.; Chilukuri, D.M. Cubic phase gels as drug delivery systems. Adv. Drug Deliv. Rev. 2001, 47, 229–250. [Google Scholar] [PubMed]
- Rapalli, V.K.; Waghule, T.; Hans, N.; Mahmood, A.; Gorantla, S.; Dubey, S.K.; Singhvi, G. Insights of lyotropic liquid crystals in topical drug delivery for targeting various skin disorders. J. Mol. Liq. 2020, 315, 113771. [Google Scholar] [CrossRef]
- Silvestrini, A.V.P.; Caron, A.L.; Viegas, J.; Praça, F.G.; Bentley, M.V.L.B. Advances in lyotropic liquid crystal systems for skin drug delivery. Expert. Opin. Drug Deliv. 2020, 17, 1781–1805. [Google Scholar] [CrossRef]
- Clogston, J.; Caffrey, M. Controlling release from the lipidic cubic phase. Amino acids, peptides, proteins and nucleic acids. J. Control. Release 2005, 107, 97–111. [Google Scholar] [CrossRef]
- Chemelli, A.; Conde-Valentin, B.; Uhlig, F.; Glatter, O. Amino Acid Induced Modification of Self-Assembled Monoglyceride-Based Nanostructures. Langmuir 2015, 31, 10377–10381. [Google Scholar] [CrossRef] [PubMed]
- Björklund, S.; Kocherbitov, V. Humidity scanning quartz crystal microbalance with dissipation monitoring setup for determination of sorption-desorption isotherms and rheological changes. Rev. Sci. Instrum. 2015, 86, 055105. [Google Scholar] [CrossRef] [Green Version]
- Sauerbrey, G. Verwendung von Schwingquarzen zur Wägung dünner Schichten und zur Mikrowägung. Z. Phys. 1959, 155, 206–222. [Google Scholar] [CrossRef]
- Rodahl, M.; Hook, F.; Krozer, A.; Brzezinski, P.; Kasemo, B. Quartz-Crystal Microbalance Setup for Frequency and Q-Factor Measurements in Gaseous and Liquid Environments. Rev. Sci. Instrum. 1995, 66, 3924–3930. [Google Scholar] [CrossRef] [Green Version]
- Björklund, S.; Kocherbitov, V. Hydration-Induced Phase Transitions in Surfactant and Lipid Films. Langmuir 2016, 32, 5223–5232. [Google Scholar] [CrossRef] [PubMed]
- Engblom, J.; Hyde, S. On the swelling of bicontinuous lyotropic mesophases. J. Phys. II 1995, 5, 171–190. [Google Scholar] [CrossRef] [Green Version]
- Smart, L.E.; Moore, E.A. Solid State Chemistry: An Introduction, 3rd ed.; CRC Press: Boca Raton, FL, USA, 2005. [Google Scholar]
- Seddon, J.M.; Templer, R.H. Chapter 3—Polymorphism of Lipid-Water Systems. In Handbook of Biological Physics; Lipowsky, R., Sackmann, E., Eds.; Elsevier: Amsterdam, The Netherlands, 1995; Volume 1, pp. 97–160. [Google Scholar]
- Engström, S.; Norden, T.P.; Nyquist, H. Cubic phases for studies of drug partition into lipid bilayers. Eur. J. Pharm. Sci. 1999, 8, 243–254. [Google Scholar] [CrossRef]
- Engström, S.; Engström, L. Phase-Behavior of the Lidocaine-Monoolein-Water System. Int. J. Pharm. 1992, 79, 113–122. [Google Scholar] [CrossRef]
- Kulkarni, C.V.; Wachter, W.; Iglesias-Salto, G.; Engelskirchen, S.; Ahualli, S. Monoolein: A magic lipid? Phys. Chem. Chem. Phys. 2011, 13, 3004–3021. [Google Scholar] [CrossRef] [PubMed]
- Jankovskaja, S.; Engblom, J.; Rezeli, M.; Marko-Varga, G.; Ruzgas, T.; Björklund, S. Non-invasive skin sampling of tryptophan/kynurenine ratio in vitro towards a skin cancer biomarker. Sci. Rep. 2021, 11, 678. [Google Scholar] [CrossRef] [PubMed]
- Larsson, K. 2 Cubic Phases in Monoolein Water-System. Nature 1983, 304, 664. [Google Scholar] [CrossRef]
- Briggs, J.; Chung, H.; Caffrey, M. The temperature-composition phase diagram and mesophase structure characterization of the monoolein/water system. J. Phys. II 1996, 6, 723–751. [Google Scholar] [CrossRef] [Green Version]
- Qiu, H.; Caffrey, M. The phase diagram of the monoolein/water system: Metastability and equilibrium aspects. Biomaterials 2000, 21, 223–234. [Google Scholar] [CrossRef]
- Hauser, H. Some Aspects of the Phase-Behavior of Charged Lipids. Biochim. Biophys. Acta 1984, 772, 37–50. [Google Scholar] [CrossRef]
- Zhai, H.; Maibach, H. Effects of skin occlusion on percutaneous absorption: An overview. Ski. Pharmacol. Appl. 2001, 14, 1–10. [Google Scholar]
- Morin, M.; Jankovskaja, S.; Ruzgas, T.; Henricson, J.; Anderson, C.D.; Brinte, A.; Engblom, J.; Björklund, S. Hydrogels and Cubic Liquid Crystals for Non-Invasive Sampling of Low-Molecular-Weight Biomarkers—An Explorative In Vivo Study. Pharmaceutics 2022, 14, 313. [Google Scholar] [CrossRef]
- Silva, C.L.; Topgaard, D.; Kocherbitov, V.; Sousa, J.J.; Pais, A.A.; Sparr, E. Stratum corneum hydration: Phase transformations and mobility in stratum corneum, extracted lipids and isolated corneocytes. Biochim. Biophys. Acta 2007, 1768, 2647–2659. [Google Scholar] [CrossRef] [PubMed] [Green Version]
- Egawa, M.; Hirao, T.; Takahashi, M. In vivo estimation of stratum corneum thickness from water concentration profiles obtained with Raman spectroscopy. Acta Derm. Venereol. 2007, 87, 4–8. [Google Scholar] [CrossRef] [PubMed] [Green Version]
- Engblom, J.; Björklund, S.; Morin, M.; Jankovskaya, S.; Ruzgas, T. Lipid Patch. WO2023066990A2, 27 April 2023. [Google Scholar]


| φlipid | a | a/l | r | <R> | AUC | Lw | Φlipid | Symmetry |
|---|---|---|---|---|---|---|---|---|
| (% w/w) | (Å) | (Å) | (Å) | (Å2) | (Å) | (% v/v) | ||
| 70.2 | 126.9 | 7.5 | 14.5 | 31.5 | 49,671 | 252 | 73.2 | Ia3d |
| 64.0 | 93.5 | 5.5 | 19.5 | 36.5 | 16,766 | 73 | 64.8 | Pn3m |
| 84.3 | 99.9 | 5.9 | 7.8 | 24.8 | 30,872 | 198 | 87.6 | Ia3d |
| 70.0 | 134.1 | 7.9 | 16.2 | 33.2 | 55,555 | 266 | 70.0 | Ia3d |
| 54.2 | 111.4 | 6.6 | 26.5 | 43.5 | 23,803 | 87 | 55.6 | Pn3m |
| 54.2 | 141.3 | 8.3 | 26.2 | 43.2 | 46,843 | 173 | 56.0 | Im3m |
| 40.0 | 186.6 | 11.0 | 40.1 | 57.0 | 81,650 | 228 | 43.4 | Im3m |
| 25.1 | 289.3 | 17.0 | 71.5 | 88.4 | 196,196 | 353 | 28.5 | Im3m |
| 10.0 | 301.2 | 17.7 | 75.2 | 92.0 | 212,760 | 368 | 27.4 | Im3m |
| 10.0 | 406.4 | 23.9 | Lα | |||||
| 7.0 | 402.8 | 23.7 | 106.3 | 123.0 | 380,471 | 492 | 20.6 | Im3m |
| 7.0 | 534.7 | 31.5 | Lα | |||||
| 5.0 | 708.8 | 41.7 | Lα |
Disclaimer/Publisher’s Note: The statements, opinions and data contained in all publications are solely those of the individual author(s) and contributor(s) and not of MDPI and/or the editor(s). MDPI and/or the editor(s) disclaim responsibility for any injury to people or property resulting from any ideas, methods, instructions or products referred to in the content. |
© 2023 by the authors. Licensee MDPI, Basel, Switzerland. This article is an open access article distributed under the terms and conditions of the Creative Commons Attribution (CC BY) license (https://creativecommons.org/licenses/by/4.0/).
Share and Cite
Morin, M.; Björklund, S.; Nilsson, E.J.; Engblom, J. Bicontinuous Cubic Liquid Crystals as Potential Matrices for Non-Invasive Topical Sampling of Low-Molecular-Weight Biomarkers. Pharmaceutics 2023, 15, 2031. https://doi.org/10.3390/pharmaceutics15082031
Morin M, Björklund S, Nilsson EJ, Engblom J. Bicontinuous Cubic Liquid Crystals as Potential Matrices for Non-Invasive Topical Sampling of Low-Molecular-Weight Biomarkers. Pharmaceutics. 2023; 15(8):2031. https://doi.org/10.3390/pharmaceutics15082031
Chicago/Turabian StyleMorin, Maxim, Sebastian Björklund, Emelie J. Nilsson, and Johan Engblom. 2023. "Bicontinuous Cubic Liquid Crystals as Potential Matrices for Non-Invasive Topical Sampling of Low-Molecular-Weight Biomarkers" Pharmaceutics 15, no. 8: 2031. https://doi.org/10.3390/pharmaceutics15082031