

Influence of Desialylation on the Drug Binding Affinity of Human Alpha-1-Acid Glycoprotein Assessed by Microscale Thermophoresis

 , ,
, ,  and
and
Abstract
1. Introduction
2. Materials and Methods
2.1. Materials
2.2. Enzymatic Desialylation of Native Human AAG
2.3. UV–VIS Characterization of Native and Desialylated AAG
2.4. AAG Labeling Procedure
2.5. Microscale Thermophoresis Binding Assay
2.6. Thermal Shift Assay
2.7. Statistical Analysis
3. Results and Discussion
3.1. Enzymatic Desialylation and Glycan Analysis of Native and Desialylated Human AAG

| Native AAG IS = 270 | |||
|---|---|---|---|
| Peak No. | Content/% | N-glycan Composition * | Schematic N-glycan Structure ** |
| 1 | 0.23 | A2G2 |  |
| 2 | 2.23 | A2G2S1 |  |
| 3 | 1.71 | A3G3S1 |  |
| 4 | 0.45 | A2G2S2 |  |
| 5 | 6.79 | A2G2S2 |  |
| A3G3S1 |  | ||
| 6 | 10.08 | A3G3S2 |  |
| 7 | 7.68 | A3G3S2 |  |
| 8 | 4.35 | A3F1G3S2 |  |
| 9 | 5.09 | A3G3S3 |  |
| 10 | 21.84 | A3G3S3 |  |
| 11 | 5.33 | A3G3S3 |  |
| 12 | 11.47 | A3F1G3S3 |  |
| 13 | 4.44 | A4G4S3 | 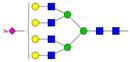 |
| 14 | 4.17 | A4G4S4 |  |
| 15 | 7.71 | A4G4S4 |  |
| AFG4S3Lac |  | ||
| 16 | 6.41 | AFG4S3Lac |  |
| A4F1G4S4 | 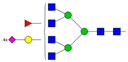 | ||
| Desialylated AAG IS = 5 | |||
| Peak No. | Content/% | N-glycan Composition * | Schematic N-glycan Structure ** |
| 1 | 6.48 | A2G2 |  |
| 2 | 43.03 | A3G3 |  |
| 3 | 15.41 | A3F1G3 |  |
| 4 | 0.88 | A3G3S1 |  |
| 5 | 20.46 | A4G4 |  |
| 6 | 1.67 | A3F1G3S1 | 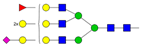 |
| 7 | 6.89 | A4F1G4 | 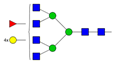 |
| 8 | 5.18 | A4G4S1 |  |
| A4G4Lac |  | ||
3.2. Molar Absorption Coefficient of Native and Desialylated AAG
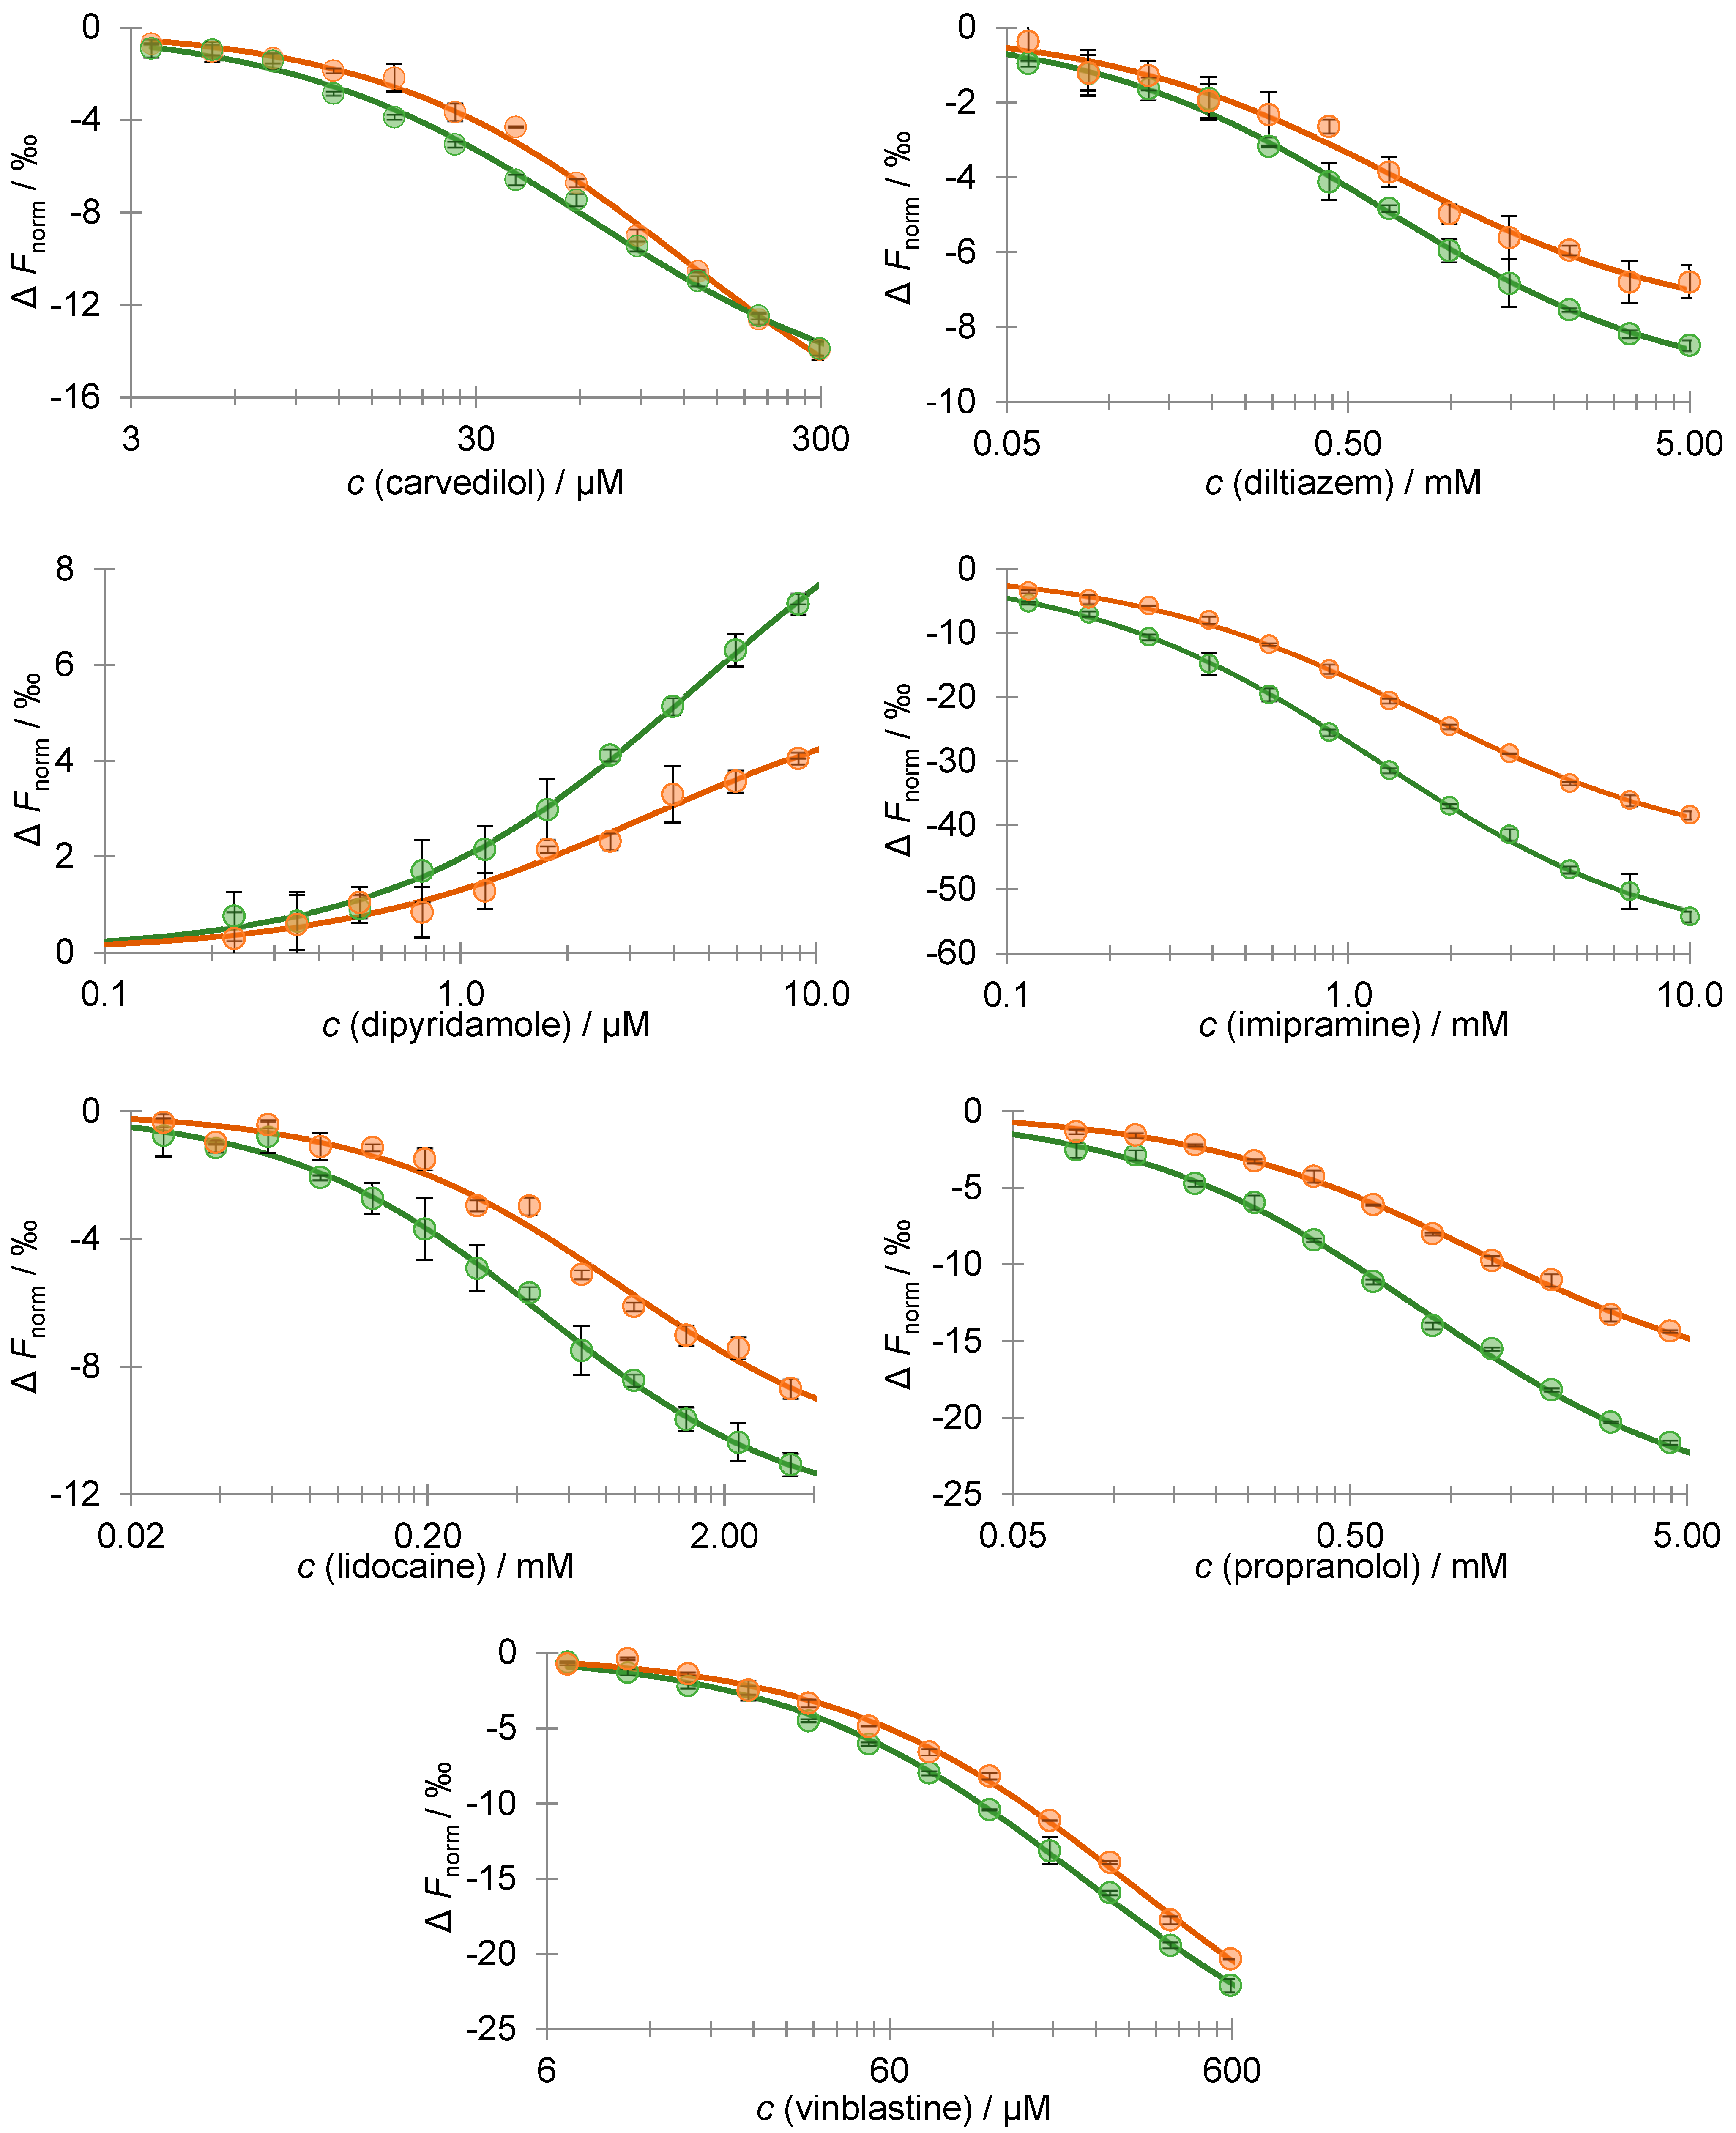
3.3. Desialylation Effect on AAG–Drug Binding Affinity Using MST
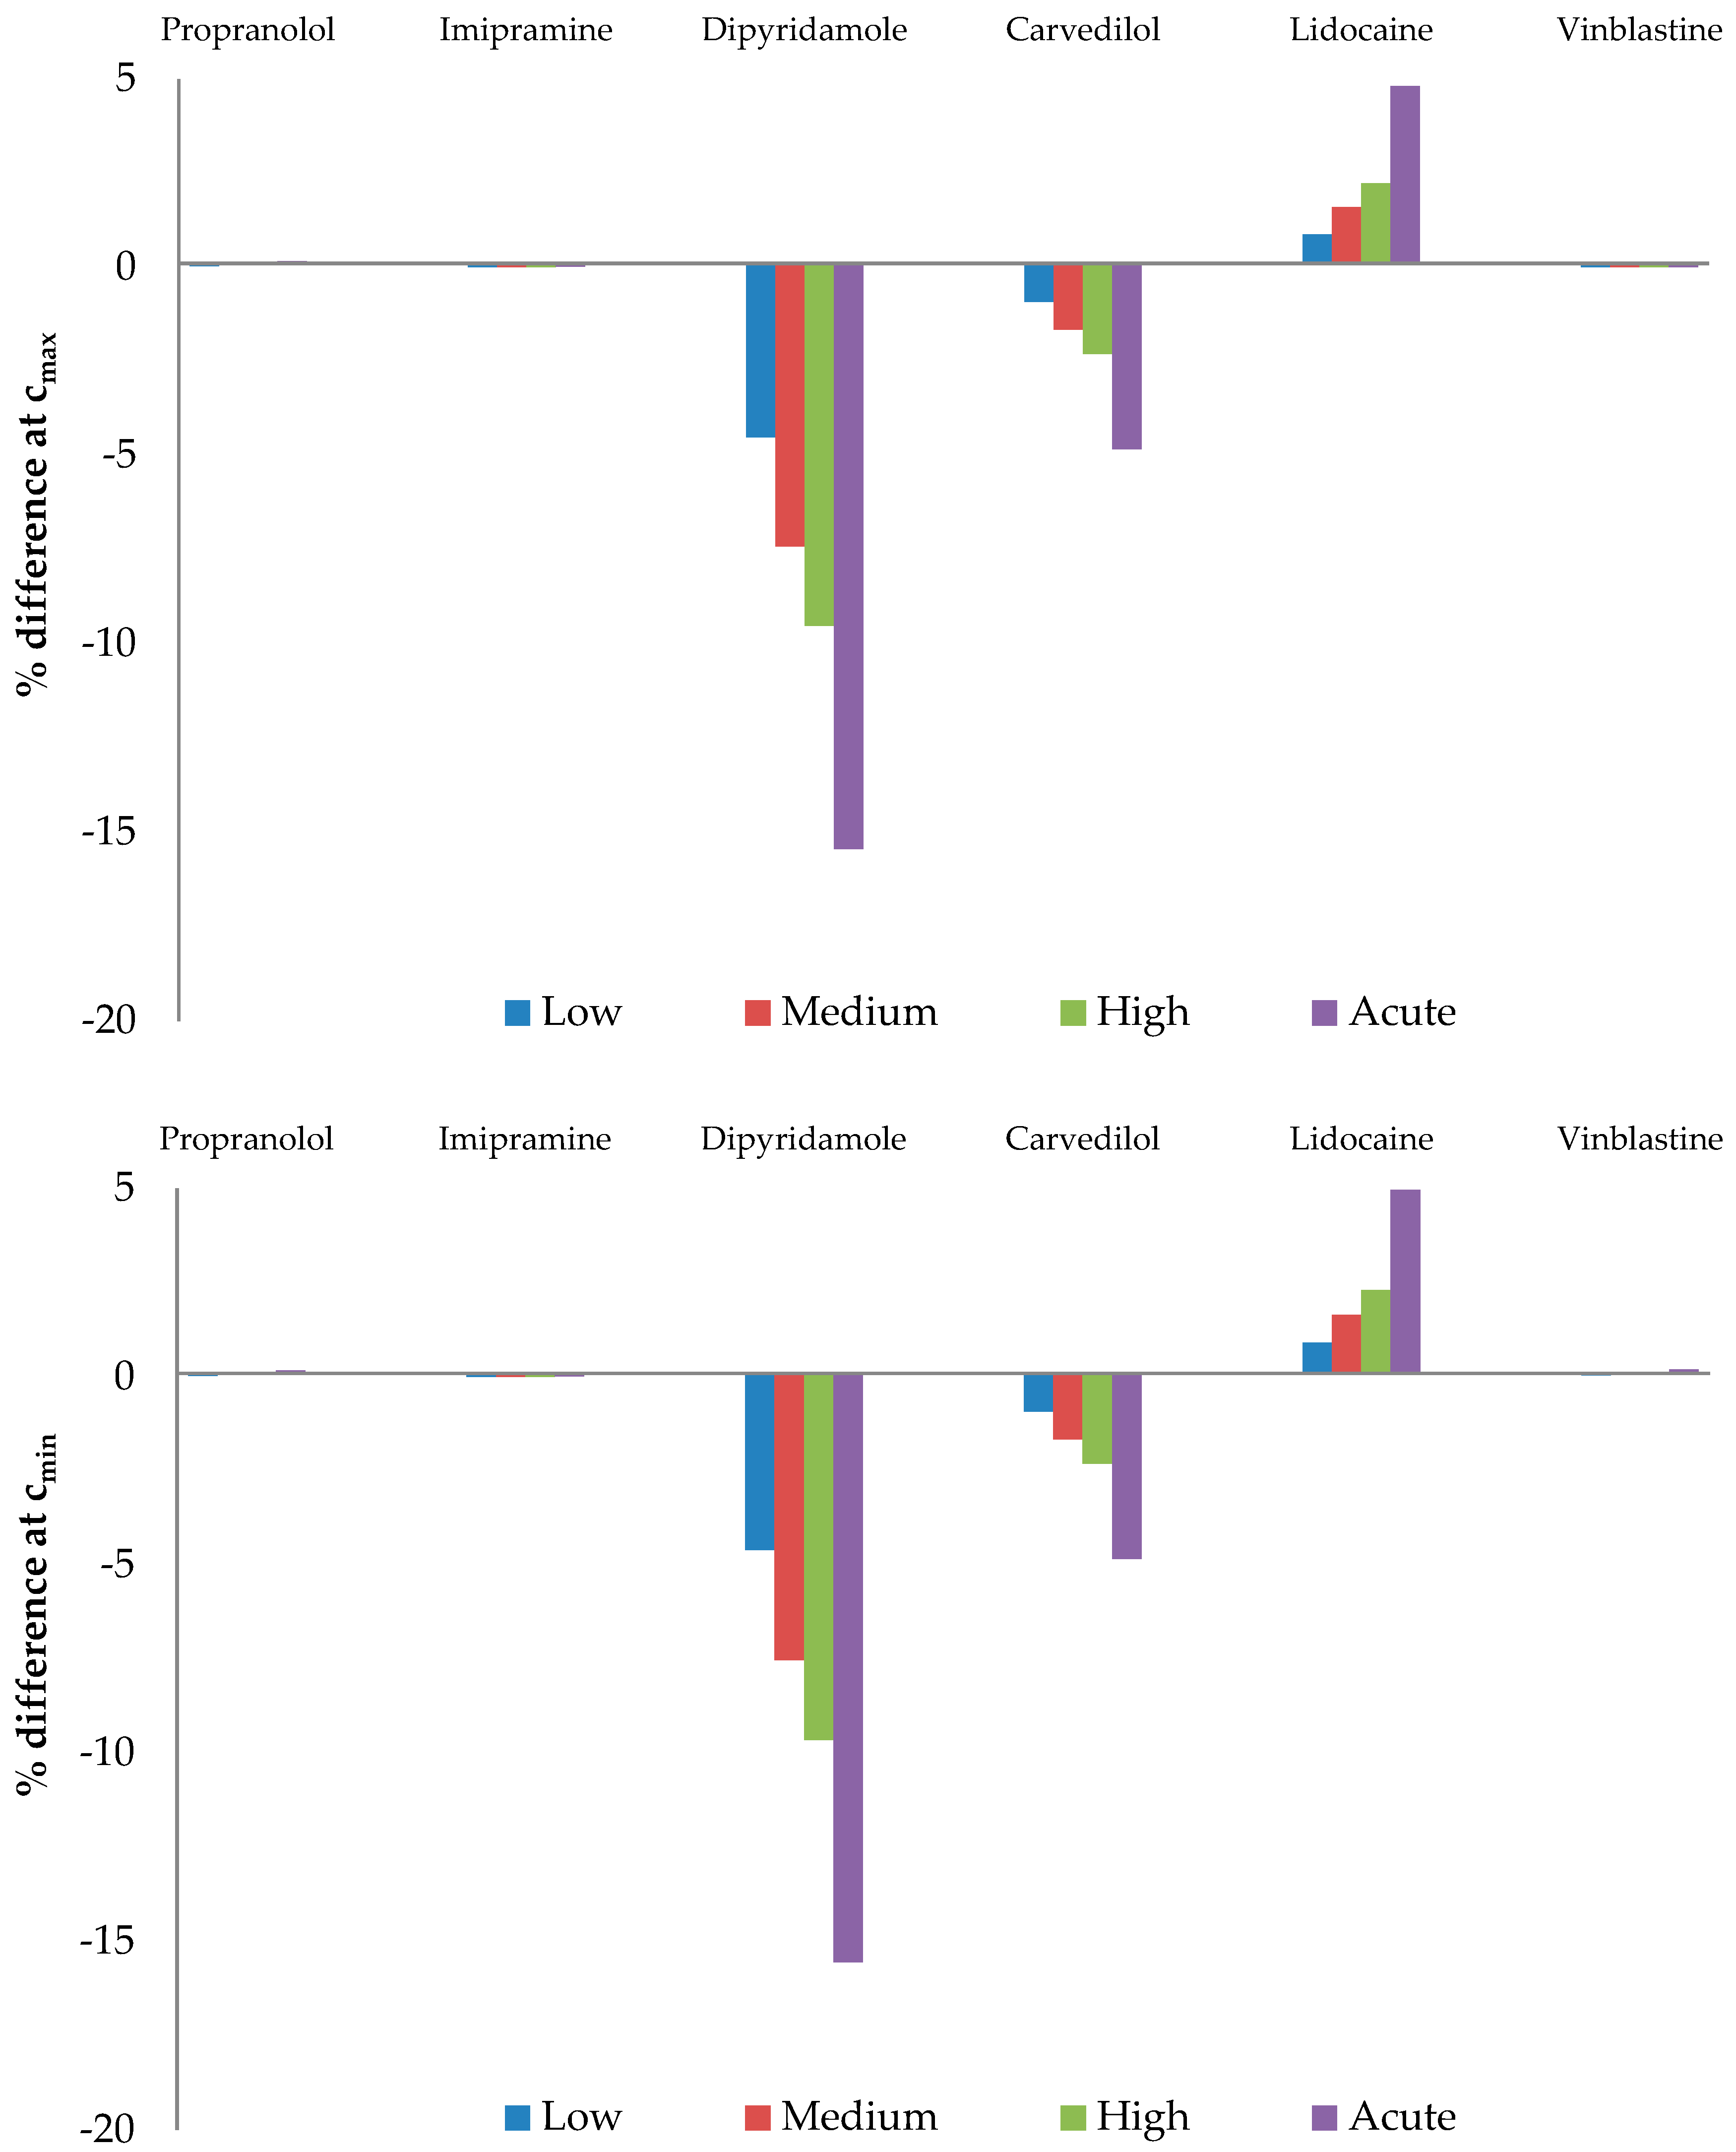
3.4. Effect of AAG Desialylation on the Free Drug Fraction
4. Conclusions
Author Contributions
Funding
Institutional Review Board Statement
Informed Consent Statement
Data Availability Statement
Acknowledgments
Conflicts of Interest
References
- Otagiri, M. A Molecular Functional Study on the Interactions of Drugs with Plasma Proteins. Drug Metab. Pharm. 2005, 20, 309–323. [Google Scholar] [CrossRef]
- Kragh-Hansen, U. Molecular Aspects of Ligand Binding to Serum Albumin. Pharmacol. Rev. 1981, 33, 17–53. [Google Scholar]
- Mehvar, R. Role of Protein Binding in Pharmacokinetics. Am. J. Pharm. Educ. 2005, 69, 1526. [Google Scholar] [CrossRef]
- Putnam, F.W. Alpha, Beta, Gamma, Omega—The Structure of the Plasma Proteins. In The Plasma Proteins, 2nd ed.; Putnam, F.W., Ed.; Academic Press: Orlando, FL, USA, 1984; Volume 4, pp. 57–131. [Google Scholar] [CrossRef]
- Fournier, T.; Medjoubi-N, N.; Porquet, D. Alpha-1-Acid Glycoprotein. Biochim. Biophys. Acta. 2000, 1482, 157–171. [Google Scholar] [CrossRef]
- Schmid, K.; Nimberg, R.B.; Kimura, A.; Yamaguchi, H.; Binette, J.P. The Carbohydrate Units of Human Plasma α1-Acid Glycoprotein. Biochim. Biophys. Acta. 1977, 492, 291–302. [Google Scholar] [CrossRef]
- Kremer, J.M.; Wilting, J.; Janssen, L.H. Drug Binding to Human Alpha-1-Acid Glycoprotein in Health and Disease. Pharmacol. Rev. 1988, 40, 1–47. [Google Scholar] [PubMed]
- Blain, P.; Mucklow, J.; Rawlins, M.; Roberts, D.; Routledge, P.; Shand, D. Determinants of Plasma Alpha 1-Acid Glycoprotein (AAG) Concentrations in Health. Br. J. Clin. Pharmacol. 1985, 20, 500–502. [Google Scholar] [CrossRef] [PubMed]
- Huang, Z.; Ung, T. Effect of Alpha-1-Acid Glycoprotein Binding on Pharmacokinetics and Pharmacodynamics. Curr. Drug Metab. 2013, 14, 226–238. [Google Scholar] [CrossRef] [PubMed]
- Israili, Z.H.; Dayton, P.G. Human Alpha-1-Glycoprotein and its Interactions with Drugs. Drug Metab. Rev. 2001, 33, 161–235. [Google Scholar] [CrossRef] [PubMed]
- Luo, Z.; Lei, H.; Sun, Y.; Liu, X.; Su, D.F. Orosomucoid, an Acute Response Protein with Multiple Modulating Activities. J. Physiol. Biochem. 2015, 71, 329–340. [Google Scholar] [CrossRef] [PubMed]
- Lögdberg, L.; Wester, L. Immunocalins: A Lipocalin Subfamily that Modulates Immune and Inflammatory Responses. Biochim. Biophys. Acta 2000, 1482, 284–297. [Google Scholar] [CrossRef]
- Smith, S.A.; Waters, N.J. Pharmacokinetic and Pharmacodynamic Considerations for Drugs Binding to Alpha-1-Acid Glycoprotein. Pharm. Res. 2019, 36, 30. [Google Scholar] [CrossRef] [PubMed]
- Stanley, P.; Schachter, H.; Taniguchi, N. Chapter 9. N-Glycans. In Essentials of Glycobiology, 2nd ed.; Varki, A., Cummings, R.D., Esko, J.D., Stanley, P., Hart, G.W., Aebi, M., Mohnen, D., Kinoshita, T., Packer, N.H., Prestegard, J.H., et al., Eds.; Cold Spring Harbor Laboratory Press: Cold Spring Harbor, NY, USA, 2009. [Google Scholar] [CrossRef]
- Keser, T.; Tijardović, M.; Gornik, I.; Lukić, E.; Lauc, G.; Gornik, O.; Novokmet, M. High-Throughput and Site-Specific N-Glycosylation Analysis of Human Alpha-1-Acid Glycoprotein Offers a Great Potential for New Biomarker Discovery. Mol. Cell. Proteom. 2021, 20, 100044. [Google Scholar] [CrossRef] [PubMed]
- Yoshima, H.; Matsumoto, A.; Mizuochi, T.; Kawasaki, T.; Kobata, A. Comparative Study of the Carbohydrate Moieties of Rat and Human Plasma Alpha 1-Acid Glycoproteins. J. Biol. Chem. 1981, 256, 8476–8484. [Google Scholar] [CrossRef] [PubMed]
- Schmid, K. Human Plasma Alpha 1-Acid Glycoprotein–Biochemical Properties, the Amino Acid Sequence and the Structure of the Carbohydrate Moiety, Variants and Polymorphism. Prog. Clin. Biol. Res. 1989, 300, 7–22. [Google Scholar] [PubMed]
- Bteich, M. An Overview of Albumin and Alpha-1-Acid Glycoprotein Main Characteristics: Highlighting the Roles of Amino Acids in Binding Kinetics and Molecular Interactions. Heliyon 2019, 5, e02879. [Google Scholar] [CrossRef] [PubMed]
- Poland, D.C.W.; Schalkwijk, C.G.; Stehouwer, C.D.A.; Koeleman, C.A.M.; van het Hof, B.; van Dijk, W. Increased Alpha3-Fucosylation of Alpha1-Acid Glycoprotein in Type I Diabetic Patients is Related to Vascular Function. Glycoconj. J. 2001, 18, 261–268. [Google Scholar] [CrossRef]
- van den Heuvel, M.M.; Poland, D.C.W.; de Graaff, C.S.; Hoefsmit, E.C.M.; Postmus, P.E.; Beelen, R.H.J.; van Dijk, W. The Degree of Branching of the Glycans of α1-Acid Glycoprotein in Asthma: A Correlation with Lung Function and Inflammatory Parameters. Am. J. Respir. Crit. Care Med. 2000, 161, 1972–1978. [Google Scholar] [CrossRef]
- Serbource-Goguel Seta, N.; Durand, G.; Corbic, M.; Agneray, J.; Feger, J. Alterations in Relative Proportions of Microheterogenous Forms of Human α1-Acid Glycoprotein in Liver Disease. J. Hepatol. 1986, 2, 245–252. [Google Scholar] [CrossRef]
- Biou, D.; Chanton, P.; Konan, D.; Seta, N.; N’Guyen, H.; Feger, J.; Durand, G. Microheterogeneity of the Carbohydrate Moiety of Human Alpha 1-Acid Glycoprotein in Two Benign Liver Diseases: Alcoholic Cirrhosis and Acute Hepatitis. Clin. Chim. Acta 1989, 186, 59–66. [Google Scholar] [CrossRef] [PubMed]
- Ferens-Sieczkowska, M.; Kratz, E.; Kossowska, B.; Passowicz-Muszyńska, E.; Jankowska, R. Comparison of Haptoglobin and Alpha1-Acid Glycoprotein Glycosylation in the Sera of Small Cell and Non-Small Cell Lung Cancer Patients. Postępy. Hig. Med. Dośw. 2013, 67, 828–836. [Google Scholar] [CrossRef]
- Jezequel, M.; Seta, N.S.; Corbic, M.M.; Feger, J.M.; Durand, G.M. Modifications of Concanavalin A Patterns of α1-Acid Glycoprotein and α2-HS Glycoprotein in Alcoholic Liver Disease. Clin. Chim. Acta 1988, 176, 49–57. [Google Scholar] [CrossRef]
- Biou, D.; Bauvy, C.; N’Guyen, H.; Codogno, P.; Durand, G.; Aubery, M. Alterations of the Glycan Moiety of Human αl-Acid Glycoprotein in Late-Term Pregnancy. Clin. Chim. Acta 1991, 204, 1–12. [Google Scholar] [CrossRef]
- Hanada, K.; Ohta, T.; Hirai, M.; Arai, M.; Ogata, H. Enantioselective Binding of Propranolol, Disopyramide, and Verapamil to Human α1-Acid Glycoprotein. J. Pharm. Sci. 2000, 89, 751–757. [Google Scholar] [CrossRef]
- Primozic, S.; McNamara, P.J. Effect of the Sialylation State of α1-Acid Glycoprotein on Propranolol Binding. J. Pharm. Sci. 1985, 74, 473–475. [Google Scholar] [CrossRef]
- Shiono, H.; Shibukawa, A.; Kuroda, Y.; Nakagawa, T. Effect of Sialic Acid Residues of Human α1-Acid Glycoprotein on Stereoselectivity in Basic Drug-Protein Binding. Chirality 1997, 9, 291–296. [Google Scholar] [CrossRef]
- Wong, A.K.L.; Hsia, J.C. In Vitro Binding of Propranolol and Progesterone to Native and Desialylated Human Orosomucoid. Can. J. Biochem. Cell Biol. 1983, 61, 1114–1116. [Google Scholar] [CrossRef] [PubMed]
- Rahman, M.H.; Miyoshi, T.; Sukimoto, K.; Takadate, A.; Otagiri, M. Interaction Mode of Dicumarol and Its Derivatives with Human Serum Albumin, Alpha 1-Acid Glycoprotein and Asialo Alpha1-Acid Glycoprotein. J. Pharm. 1992, 15, 7–16. [Google Scholar] [CrossRef]
- Robert, L.; Migne, J.; Santonja, R.; Zini, R.; Schmid, K.; Tillement, J.P. Plasma Binding of an Alpha-Blocking Agent, Nicergoline–Affinity for Serum Albumin and Native and Modified Alpha 1-Acid Glycoprotein. Int. J. Clin. Pharmacol. 1983, 21, 271–276. [Google Scholar]
- Friedman, M.L.; Wermeling, J.R.; Halsall, H.B. The Influence of N-Acetylneuraminic Acid on the Properties of Human Orosomucoid. Biochem. J. 1986, 236, 149–153. [Google Scholar] [CrossRef]
- Miyoshi, T.; Sukimoto, K.; Otagiri, M. Investigation of the Interaction Mode of Phenothiazine Neuroleptics with α1-Acid Glycoprotein. J. Pharm. Pharmacol. 2011, 44, 28–33. [Google Scholar] [CrossRef]
- Baaske, P.; Wienken, C.J.; Reineck, P.; Duhr, S.; Braun, D. Optical Thermophoresis for Quantifying the Buffer Dependence of Aptamer Binding. Angew. Chem. Int. Ed. 2010, 49, 2238–2241. [Google Scholar] [CrossRef] [PubMed]
- Duhr, S.; Braun, D. Why Molecules Move Along a Temperature Gradient. Proc. Natl. Acad. Sci. USA 2006, 103, 19678–19682. [Google Scholar] [CrossRef]
- Immobilized Sialexo–Instructions. Available online: https://www.genovis.com/wp-content/uploads/instructions-immobilized-sialexo.pdf (accessed on 7 May 2023).
- Štambuk, T.; Cvetko, A.; Weitner, T. Protocol for Ultra Performance Liquid Chromatography-Mass Spectrometry N-Glycan Analysis of the Native and Desialylated Human Apo-Transferrin. Zenodo. 2020. Available online: https://zenodo.org/record/4006018 (accessed on 10 May 2023).
- Kerep, R.; Šeba, T.; Borko, V.; Weitner, T.; Keser, T.; Lauc, G.; Gabričević, M. Potential Clinically Relevant Effects of Sialylation on Human Serum AAG-Drug Interactions Assessed by Isothermal Titration Calorimetry: Insight into Pharmacoglycomics? Int. J. Mol. Sci. 2023, 24, 8472. [Google Scholar] [CrossRef]
- NumPy–API Reference. Available online: https://numpy.org/doc/stable/reference/generated/numpy.trapz.html (accessed on 22 December 2023).
- Gill, S.C.; von Hippel, P.H. Calculation of Protein Extinction Coefficients from Amino Acid Sequence Data. Anal. Biochem. 1989, 182, 319–326. [Google Scholar] [CrossRef] [PubMed]
- Edelhoch, H. Spectroscopic Determination of Tryptophan and Tyrosine in Proteins. Biochemistry 1967, 6, 1948–1954. [Google Scholar] [CrossRef] [PubMed]
- Schönfeld, D.L.; Ravelli, R.B.G.; Mueller, U.; Skerra, A. The 1.8-Å Crystal Structure of α1-Acid Glycoprotein (Orosomucoid) Solved by UV RIP Reveals the Broad Drug-Binding Activity of This Human Plasma Lipocalin. J. Mol. Biol. 2008, 384, 393–405. [Google Scholar] [CrossRef]
- Grimsley, G.R.; Pace, C.N. Spectrophotometric Determination of Protein Concentration. Curr. Protoc. Protein Sci. 2003, 33, 3.1.1–3.1.9. [Google Scholar] [CrossRef]
- Friganović, T.; Tomašić, A.; Šeba, T.; Biruš, I.; Kerep, R.; Borko, V.; Šakić, D.; Gabričević, M.; Weitner, T. Low-Pressure Chromatographic Separation and UV/Vis Spectrophotometric Characterization of the Native and Desialylated Human Apo-Transferrin. Heliyon 2021, 7, e08030. [Google Scholar] [CrossRef]
- Terkelsen, T.; Haakensen, V.D.; Saldova, R.; Gromov, P.; Hansen, M.K.; Stöckmann, H.; Lingjaerde, O.C.; Børresen-Dale, A.L.; Papaleo, E.; Helland, Å.; et al. N-Glycan Signatures Identified in Tumor Interstitial Fluid and Serum of Breast Cancer Patients: Association with Tumor Biology and Clinical Outcome. Mol. Oncol. 2018, 12, 972–990. [Google Scholar] [CrossRef]
- Carey, F.A.; Giuliano, R.M. Organic Chemistry, 8th ed.; McGraw-Hill: New York, NY, USA, 2011; p. 1247. [Google Scholar]
- Schmid, K. Preparation and Properties of Serum and Plasma Proteins. XXIX. Separation from Human Plasma of Polysaccharides, Peptides and Proteins of Low Molecular Weight. Crystallization of an Acid Glycoprotein. J. Am. Chem. Soc. 1953, 75, 60–68. [Google Scholar] [CrossRef]
- Pace, C.N.; Vajdos, F.; Fee, L.; Grimsley, G.; Gray, T. How to Measure and Predict the Molar Absorption Coefficient of a Protein. Protein Sci. 1995, 4, 2411–2423. [Google Scholar] [CrossRef]
- Huang, R.Y.C.; Hudgens, J.W. Effects of Desialylation on Human α1-Acid Glycoprotein–Ligand Interactions. Biochemistry 2013, 52, 7127–7136. [Google Scholar] [CrossRef]
- Alderighi, L.; Gans, P.; Ienco, A.; Peters, D.; Sabatini, A.; Vacca, A. Hyperquad Simulation and Speciation (HySS): A Utility Program for the Investigation of Equilibria Involving Soluble and Partially Soluble Species. Coord. Chem. Rev. 1999, 184, 311–318. [Google Scholar] [CrossRef]
- Housaindokht, M.R.; Rouhbakhsh Zaeri, Z.; Bahrololoom, M.; Chamani, J.; Bozorgmehr, M.R. Investigation of the Behavior of HSA upon Binding to Amlodipine and Propranolol: Spectroscopic and Molecular Modeling Approaches. Spectrochim. Acta A Mol. Biomol. Spectrosc. 2012, 85, 79–84. [Google Scholar] [CrossRef] [PubMed]
- Yoo, M.J.; Smith, Q.R.; Hage, D.S. Studies of Imipramine Binding to Human Serum Albumin by High-Performance Affinity Chromatography. J. Chromatogr. B 2009, 877, 1149–1154. [Google Scholar] [CrossRef] [PubMed]
- Yasgar, A.; Furdas, S.D.; Maloney, D.J.; Jadhav, A.; Jung, M.; Simeonov, A. High-Throughput 1,536-Well Fluorescence Polarization Assays for α1-Acid Glycoprotein and Human Serum Albumin Binding. PLoS ONE 2012, 7, e45594. [Google Scholar] [CrossRef] [PubMed]
- Safarnejad, A.; Shaghaghi, M.; Dehghan, G.; Soltani, S. Binding of Carvedilol to Serum Albumins Investigated by Multi-Spectroscopic and Molecular Modeling Methods. J. Lumin. 2016, 176, 149–158. [Google Scholar] [CrossRef]
- Hein, K.L.; Kragh-Hansen, U.; Morth, J.P.; Jeppesen, M.D.; Otzen, D.; Møller, J.V.; Nissen, P. Crystallographic Analysis Reveals a Unique Lidocaine Binding Site on Human Serum Albumin. J. Struct. Biol. 2010, 171, 353–360. [Google Scholar] [CrossRef] [PubMed]
- Al-Asbahy, W.M.; Shamsi, M. Interaction Studies of Vinblastine Drug with Human Serum Albumin (HSA) by Spectroscopic and Molecular Modeling Studies. Al-Razi Univ. J. Med. Sci. 2017, 1, 2–15. [Google Scholar] [CrossRef]
- Gannon, B.M.; Glesby, M.J.; Finkelstein, J.L.; Raj, T.; Erickson, D.; Mehta, S. A Point-of-Care Assay for Alpha-1-Acid Glycoprotein as a Diagnostic Tool for Rapid, Mobile-Based Determination of Inflammation. Curr. Res. Biotechnol. 2019, 1, 41–48. [Google Scholar] [CrossRef]
- Watson, R.; Bastain, W.; Larkin, K.; Hayes, J.; McAinsh, J.; Shanks, R. A Comparative Pharmacokinetic Study of Conventional Propranolol and Long Acting Preparation of Propranolol in Patients with Cirrhosis and Normal Controls. Br. J. Clin. Pharmacol. 1987, 24, 527–535. [Google Scholar] [CrossRef] [PubMed]
- Imipramine Hydrochloride SmPC. Available online: https://www.medicines.org.uk/emc/product/13879/smpc#gref (accessed on 26 August 2023).
- Bjornsson, T.D.; Mahony, C. Clinical Pharmacokinetics of Dipyridamole. Thromb. Res. 1983, 29, 93–104. [Google Scholar] [CrossRef]
- Packer, M.; Lukas, M.A.; Tenero, D.M.; Baidoo, C.A.; Greenberg, B.H. Pharmacokinetic Profile of Controlled-Release Carvedilol in Patients with Left Ventricular Dysfunction Associated with Chronic Heart Failure or After Myocardial Infarction. Am. J. Cardiol. 2006, 98, 39–45. [Google Scholar] [CrossRef]
- Lidocaine Level. Available online: https://emedicine.medscape.com/article/2090152-overview (accessed on 29 August 2023).
- Links, M.; Watson, S.; Lethlean, K.; Aherne, W.; Kirsten, F.; Clarke, S.; Law, M.; Friedlander, M.; Galettis, P.; McKeage, M.J. Vinblastine Pharmacokinetics in Patients with Non-Small Cell Lung Cancer Given Cisplatin. Cancer Investig. 1999, 17, 479–485. [Google Scholar] [CrossRef] [PubMed]
- Zahra, R.; Ahmad, R.; Asghar, M.S.A.; Ali, A.; Soghra, K. A Study of the Interaction Between Ropranolol and NSAIDs in Protein Binding by Gel Filtration Method. Indian J. Clin. Biochem. 2006, 21, 121–125. [Google Scholar] [CrossRef]
- Borgå, O.; Azarnoff, D.L.; Forshell, G.P.; Sjöqvist, F. Plasma Protein Binding of Tricyclic Anti-Depressants in Man. Biochem. Pharmacol. 1969, 18, 2135–2143. [Google Scholar] [CrossRef]
- Coreg Tablets–Prescribing Information. Available online: https://www.accessdata.fda.gov/drugsatfda_docs/label/2005/020297s013lbl.pdf (accessed on 5 September 2023).
- Routledge, P.A.; Barchowsky, A.; Bjornsson, T.D.; Kitchell, B.B.; Shand, D.G. Lidocaine Plasma Protein Binding. Clin. Pharmacol. Ther. 1980, 27, 347–351. [Google Scholar] [CrossRef] [PubMed]
- Steele, W.H.; King, D.J.; Barber, H.E.; Hawksworth, G.M.; Dawson, A.A.; Petrie, J.C. The Protein Binding of Vinblastine in the Serum of Normal Subjects and Patients with Hodgkin’s Disease. Eur. J. Clin. Pharmacol. 1983, 24, 683–687. [Google Scholar] [CrossRef]
- Harker, L.A.; Kadatz, R.A. Mechanism of Action of Dipyridamole. Thromb. Res. 1983, 29, 39–46. [Google Scholar] [CrossRef]
- Halkes, P.H.; J, V.G.; Kappelle, L.J.; Koudstaal, P.J.; Algra, A. Aspirin Plus Dipyridamole Versus Aspirin Alone after Cerebral Ischaemia of Arterial Origin (ESPRIT): Randomised Controlled Trial. Lancet 2006, 367, 1665–1673. [Google Scholar] [CrossRef] [PubMed]
- Allahham, M.; Lerman, A.; Atar, D.; Birnbaum, Y. Why Not Dipyridamole: A Review of Current Guidelines and Re-evaluation of Utility in the Modern Era. Cardiovasc. Drugs Ther. 2022, 36, 525–532. [Google Scholar] [CrossRef] [PubMed]


| AAG | n | p-Value | |
|---|---|---|---|
| Native | 38,200 ± 340 | 3 | 0.97 |
| Desialylated | 38,210 ± 60 | 3 |
| Drug | Kd/M | n | p-Value | % Difference | |
|---|---|---|---|---|---|
| Native AAG | Desialylated AAG | ||||
| Carvedilol | 1.17 × 10⁻⁴ ± 1.40 × 10⁻⁵ | 6.35 × 10⁻⁵ ± 6.75 × 10⁻⁶ | 2 | 0.040 (**) | −45.6 |
| Diltiazem | 6.33 × 10⁻⁴ ± 5.46 × 10⁻⁵ | 6.87 × 10⁻⁴ ± 1.17 × 10⁻⁴ | 2 | 0.617 | 8.46 |
| Dipyridamole | 4.70 × 10⁻⁶ ± 5.89 × 10⁻⁷ | 3.26 × 10⁻⁶ ± 9.75 × 10⁻⁷ | 3 | 0.094 (*) | −30.6 |
| Imipramine | 1.22 × 10⁻³ ± 5.32 × 10⁻⁵ | 1.65 × 10⁻³ ± 8.65 × 10⁻³ | 2 | 0.027 (**) | 35.2 |
| Lidocaine | 4.87 × 10⁻⁴ ± 4.36 × 10⁻⁵ | 8.98 × 10⁻⁴ ± 1.84 × 10⁻⁴ | 2 | 0.091 (*) | 84.6 |
| Propranolol | 8.11 × 10⁻⁴ ± 5.69 × 10⁻⁵ | 1.20 × 10⁻³ ± 7.81 × 10⁻⁵ | 2 | 0.029 (**) | 48.5 |
| Vinblastine | 2.22 × 10⁻⁴ ± 1.50 × 10⁻⁵ | 3.08 × 10⁻⁴ ± 2.98 × 10⁻⁵ | 2 | 0.068 (*) | 38.4 |
| Drug | Kd/M |
|---|---|
| Propranolol 1 | 4.37 × 10⁻⁵ |
| Imipramine 2 | 6.25 × 10⁻⁶ |
| Dipyridamole 3 | 3.56 × 10⁻⁵ |
| Carvedilol 4 | 8.33 × 10⁻⁵ |
| Lidocaine 5 | 3.23 × 10⁻³ |
| Vinblastine 6 | 1.56 × 10⁻⁵ |
| Drug | Cmax | Cmin |
|---|---|---|
| Propranolol 1 | 78.5 ng/mL | 21.5 ng/mL |
| Imipramine 2 | 85.0 ng/mL | 33.0 ng/mL |
| Dipyridamole 3 | 1.40 µg/mL | 0.80 µg/mL |
| Carvedilol 4 | 37.8 ng/mL | 9.28 ng/mL |
| Lidocaine 5 | 1.50 µg/mL | 5.00 µg/mL |
| Vinblastine 6 | 3.20 ng/mL | 6.30 ng/mL |
Disclaimer/Publisher’s Note: The statements, opinions and data contained in all publications are solely those of the individual author(s) and contributor(s) and not of MDPI and/or the editor(s). MDPI and/or the editor(s) disclaim responsibility for any injury to people or property resulting from any ideas, methods, instructions or products referred to in the content. |
© 2024 by the authors. Licensee MDPI, Basel, Switzerland. This article is an open access article distributed under the terms and conditions of the Creative Commons Attribution (CC BY) license (https://creativecommons.org/licenses/by/4.0/).
Share and Cite
Šeba, T.; Kerep, R.; Weitner, T.; Šoić, D.; Keser, T.; Lauc, G.; Gabričević, M. Influence of Desialylation on the Drug Binding Affinity of Human Alpha-1-Acid Glycoprotein Assessed by Microscale Thermophoresis. Pharmaceutics 2024, 16, 230. https://doi.org/10.3390/pharmaceutics16020230
Šeba T, Kerep R, Weitner T, Šoić D, Keser T, Lauc G, Gabričević M. Influence of Desialylation on the Drug Binding Affinity of Human Alpha-1-Acid Glycoprotein Assessed by Microscale Thermophoresis. Pharmaceutics. 2024; 16(2):230. https://doi.org/10.3390/pharmaceutics16020230
Chicago/Turabian StyleŠeba, Tino, Robert Kerep, Tin Weitner, Dinko Šoić, Toma Keser, Gordan Lauc, and Mario Gabričević. 2024. "Influence of Desialylation on the Drug Binding Affinity of Human Alpha-1-Acid Glycoprotein Assessed by Microscale Thermophoresis" Pharmaceutics 16, no. 2: 230. https://doi.org/10.3390/pharmaceutics16020230
APA StyleŠeba, T., Kerep, R., Weitner, T., Šoić, D., Keser, T., Lauc, G., & Gabričević, M. (2024). Influence of Desialylation on the Drug Binding Affinity of Human Alpha-1-Acid Glycoprotein Assessed by Microscale Thermophoresis. Pharmaceutics, 16(2), 230. https://doi.org/10.3390/pharmaceutics16020230