


Ozonated Sunflower Oil Embedded within Spray-Dried Chitosan Microspheres Cross-Linked with Azelaic Acid as a Multicomponent Solid Form for Broad-Spectrum and Long-Lasting Antimicrobial Activity

 ,
, 
 ,
,
Abstract
:
1. Introduction
2. Materials and Methods
2.1. Materials
2.2. Equipment
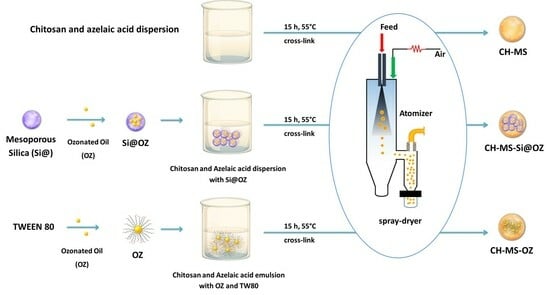
2.3. Material Preparation Procedures
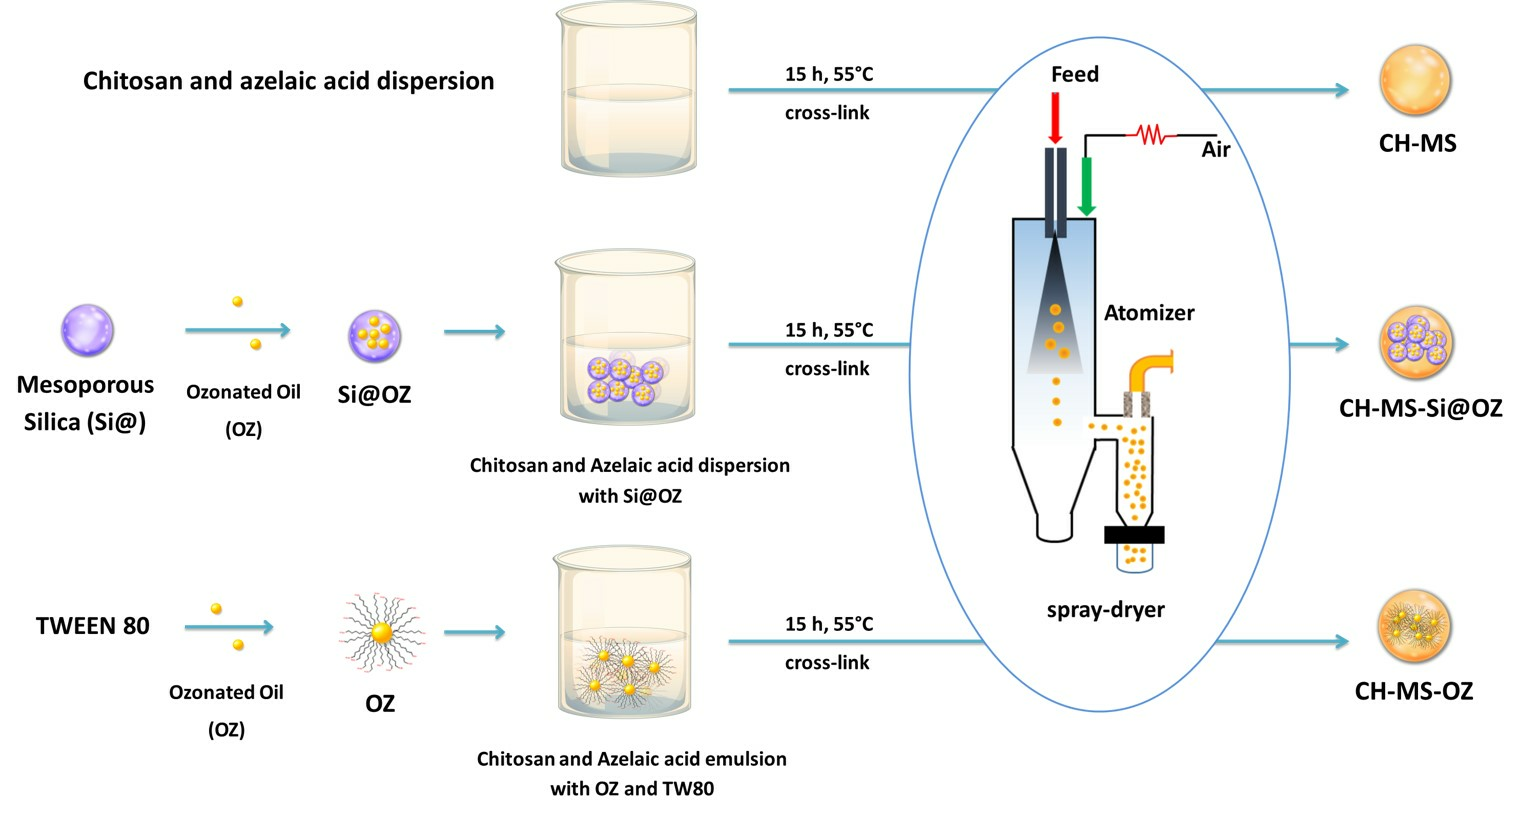
2.3.1. Production of Chitosan Microspheres Cross-Linked with Azelaic Acid (CH-MS)
2.3.2. Synthesis of Mesoporous Silica (Si@)
2.3.3. Incorporation of OZ in Si@
2.3.4. Synthesis of Chitosan Microspheres Cross-Linked with Azelaic Acid and Incorporating Ozonated Oil (CH-MS-OZ)
2.3.5. Synthesis of Chitosan Microspheres Cross-Linked with Azelaic Acid and Incorporating Ozonated Oil Loaded on Mesoporous Silica (CH-MS-Si@OZ)
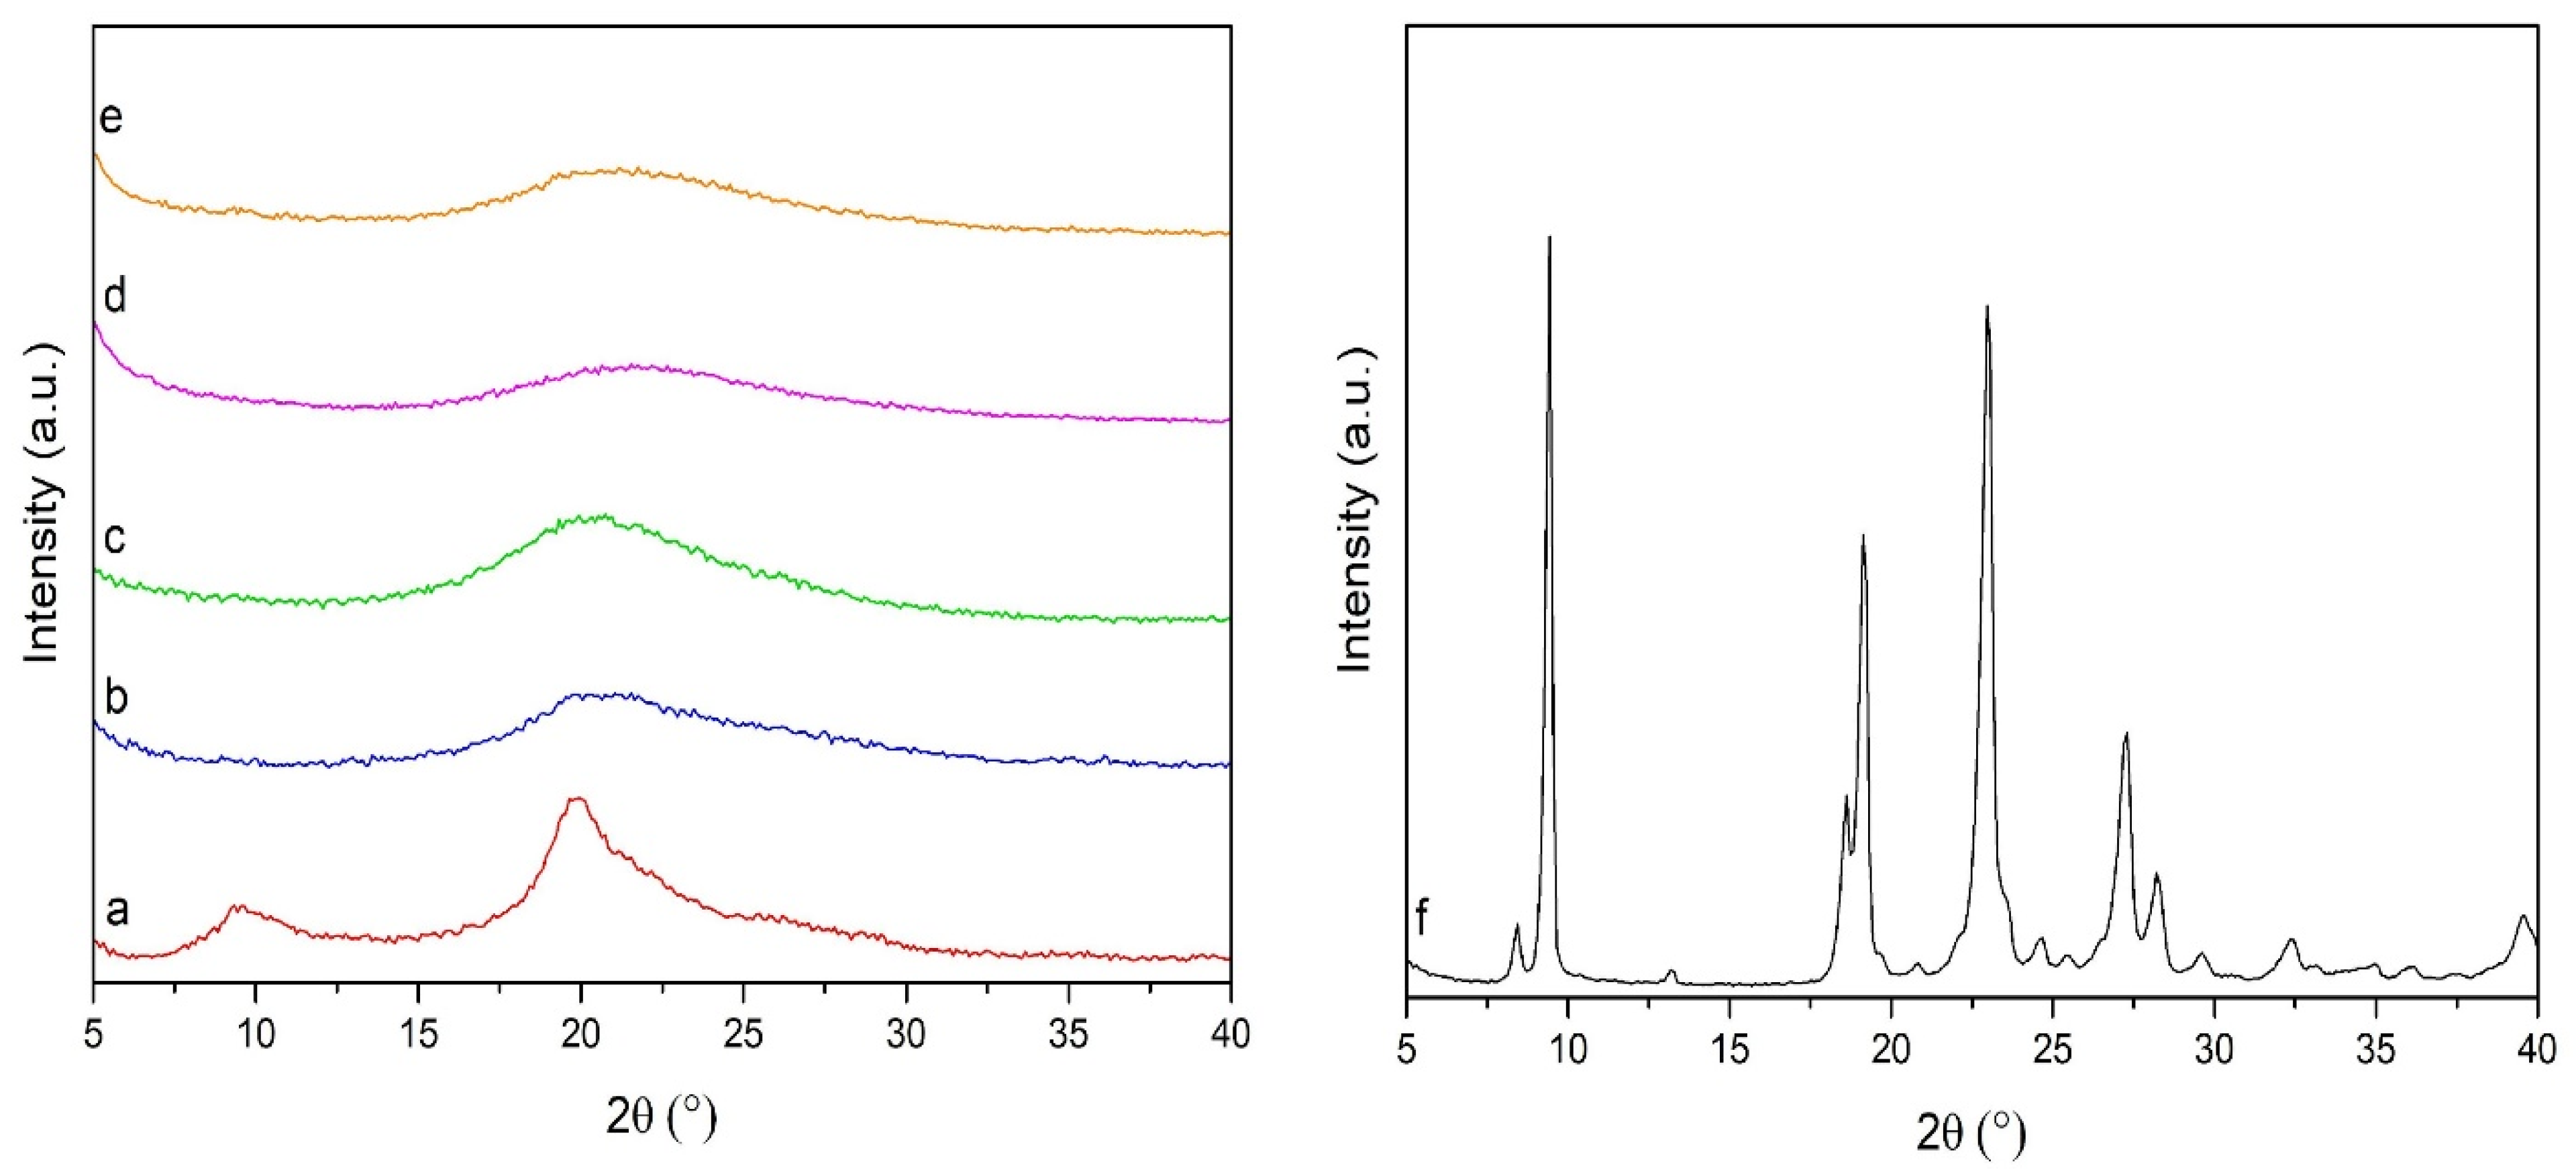
2.4. Characterization
2.4.1. Peroxide Titration and Encapsulation Efficiency (EE)
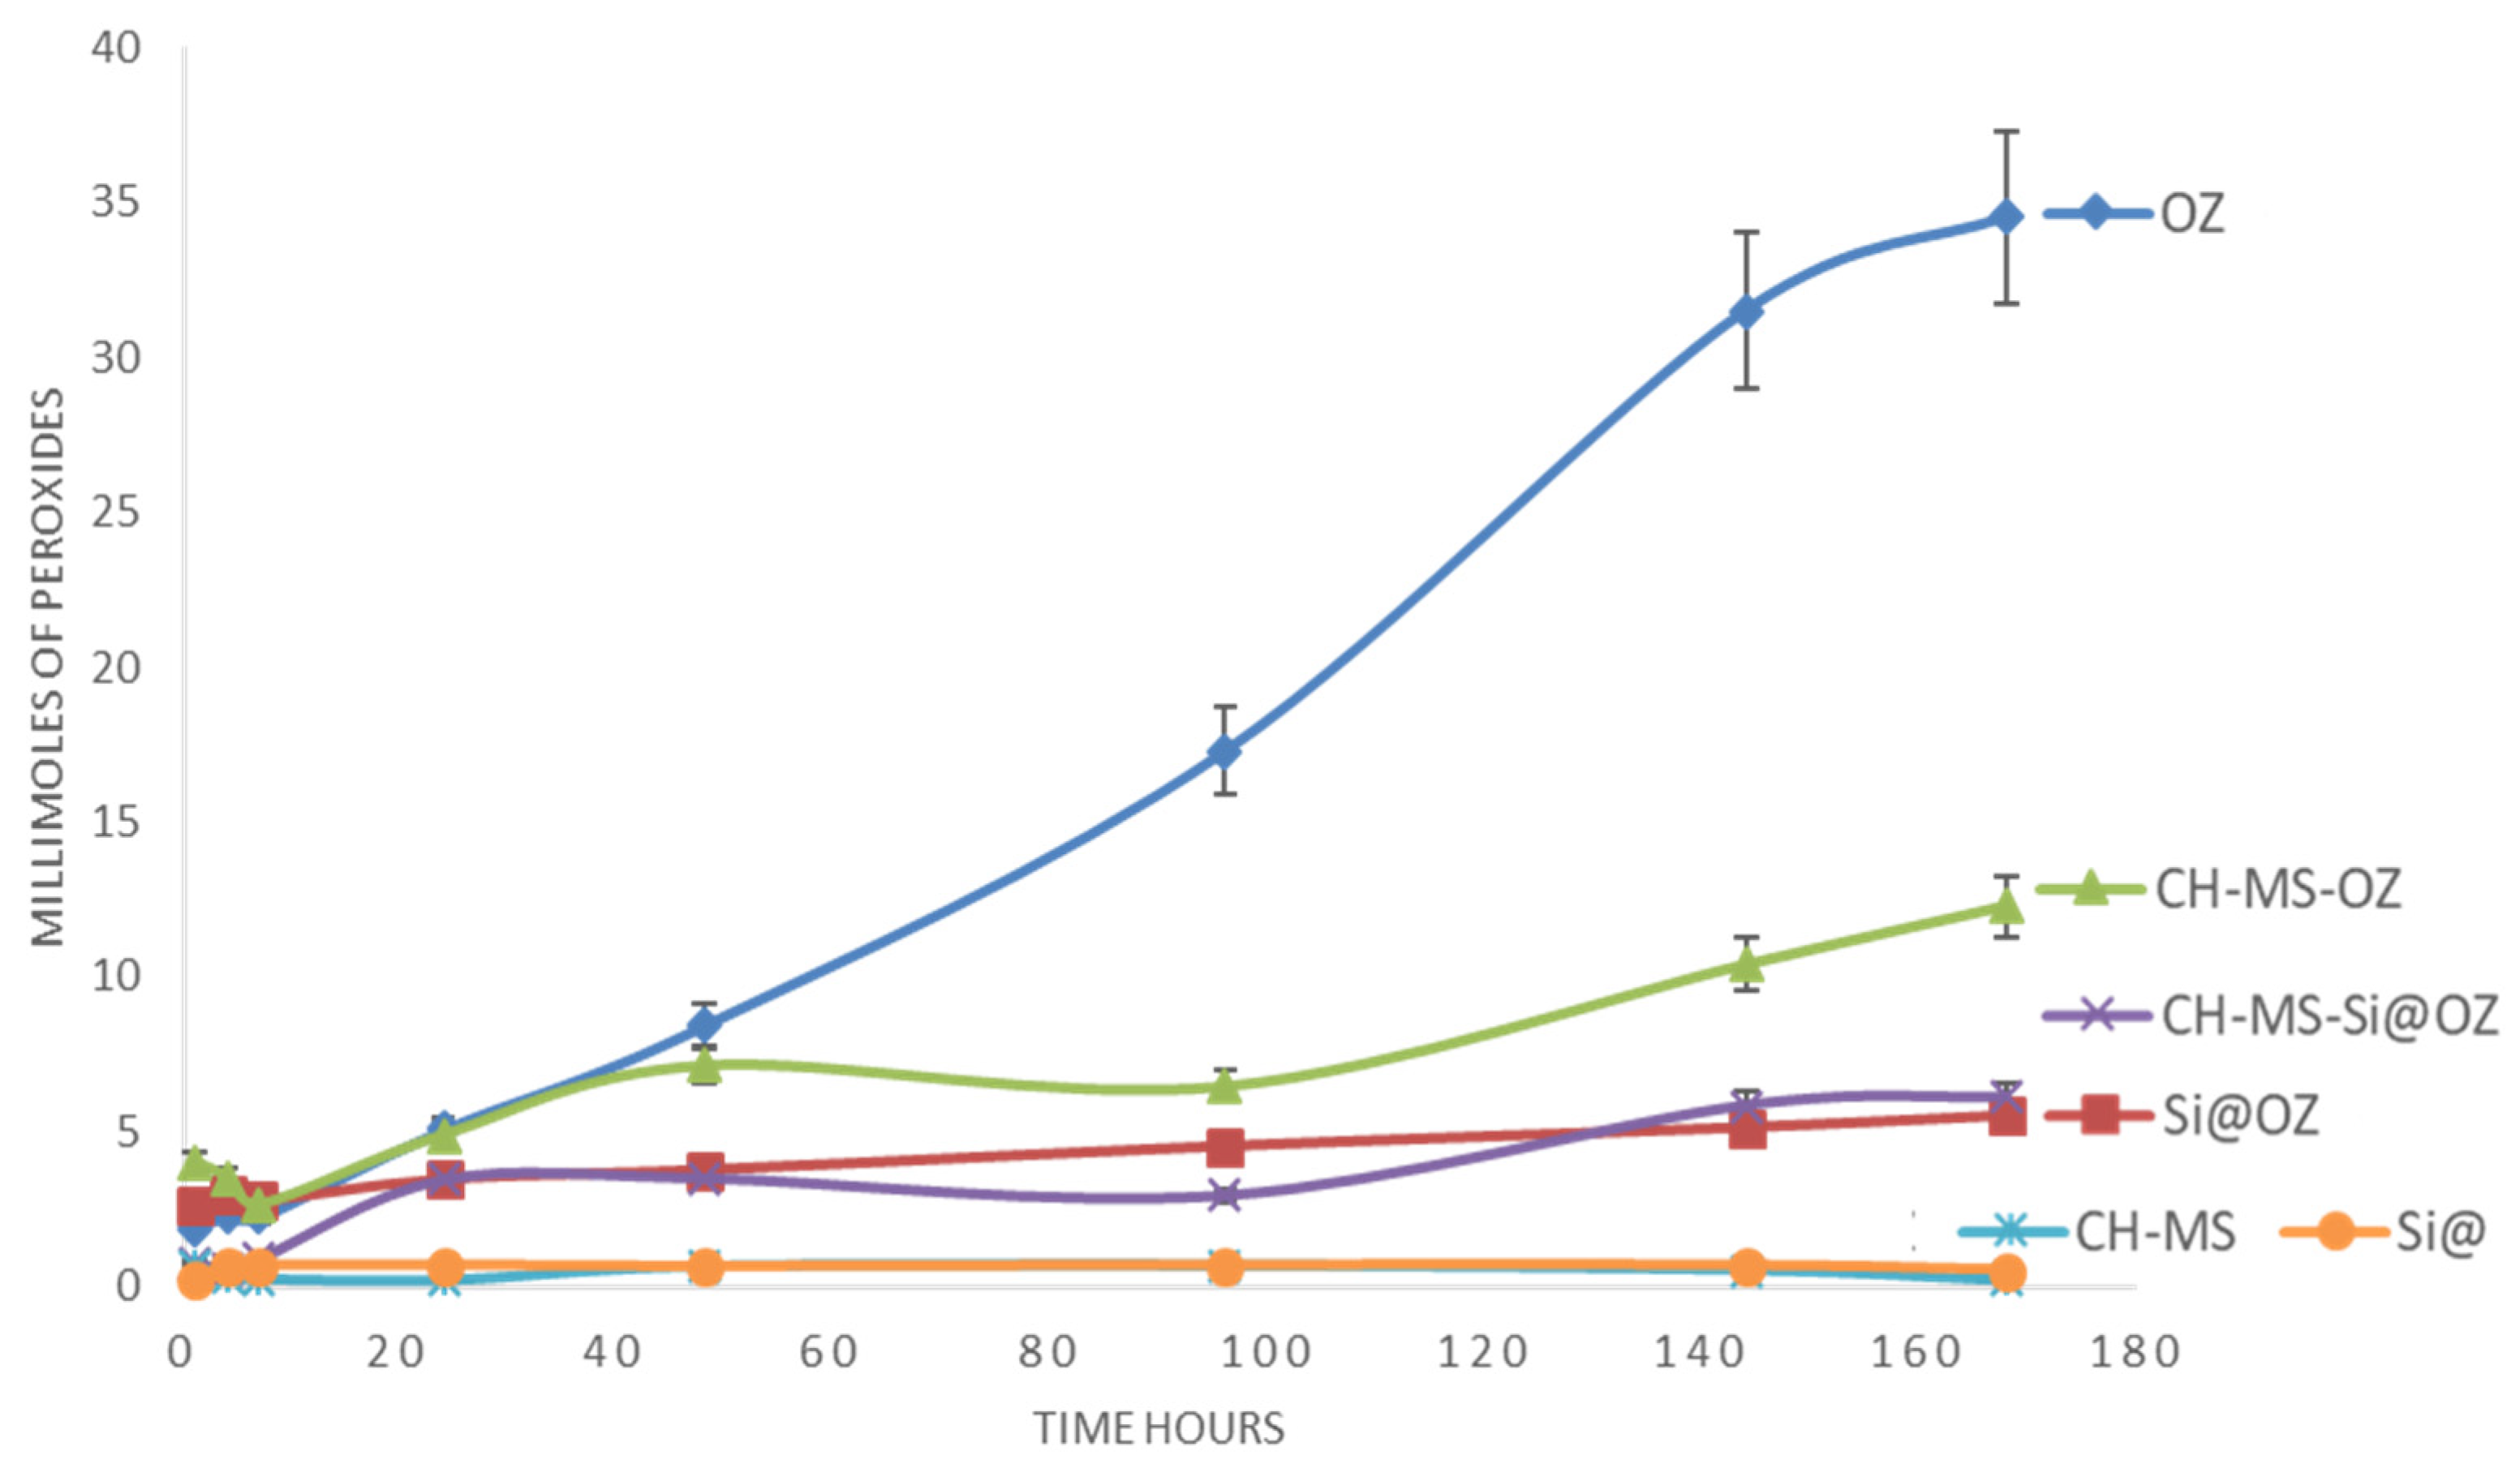
2.4.2. Peroxides Release Test from OZ-Containing Samples
2.4.3. Percentage of Swelling Ratio
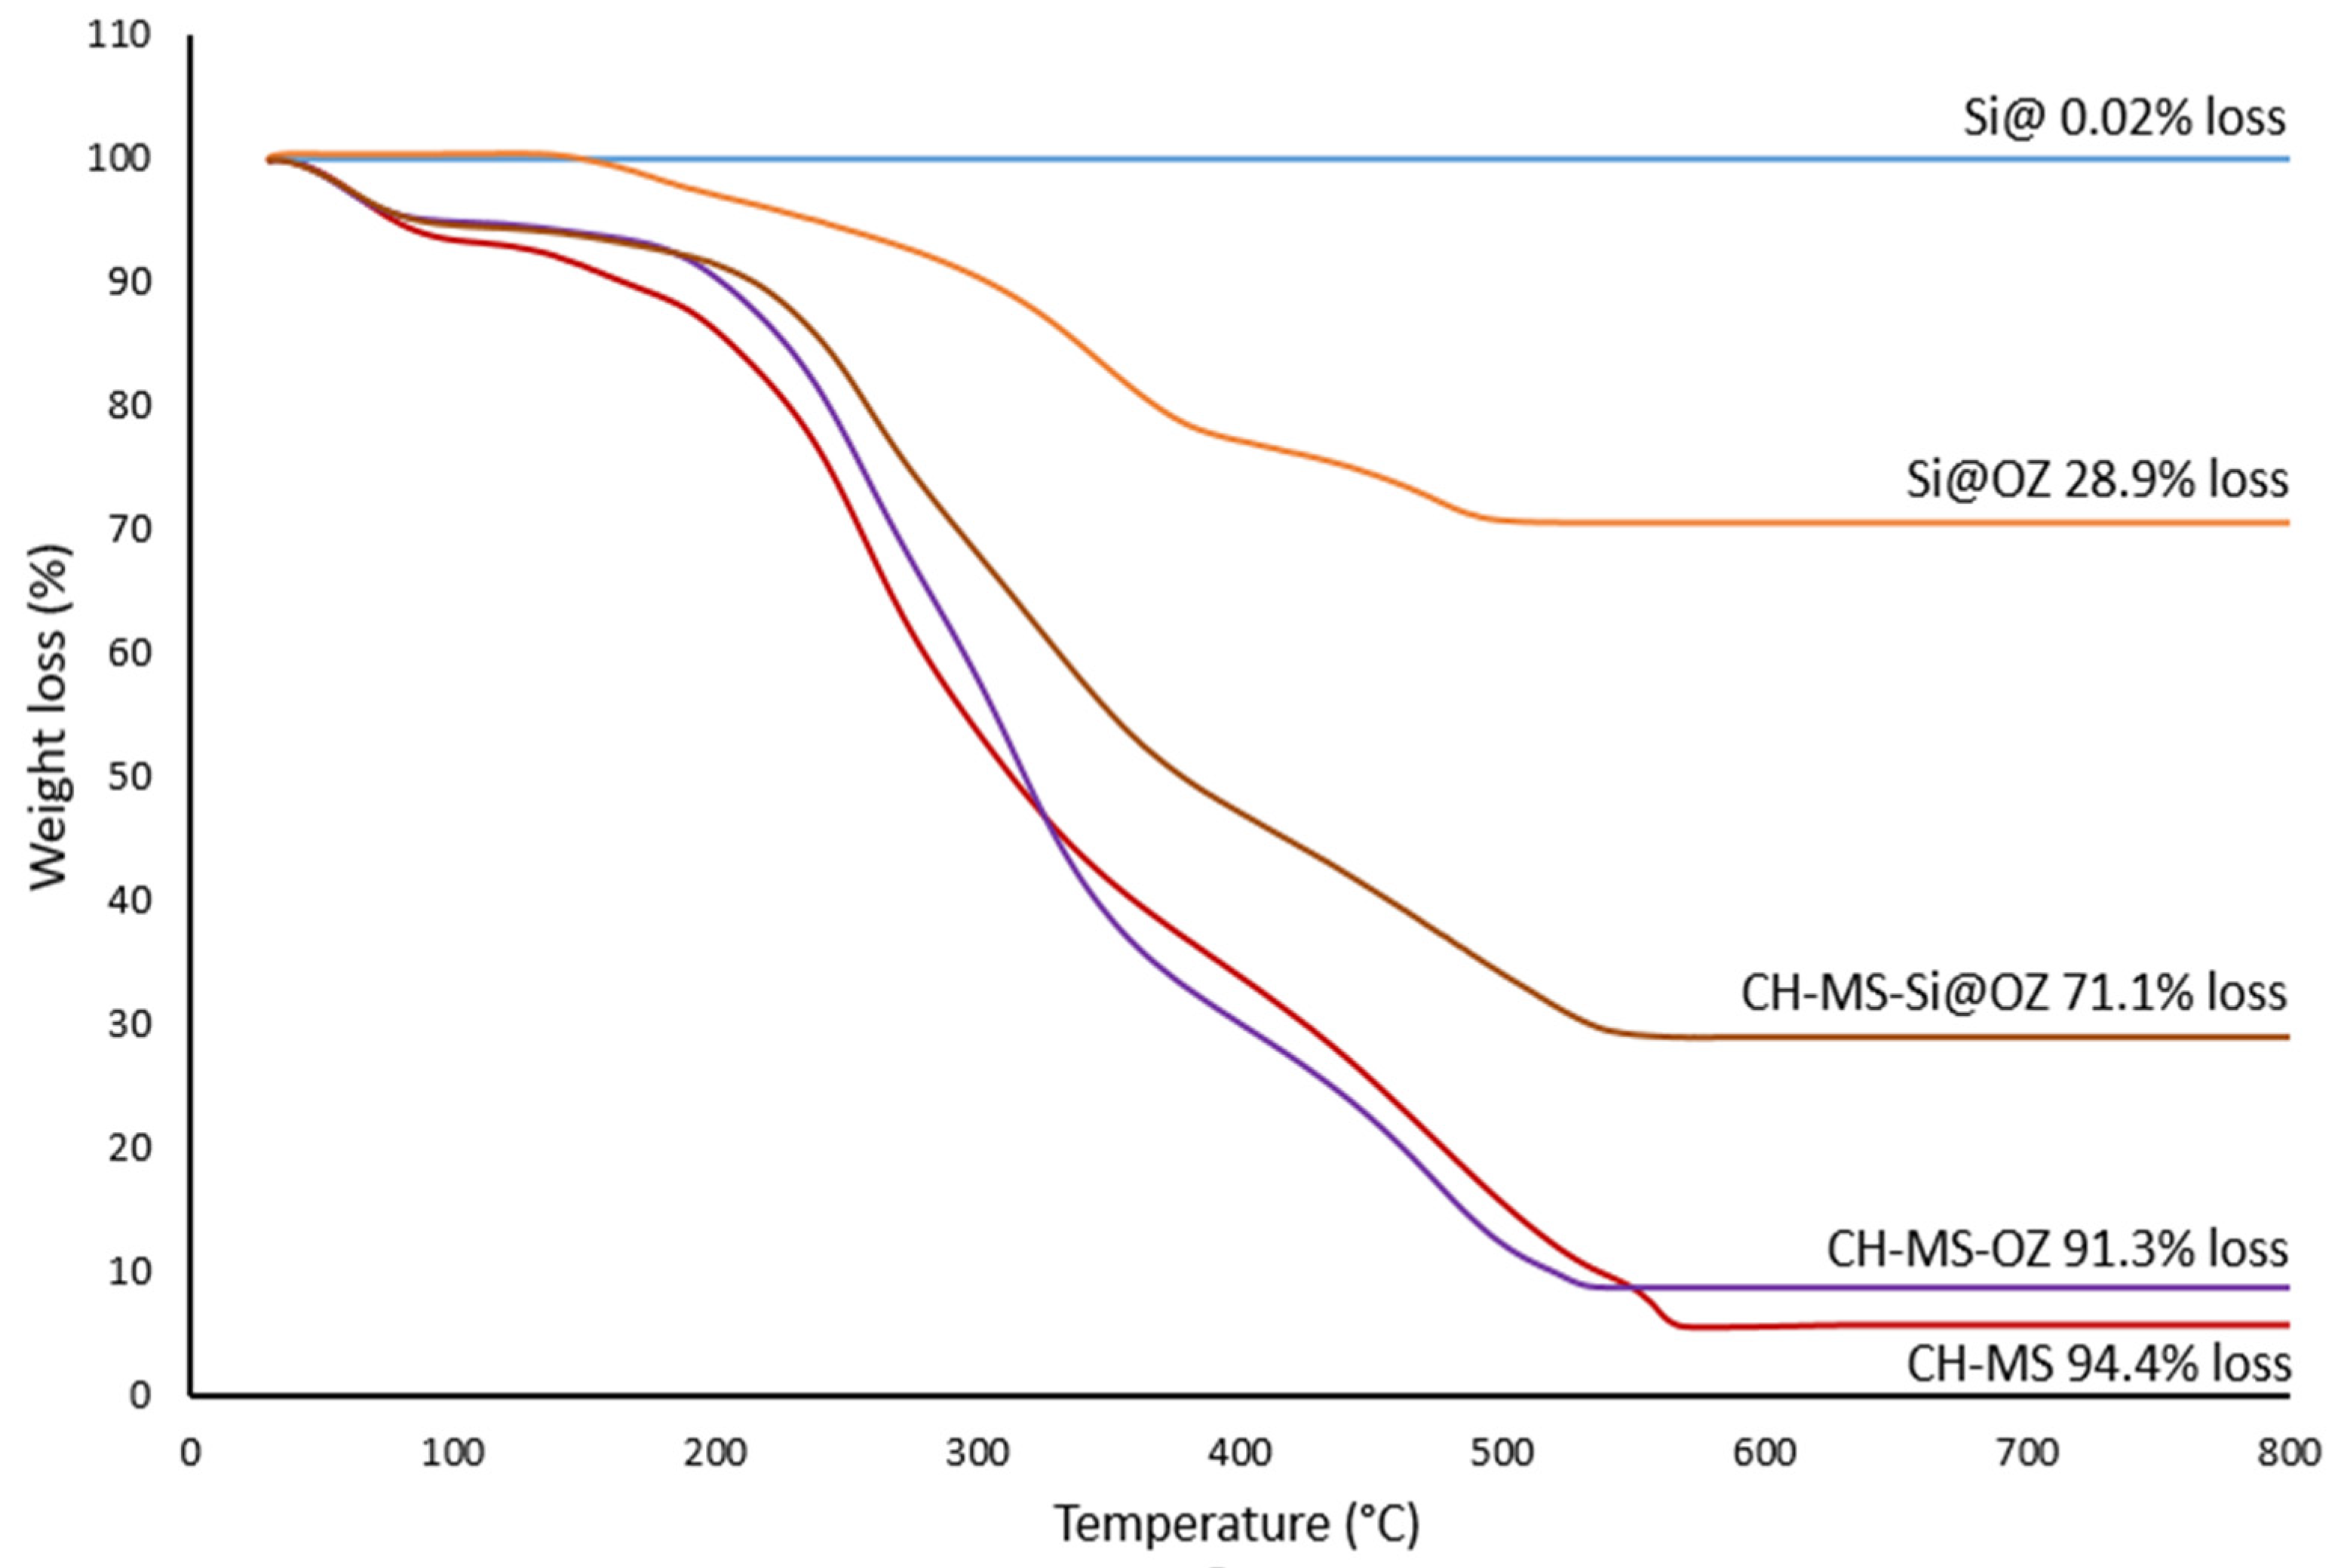
2.4.4. Percentage of Microspheres Degradation
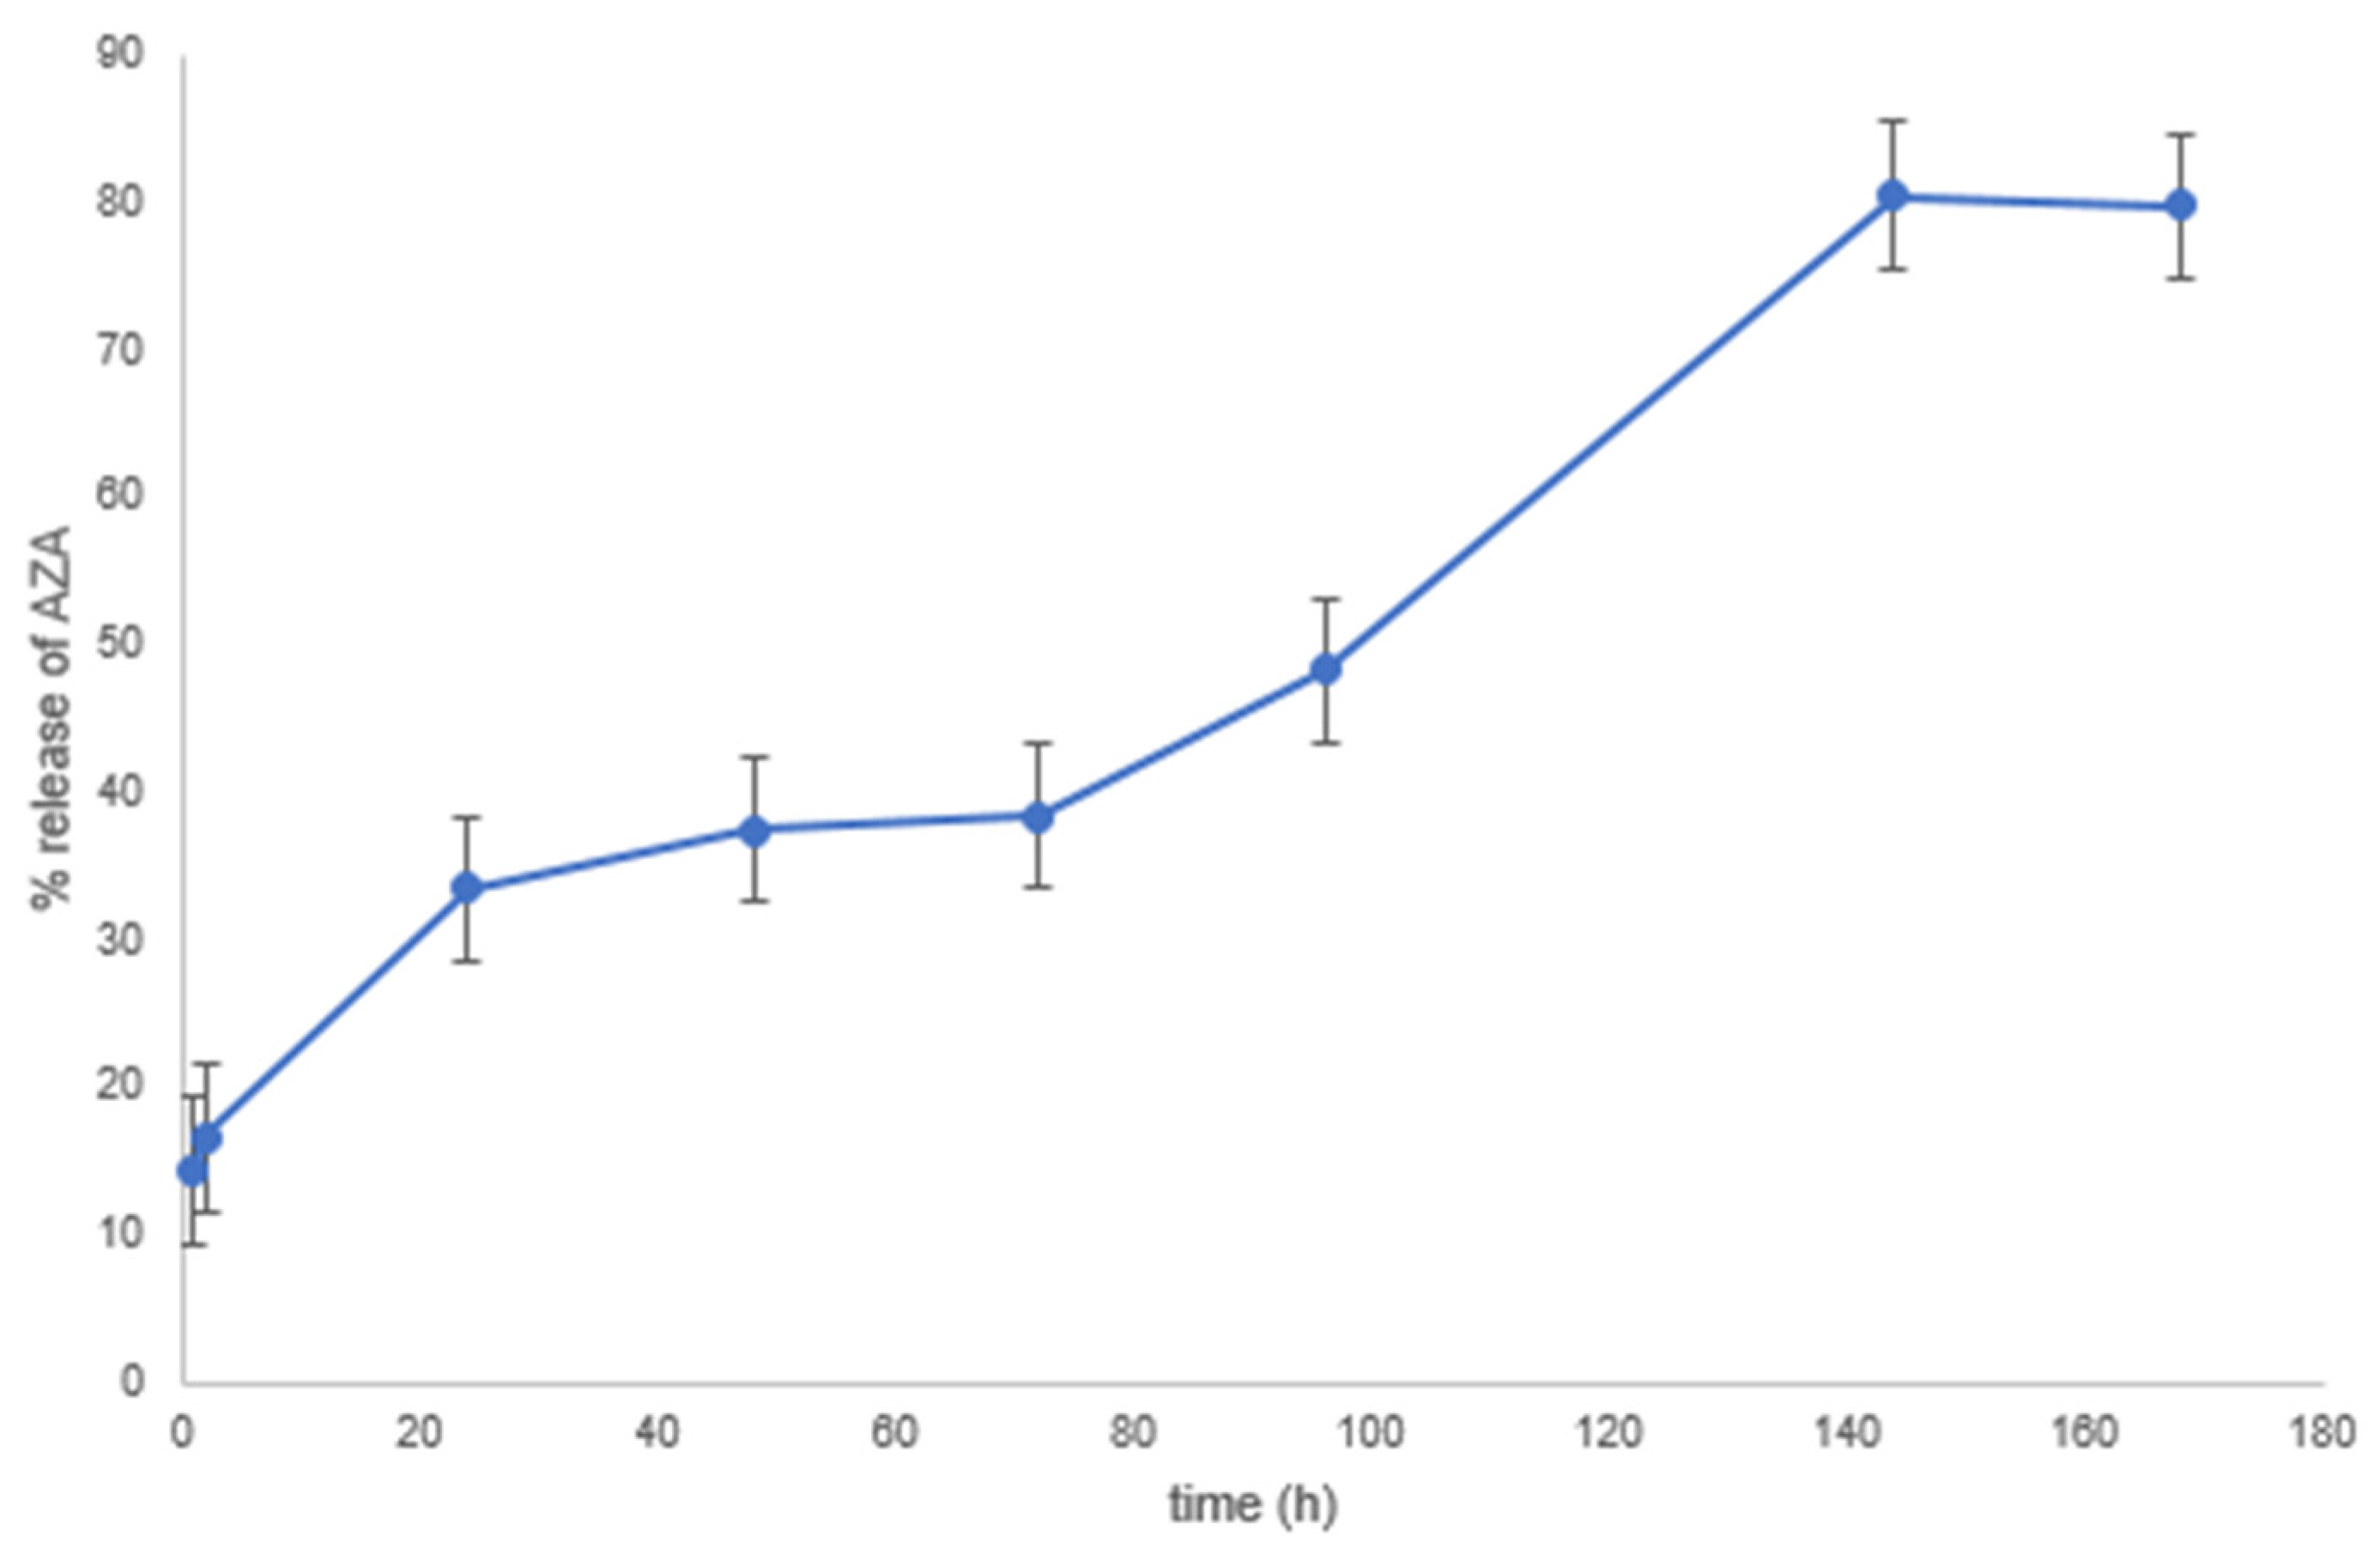
2.4.5. Release of AZA
2.4.6. Antimicrobial Activity
3. Results and Discussion
4. Conclusions
5. Patents
- (1)
- N°102023000013839—priority 04/07/23, Title: Cosmetic composition containing microspheres of chitosan and azelaic acid functionalized with ozonated oil.
- (2)
- N°102023000013845—priority 04/07/23, Title: Cosmetic composition containing chitosan microspheres and azelaic acid.
- (3)
- N°102023000013838—priority 04/07/23, Title: Cosmetic display containing chitosan microspheres and azelaic acid.
- (4)
- N°102023000013872—priority 04/07/23, Title: Advanced medication in the form of a collagen sheet containing chitosan microspheres and azelaic acid functionalized with ozonated oil loaded on mesoporous silica.
- (5)
- N°102023000013839—priority 04/07/23, Title: Chitosan and azelaic acid microspheres functionalized with ozonated oil loaded on mesoporous silica.
- (6)
- N°102023000013890—priority 04/07/23, Title: Topical composition containing silica functionalized with oil for wound debridement.
- (7)
- N°102023000013899—priority 04/07/23, Title: Advanced medication containing chitosan microspheres and azelaic acid functionalized with ozonated oil.
Supplementary Materials
Author Contributions
Funding
Institutional Review Board Statement
Informed Consent Statement
Data Availability Statement
Acknowledgments
Conflicts of Interest
References
- Desai, N.; Rana, D.; Salave, S.; Gupta, R.; Patel, P.; Karunakaran, B.; Sharma, A.; Giri, J.; Benival, D.; Kommineni, N. Chitosan: A Potential Biopolymer in Drug Delivery and Biomedical Applications. Pharmaceutics 2023, 15, 1313. [Google Scholar] [CrossRef] [PubMed]
- Khan, M.I.H.; An, X.; Dai, L.; Li, H.; Khan, A.; Ni, Y. Chitosan-Based Polymer Matrix for Pharmaceutical Excipients and Drug Delivery. Curr. Med. Chem. 2019, 26, 2502–2513. [Google Scholar] [CrossRef] [PubMed]
- Sharma, M.; Sharma, R.; Jain, D.K.; Saraf, A. Enhancement of Oral Bioavailability of Poorly Water Soluble Carvedilol by Chitosan Nanoparticles: Optimization and Pharmacokinetic Study. Int. J. Biol. Macromol. 2019, 135, 246–260. [Google Scholar] [CrossRef] [PubMed]
- Wan, S.; Sun, Y.; Sun, L.; Tan, F. Chitosan Microparticles for Oral Bioavailability Improvement of the Hydrophobic Drug Curcumin. Pharmazie 2012, 67, 525–528. [Google Scholar] [PubMed]
- Khan, F.; Pham, D.T.N.; Oloketuyi, S.F.; Manivasagan, P.; Oh, J.; Kim, Y.-M. Chitosan and Their Derivatives: Antibiofilm Drugs against Pathogenic Bacteria. Colloids Surf. B Biointerfaces 2020, 185, 110627. [Google Scholar] [CrossRef] [PubMed]
- Alven, S.; Aderibigbe, B.A. Chitosan-Based Scaffolds Incorporated with Silver Nanoparticles for the Treatment of Infected Wounds. Pharmaceutics 2024, 16, 327. [Google Scholar] [CrossRef] [PubMed]
- Szymańska, E.; Winnicka, K. Stability of Chitosan-a Challenge for Pharmaceutical and Biomedical Applications. Mar. Drugs 2015, 13, 1819–1846. [Google Scholar] [CrossRef]
- Bartos, C.; Varga, P.; Szabó-Révész, P.; Ambrus, R. Physico-Chemical and In Vitro Characterization of Chitosan-Based Microspheres Intended for Nasal Administration. Pharmaceutics 2021, 13, 608. [Google Scholar] [CrossRef] [PubMed]
- Zhou, G.; Zhang, J.; Tai, J.; Han, Q.; Wang, L.; Wang, K.; Wang, S.; Fan, Y. Comparison of Chitosan Microsphere versus O-Carboxymethyl Chitosan Microsphere for Drug Delivery Systems. J. Bioact. Compat. Polym. 2017, 32, 469–486. [Google Scholar] [CrossRef]
- Gupta, K.C.; Jabrail, F.H. Glutaraldehyde and Glyoxal Cross-Linked Chitosan Microspheres for Controlled Delivery of Centchroman. Carbohydr. Res. 2006, 341, 744–756. [Google Scholar] [CrossRef]
- Gaspar, M.C.; Sousa, J.J.S.; Pais, A.A.C.C.; Cardoso, O.; Murtinho, D.; Serra, M.E.S.; Tewes, F.; Olivier, J.-C. Optimization of Levofloxacin-Loaded Crosslinked Chitosan Microspheres for Inhaled Aerosol Therapy. Eur. J. Pharm. Biopharm. 2015, 96, 65–75. [Google Scholar] [CrossRef] [PubMed]
- Akamatsu, K.; Ikeuchi, Y.; Nakao, A.; Nakao, S. Size-Controlled and Monodisperse Enzyme-Encapsulated Chitosan Microspheres Developed by the SPG Membrane Emulsification Technique. J. Colloid Interface Sci. 2012, 371, 46–51. [Google Scholar] [CrossRef] [PubMed]
- Li, W.; Wei, H.; Liu, Y.; Li, S.; Wang, G.; Guo, T.; Han, H. An in Situ Reactive Spray-Drying Strategy for Facile Preparation of Starch-Chitosan Based Hydrogel Microspheres for Water Treatment Application. Chem. Eng. Process. 2021, 168, 108548. [Google Scholar] [CrossRef]
- Oliveira, B.F.; Santana, M.H.A.; Ré, M.I. Spray-Dried Chitosan Microspheres Cross-Linked with d, l-Glyceraldehyde as a Potential Drug Delivery System: Preparation and Characterization. Braz. J. Chem. Eng. 2005, 22, 353–360. [Google Scholar] [CrossRef]
- Ko, J.A.; Park, H.J.; Hwang, S.J.; Park, J.B.; Lee, J.S. Preparation and Characterization of Chitosan Microparticles Intended for Controlled Drug Delivery. Int. J. Pharm. 2002, 249, 165–174. [Google Scholar] [CrossRef] [PubMed]
- Zou, X.; Zhao, X.; Ye, L.; Wang, Q.; Li, H. Preparation and Drug Release Behavior of pH-Responsive Bovine Serum Albumin-Loaded Chitosan Microspheres. J. Ind. Eng. Chem. 2015, 21, 1389–1397. [Google Scholar] [CrossRef]
- Coppi, G.; Iannuccelli, V.; Leo, E.; Bernabei, M.T.; Cameroni, R. Chitosan-Alginate Microparticles as a Protein Carrier. Drug Dev. Ind. Pharm. 2001, 27, 393–400. [Google Scholar] [CrossRef] [PubMed]
- Sedyakina, N.E.; Zakharov, A.N.; Krivoshchepov, A.F.; Pribytkova, A.P.; Bogdanova, Y.A.; Feldman, N.B.; Lutsenko, S.V.; Avramenko, G.V. Effect of Carbon Chain Length of Dicarboxylic Acids as Cross-Linking Agents on Morphology, Encapsulation, and Release Features of Protein-Loaded Chitosan Microparticles. Colloid Polym. Sci. 2017, 295, 1915–1924. [Google Scholar] [CrossRef]
- Mitra, T.; Sailakshmi, G.; Gnanamani, A.; Mandal, A.B. Preparation and Characterization of Malonic Acid Cross-Linked Chitosan and Collagen 3D Scaffolds: An Approach on Non-Covalent Interactions. J. Mater. Sci. Mater. Med. 2012, 23, 1309–1321. [Google Scholar] [CrossRef]
- Searle, T.; Ali, F.R.; Al-Niaimi, F. The Versatility of Azelaic Acid in Dermatology. J. Dermatol. Treat. 2022, 33, 722–732. [Google Scholar] [CrossRef]
- Ugazio, E.; Tullio, V.; Binello, A.; Tagliapietra, S.; Dosio, F. Ozonated Oils as Antimicrobial Systems in Topical Applications. Their Characterization, Current Applications, and Advances in Improved Delivery Techniques. Molecules 2020, 25, 334. [Google Scholar] [CrossRef] [PubMed]
- Smith, N.; Wilson, A.; Gandhi, J.; Vatsia, S.; Khan, S. Ozone Therapy: An Overview of Pharmacodynamics, Current Research, and Clinical Utility. Med. Gas Res. 2017, 7, 212. [Google Scholar] [CrossRef]
- Özyildiz, F.; Karagönlü, S.; Basal, G.; Uzel, A.; Bayraktar, O. Micro-Encapsulation of Ozonated Red Pepper Seed Oil with Antimicrobial Activity and Application to Nonwoven Fabric. Lett. Appl. Microbiol. 2013, 56, 168–179. [Google Scholar] [CrossRef]
- Beşen, B.S.; Balcı, O.; Güneşoğlu, C.; Orhan, M.; İnci Somuncuoğlu, E.; İrem Tatlı, İ. Obtaining Medical Textiles Including Microcapsules of the Ozonated Vegetable Oils. Fibers Polym. 2017, 18, 1079–1090. [Google Scholar] [CrossRef]
- Spadea, L.; Tonti, E.; Spaterna, A.; Marchegiani, A. Use of Ozone-Based Eye Drops: A Series of Cases in Veterinary and Human Spontaneous Ocular Pathologies. Ophthalmol. Case Rep. 2018, 9, 287–298. [Google Scholar] [CrossRef]
- Cutarelli, A.; Carlini, G.; Sarno, F.; Nebbioso, A.; Garofalo, F.; Altucci, L.; Corrado, F. The Role of Ozone Carried by Liposomes in the Therapy of Infectious and Skin-Regenerating Ocular Surface. J. Biomed. Sci. Eng. 2019, 12, 347–353. [Google Scholar] [CrossRef]
- Beşen, B.S.; Güneşoğlu, C.; Balci, O.; Sütçü, K. Antibacterial Finishing of 100% Cotton Fabric with with β-Cyclodextrin-Ozonated Olive Oil Inclusion Complex. AATCC J. Res. 2016, 3, 12–18. [Google Scholar] [CrossRef]
- Elshinawy, M.I.; Al-Madboly, L.A.; Ghoneim, W.M.; El-Deeb, N.M. Synergistic Effect of Newly Introduced Root Canal Medicaments; Ozonated Olive Oil and Chitosan Nanoparticles, Against Persistent Endodontic Pathogens. Front. Microbiol. 2018, 9, 1371. [Google Scholar] [CrossRef] [PubMed]
- Taghizadeh, E.; Khamesipour, A.; Basirpour, B.; Hosseini, S.A. Evaluation of the in Vitro Antileishmanial Activity of Chitosan-Coated Nanoemulsions of Ozonated Olive Oil. Ozone Sci. Eng. 2024, 46, 1–10. [Google Scholar] [CrossRef]
- Nowak, N.; Grzebieniarz, W.; Khachatryan, G.; Konieczna-Molenda, A.; Krzan, M.; Khachatryan, K. Preparation of Nano/Microcapsules of Ozonated Olive Oil in Chitosan Matrix and Analysis of Physicochemical and Microbiological Properties of the Obtained Films. Innov. Food Sci. Emerg. Technol. 2022, 82, 103181. [Google Scholar] [CrossRef]
- Ghosh, A.; Ali, M.A. Studies on Physicochemical Characteristics of Chitosan Derivatives with Dicarboxylic Acids. J. Mater. Sci. 2012, 47, 1196–1204. [Google Scholar] [CrossRef]
- Radwan-Pragłowska, J.; Janus, Ł.; Piątkowski, M.; Sierakowska, A.; Matysek, D. ZnO Nanorods Functionalized with Chitosan Hydrogels Crosslinked with Azelaic Acid for Transdermal Drug Delivery. Colloids Surf. B Biointerfaces 2020, 194, 111170. [Google Scholar] [CrossRef] [PubMed]
- Kumar, D.; Schumacher, K.; Du Fresne Von Hohenesche, C.; Grün, M.; Unger, K.K. MCM-41, MCM-48 and Related Mesoporous Adsorbents: Their Synthesis and Characterisation. Colloids Surf. A Physicochem. Engg Asp. 2001, 187–188, 109–116. [Google Scholar] [CrossRef]
- Narayan, R.; Nayak, U.; Raichur, A.; Garg, S. Mesoporous Silica Nanoparticles: A Comprehensive Review on Synthesis and Recent Advances. Pharmaceutics 2018, 10, 118. [Google Scholar] [CrossRef] [PubMed]
- Cirlini, M.; Caligiani, A.; Palla, G.; De Ascentiis, A.; Tortini, P. Stability Studies of Ozonized Sunflower Oil and Enriched Cosmetics with a Dedicated Peroxide Value Determination. Ozone Sci. Eng. 2012, 34, 293–299. [Google Scholar] [CrossRef]
- Zou, J.; Cai, H.; Wang, D.; Xiao, J.; Zhou, Z.; Yuan, B. Spectrophotometric Determination of Trace Hydrogen Peroxide via the Oxidative Coloration of DPD Using a Fenton System. Chemosphere 2019, 224, 646–652. [Google Scholar] [CrossRef] [PubMed]
- Travagli, V.; Zanardi, I.; Valacchi, G.; Bocci, V. Ozone and Ozonated Oils in Skin Diseases: A Review. Mediat. Inflamm. 2010, 2010, 1–9. [Google Scholar] [CrossRef] [PubMed]
- Günaydın, Y.; Sevim, H.; Tanyolaç, D.; Gürpınar, Ö.A. Ozonated Olive Oil with a High Peroxide Value for Topical Applications: In-Vitro Cytotoxicity Analysis with L929 Cells. Ozone Sci. Eng. 2018, 40, 37–43. [Google Scholar] [CrossRef]
- Moureu, S.; Violleau, F.; Ali Haimoud-Lekhal, D.; Calmon, A. Influence of Storage Temperature on the Composition and the Antibacterial Activity of Ozonized Sunflower Oil. Ozone Sci. Eng. 2016, 38, 143–149. [Google Scholar] [CrossRef]
- Jacinto, G.S.; Benvenutti, L.; Santin, J.R.; De Freitas, R.A.; Bella Cruz, A.; Corrêa, R.; Malheiros, A.; Klein-Junior, L.C.; Bresolin, T.M.B. The Effect of Ozone Dosage of Sunflower and Olive Oils on Their Biological Activities and Chemical Properties. Ozone Sci. Eng. 2023, 45, 1–20. [Google Scholar] [CrossRef]
- Rastinfard, A.; Dalisson, B.; Barralet, J. Aqueous Decomposition Behavior of Solid Peroxides: Effect of pH and Buffer Composition on Oxygen and Hydrogen Peroxide Formation. Acta Biomater. 2022, 145, 390–402. [Google Scholar] [CrossRef] [PubMed]


| CH (%) | AZA (%) | Si@ (%) | OZ (%) | TW80 (%) | |
|---|---|---|---|---|---|
| CH-MS | 85 | 15 | - | - | - |
| Si@OZ | - | - | 70 | 30 | - |
| CH-MS-OZ | 58.60 | 10.35 | - | 10.35 | 20.70 |
| CH-MS-Si@OZ | 53.12 | 9.37 | 26.25 | 11.25 | - |
| D10 | d50 | d90 | Surface Area m2/g | Zeta Potential mV | Swelling % | Degradation % | |
|---|---|---|---|---|---|---|---|
| µm | |||||||
| Si@ | 0.54 | 0.12 | 3.61 | 773.2 | −20.0 ± 0.5 | - | - |
| Si@OZ | 1.25 | 3.91 | 17.80 | 182.4 | −23.2 ± 0.3 | - | - |
| CH-MS | 4.40 | 10.61 | 20.76 | - | +26.4 ± 0.7 | 379 ± 12 | 81.7 ± 2.5 |
| CH-MS-OZ | 16.88 | 38.37 | 75.05 | - | +18.0 ± 0.8 | 197 ± 25 | 75.5 ± 3.5 |
| CH-MS-Si@OZ | 4.84 | 26.92 | 52.10 | - | +19.3 ± 0.5 | 150 ± 10 | 56.0 ± 1.9 |
| PV * meq × kg−1 | % OZ Calculated | % OZ Theoretical | % EE | |
|---|---|---|---|---|
| OZ | 2156 ± 7.2% | 100.0 | - | - |
| Si@OZ | 524 ± 14.3% | 24.3 | 30.0 | 81.0 |
| CH-MS-OZ | 169 ± 7.8% | 7.8 | 10.3 | 75.7 |
| CH-MS-Si@OZ | 198 ± 10.5% | 9.2 | 11.2 | 82.1 |
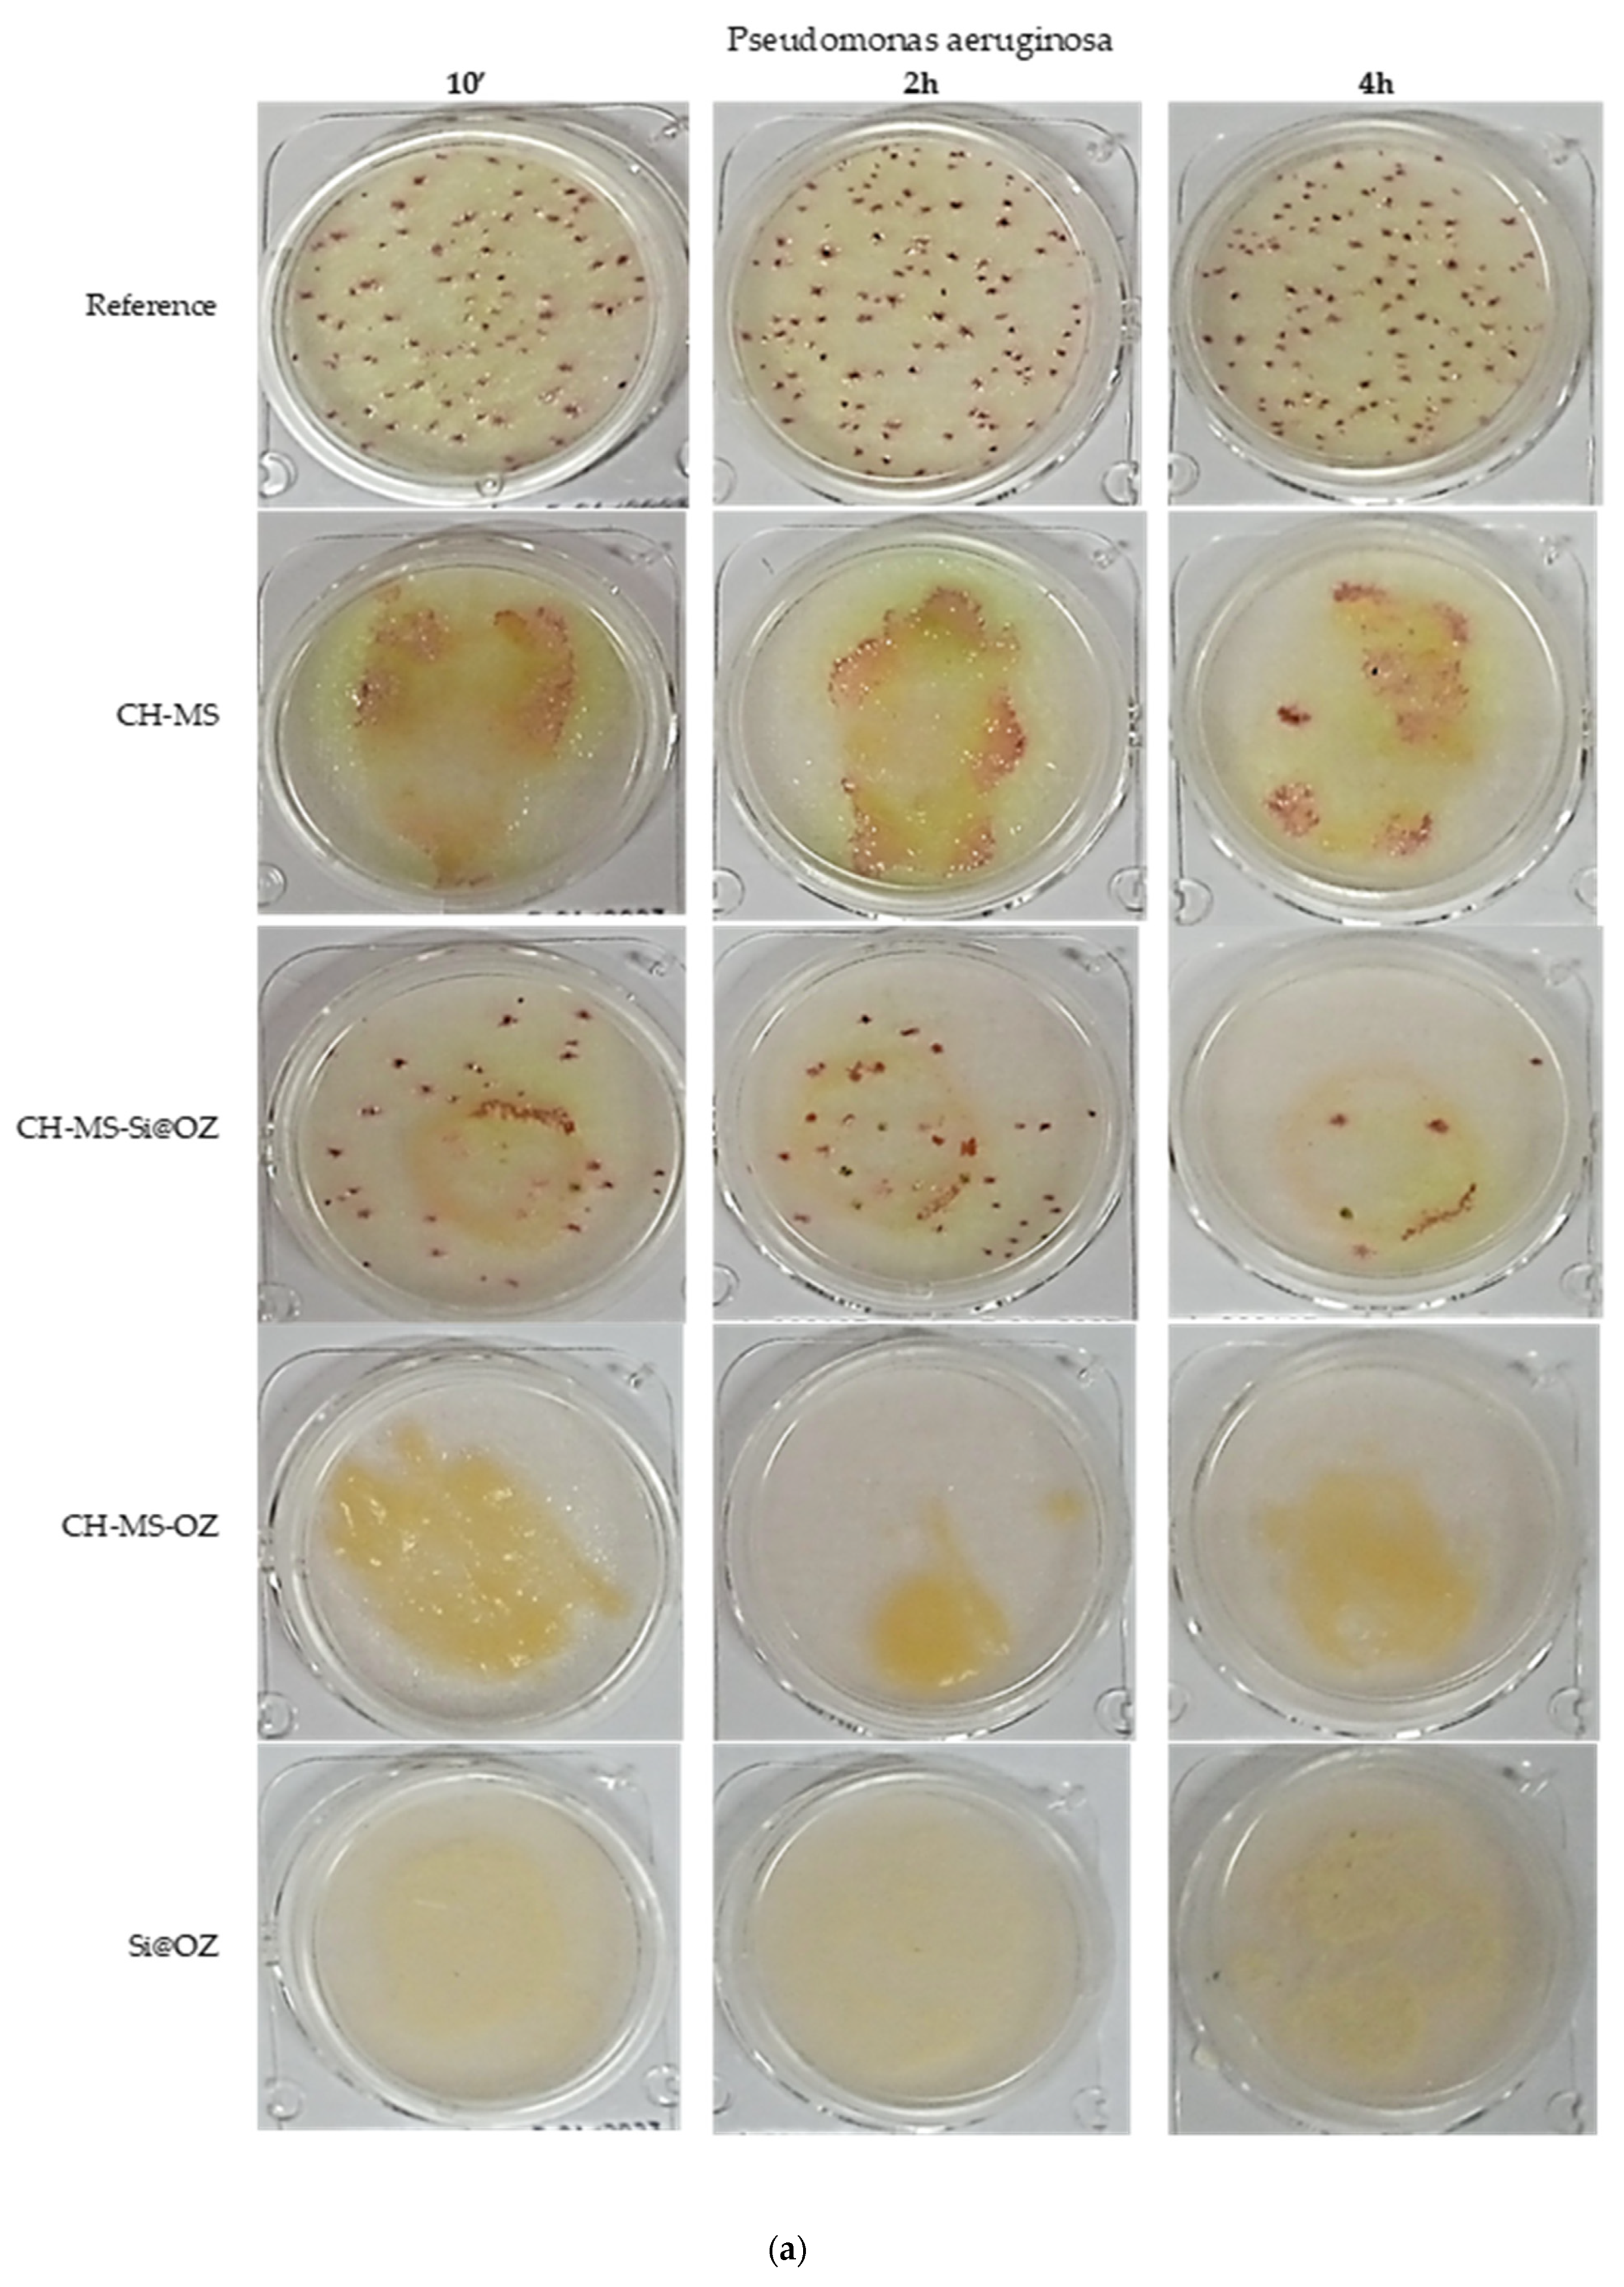
| Sample | UFC 10′ | % Inhibition | UFC 2 h | % Inhibition | UFC 4 h | % Inhibition |
|---|---|---|---|---|---|---|
| Pseudomonas aeruginosa | ||||||
| Reference | 91 | 0% | 107 | 0% | 101 | 0% |
| CH-MS | 30 | 67% | 40 | 63% | 40 | 60% |
| CH-MS-Si@OZ | 40 | 56% | 33 | 69% | 8 | 92% |
| C-MS-OZ | 0 | 100% | 0 | 100% | 0 | 100% |
| Si@OZ | 0 | 100% | 0 | 100% | 0 | 100% |
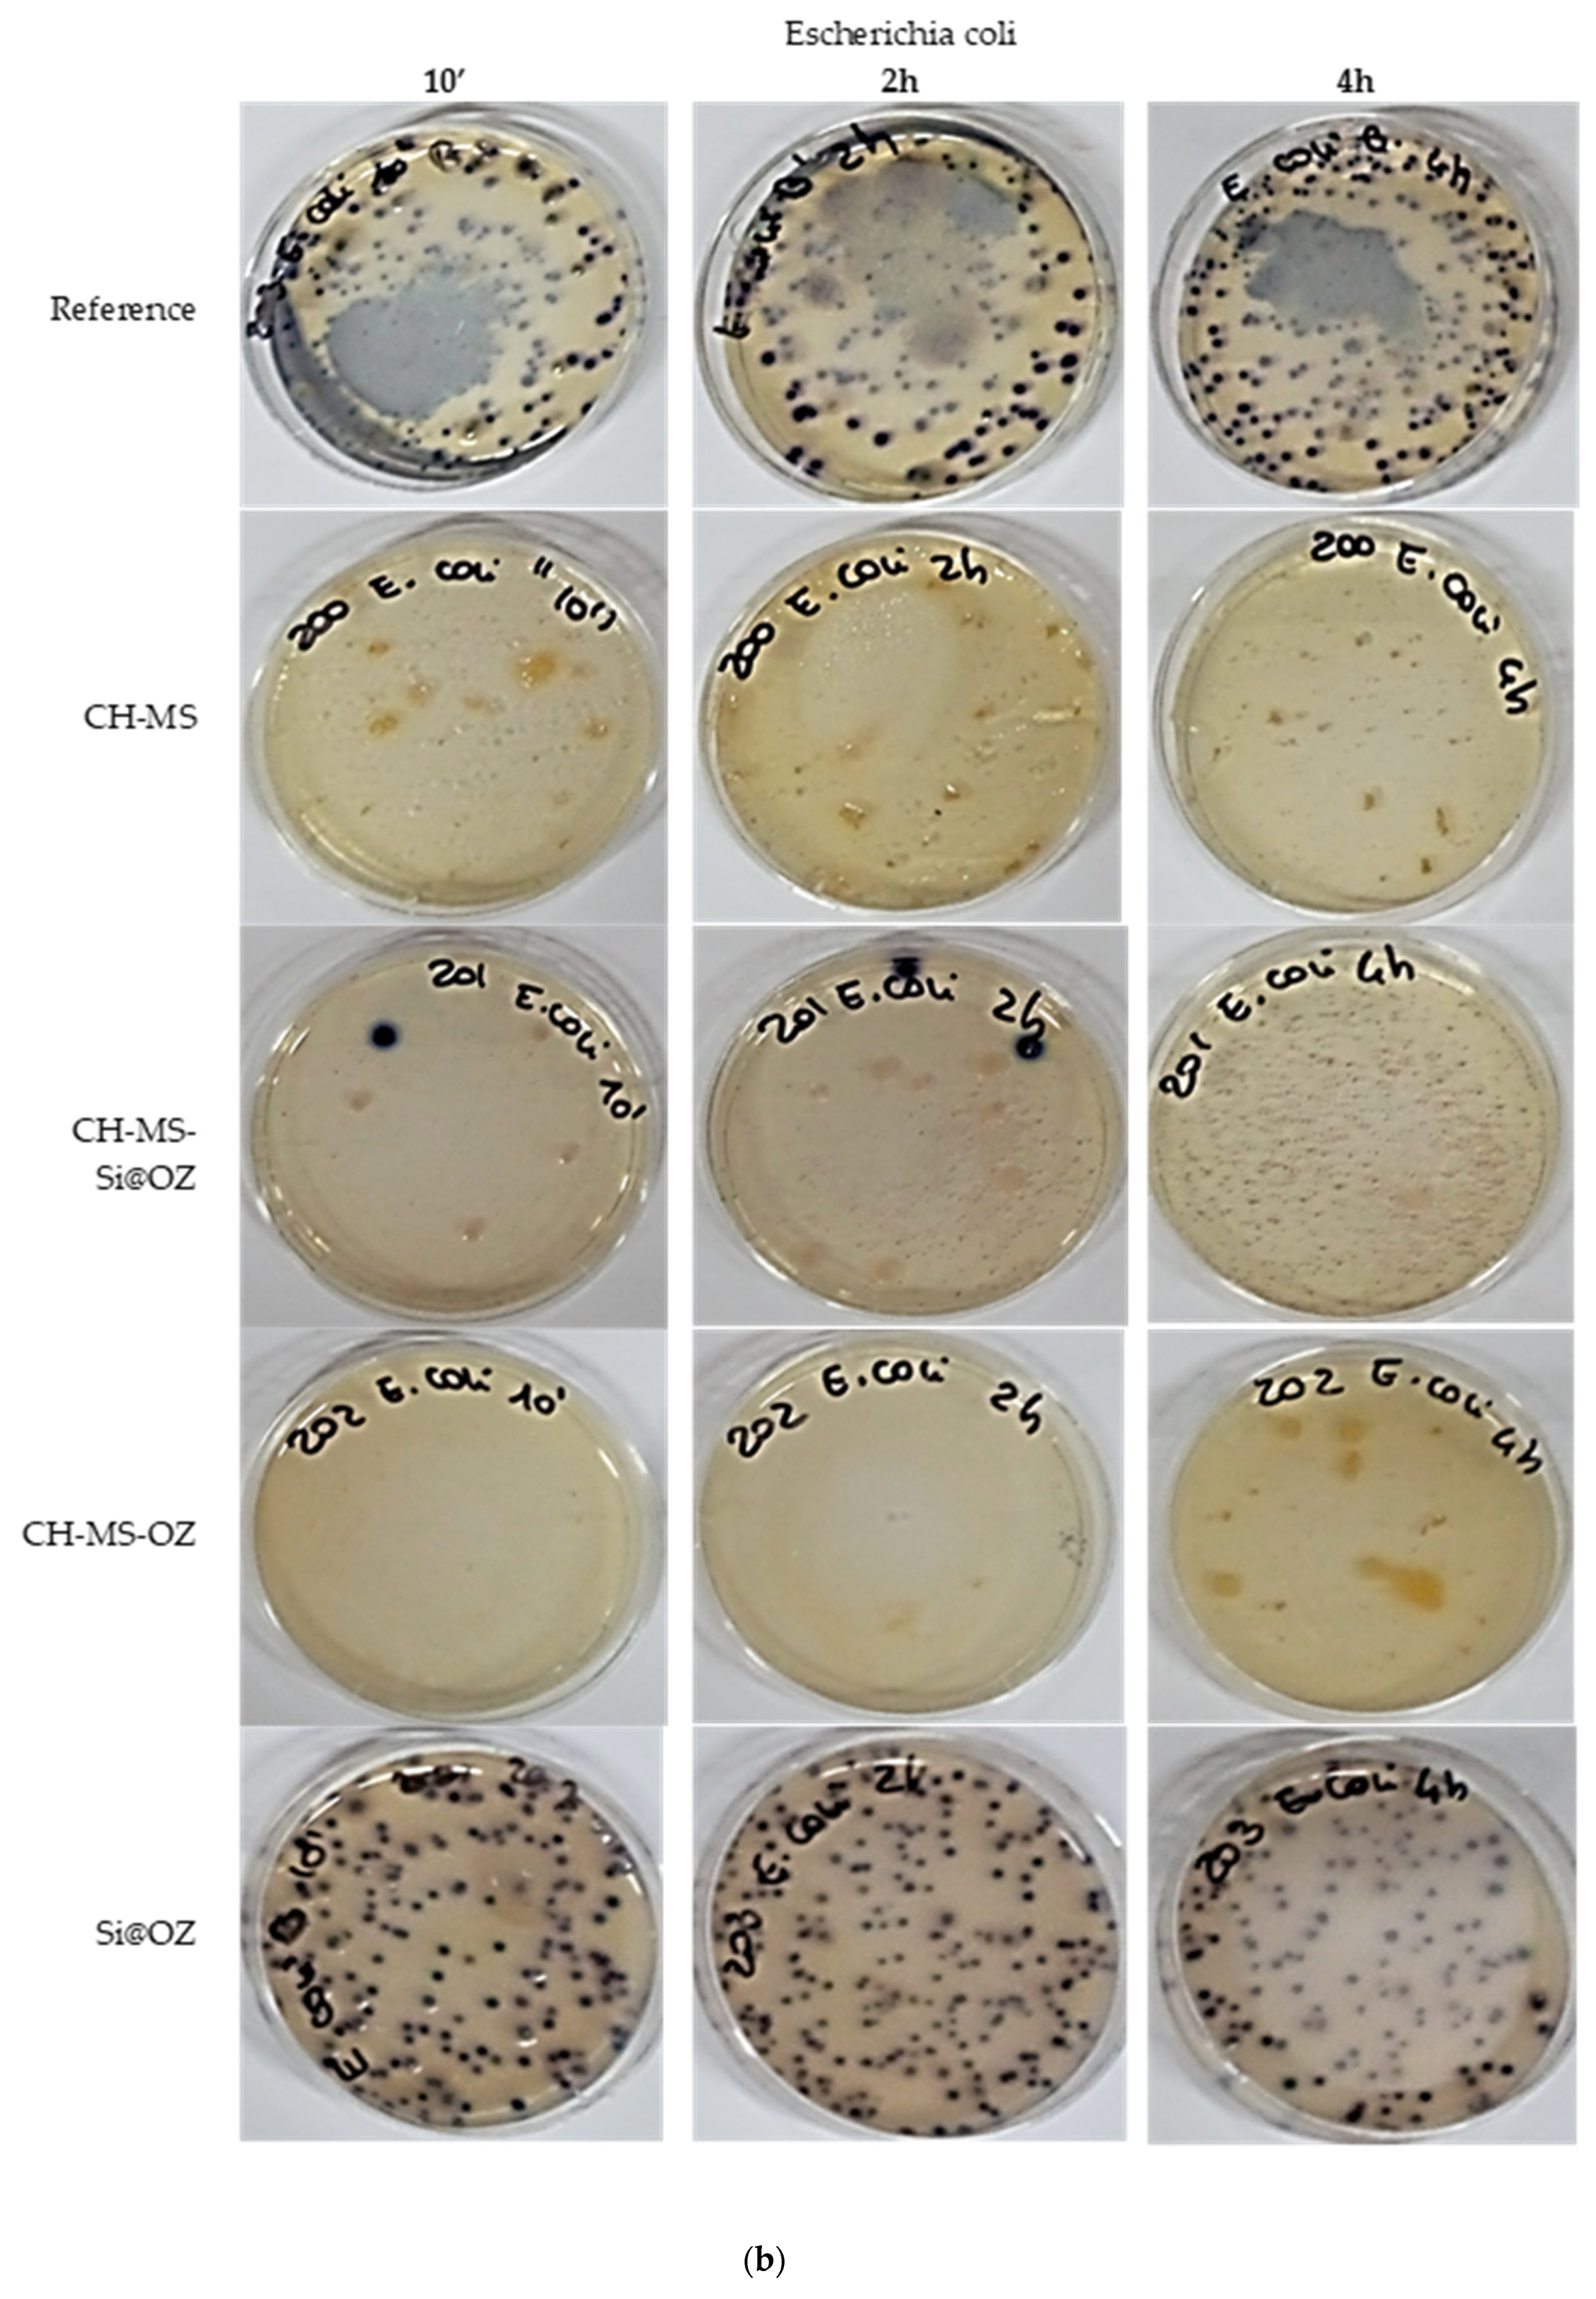
| Escherichia coli | ||||||
| Reference | 182 | 0% | 150 | 0% | 233 | 0% |
| CH-MS | 0 | 100% | 0 | 100% | 0 | 100% |
| CH-MS-Si@OZ | 1 | 99% | 2 | 99% | 0 | 100% |
| CH-MS-OZ | 0 | 100% | 0 | 100% | 0 | 100% |
| Si@OOZ | 161 | 12% | 94 | 37% | 131 | 44% |
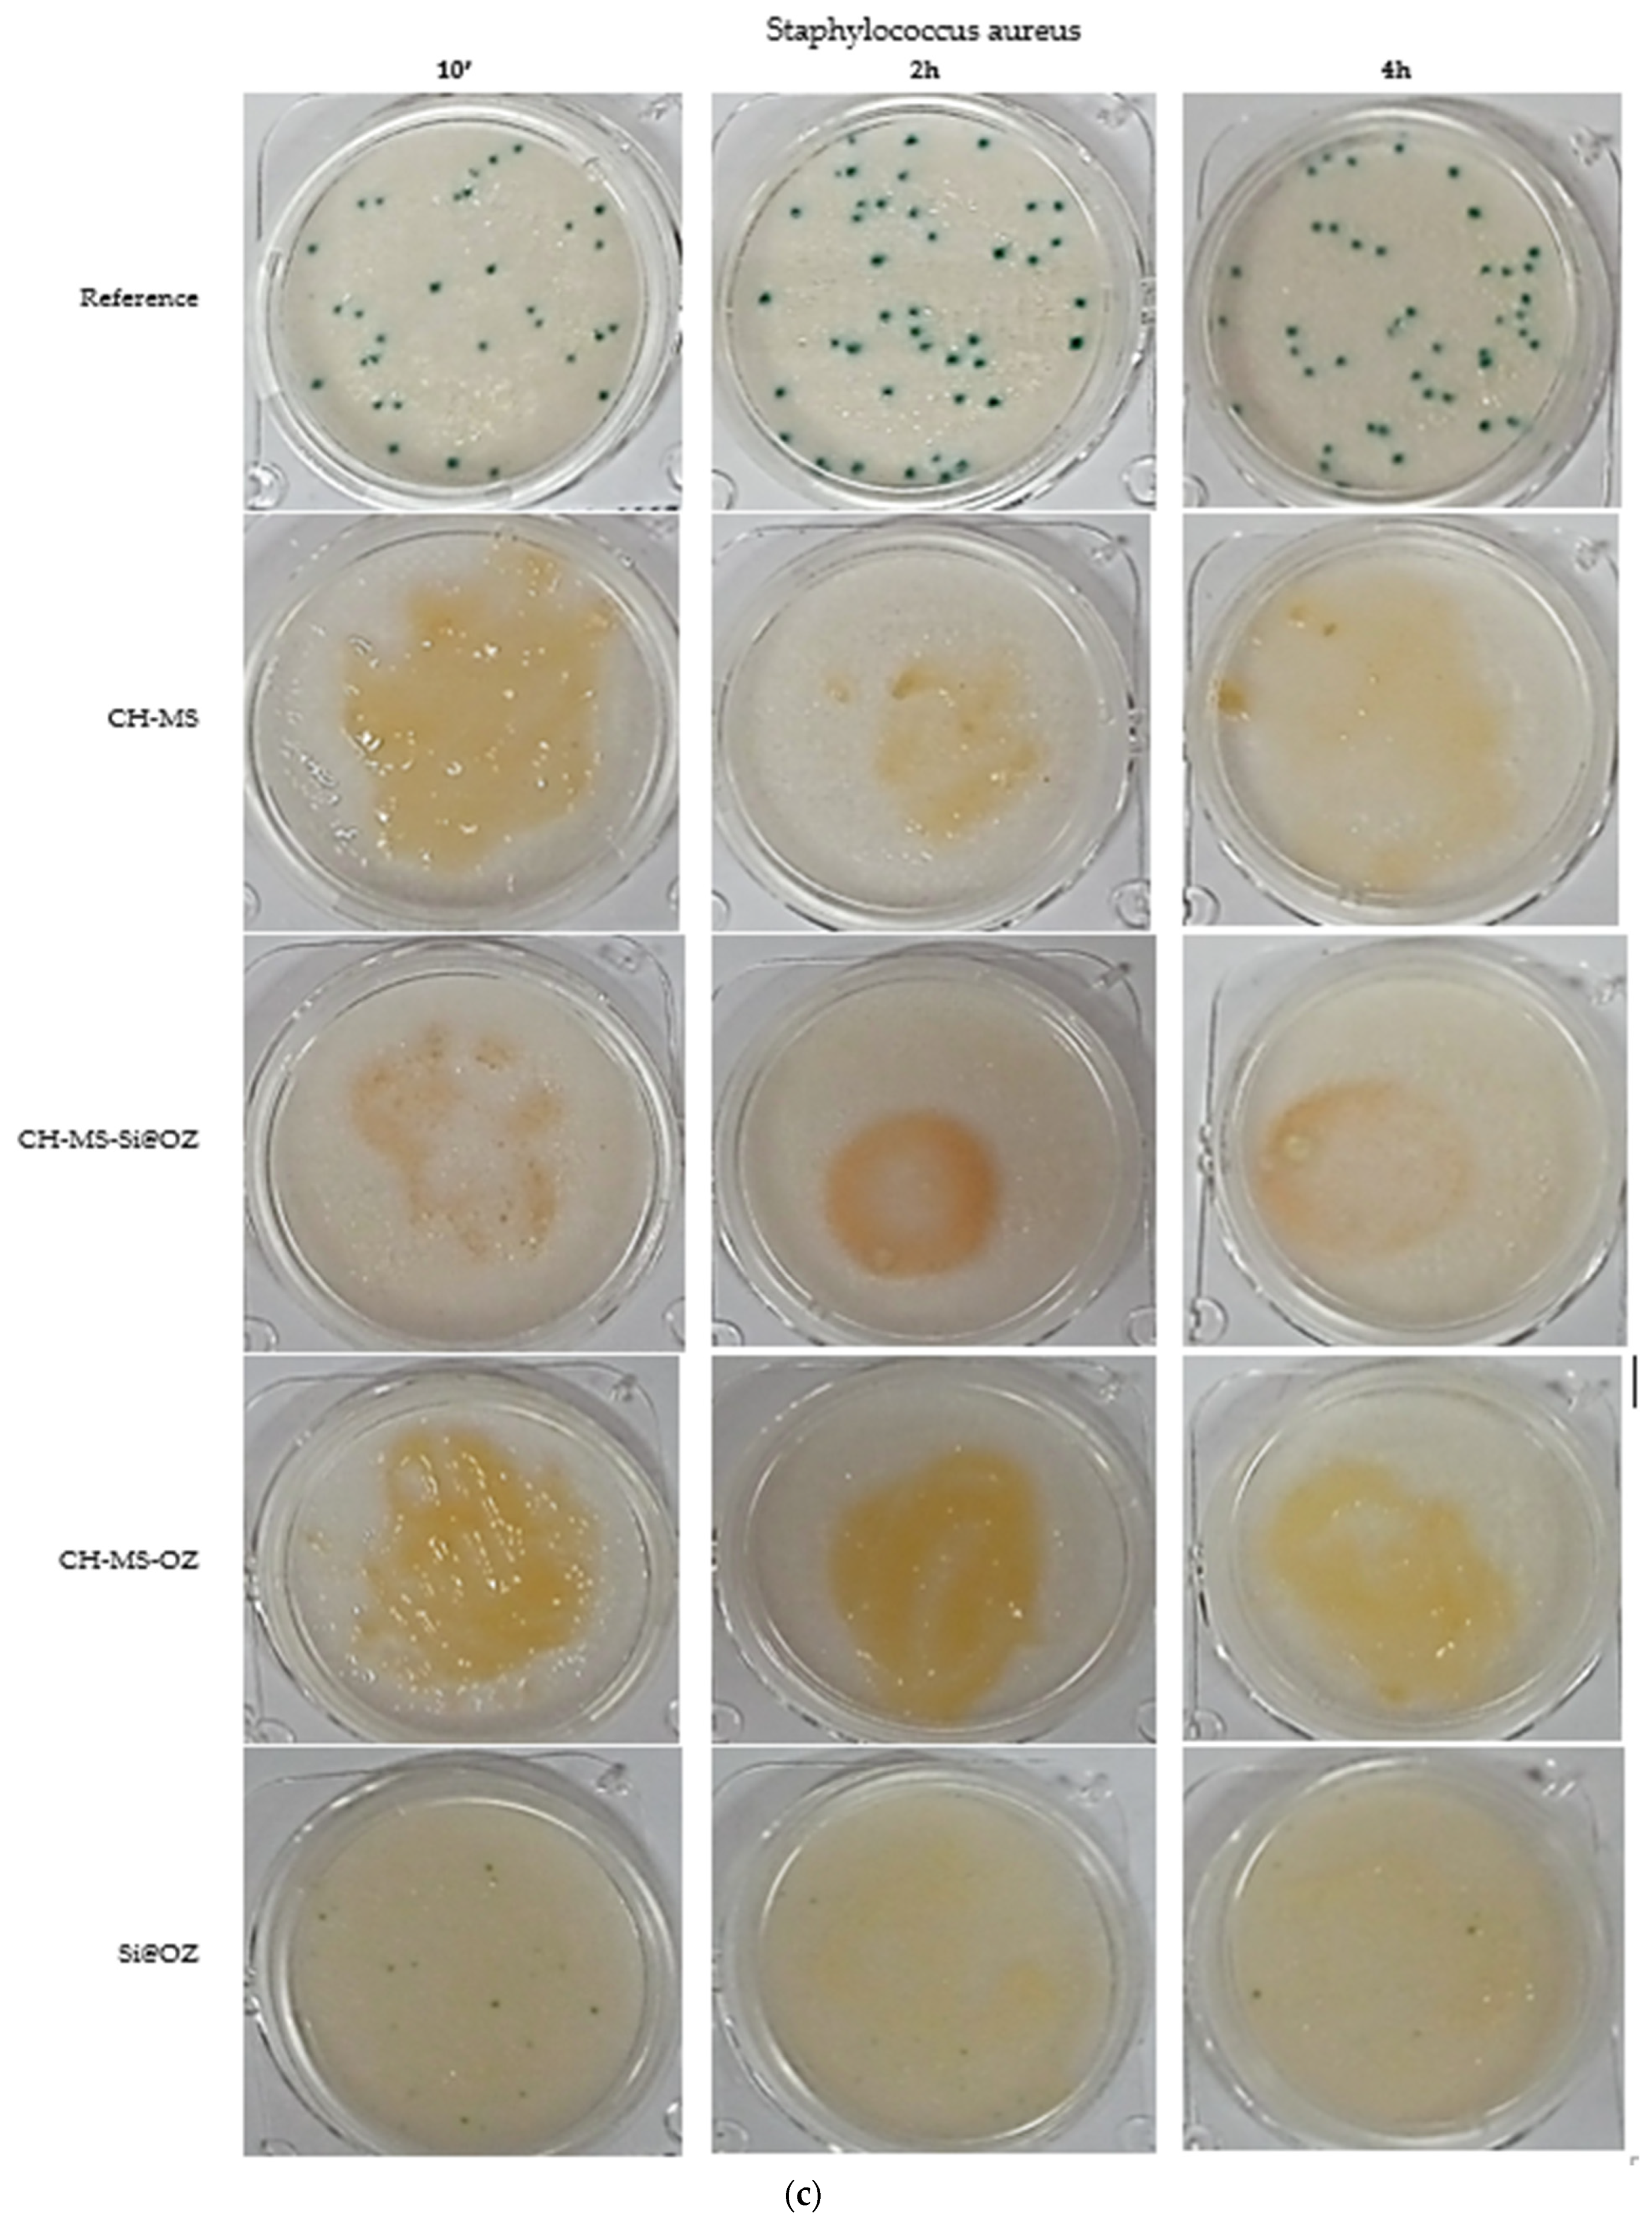
| Staphylococcus aureus | ||||||
| Reference | 31 | 0% | 41 | 0% | 45 | 0% |
| CH-MS | 0 | 100% | 0 | 100% | 0 | 100% |
| CH-MS-Si@OZ | 4 | 87% | 12 | 71% | 6 | 87% |
| CH-MS-OOZ | 0 | 100% | 0 | 100% | 0 | 100% |
| Si@OZ | 20 | 35% | 14 | 66% | 15 | 67% |
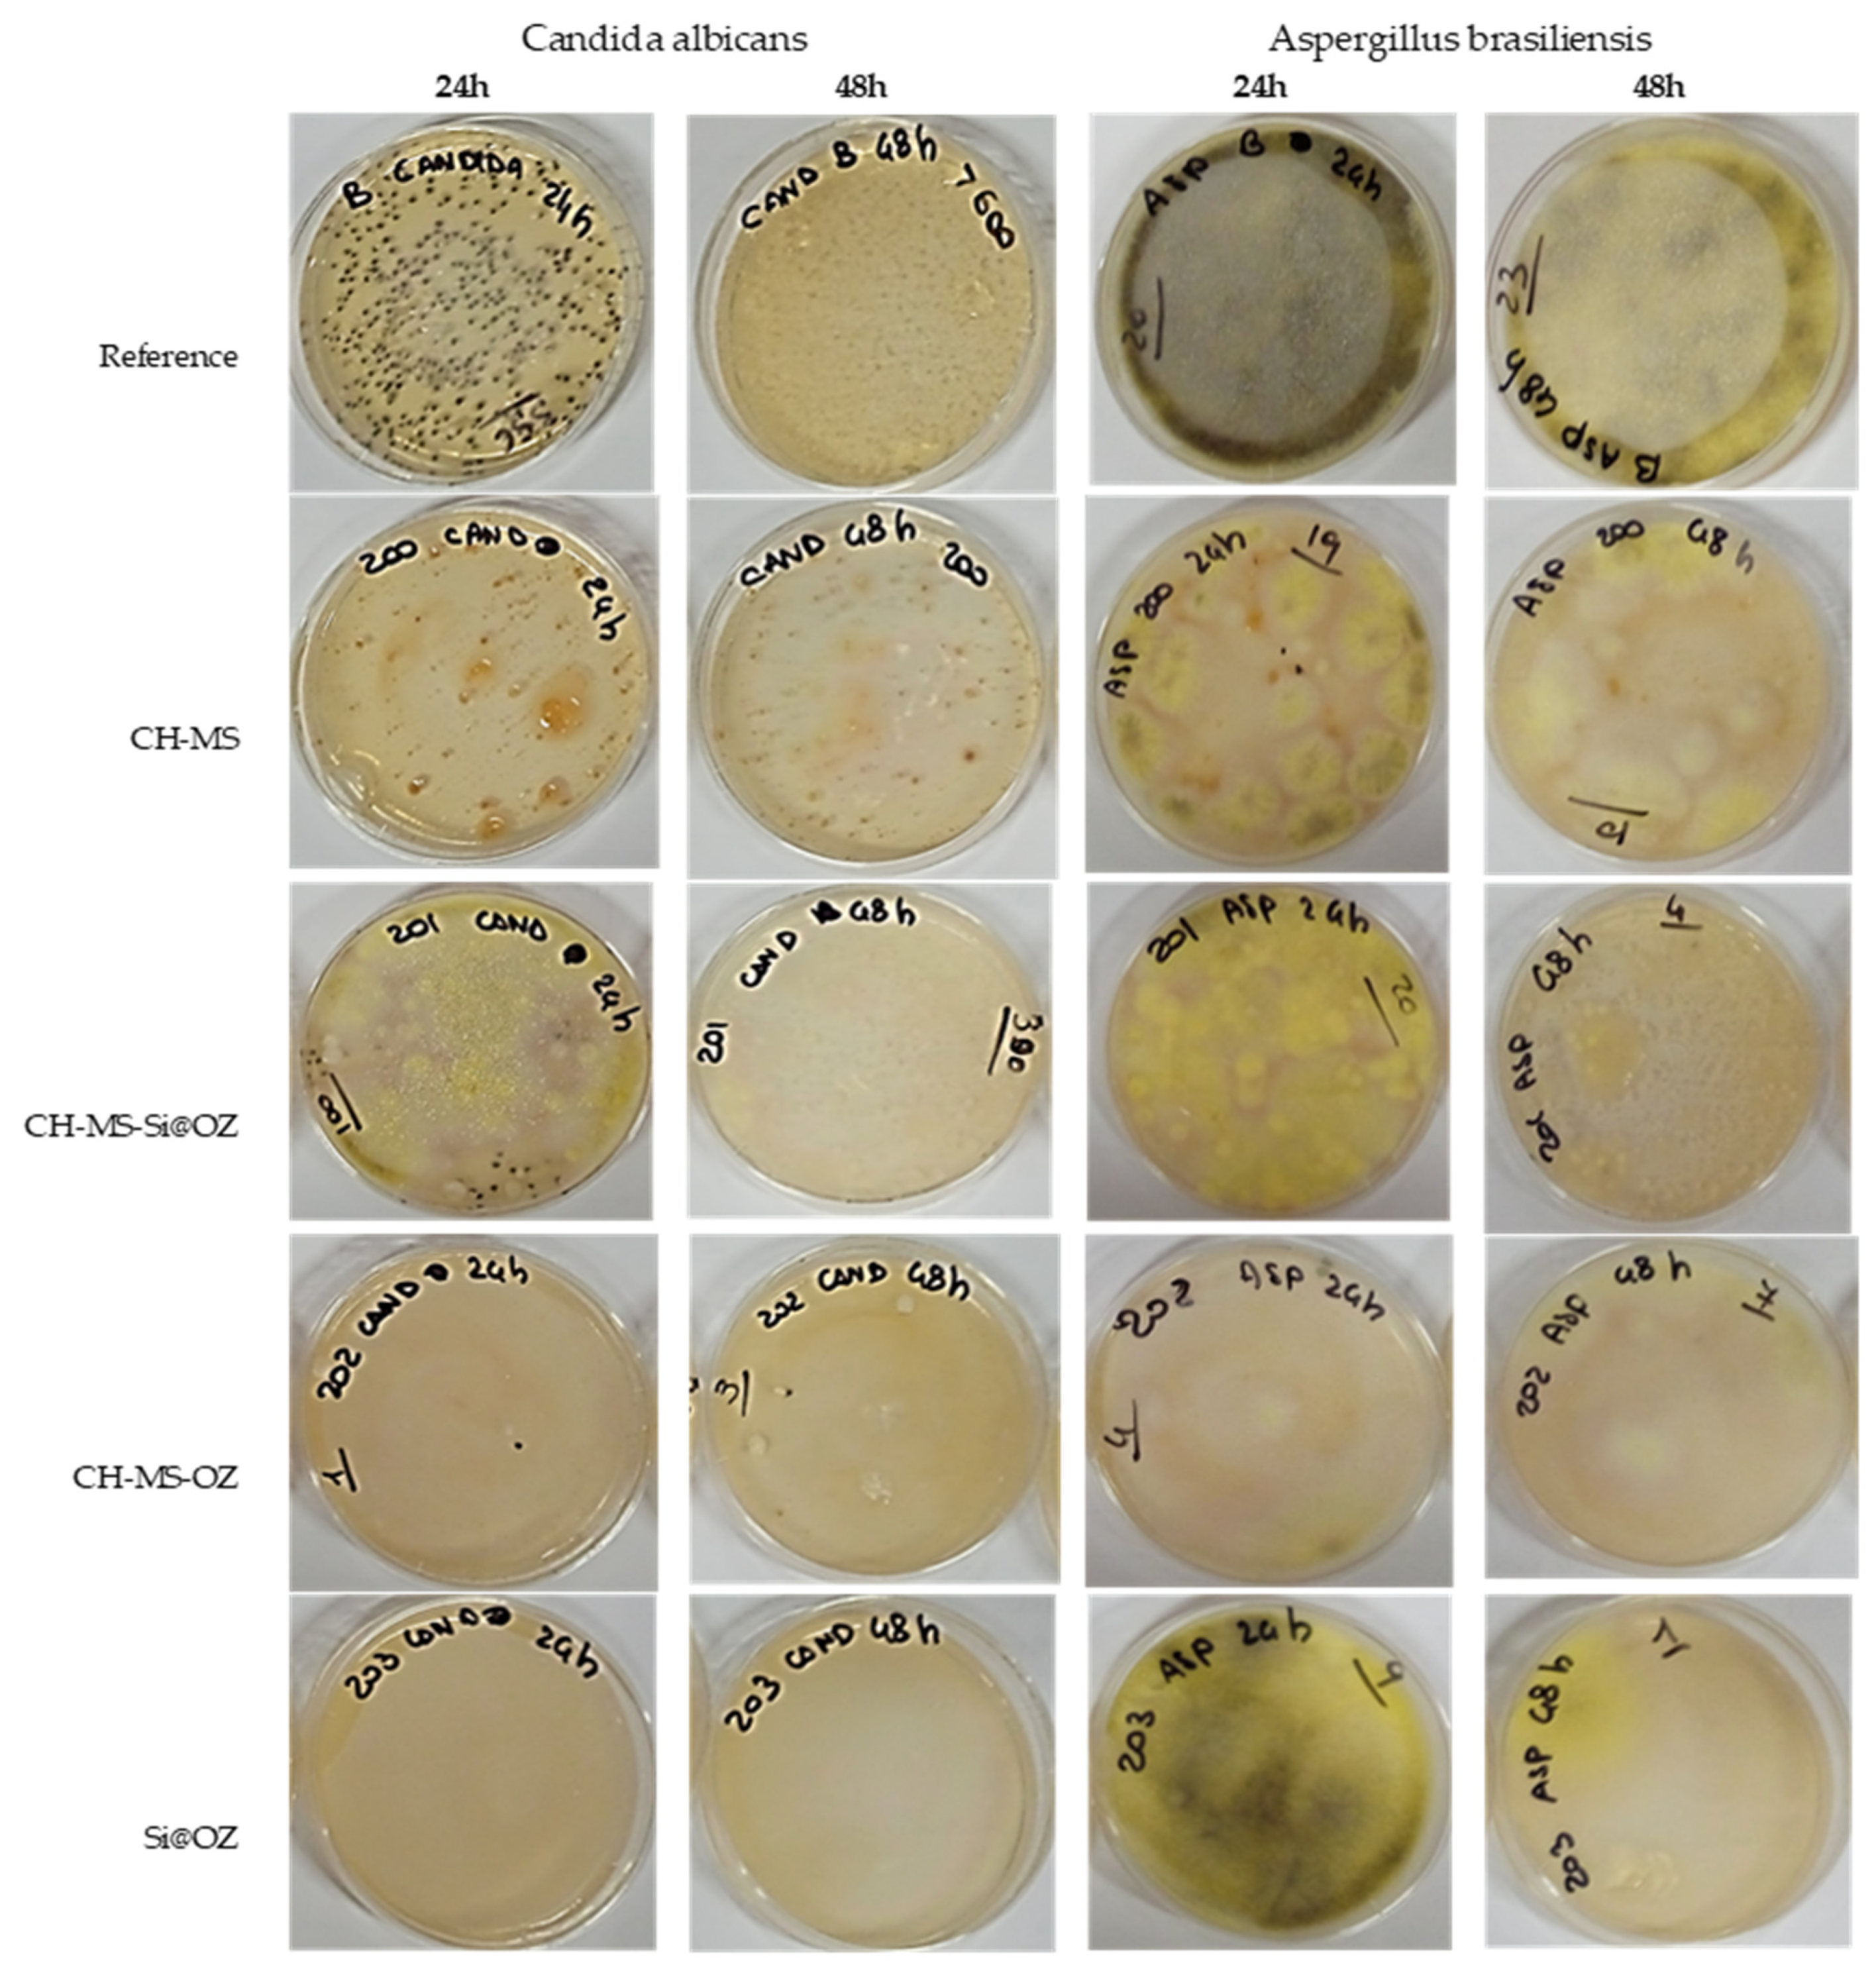
| UFC 30′ | % Inh * | UFC 4 h | % Inh * | UFC 15 h | % Inh * | UFC 24 h | % Inh * | UFC 48 h | % Inh * | |
|---|---|---|---|---|---|---|---|---|---|---|
| Candida albicans | ||||||||||
| Reference | 242 | 0% | 200 | 0% | 200 | 0% | 356 | 0% | >400 | 0% |
| C-MS | 1 | 100% | 8 | 96% | 1 | 100% | 0 | 100% | 0 | 100% |
| C-MS-Si@OOZ | 30 | 88% | 28 | 86% | 50 | 75% | 100 | 72% | 300 | 25% |
| C-MS-OOZ | 31 | 87% | 8 | 96% | 0 | 100% | 1 | 100% | 3 | 99% |
| Si@OOZ | 133 | 45% | 21 | 90% | 0 | 100% | 0 | 100% | 0 | 100% |
| Aspergillus brasiliensis | ||||||||||
| Reference | 32 | 0% | 22 | 0% | 24 | 0% | 22 | 0% | 23 | 0% |
| C-MS | 10 | 69% | 13 | 41% | 15 | 38% | 15 | 32% | 10 | 57% |
| C-MS-Si@OOZ | 11 | 66% | 19 | 14% | 16 | 33% | 10 | 55% | 4 | 83% |
| C-MS-OOZ | 26 | 19% | 17 | 23% | 3 | 88% | 4 | 82% | 7 | 70% |
| Si@OOZ | 28 | 13% | 7 | 68% | 8 | 67% | 9 | 59% | 1 | 96% |
Disclaimer/Publisher’s Note: The statements, opinions and data contained in all publications are solely those of the individual author(s) and contributor(s) and not of MDPI and/or the editor(s). MDPI and/or the editor(s) disclaim responsibility for any injury to people or property resulting from any ideas, methods, instructions or products referred to in the content. |
© 2024 by the authors. Licensee MDPI, Basel, Switzerland. This article is an open access article distributed under the terms and conditions of the Creative Commons Attribution (CC BY) license (https://creativecommons.org/licenses/by/4.0/).
Share and Cite
Spogli, R.; Faffa, C.; Ambrogi, V.; D’Alessandro, V.; Pastori, G. Ozonated Sunflower Oil Embedded within Spray-Dried Chitosan Microspheres Cross-Linked with Azelaic Acid as a Multicomponent Solid Form for Broad-Spectrum and Long-Lasting Antimicrobial Activity. Pharmaceutics 2024, 16, 502. https://doi.org/10.3390/pharmaceutics16040502
Spogli R, Faffa C, Ambrogi V, D’Alessandro V, Pastori G. Ozonated Sunflower Oil Embedded within Spray-Dried Chitosan Microspheres Cross-Linked with Azelaic Acid as a Multicomponent Solid Form for Broad-Spectrum and Long-Lasting Antimicrobial Activity. Pharmaceutics. 2024; 16(4):502. https://doi.org/10.3390/pharmaceutics16040502
Chicago/Turabian StyleSpogli, Roberto, Caterina Faffa, Valeria Ambrogi, Vincenzo D’Alessandro, and Gabriele Pastori. 2024. "Ozonated Sunflower Oil Embedded within Spray-Dried Chitosan Microspheres Cross-Linked with Azelaic Acid as a Multicomponent Solid Form for Broad-Spectrum and Long-Lasting Antimicrobial Activity" Pharmaceutics 16, no. 4: 502. https://doi.org/10.3390/pharmaceutics16040502
APA StyleSpogli, R., Faffa, C., Ambrogi, V., D’Alessandro, V., & Pastori, G. (2024). Ozonated Sunflower Oil Embedded within Spray-Dried Chitosan Microspheres Cross-Linked with Azelaic Acid as a Multicomponent Solid Form for Broad-Spectrum and Long-Lasting Antimicrobial Activity. Pharmaceutics, 16(4), 502. https://doi.org/10.3390/pharmaceutics16040502