
Predicting ADMET Properties from Molecule SMILE: A Bottom-Up Approach Using Attention-Based Graph Neural Networks


Abstract
1. Introduction
2. Materials and Methods
2.1. Molecular Graph Representation
2.2. Graph Neural Networks (GNNs)
- Module 1: Layers 1–5 focus on molecular substructures. The first four layers are characterized by four independent and parallel branches, each considering an adjacency matrix , with , that represents a particular substructure of the molecule as defined in Section 2.1. Each branch k uses its adjacency structure, , to remap into a different feature space the input node feature matrix , which was built by concatenating the one-hot representations of the atomic characteristics in Table 1. Thus, after Layer 4, four new node feature matrices, , are obtained. Each provides a latent representation of the original feature matrix by considering a specific molecular substructure represented through the adjacency matrix . The projection of into through is performed by each branch combining two multi-head attention layers (MHALs), located in both Layer 1 and 3, with the operations of concatenation (Layer 2) and averaging (Layer 3). A more detailed description of these layers is reported in Section 2.2.1. The outputs of all four branches are then combined into Layer 5 with a masked sum (Section 2.2.2) to obtain a new node feature matrix that merges the information coming from the different substructures.
- Module 2: Layers 6–8 consider the whole molecular structure. The inputs of this module are and , the latter being the adjacency matrix built considering all bond types simultaneously. and are fed into another MHAL (Layer 6) whose outputs are then concatenated (Layer 7), leading to new node feature matrix . Finally, Layer 8 projects into a P-dimensional space the node feature matrix and then squeezes it into a vector representing the graph-level features.
2.2.1. Multi-Head Attention Layer
2.2.2. Masked Sum Layer
2.2.3. Global Attention Pooling Layer
2.3. Benchmark Datasets
2.4. Evaluation of GNN Framework
2.5. Custom Training Loss Functions
2.5.1. Weighted RMSE
2.5.2. Weighted Binary Cross Entropy
2.6. Validation Set Metrics

| Reference | Model | Metrics | Evaluation Strategy |
|---|---|---|---|
| Lipophilicity | |||
| Zhang et al. [56] | BERT transformer adapted to molecular graph structures (MG-BERT) | R2 | The model was trained 10 times using random dataset splits, and the final performance was reported as the average with standard deviation. |
| Wang et al. [57] | Convolutional GNN integrated with feed-forward neural networks (FNNs) processing molecular fingerprints | MAE | Holdout (70%:30%) |
| Peng et al. [26] | Convolutional GNN based on graph isomorphism [58] | RMSE | 5-fold CV on 85% of samples, with the remaining used as an external test set. Each comparison was conducted 20 times, and the final result was the average. |
| Tang et al. [59] | Graph-based encoder integrated with FNN | RMSE | 10-fold CV (80%:10%:10%). All experiments were repeated three times with different random seeds. |
| Li et al. [60] | Adaptation of LSTM-based model originally developed for natural language processing tasks | RMSE | All the models were evaluated on the test sets using 10 randomly seeded 80:10:10 data splits. |
| AcqSol | |||
| Xiong et al. [61] | Graph attention neural network processing the entire molecular structure | MAE | TDC-style. |
| Francoeur et al. [62] | Molecular attention transformer presented in [63] | RMSE | 3-fold clustered cross-validation split of the data |
| Yang et al. [64] | Graph neural networks | MAE | TDC-style. |
| Venkatraman et al. [65] | Random forests using molecular fingerprints to represent compounds and SMOTE data augmentation | RMSE | Training–test (80/20). On the training test, 5-fold CV to identify the best performing model. Each comparison was run 3 times, and its final experiment result was the average. |
| CYP | |||
| Plonka et al. [66] | Random forest and molecular fingerprints to represent compounds | AUROC | 10-fold CV on 80% of data and data augmentation. 20% of data used as test set. |
| Xiang et al. [67] | FNN processing molecular fingerprint descriptors of a compound. | AUROC | Holdout with different datasets. |
| Metric | Reference | Median | Standard Deviation |
|---|---|---|---|
| Lipophilicity | |||
| MAE | This work | 0.422 | 0.019 |
| Wang et al. [57] | 0.440 | - | |
| RMSE | This work | 0.576 | 0.031 |
| Wang et al. [57] | 0.738 | - | |
| Peng et al. [26] | 0.586 | 0.015 | |
| Tang et al. [59] | 0.571 | 0.032 | |
| Li et al. [60] | 0.625 | 0.032 | |
| R2 | This work | 0.774 | 0.031 |
| Zhang et al. [56] | 0.765 | 0.026 | |
| Wang et al. [57] | 0.766 | - | |
| AqSol | |||
| MAE | This work | 0.749 | 0.020 |
| Xiong et al. [61] | 0.776 | 0.008 | |
| Yang et al. [64] | 0.762 | 0.020 | |
| Venkatraman et al. [65] | 0.780 | - | |
| RMSE | This work | 1.14 | 0.050 |
| Francoeur et al. [62] | 1.459 | - | |
| Venkatraman et al. [65] | 1.12 | - | |
| R2 | This work | 0.767 | 0.023 |
| Venkatraman et al. [65] | 0.78 | - | |
| CYP P450 2C9 | |||
| AUROC | This work | 0.894 | 0.009 |
| Plonka et al. [66] | 0.91 | - | |
| Xiang et al. [67] | 0.799 | - | |
| AUPRC | This work | 0.01 | |
| CYP P450 2C19 | |||
| AUROC | This work | 0.882 | 0.006 |
| Plonka et al. [66] | 0.89 | - | |
| Xiang et al. [67] | 0.832 | - | |
| AUPRC | This work | 0.859 | 0.008 |
| CYP P450 2D6 | |||
| AUROC | This work | 0.862 | 0.008 |
| Plonka et al. [66] | 0.92 | - | |
| Xiang et al. [67] | 0.878 | - | |
| AUPRC | This work | 0.676 | 0.014 |
| CYP P450 3A4 | |||
| AUROC | This work | 0.887 | 0.011 |
| Plonka et al. [66] | 0.92 | - | |
| Xiang et al. [67] | 0.929 | - | |
| AUPRC | This work | 0.842 | 0.014 |
2.7. Benchmarking Methods
2.8. Implementation and Code Availability
3. Results
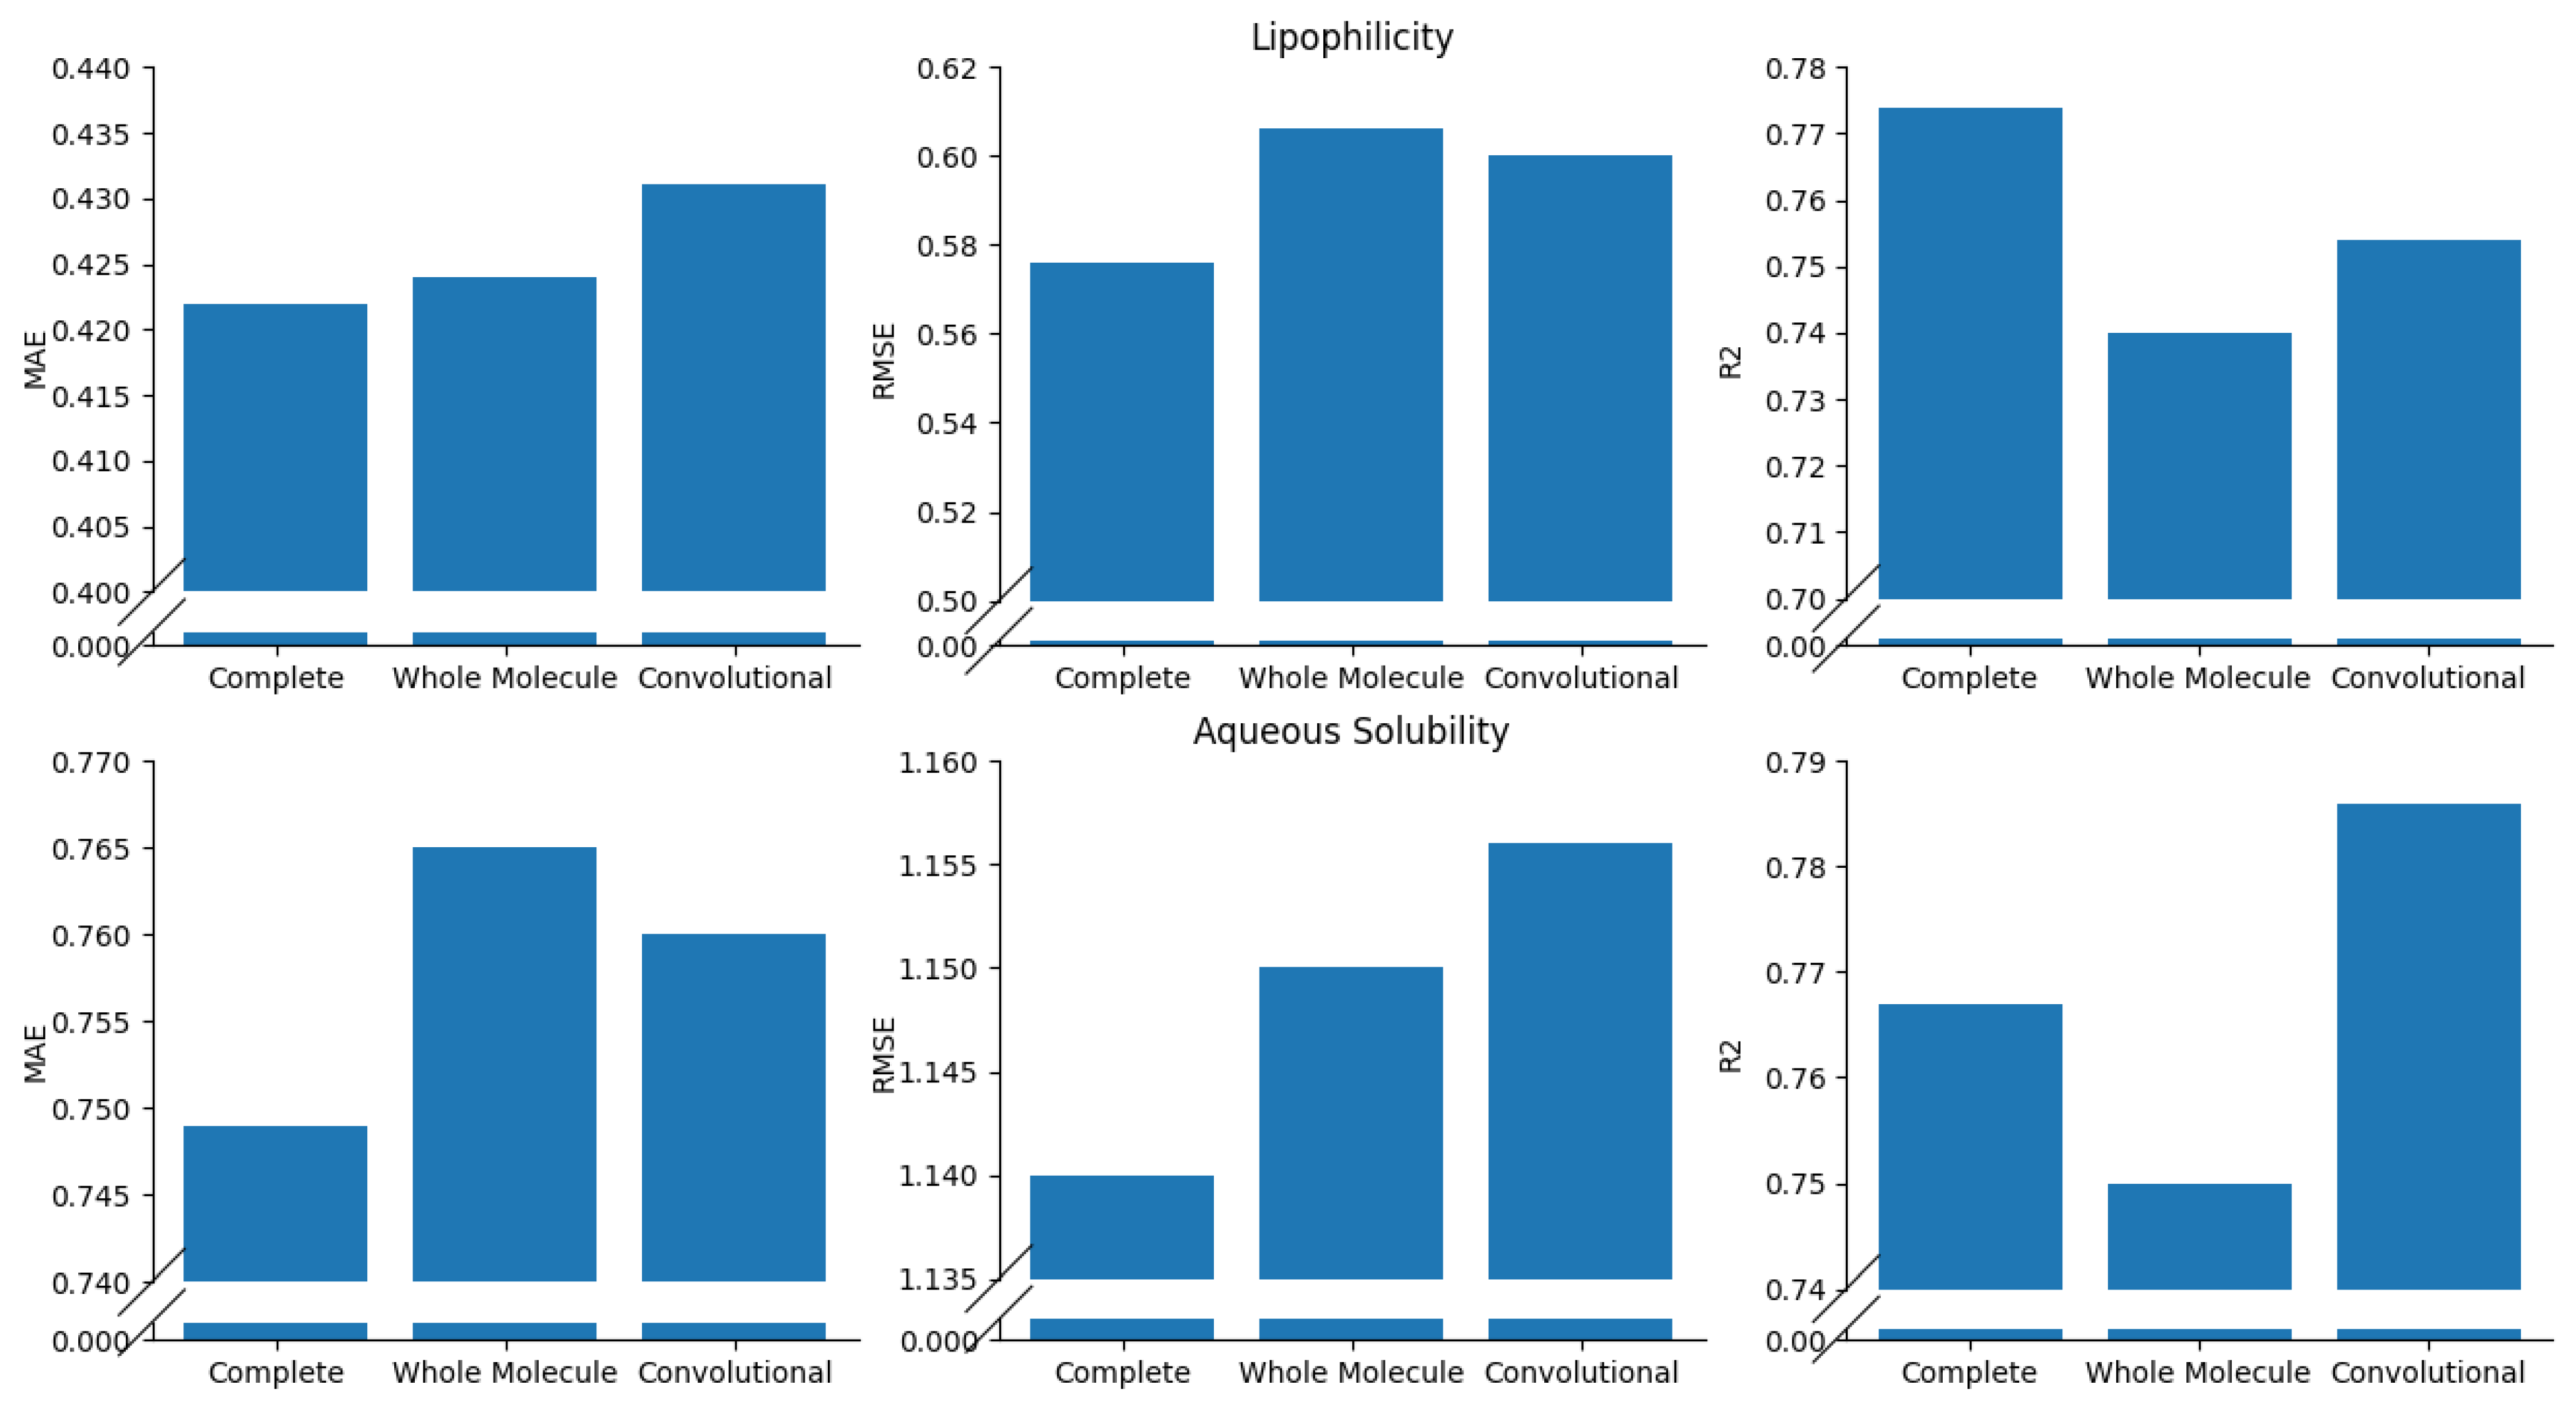
Ablation Study
4. Discussion
5. Conclusions
Supplementary Materials
Author Contributions
Funding
Institutional Review Board Statement
Informed Consent Statement
Data Availability Statement
Conflicts of Interest
Appendix A
| Fold | RMSE | MAE | R2 |
|---|---|---|---|
| 1 | 0.557 | 0.391 | 0.782 |
| 2 | 0.558 | 0.404 | 0.791 |
| 3 | 0.608 | 0.436 | 0.733 |
| 4 | 0.626 | 0.433 | 0.732 |
| 5 | 0.577 | 0.422 | 0.774 |
| Mean | 0.585 | 0.417 | 0.762 |
| Median | 0.576 | 0.422 | 0.774 |
| SD | 0.031 | 0.019 | 0.028 |
| Fold | RMSE | MAE | R2 |
|---|---|---|---|
| 1 | 1.097 | 0.725 | 0.790 |
| 2 | 1.140 | 0.749 | 0.767 |
| 3 | 1.169 | 0.770 | 0.750 |
| 4 | 1.116 | 0.721 | 0.780 |
| 5 | 1.225 | 0.751 | 0.732 |
| Mean | 1.149 | 0.743 | 0.764 |
| Median | 1.140 | 0.749 | 0.767 |
| SD | 0.050 | 0.020 | 0.023 |
| Fold | AUPRC | AUROC |
|---|---|---|
| 1 | 0.799 | 0.895 |
| 2 | 0.797 | 0.894 |
| 3 | 0.790 | 0.894 |
| 4 | 0.772 | 0.870 |
| 5 | 0.787 | 0.886 |
| Mean | 0.789 | 0.888 |
| Median | 0.790 | 0.894 |
| SD | 0.010 | 0.009 |
| Fold | AUPRC | AUROC |
|---|---|---|
| 1 | 0.859 | 0.882 |
| 2 | 0.863 | 0.891 |
| 3 | 0.855 | 0.879 |
| 4 | 0.866 | 0.891 |
| 5 | 0.846 | 0.882 |
| Mean | 0.858 | 0.885 |
| Median | 0.859 | 0.882 |
| SD | 0.008 | 0.006 |
| Fold | AUPRC | AUROC |
|---|---|---|
| 1 | 0.708 | 0.871 |
| 2 | 0.674 | 0.865 |
| 3 | 0.676 | 0.850 |
| 4 | 0.686 | 0.862 |
| 5 | 0.676 | 0.858 |
| Mean | 0.684 | 0.861 |
| Median | 0.676 | 0.862 |
| SD | 0.014 | 0.008 |
| Fold | AUPRC | AUROC |
|---|---|---|
| 1 | 0.849 | 0.889 |
| 2 | 0.840 | 0.881 |
| 3 | 0.831 | 0.886 |
| 4 | 0.842 | 0.880 |
| 5 | 0.869 | 0.907 |
| Mean | 0.846 | 0.889 |
| Median | 0.842 | 0.886 |
| SD | 0.014 | 0.011 |
References
- Wouters, O.J.; McKee, M.; Luyten, J. Estimated Research and Development Investment Needed to Bring a New Medicine to Market, 2009–2018. JAMA 2020, 323, 844–853. [Google Scholar] [CrossRef] [PubMed]
- Cook, D.; Brown, D.; Alexander, R.; March, R.; Morgan, P.; Satterthwaite, G.; Pangalos, M.N. Lessons learned from the fate of AstraZeneca’s drug pipeline: A five-dimensional framework. Nat. Rev. Drug Discov. 2014, 13, 419–431. [Google Scholar] [CrossRef]
- Mohamed, M.E.; Trueman, S.; Othman, A.A.; Han, J.H.; Ju, T.R.; Marroum, P. Development of In Vitro–In Vivo Correlation for Upadacitinib Extended-Release Tablet Formulation. AAPS J. 2019, 21, 108. [Google Scholar] [CrossRef]
- Hanif, M.; Shoaib, M.H.; Yousuf, R.I.; Zafar, F. Development of in vitro-in vivo correlations for newly optimized Nimesulide formulations. PLoS ONE 2018, 13, e0203123. [Google Scholar] [CrossRef] [PubMed]
- Kapungu, N.N.; Li, X.; Nhachi, C.; Masimirembwa, C.; Thelingwani, R.S. In vitro and in vivo human metabolism and pharmacokinetics of S- and R-praziquantel. Pharmacol. Res. Perspect. 2020, 8, e00618. [Google Scholar] [CrossRef] [PubMed]
- Cheng, F.; Li, W.; Liu, G.; Tang, Y. In silico ADMET prediction: Recent advances, current challenges and future trends. Curr. Top. Med. Chem. 2013, 13, 1273–1289. [Google Scholar] [CrossRef]
- Patel, C.N.; Kumar, S.P.; Rawal, R.M.; Patel, D.P.; Gonzalez, F.J.; Pandya, H.A. A multiparametric organ toxicity predictor for drug discovery. Toxicol. Mech. Methods 2020, 30, 159–166. [Google Scholar] [CrossRef]
- Berthelsen, R.; Sjögren, E.; Jacobsen, J.; Kristensen, J.; Holm, R.; Abrahamsson, B.; Müllertz, A. Combining in vitro and in silico methods for better prediction of surfactant effects on the absorption of poorly water soluble drugs-a fenofibrate case example. Int. J. Pharm. 2014, 473, 356–365. [Google Scholar] [CrossRef]
- Johansson, S.; Löfberg, B.; Aunes, M.; Lunde, H.; Frison, L.; Edvardsson, N.; Cullberg, M. In Silico Predictions and In Vivo Results of Drug-Drug Interactions by Ketoconazole and Verapamil on AZD1305, a Combined Ion Channel Blocker and a Sensitive CYP3A4 Substrate. Clin. Pharmacol. Drug Dev. 2016, 5, 364–373. [Google Scholar]
- Litou, C.; Patel, N.; Turner, D.B.; Kostewicz, E.; Kuentz, M.; Box, K.J.; Dressman, J. Combining biorelevant in vitro and in silico tools to simulate and better understand the in vivo performance of a nano-sized formulation of aprepitant in the fasted and fed states. Eur. J. Pharm. Sci. 2019, 138, 105031. [Google Scholar] [CrossRef]
- Wu, F.; Zhou, Y.; Li, L.; Shen, X.; Chen, G.; Wang, X.; Liang, X.; Tan, M.; Huang, Z. Computational Approaches in Preclinical Studies on Drug Discovery and Development. Front. Chem. 2020, 8, 726. [Google Scholar] [CrossRef]
- Muratov, E.N.; Bajorath, J.; Sheridan, R.P.; Tetko, I.V.; Filimonov, D.; Poroikov, V.; Oprea, T.I.; Baskin, I.I.; Varnek, A.; Roitberg, A.; et al. QSAR without borders. Chem. Soc. Rev. 2020, 49, 3525–3564. [Google Scholar] [CrossRef] [PubMed]
- Wei, M.; Zhang, X.; Pan, X.; Wang, B.; Ji, C.; Qi, Y.; Zhang, J.Z. HobPre: Accurate prediction of human oral bioavailability for small molecules. J. Cheminform. 2022, 14, 1. [Google Scholar] [CrossRef] [PubMed]
- Hou, T.; Wang, J.; Li, Y. ADME Evaluation in Drug Discovery. 8. The Prediction of Human Intestinal Absorption by a Support Vector Machine. J. Chem. Inf. Model. 2007, 47, 2408–2415. [Google Scholar] [CrossRef] [PubMed]
- Guerra, A.; Paez, J.; Campillo, N.E. Artificial Neural Networks in ADMET Modeling: Prediction of Blood–Brain Barrier Permeation. J. Mol. Inform. 2008, 27, 586–594. [Google Scholar] [CrossRef]
- Maria, T.E.; Roberta, B.; Paolo, M. Application of Artificial Neural Networks to Predict the Intrinsic Solubility of Drug-Like Molecules. Pharmaceutics 2021, 20, 1101. [Google Scholar] [CrossRef] [PubMed]
- Schyman, P.; Liu, R.; Desai, V.; Wallqvist, A. vNN Web Server for ADMET Predictions. Front. Pharmacol. 2017, 8, 889. [Google Scholar] [CrossRef] [PubMed]
- Gómez-Bombarelli, R.; Wei, J.N.; Duvenaud, D.; Hernández-Lobato, J.M.; Sánchez-Lengeling, B.; Sheberla, D.; Aguilera-Iparraguirre, J.; Hirzel, T.D.; Adams, R.P.; Aspuru-Guzik, A. Automatic Chemical Design Using a Data-Driven Continuous Representation of Molecules. ACS Cent. Sci. 2018, 4, 268–276. [Google Scholar] [CrossRef] [PubMed]
- Salma, H.; Melha, Y.M.; Sonia, L.; Hamza, H.; Salim, N. Efficient Prediction of In Vitro Piroxicam Release and Diffusion From Topical Films Based on Biopolymers Using Deep Learning Models and Generative Adversarial Networks. J. Pharm. Sci. 2021, 110, 2531–2543. [Google Scholar] [CrossRef] [PubMed]
- Jiménez-Luna, J.; Grisoni, F.; Schneider, G. Drug discovery with explainable artificial intelligence. Nat. Mach. Intell. 2021, 2, 573–584. [Google Scholar] [CrossRef]
- Guha, R.; Willighagen, E. A Survey of Quantitative Descriptions of Molecular Structure. Curr. Top. Med. Chem. 2012, 12, 1946–1956. [Google Scholar] [CrossRef]
- Khan, M.T. Predictions of the ADMET properties of candidate drug molecules utilizing different QSAR/QSPR modelling approaches. Curr. Drug Metab. 2010, 11, 285–295. [Google Scholar] [CrossRef] [PubMed]
- Duan, J.; Dixon, S.L.; Lowrie, J.F.; Sherman, W. Analysis and comparison of 2D fingerprints: Insights into database screening performance using eight fingerprint methods. J. Mol. Graph Model. 2010, 29, 157–170. [Google Scholar] [CrossRef] [PubMed]
- Aouichaoui, A.R.; Fan, F.; Abildskov, J.; Sin, G. Application of interpretable group-embedded graph neural networks for pure compound properties. Comput. Chem. Eng. 2023, 176, 108291. [Google Scholar] [CrossRef]
- Fralish, Z.; Chen, A.; Skaluba, P.; Reker, D. DeepDelta: Predicting ADMET improvements of molecular derivatives with deep learning. J. Cheminform. 2023, 15, 101. [Google Scholar] [CrossRef]
- Peng, Y.; Lin, Y.; Jing, X.-Y.; Zhang, H.; Huang, Y.; Luo, G.S. Enhanced Graph Isomorphism Network for Molecular ADMET Properties Prediction. IEEE Access 2020, 8, 168344–168360. [Google Scholar] [CrossRef]
- Weininger, D. SMILES, a chemical language and information system. 1. Introduction to methodology and encoding rules. J. Chem. Inf. Comput. Sci. 1988, 28, 31–36. [Google Scholar] [CrossRef]
- Huang, K.; Fu, T.; Gao, W.; Zhao, Y.; Roohani, Y.; Leskovec, J.; Coley, C.W.; Xiao, C.; Sun, J.; Zitnik, M. Artificial intelligence foundation for therapeutic science. Nat. Chem. Biol. 2022, 18, 1033–1036. [Google Scholar] [CrossRef] [PubMed]
- David, L.; Thakkar, A.; Mercado, R.; Engkvist, O. Molecular representations in AI-driven drug discovery: A review and practical guide. J. Cheminform. 2020, 12, 56. [Google Scholar] [CrossRef] [PubMed]
- Hamilton, W.L. Graph Representation Learning; Springer: Cham, Switzerland, 2020. [Google Scholar]
- Zhou, J.; Cui, G.; Hu, S.; Zhang, Z.; Yang, C.; Liu, Z.; Wang, L.; Li, C.; Sun, M. Graph neural networks: A review of methods and applications. AI Open 2020, 1, 57–81. [Google Scholar] [CrossRef]
- Wu, Z.; Pan, S.; Chen, F.; Long, G.; Zhang, C.; Yu, P.S. A Comprehensive Survey on Graph Neural Networks. IEEE Trans. Neural Netw. Learn. Syst. 2019, 32, 4–24. [Google Scholar] [CrossRef]
- Ioffe, S.; Szegedy, C. Batch normalization: Accelerating deep network training by reducing internal covariate shift. In Proceedings of the 32nd International Conference on International Conference on Machine Learning, Lille, France, 6–11 July 2015; Volume 37, pp. 448–456. [Google Scholar]
- Haykin, S. Neural Networks: A Comprehensive Foundation; Prentice Hall PTR: Lebanon, IN, USA, 1994. [Google Scholar]
- Bahdanau, D.; Cho, K.; Bengio, Y. Neural machine translation by jointly learning to align and translate. arXiv 2014, arXiv:1409.0473. [Google Scholar]
- Vaswani, A.; Shazeer, N.; Parmar, N.; Uszkoreit, J.; Jones, L.; Gomez, A.N.; Kaiser, L.; Polosukhin, I. Attention is all you need. In Proceedings of the Advances in Neural Information Processing Systems, Long Beach, CA, USA, 4–9 December 2017; Volume 30. [Google Scholar]
- Brauwers, G.; Frasincar, F. A General Survey on Attention Mechanisms in Deep Learning. Inst. Electr. Electron. Eng. 2023, 35, 3279–3298. [Google Scholar] [CrossRef]
- Veličković, P.; Cucurull, G.; Casanova, A.; Romero, A.; Liò, P.; Bengio, Y. Graph attention networks. arXiv 2017, arXiv:1710.10903. [Google Scholar]
- Mass, A.L.; Hannun, A.Y.; Ng, A.Y. Rectifier nonlinearities improve neural network acoustic models. In Proceedings of the 30th International Conference on Machine Learning, Atlanta, GA, USA, 16–21 June 2013. [Google Scholar]
- Li, Y.; Tarlow, D.; Brockschmidt, M.; Zemel, R. Gated Graph Sequence Neural Networks. arXiv 2017, arXiv:1511.05493. [Google Scholar]
- Kawabata, Y.; Wada, K.; Nakatani, M.; Yamada, S.; Onoue, S. Formulation design for poorly water-soluble drugs based on biopharmaceutics classification system: Basic approaches and practical applications. Int. J. Pharm. 2011, 420, 1–10. [Google Scholar] [CrossRef]
- Sim, S.C.; Ingelman-Sundberg, M. The Human Cytochrome P450 (CYP) Allele Nomenclature website: A peer-reviewed database of CYP variants and their associated effects. Hum. Genom. 2010, 4, 278–281. [Google Scholar] [CrossRef] [PubMed]
- Bengio, Y. Practical Recommendations for Gradient-Based Training of Deep Architectures. In Neural Networks: Tricks of the Trade; Montavon, G., Orr, G.B., Müller, K.R., Eds.; Lecture Notes in Computer Science; Springer: Berlin/Heidelberg, Germany, 2007. [Google Scholar]
- Cui, Y.; Jia, M.; Lin, T.-Y.; Song, Y.; Belongie, S. Class-balanced loss based on effective number of samples. In Proceedings of the IEEE/CVF Conference on Computer Vision and Pattern Recognition, Salt Lake City, UT, USA, 18–23 June 2018; pp. 9268–9277. [Google Scholar]
- Krawczyk, B. Learning from imbalanced data: Open challenges and future directions. Prog. Artif. Intell. 2018, 5, 221–232. [Google Scholar] [CrossRef]
- Steininger, M.; Kobs, K.; Davidson, P.; Krause, A.; Hotho, A. Density-based weighting for imbalanced regression. Mach. Learn. 2021, 110, 2187–2211. [Google Scholar] [CrossRef]
- Chen, Y.-C. A tutorial on kernel density estimation and recent advances. Biostat. Epidemiol. 2017, 1, 161–187. [Google Scholar] [CrossRef]
- Silverman, B.W. Density Estimation for Statistics and Data Analysis; CRC Press: London, UK, 1986. [Google Scholar]
- Japkowicz, N.; Stephen, S. The Class Imbalance Problem: A Systematic Study. Intell. Data Anal. 2002, 6, 429–449. [Google Scholar] [CrossRef]
- Zhou, Z.-H.; Liu, X.-Y. Training cost-sensitive neural networks with methods addressing the class imbalance problem. Knowl. Data Eng. IEEE Trans. 2006, 18, 63–77. [Google Scholar] [CrossRef]
- Fern, K.R.; Tsokos, C.P. Dynamically Weighted Balanced Loss: Class Imbalanced Learning and Confidence Calibration of Deep Neural Networks. IEEE Trans. Neural Netw. Learn. Syst. 2022, 33, 2940–2951. [Google Scholar]
- Goadrich, M.; Oliphant, L.; Shavlik, J. Gleaner: Creating ensembles of first-order clauses to improve recall-precision curves. Mach. Learn. 2006, 64, 231–261. [Google Scholar] [CrossRef]
- Boyd, K.; Eng, K.H.; Page, C.D. Area under the precision-recall curve: Point estimates and confidence intervals. In Proceedings of the 2013th European Conference on Machine Learning and Knowledge Discovery in Databases, Prague, Czech Republic, 23–27 September 2013; Springer: Berlin/Heidelberg, Germany, 2013. [Google Scholar]
- Davis, J.; Goadrich, M. The relationshipt between Precision-Recall and ROC curves. In Proceedings of the 23rd International Conference on Machine Learning, Pittsburgh, PA, USA, 25–29 June 2006; pp. 233–240. [Google Scholar]
- Saito, T.; Rehmsmeier, M. The precision-recall plot is more informative than the ROC plot when evaluating binary classifiers on imbalanced datasets. PLoS ONE 2015, 10, e0118432. [Google Scholar] [CrossRef]
- Zhang, X.; Wu, C.; Yang, Z.; Wu, Z.; Yi, J.; Hsieh, C.; Hou, T.; Cao, D. MG-BERT: Leveraging unsupervised atomic representation learning for molecular property prediction. Briefings Bioinform. 2021, 22, bbab152. [Google Scholar] [CrossRef] [PubMed]
- Wang, X.; Liu, M.; Zhang, L.; Wang, Y.; Li, Y.; Lu, T. Optimizing Pharmacokinetic Property Prediction Based on Integrated Datasets and a Deep Learning Approach. J. Chem. Inf. Model. 2020, 60, 4603–4613. [Google Scholar] [CrossRef] [PubMed]
- Xu, K.; Hu, W.; Leskovec, J.; Jegelka, S. How Powerful are Graph Neural Networks? arXiv 2018, arXiv:1810.00826. [Google Scholar]
- Tang, B.; Kramer, S.T.; Fang, M.; Qiu, Y.; Wu, Z.; Xu, D. A self-attention based message passing neural network for predicting molecular lipophilicity and aqueous solubility. J. Cheminform. 2020, 12, 15. [Google Scholar] [CrossRef] [PubMed]
- Li, X.; Fourches, D. Inductive transfer learning for molecular activity prediction: Next-Gen QSAR Models with MolPMoFiT. J. Cheminform. 2020, 12, 27. [Google Scholar] [CrossRef]
- Xiong, Z.; Wang, D.; Liu, X.; Zhong, F.; Wan, X.; Li, X.; Li, Z.; Luo, X.; Chen, K.; Jiang, H.; et al. Pushing the Boundaries of Molecular Representation for Drug Discovery with the Graph Attention Mechanism. J. Med. Chem. 2020, 63, 8749–8760. [Google Scholar] [CrossRef]
- Francoeur, P.G.; Koes, D.R. SolTranNet—A Machine Learning Tool for Fast Aqueous Solubility Prediction. J. Chem. Inf. Model. 2021, 61, 2530–2536. [Google Scholar] [CrossRef] [PubMed]
- Maziarka, L.; Danel, T.; Mucha, S.; Rataj, K.; Tabor, J.; Jastrzebski, S. Molecule Attention Transformer. arXiv 2002, arXiv:2002.08264. [Google Scholar]
- Yang, K.; Swanson, K.; Jin, W.; Coley, C.; Eiden, P.; Gao, H.; Guzman-Perez, A.; Hopper, T.; Kelley, B.; Mathea, M.; et al. Analyzing learned molecular representations for property prediction. J. Chem. Inf. Model. 2019, 59, 3370–3388. [Google Scholar] [CrossRef] [PubMed]
- Venkatraman, V. FP-ADMET: A compendium of fingerprint-based ADMET prediction models. J. Cheminform. 2021, 13, 75. [Google Scholar] [CrossRef]
- Plonka, W.; Stork, C.; Šícho, M.; Kirchmair, J. CYPlebrity: Machine learning models for the prediction of inhibitors of cytochrome P450 enzymes. Bioorganic Med. Chem. 2021, 46, 116388. [Google Scholar] [CrossRef]
- Li, X.; Xu, Y.; Lai, L.; Pei, J. Prediction of Human Cytochrome P450 Inhibition Using a Multitask Deep Autoencoder Neural Network. Mol. Pharm. 2018, 15, 4336–4345. [Google Scholar] [CrossRef]
- TDC Leaderboard Guidelines. Available online: https://tdcommons.ai/benchmark/overview (accessed on 29 May 2024).
- TDC ADMET Benchmark Groups. Available online: https://tdcommons.ai/benchmark/admet_group/overview/ (accessed on 29 May 2024).
- Landrum, G.; Tosco, P.; Kelley, B.; Sriniker; Gedeck; Schneider, N.; Vianello, R.; Ric; Dalke, A.; Cole, B.; et al. rdkit/rdkit: 2020 03 1. Q1 2020 Release. 2020. Available online: https://zenodo.org/records/3732262 (accessed on 29 May 2024). [CrossRef]


| Atomic Feature | List of Possible Values |
|---|---|
| Atom type identified by the atomic number | 1–101 |
| Formal charge | −3, −2, −1, 0, 1, 2, 3, Extreme |
| Hybridization Type | S, SP, SP2, SP3, SP3D, SP3D2, Other |
| Atom in a ring | 0: No, 1: Yes |
| Is in an aromatic ring | 0: No, 1: Yes |
| Chirality | Unspecified, Clockwise, Counter-clockwise, Other |
| Property | #Total | #Positives (1) | #Negatives (0) | Task Type |
|---|---|---|---|---|
| Lipophilicity AZ | 4200 | - | - | Regression |
| AqSolDB | 9982 | - | - | Regression |
| CYP2C9 | 12,092 | 33.45% | 66.54% | Binary Classification |
| CYP2C19 | 12,665 | 45.94% | 54.06% | Binary Classification |
| CYP2D6 | 13,130 | 19.15% | 80.85% | Binary Classification |
| CYP3A4 | 12,328 | 41.45% | 58.55% | Binary Classification |
Disclaimer/Publisher’s Note: The statements, opinions and data contained in all publications are solely those of the individual author(s) and contributor(s) and not of MDPI and/or the editor(s). MDPI and/or the editor(s) disclaim responsibility for any injury to people or property resulting from any ideas, methods, instructions or products referred to in the content. |
© 2024 by the authors. Licensee MDPI, Basel, Switzerland. This article is an open access article distributed under the terms and conditions of the Creative Commons Attribution (CC BY) license (https://creativecommons.org/licenses/by/4.0/).
Share and Cite
De Carlo, A.; Ronchi, D.; Piastra, M.; Tosca, E.M.; Magni, P. Predicting ADMET Properties from Molecule SMILE: A Bottom-Up Approach Using Attention-Based Graph Neural Networks. Pharmaceutics 2024, 16, 776. https://doi.org/10.3390/pharmaceutics16060776
De Carlo A, Ronchi D, Piastra M, Tosca EM, Magni P. Predicting ADMET Properties from Molecule SMILE: A Bottom-Up Approach Using Attention-Based Graph Neural Networks. Pharmaceutics. 2024; 16(6):776. https://doi.org/10.3390/pharmaceutics16060776
Chicago/Turabian StyleDe Carlo, Alessandro, Davide Ronchi, Marco Piastra, Elena Maria Tosca, and Paolo Magni. 2024. "Predicting ADMET Properties from Molecule SMILE: A Bottom-Up Approach Using Attention-Based Graph Neural Networks" Pharmaceutics 16, no. 6: 776. https://doi.org/10.3390/pharmaceutics16060776
APA StyleDe Carlo, A., Ronchi, D., Piastra, M., Tosca, E. M., & Magni, P. (2024). Predicting ADMET Properties from Molecule SMILE: A Bottom-Up Approach Using Attention-Based Graph Neural Networks. Pharmaceutics, 16(6), 776. https://doi.org/10.3390/pharmaceutics16060776