
A Critical Analysis of the CFD-DEM Simulation of Pharmaceutical Aerosols Deposition in Upper Intra-Thoracic Airways: Considerations on Aerosol Transport and Deposition
 ,
,  , ,
, , 
Abstract
:1. Introduction
2. Materials and Methods
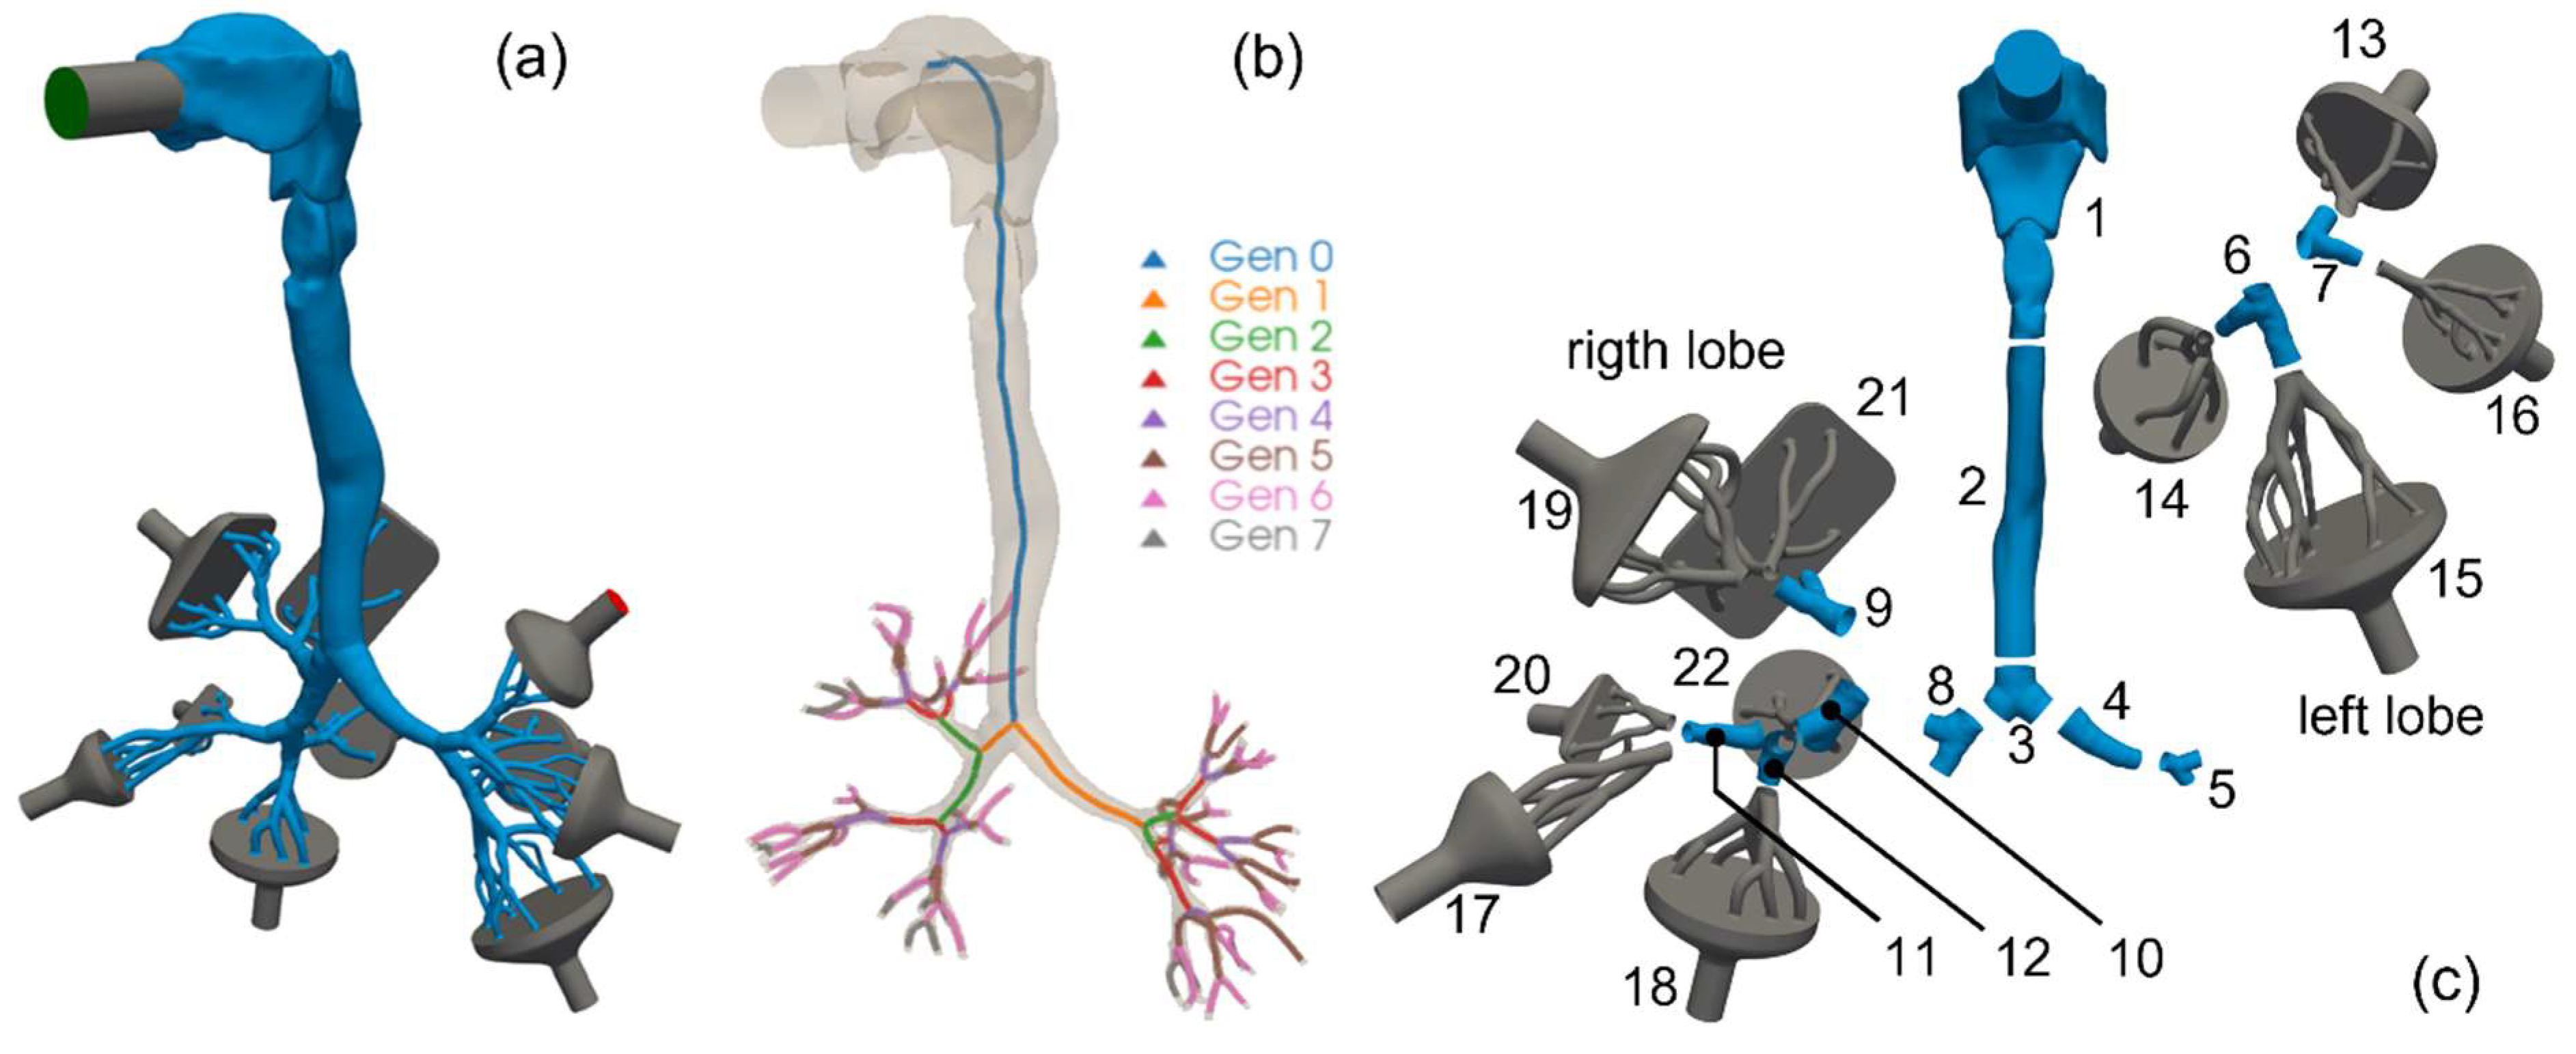
2.1. Adopted Lung Geometry
2.2. Airflow Modeling
2.3. Aerosol Modeling
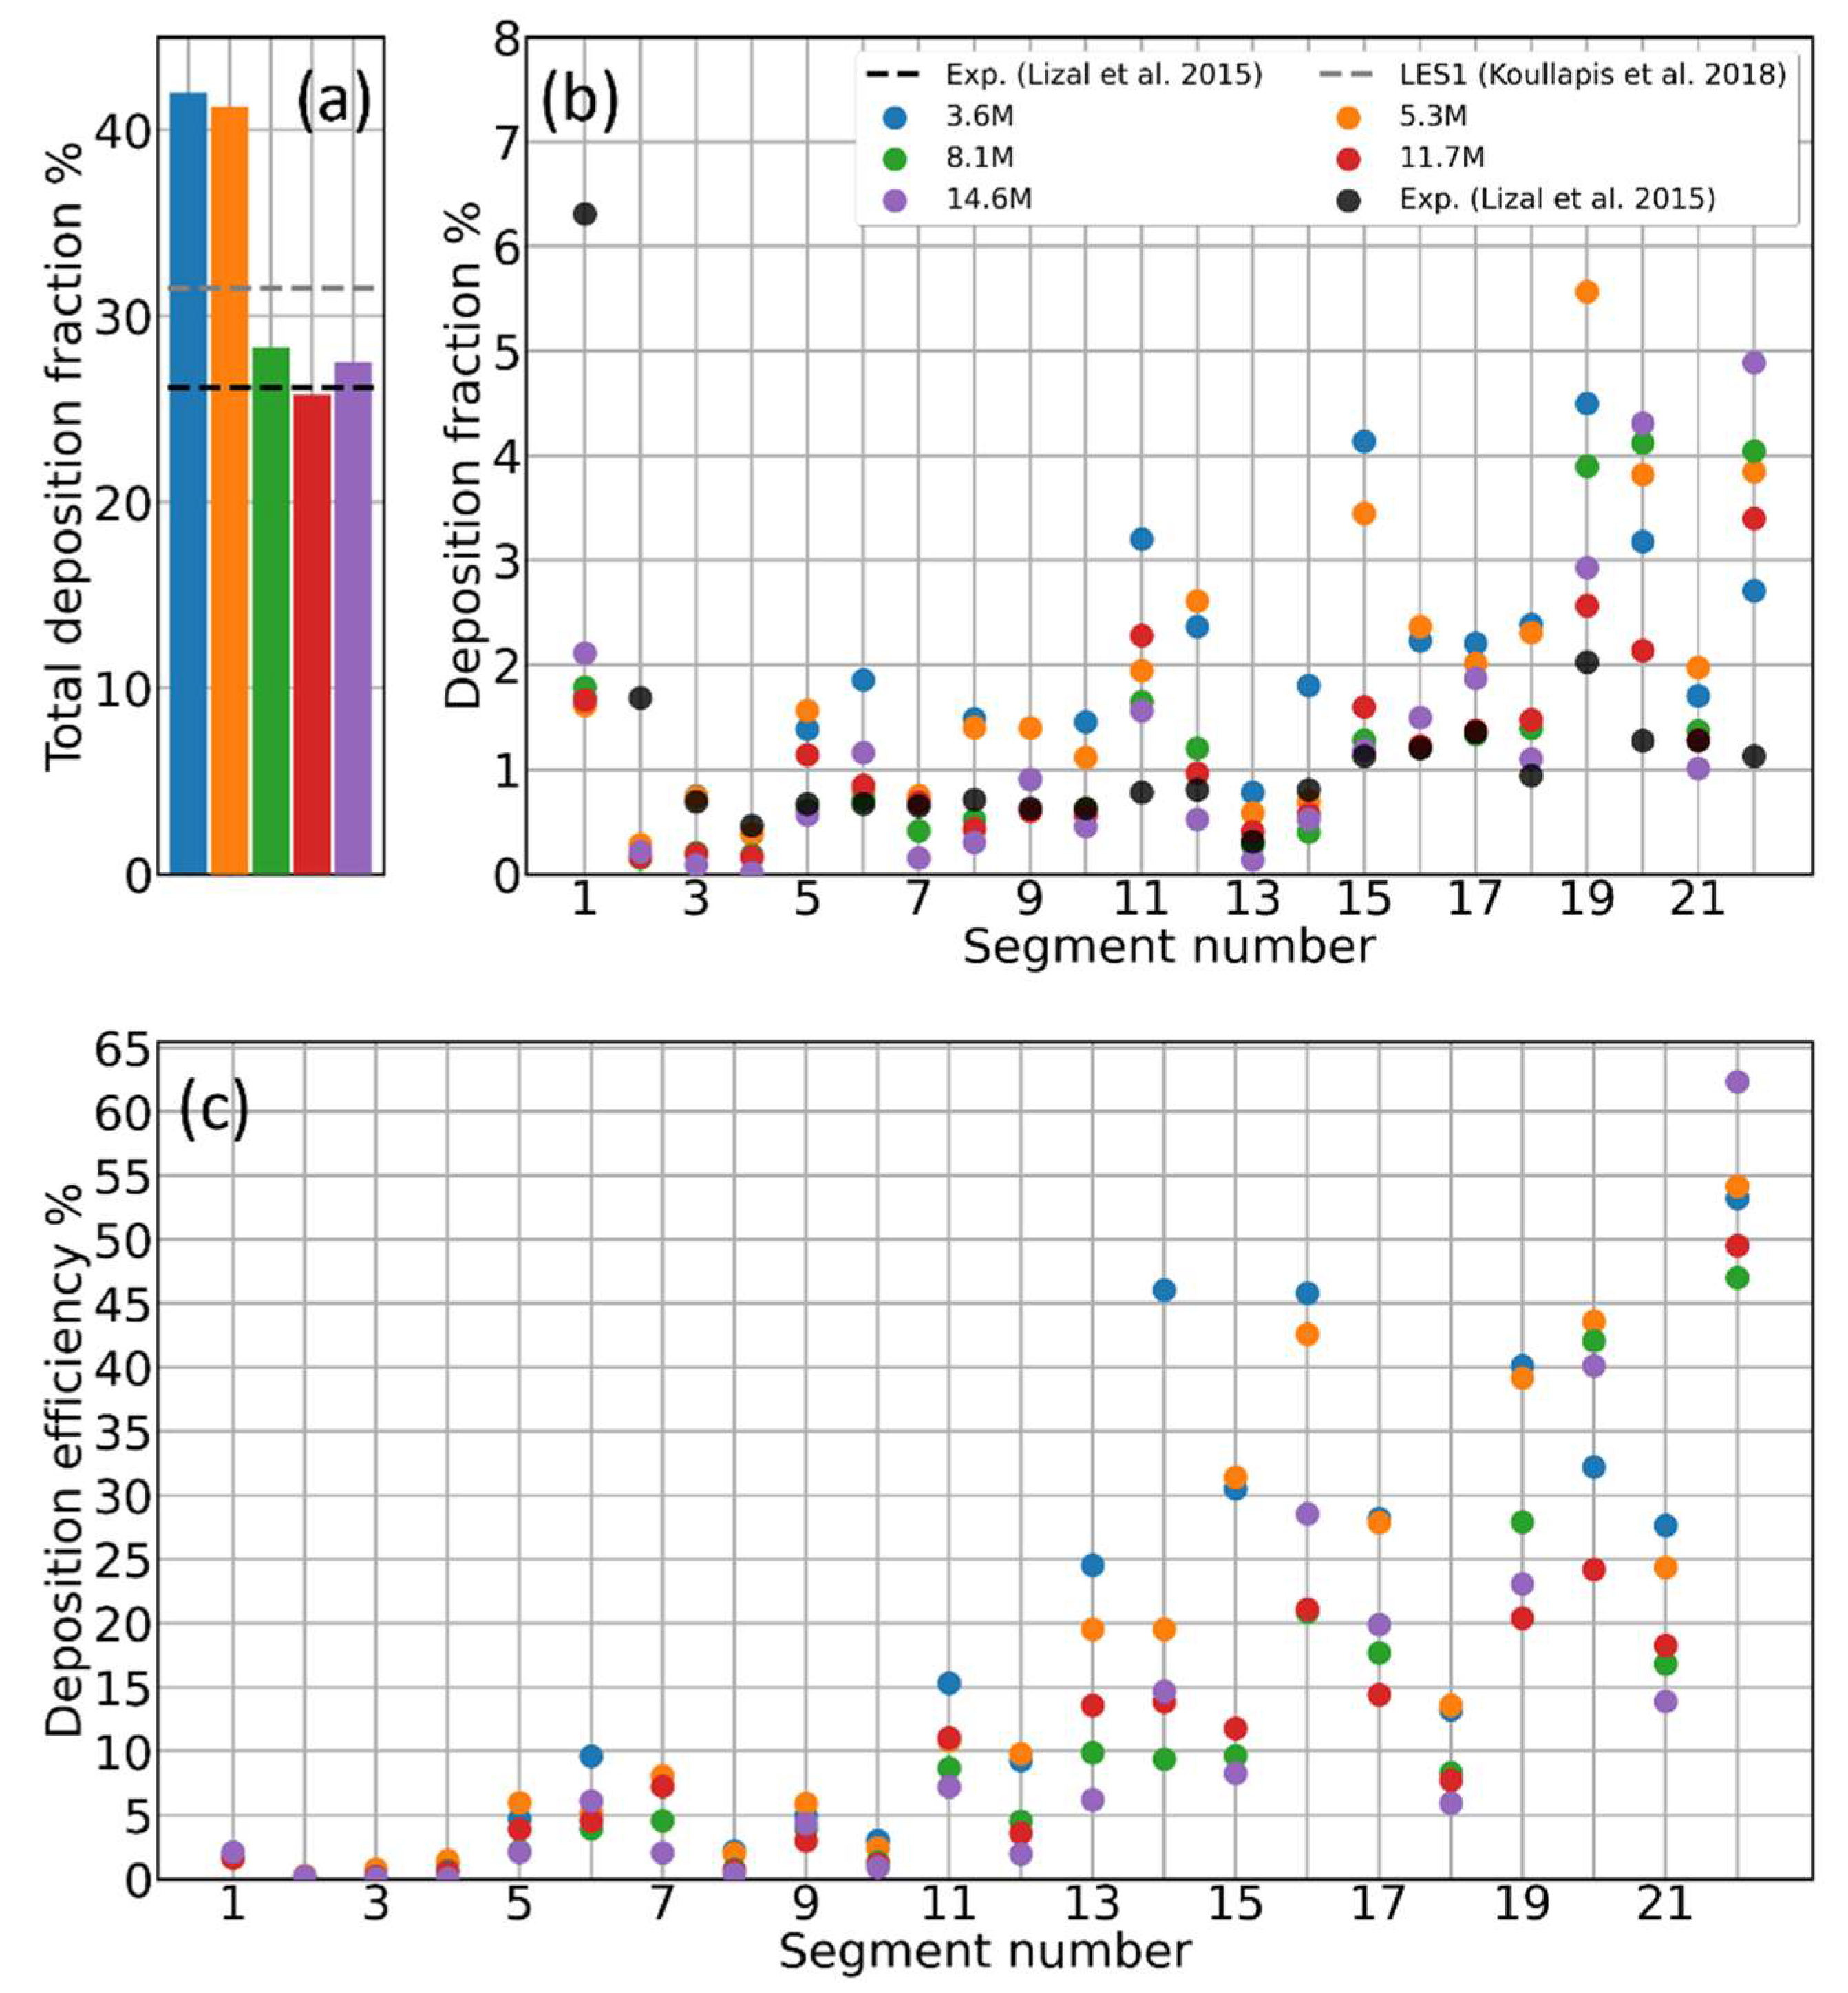
2.4. Aerosol Deposition Metrics
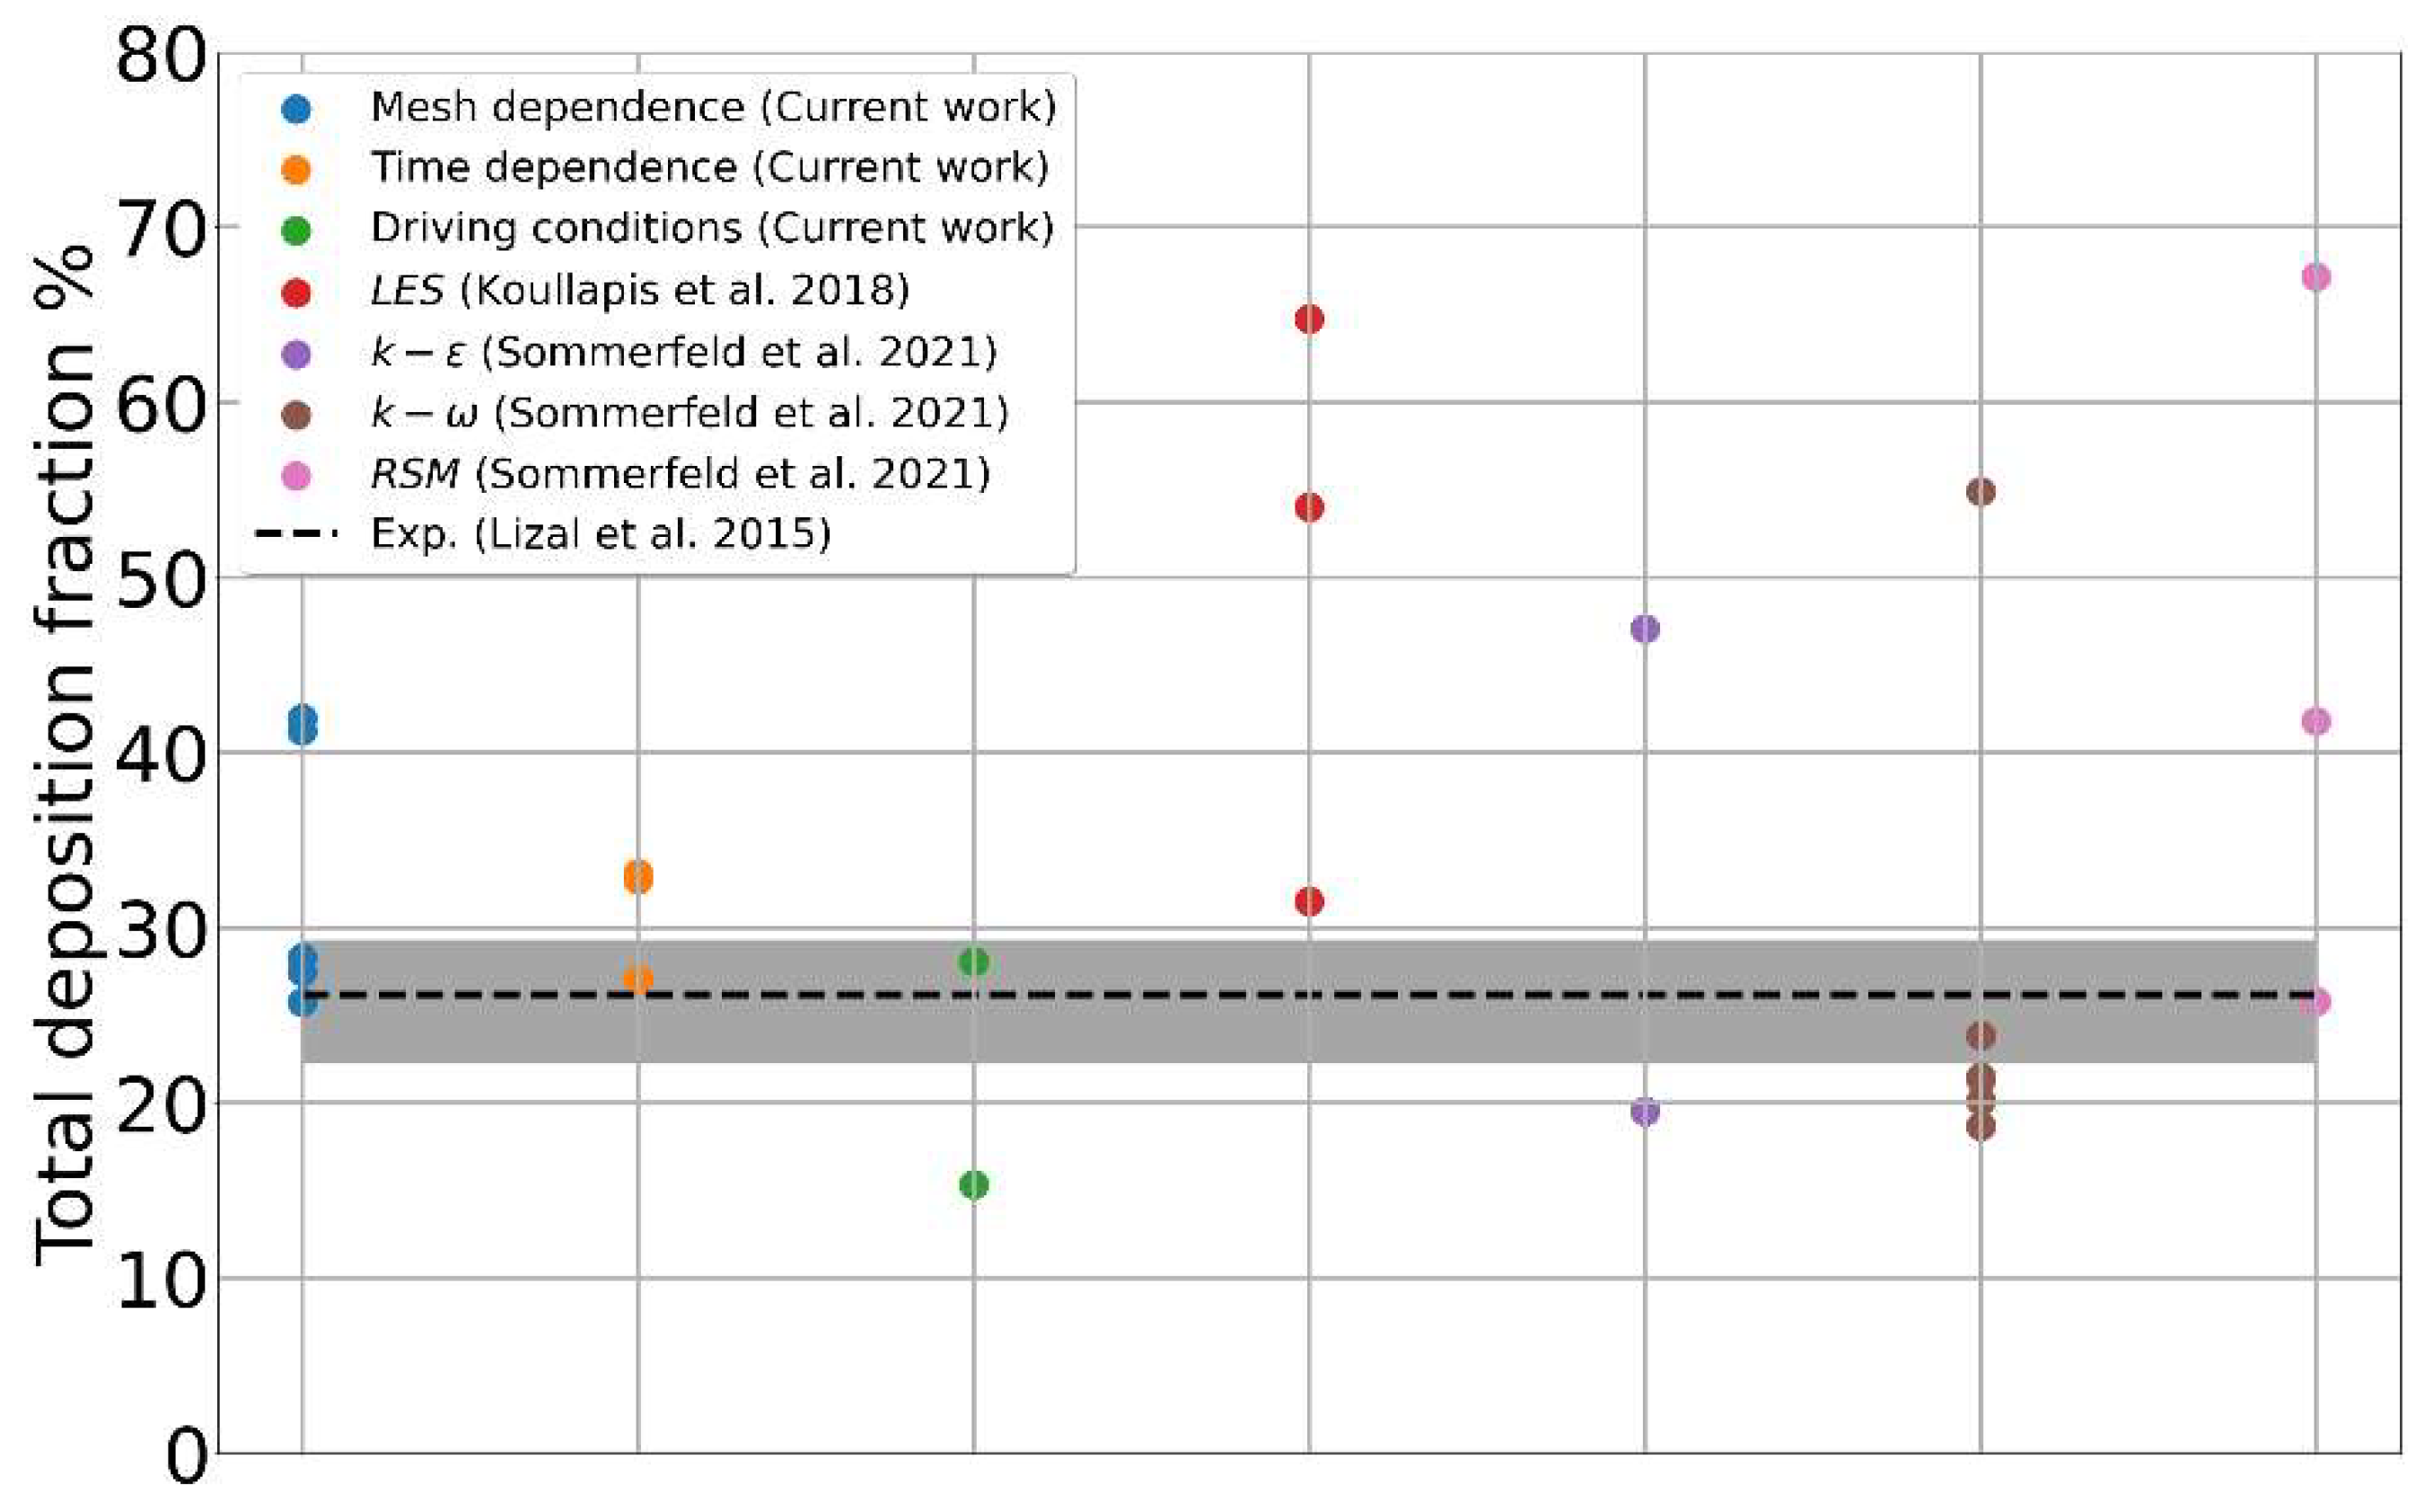
- Total Deposition Fraction: the ratio of the amount of aerosol particles/mass sticking onto the inner walls of the cast/computational domain to the total amount of particles/mass of the aerosol that have been injected into the cast/computational domain :with the number of particles sticking in the th section of the cast. This quantity conveys information on the total stopping power of the whole geometry with no local information.
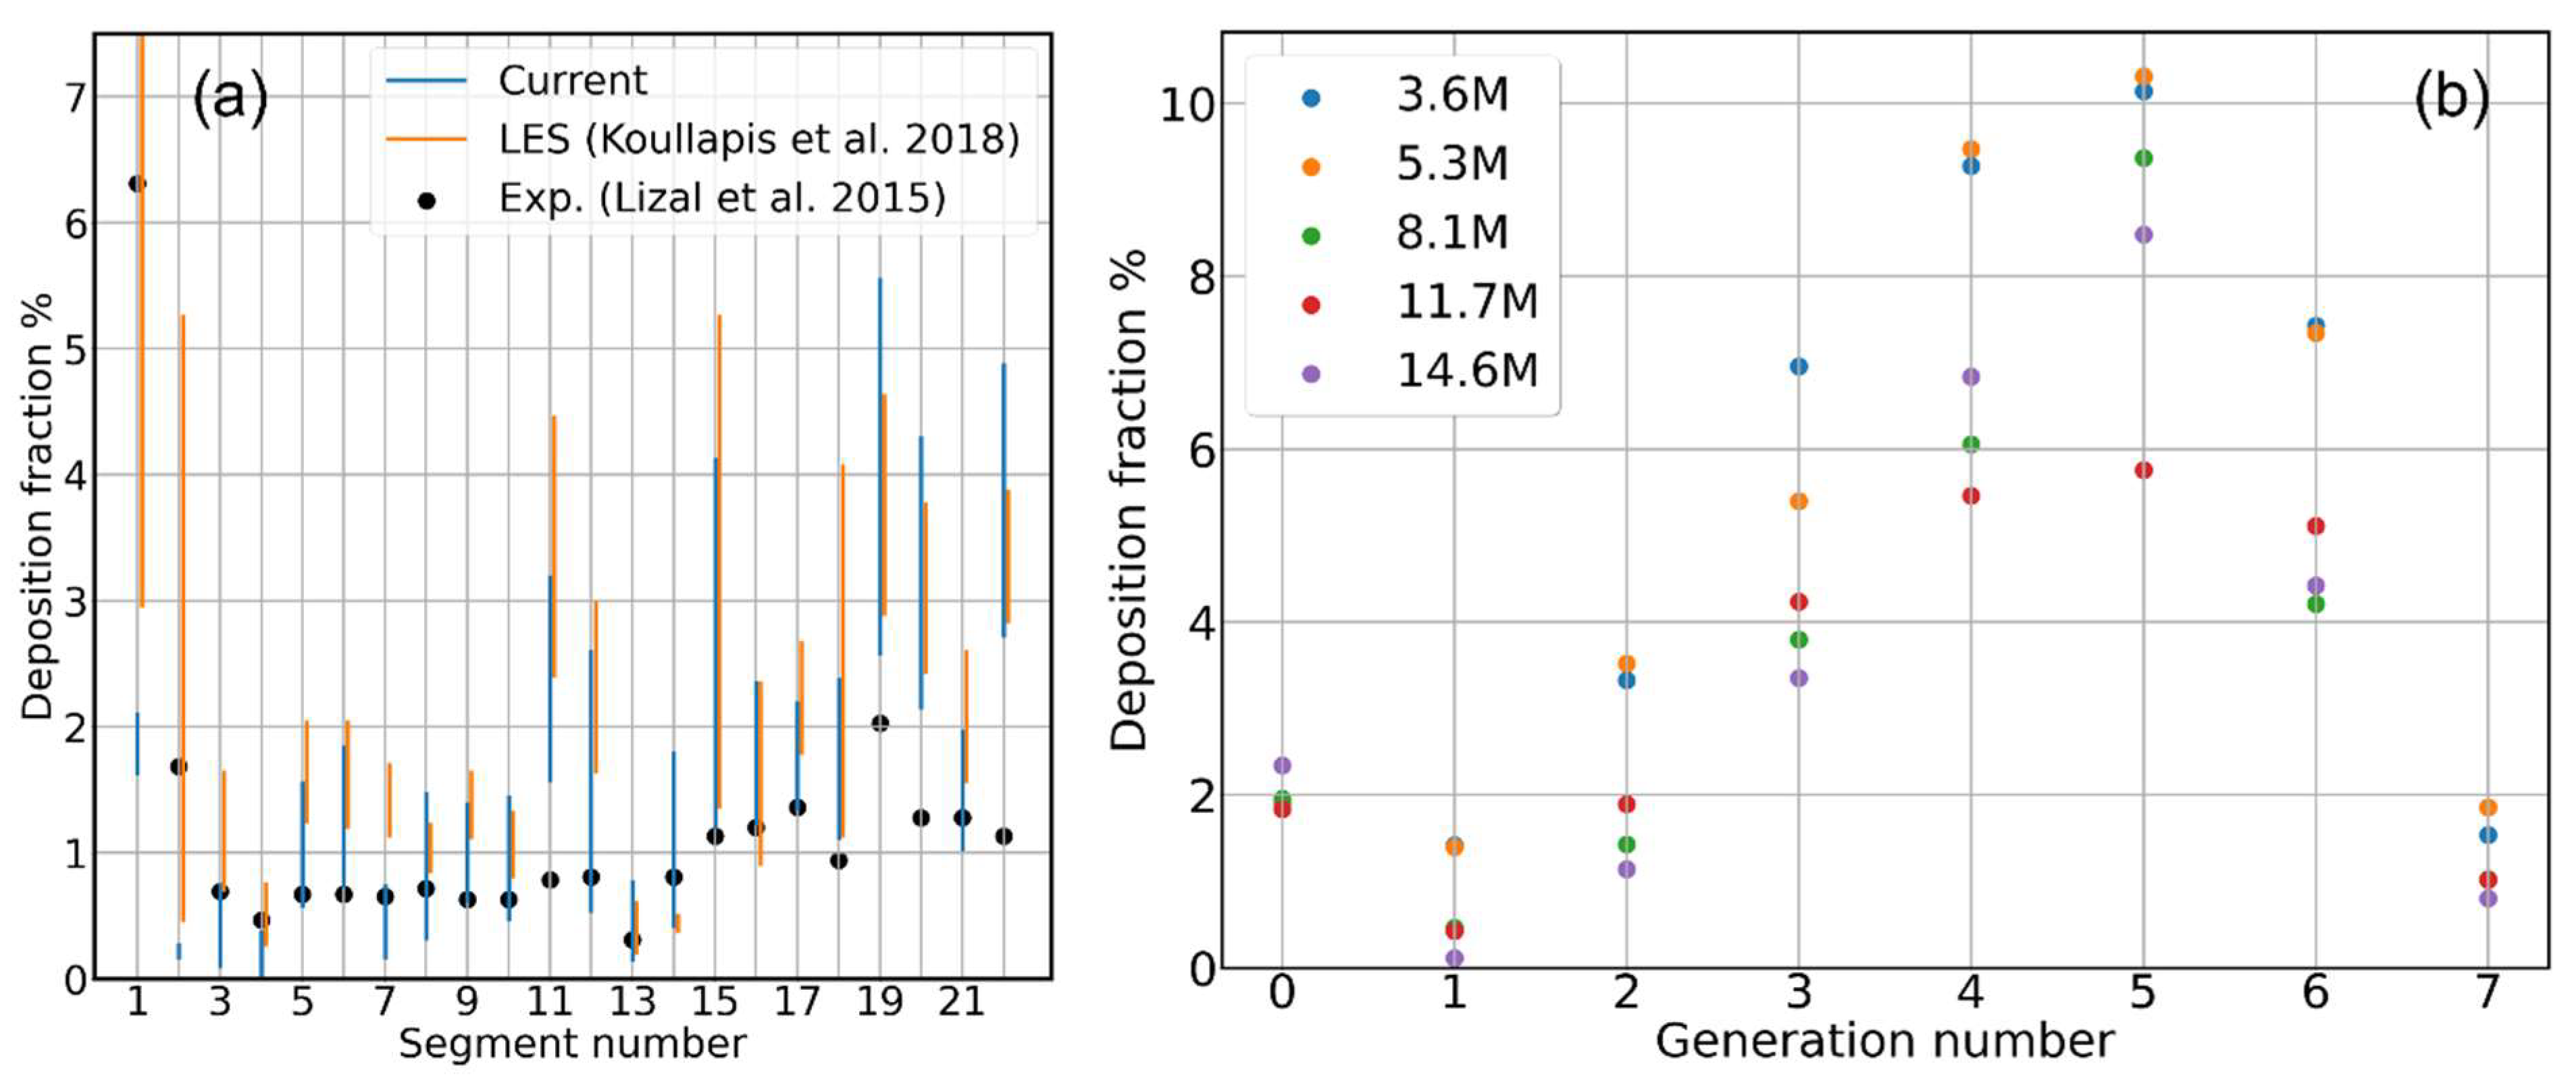
- Deposition Fraction: the ratio of the amount of aerosol particles/mass sticking onto the inner walls of each individual segment of the cast/computational domain to the total amount of particles/mass of the aerosol that have been injected into the cast/computational domain :It conveys information on how much of the total injected aerosol/drug dose has been stopped by each portion of the tracheobronchial tree.
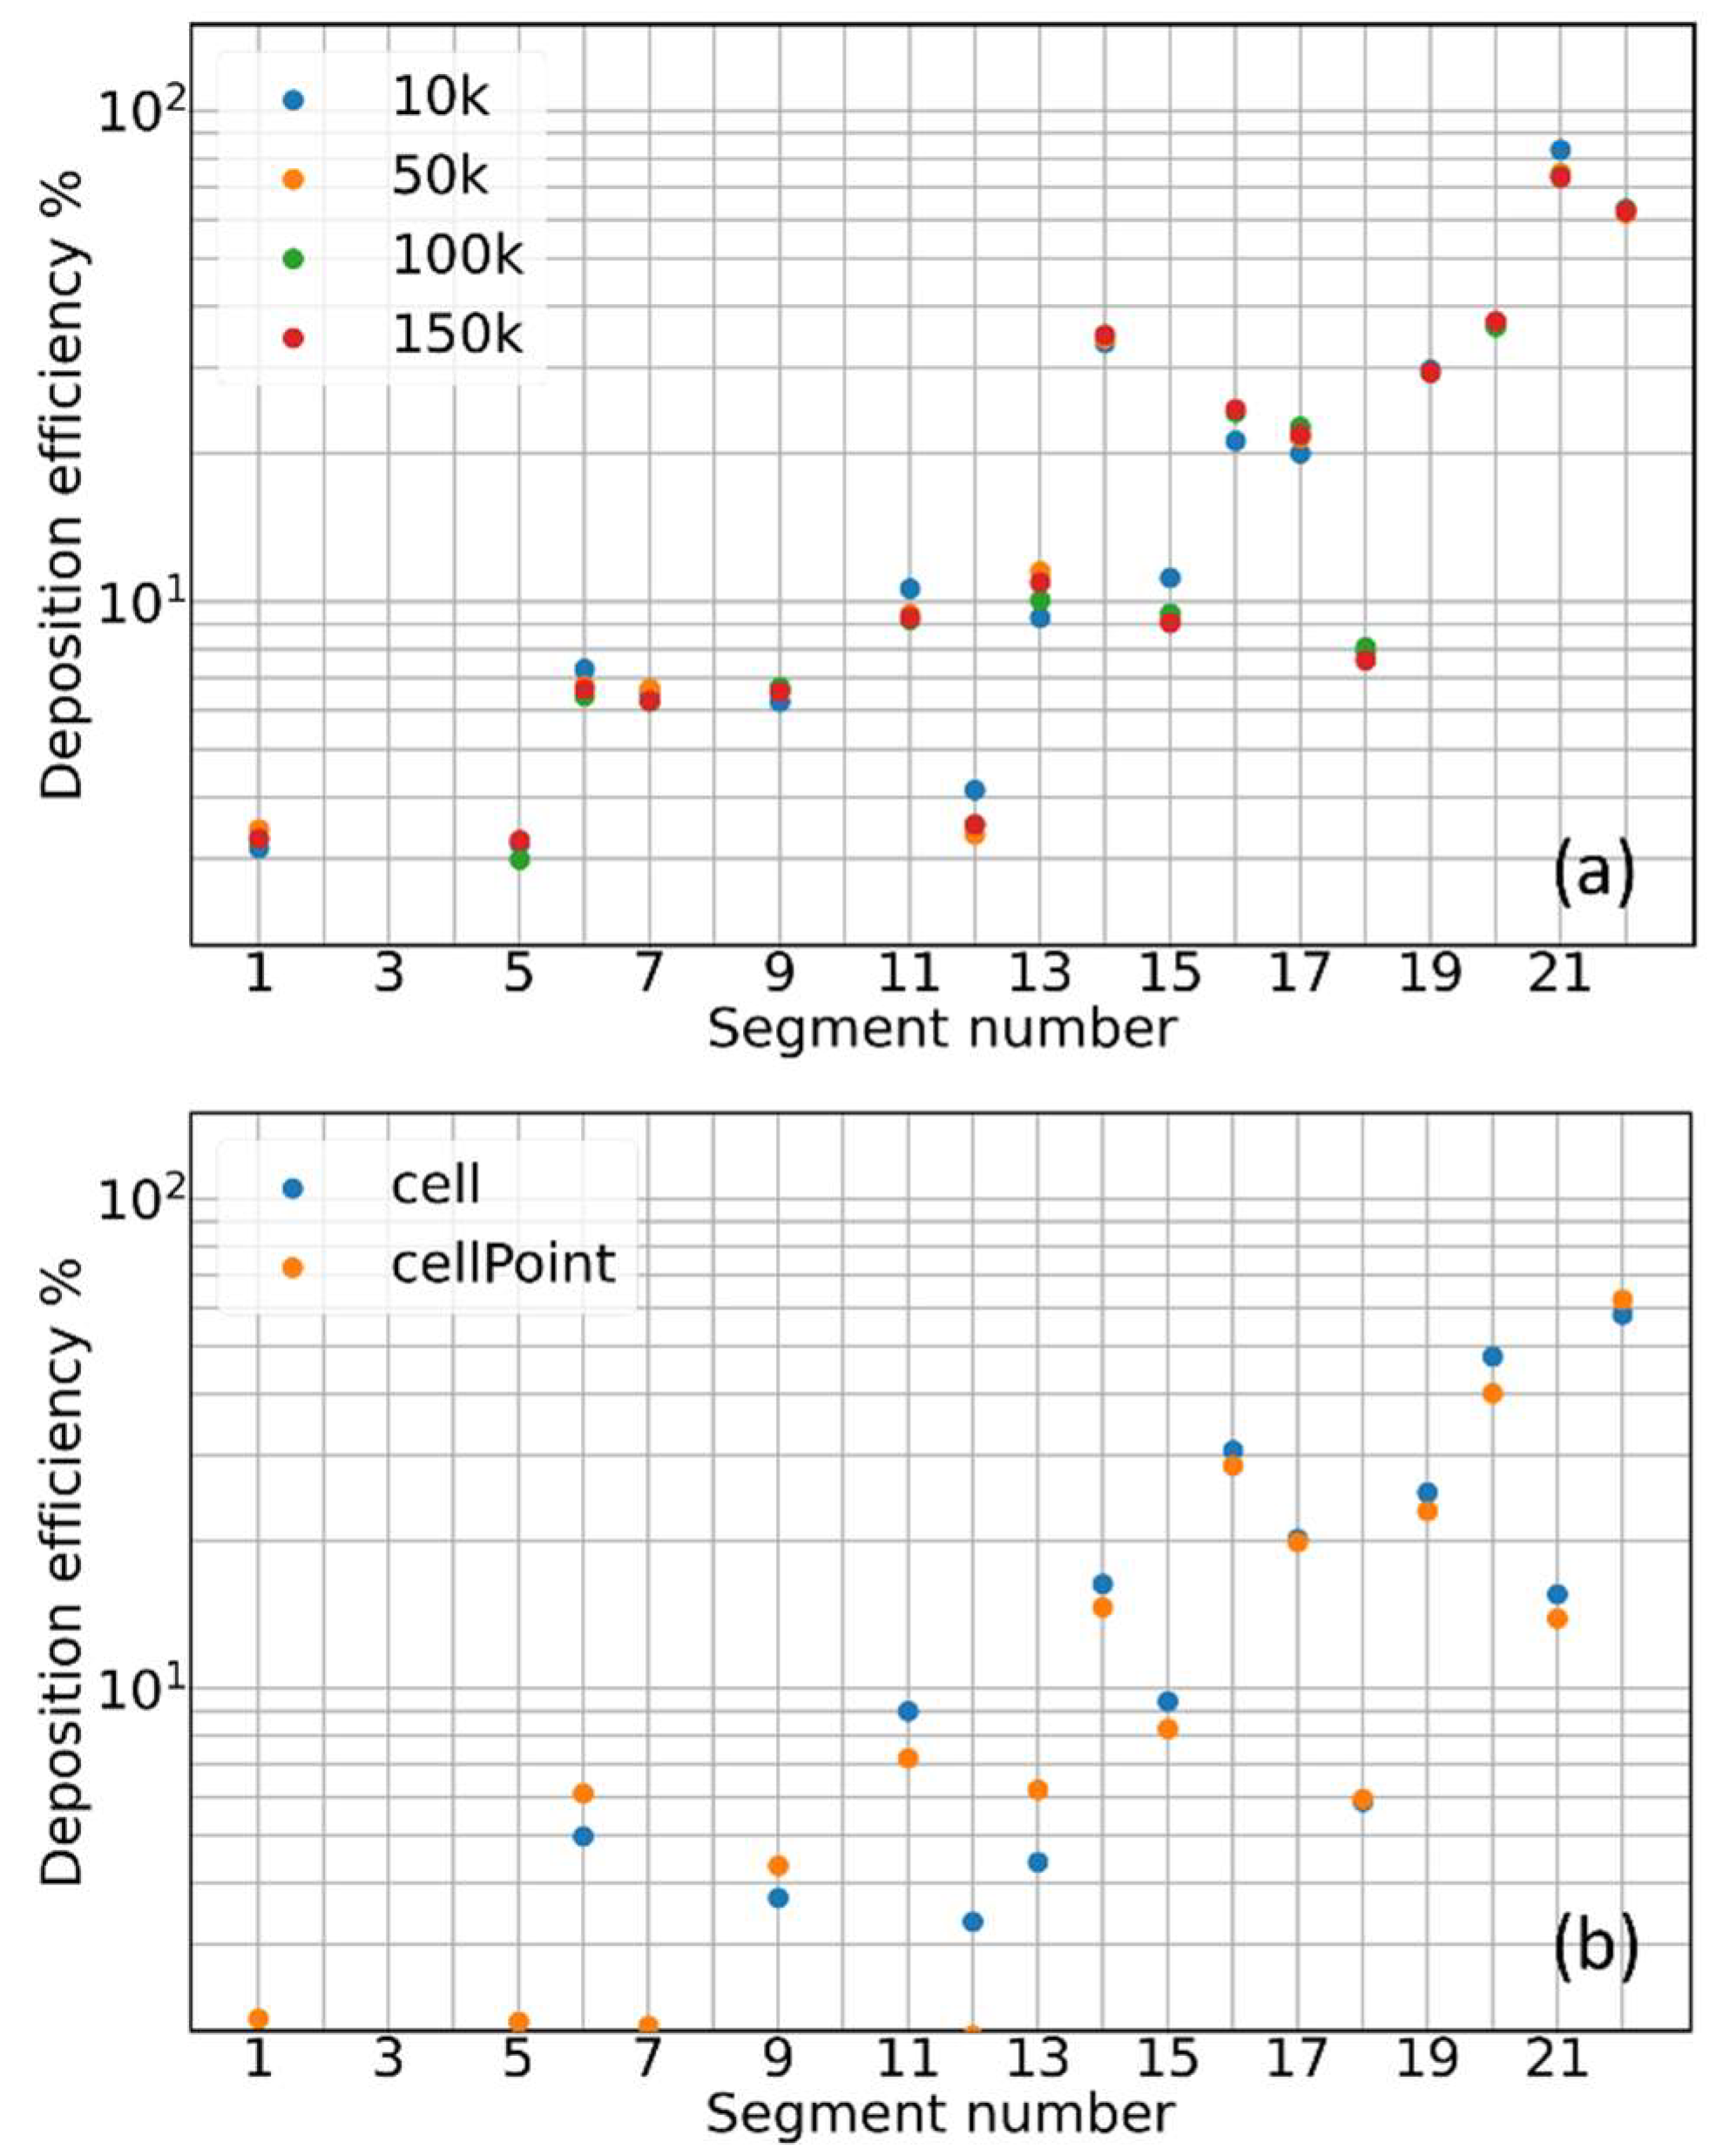
- Deposition Efficiency: the ratio of the amount of aerosol particles/mass sticking onto the inner walls of each individual segment of the cast/computational domain to the amount of particles/mass of the aerosol that entered such individual segment of the cast/computational domain :It provides a measure of the stopping powder of each individual portion of the tracheobronchial tree.
3. Results
3.1. Mesh Sensitivity of Calculated Aerosol Deposition
3.2. Contribution of Resolved and Modeled Time Fluctuations on Aerosol Deposition
3.3. Role of Flow-Driving Strategies on Aerosol Transport and Deposition
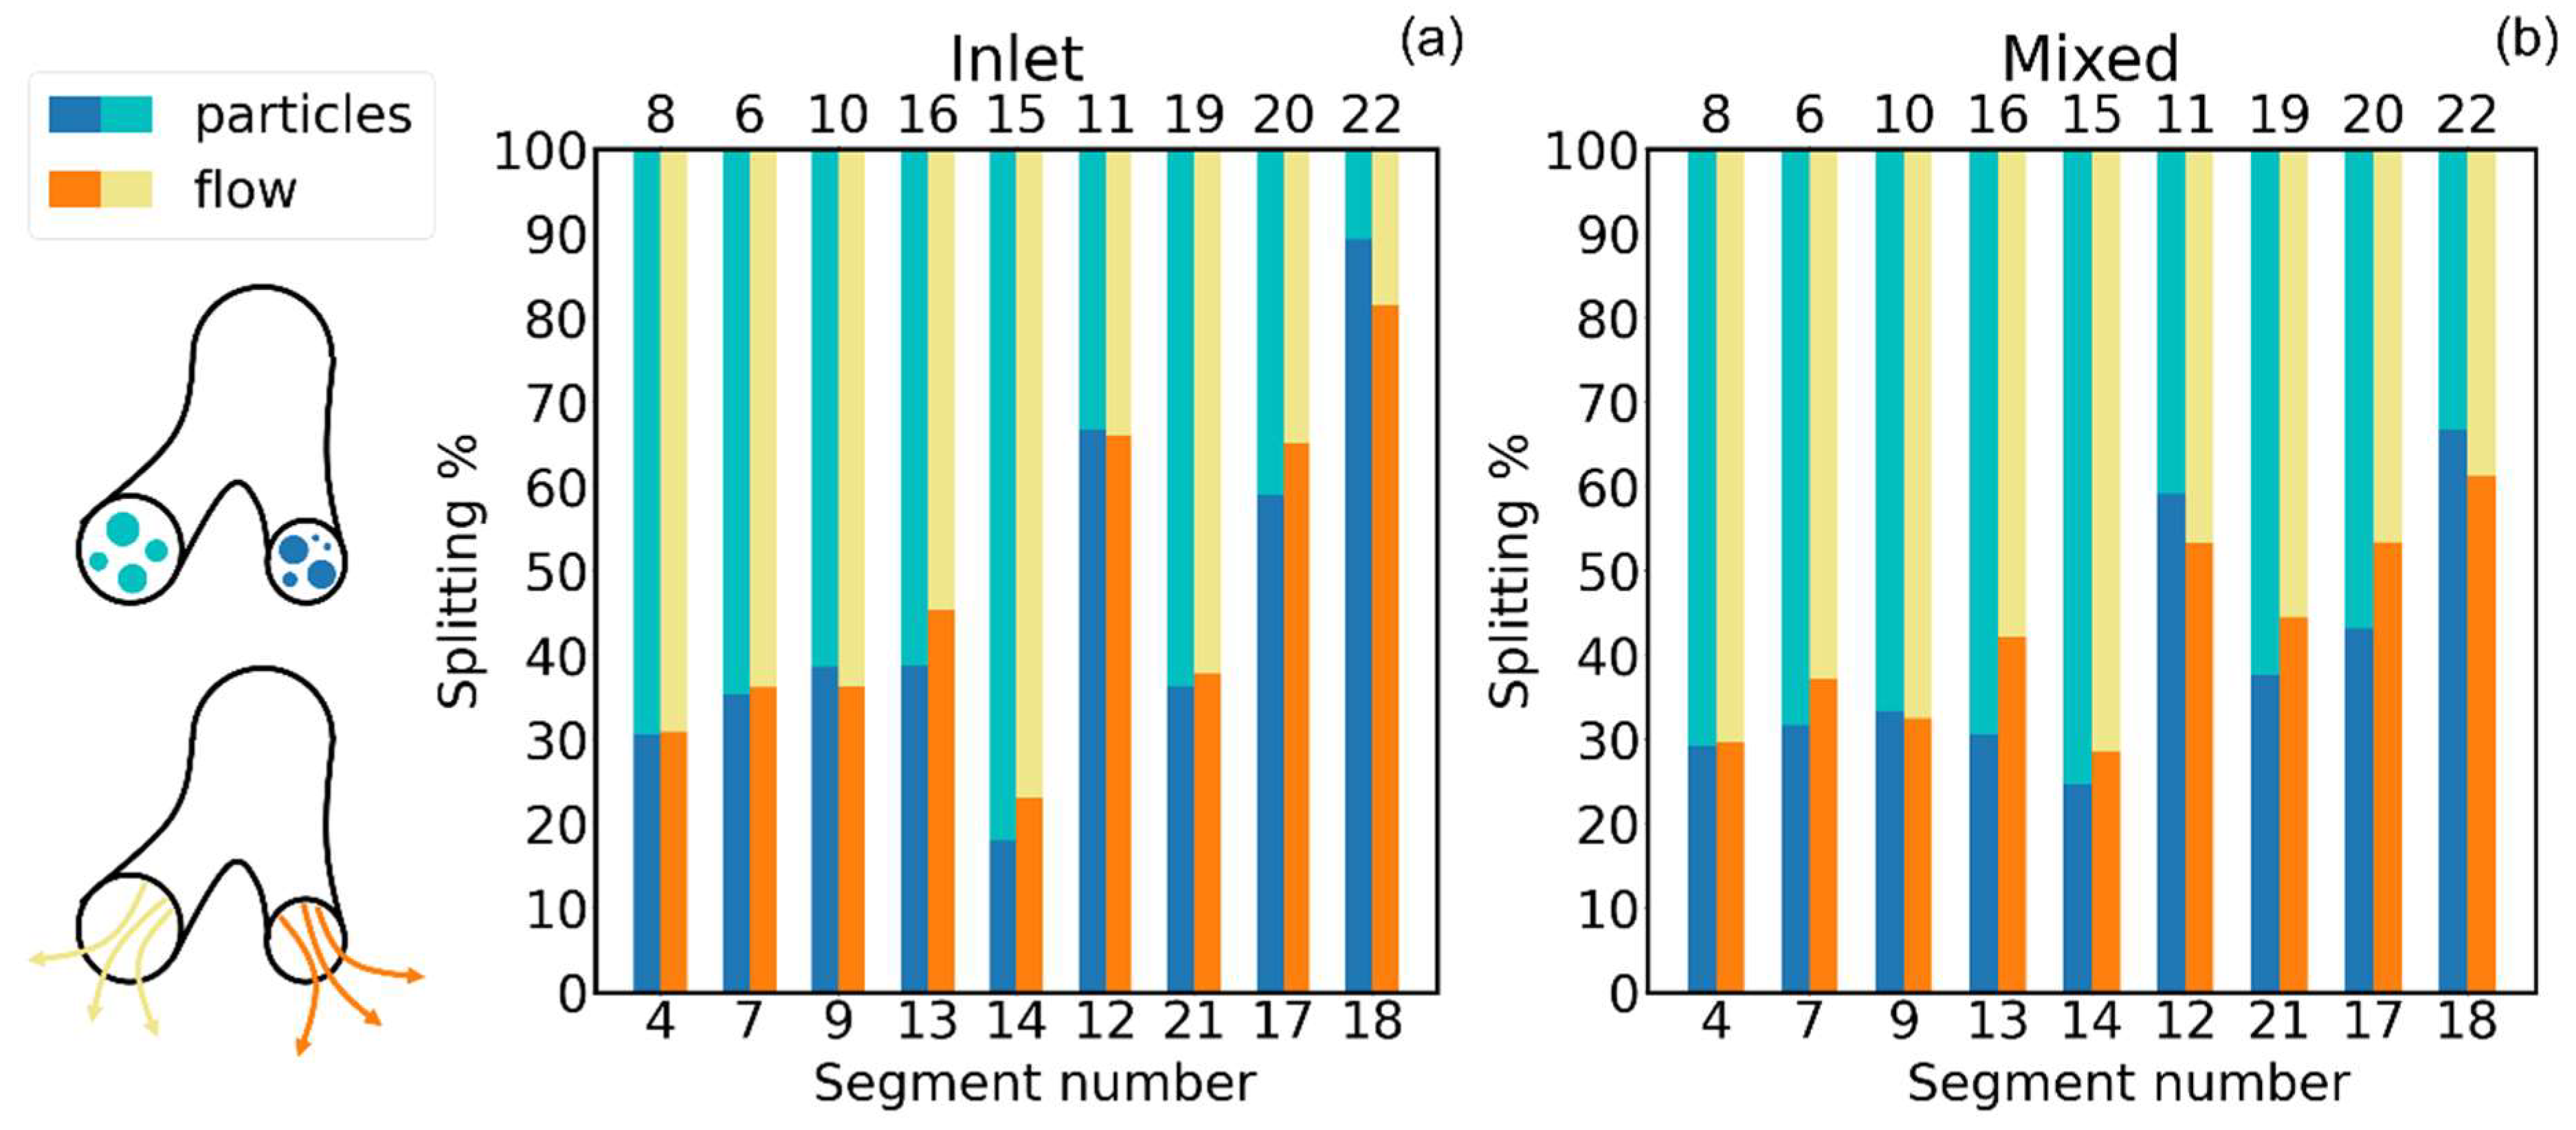
3.4. Effect of Inhaler Flow Type on Aerosol Deposition
3.5. Deposition for Different Aerosol Particle Sizes
4. Conclusions
Supplementary Materials
Author Contributions
Funding
Institutional Review Board Statement
Informed Consent Statement
Data Availability Statement
Conflicts of Interest
References
- Feng, Y.; Zhao, J.; Hayati, H.; Sperry, T.; Yi, H. Tutorial: Understanding the Transport, Deposition, and Translocation of Particles in Human Respiratory Systems Using Computational Fluid-Particle Dynamics and Physiologically Based Toxicokinetic Models. J. Aerosol Sci. 2021, 151, 105672. [Google Scholar] [CrossRef]
- Neelakantan, S.; Xin, Y.; Gaver, D.P.; Cereda, M.; Rizi, R.; Smith, B.J.; Avazmohammadi, R. Computational Lung Modelling in Respiratory Medicine. J. R. Soc. Interface 2022, 19, 20220062. [Google Scholar] [CrossRef]
- Mutuku, J.K.; Hou, W.; Chen, W. An Overview of Experiments and Numerical Simulations on Airflow and Aerosols Deposition in Human Airways and the Role of Bioaerosol Motion in COVID-19 Transmission Justus. Aerosol Air Qual. Res. 2020, 20, 1172–1196. [Google Scholar] [CrossRef]
- Longest, P.W.; Holbrook, L.T. In Silico Models of Aerosol Delivery to the Respiratory Tract—Development and Applications. Adv. Drug Deliv. Rev. 2012, 64, 296–311. [Google Scholar] [CrossRef] [PubMed]
- Wedel, J.; Steinmann, P.; Štrakl, M.; Hriberšek, M.; Ravnik, J. Can CFD Establish a Connection to a Milder COVID-19 Disease in Younger People? Aerosol Deposition in Lungs of Different Age Groups Based on Lagrangian Particle Tracking in Turbulent Flow. Comput. Mech. 2021, 67, 1497–1513. [Google Scholar] [CrossRef] [PubMed]
- Wong, W.; Fletcher, D.F.; Traini, D.; Chan, H.K.; Young, P.M. The Use of Computational Approaches in Inhaler Development. Adv. Drug Deliv. Rev. 2012, 64, 312–322. [Google Scholar] [CrossRef] [PubMed]
- (Ravi) Kannan, R.; Przekwas, A.J.; Singh, N.; Delvadia, R.; Tian, G.; Walenga, R. Pharmaceutical Aerosols Deposition Patterns from a Dry Powder Inhaler: Euler Lagrangian Prediction and Validation. Med. Eng. Phys. 2017, 42, 35–47. [Google Scholar] [CrossRef] [PubMed]
- Tullio, M.; Aliboni, L.; Pennati, F.; Carrinola, R.; Palleschi, A.; Aliverti, A. Computational Fluid Dynamics of the Airways after Left-Upper Pulmonary Lobectomy: A Case Study. Int. J. Numer. Method. Biomed. Eng. 2021, 37, e3462. [Google Scholar] [CrossRef]
- Zhang, Z.; Kleinstreuer, C.; Hyun, S. Size-Change and Deposition of Conventional and Composite Cigarette Smoke Particles during Inhalation in a Subject-Specific Airway Model. J. Aerosol Sci. 2012, 46, 34–52. [Google Scholar] [CrossRef]
- Spasov, G.H.; Rossi, R.; Vanossi, A.; Cottini, C.; Benassi, A. A Critical Analysis of the CFD-DEM Simulation of Pharmaceutical Aerosols Deposition in Upper Intra-Thoracic Airways: Considerations on Air Flow. Comput. Biol. Med. 2024, 170, 107948. [Google Scholar] [CrossRef]
- Walenga, R.L.; Butler, C.; Craven, B.A.; Longest, P.W.; Mohamed, R.; Newman, B.; Olsson, B.; Hochhaus, G.; Li, B.V.; Luke, M.C.; et al. Mechanistic Modeling of Generic Orally Inhaled Drug Products: A Workshop Summary Report. CPT Pharmacomet. Syst. Pharmacol. 2022, 12, 560–574. [Google Scholar] [CrossRef]
- Walenga, R.L.; Babiskin, A.H.; Zhao, L. In Silico Methods for Development of Generic Drug–Device Combination Orally Inhaled Drug Products. CPT Pharmacomet. Syst. Pharmacol. 2019, 8, 359–370. [Google Scholar] [CrossRef] [PubMed]
- Food and Drug Administration (FDA). Assessing the Credibility of Computational Modeling and Simulation in Medical Device Submissions; Food and Drug Administration (FDA): Silver Spring, MD, USA, 2021; pp. 1–35. [Google Scholar]
- Assessing Credibility of Computational Modeling through Verification and Validation: Application to Medical Devices, V & V 40; ASME: New York, NY, USA, 2018; ISBN 9780791872048.
- Spasov, G.H.; Rossi, R.; Vanossi, A.; Cottini, C.; Benassi, A. A Critical Analysis of the CFD-DEM Simulation of Pharmaceutical Aerosols Deposition in Extra-Thoracic Airways. Int. J. Pharm. 2022, 629, 122331. [Google Scholar] [CrossRef]
- Koullapis, P.; Kassinos, S.C.; Muela, J.; Perez-Segarra, C.; Rigola, J.; Lehmkuhl, O.; Cui, Y.; Sommerfeld, M.; Elcner, J.; Jicha, M.; et al. Regional Aerosol Deposition in the Human Airways: The SimInhale Benchmark Case and a Critical Assessment of in Silico Methods. Eur. J. Pharm. Sci. 2018, 113, 77–94. [Google Scholar] [CrossRef] [PubMed]
- Lizal, F.; Belka, M.; Adam, J.; Jedelsky, J.; Jicha, M. A Method for in Vitro Regional Aerosol Deposition Measurement in a Model of the Human Tracheobronchial Tree by the Positron Emission Tomography. Proc. Inst. Mech. Eng. Part H J. Eng. Med. 2015, 229, 750–757. [Google Scholar] [CrossRef] [PubMed]
- Various ERCOFTAC Siminhale Project. Available online: https://www.kbwiki.ercoftac.org/w/index.php/Abstr:AC7-01 (accessed on 23 August 2024).
- Sommerfeld, M.; Sgrott, O.L.; Taborda, M.A.; Koullapis, P.; Bauer, K.; Kassinos, S. Analysis of Flow Field and Turbulence Predictions in a Lung Model Applying RANS and Implications for Particle Deposition. Eur. J. Pharm. Sci. 2021, 166, 105959. [Google Scholar] [CrossRef] [PubMed]
- Janke, T.; Koullapis, P.; Kassinos, S.C.; Bauer, K. PIV Measurements of the SimInhale Benchmark Case. Eur. J. Pharm. Sci. 2019, 133, 183–189. [Google Scholar] [CrossRef]
- Lizal, F.; Elcner, J.; Hopke, P.K.; Jedelsky, J.; Jicha, M. Development of a Realistic Human Airway Model. Proc. Inst. Mech. Eng. Part H J. Eng. Med. 2012, 226, 197–207. [Google Scholar] [CrossRef] [PubMed]
- Weller, H.G.; Tabor, G.; Jasak, H.; Fureby, C. A Tensorial Approach to Computational Continuum Mechanics Using Object-Oriented Techniques. Comput. Phys. 1998, 12, 620–631. [Google Scholar] [CrossRef]
- The OpenFOAM Foundation. Available online: https://openfoam.org/ (accessed on 23 August 2024).
- Menter, F.R.; Kuntz, M.; Langtry, R. Ten Years of Industrial Experience with the SST Turbulence Model; Hanjalic, F.R., Nagano, Y., Tummers, M., Eds.; Begell House: West Redding, CT, USA, 2003. [Google Scholar]
- Putnam, A. Integrable Form of Droplet Drag Coefficient. Ars J. 1961, 31, 1467. [Google Scholar]
- Ponzini, R.; Da Vià, R.; Bnà, S.; Cottini, C.; Benassi, A. Coupled CFD-DEM Model for Dry Powder Inhalers Simulation: Validation and Sensitivity Analysis for the Main Model Parameters. Powder Technol. 2021, 385, 199–226. [Google Scholar] [CrossRef]
- Worth Longest, P.; Hindle, M. Evaluation of the Respimat Soft Mist Inhaler Using a Concurrent Cfd and in Vitro Approach. J. Aerosol Med. Pulm. Drug Deliv. 2009, 22, 99–112. [Google Scholar] [CrossRef] [PubMed]
- Gosman, A.D.; Loannides, E. Aspects of Computer Simulation of Liquid-Fueled Combustors. J. Energy 1983, 7, 482–490. [Google Scholar] [CrossRef]
- Matida, E.A.; Finlay, W.H.; Lange, C.F.; Grgic, B. Improved Numerical Simulation of Aerosol Deposition in an Idealized Mouth–Throat. J. Aerosol Sci. 2004, 35, 1–19. [Google Scholar] [CrossRef]
- Mofakham, A.A.; Ahmadi, G. On Random Walk Models for Simulation of Particle-Laden Turbulent Flows. Int. J. Multiph. Flow. 2020, 122, 103157. [Google Scholar] [CrossRef]
- Mofakham, A.A.; Ahmadi, G. Improved Discrete Random Walk Stochastic Model for Simulating Particle Dispersion and Deposition in Inhomogeneous Turbulent Flows. J. Fluids Eng. Trans. ASME 2020, 142, 101401. [Google Scholar] [CrossRef]
- Zhao, J.; Haghnegahdar, A.; Feng, Y.; Patil, A.; Kulkarni, N.; Singh, G.J.P.; Malhotra, G.; Bharadwaj, R. Prediction of the Carrier Shape Effect on Particle Transport, Interaction and Deposition in Two Dry Powder Inhalers and a Mouth-to-G13 Human Respiratory System: A CFD-DEM Study. J. Aerosol Sci. 2022, 160, 105899. [Google Scholar] [CrossRef]
- Babamiri, A.; Ahookhosh, K.; Abdollahi, H.; Taheri, M.H.; Cui, X.; Nabaei, M.; Farnoud, A. Effect of Laryngeal Jet on Dry Powder Inhaler Aerosol Deposition: A Numerical Simulation. Comput. Methods Biomech. Biomed. Eng. 2023, 26, 1859–1874. [Google Scholar] [CrossRef]
- Rahman, M.; Zhao, M.; Islam, M.S.; Dong, K.; Saha, S.C. Nanoparticle Transport and Deposition in a Heterogeneous Human Lung Airway Tree: An Efficient One Path Model for CFD Simulations. Eur. J. Pharm. Sci. 2022, 177, 106279. [Google Scholar] [CrossRef]
- Yousefi, M.; Pourmehran, O.; Gorji-Bandpy, M.; Inthavong, K.; Yeo, L.; Tu, J. CFD Simulation of Aerosol Delivery to a Human Lung via Surface Acoustic Wave Nebulization. Biomech. Model. Mechanobiol. 2017, 16, 2035–2050. [Google Scholar] [CrossRef] [PubMed]
- Islam, M.S.; Saha, S.C.; Sauret, E.; Gu, Y.T.; Molla, M.M. Numerical Investigation of Diesel Exhaust Particle Transport and Deposition in the CT-Scan Based Lung Airway. AIP Conf. Proc. 2017, 1851, 20092. [Google Scholar] [CrossRef]
- Rahman, M.; Zhao, M.; Islam, M.S.; Dong, K.; Saha, S.C. Numerical Study of Nanoscale and Microscale Particle Transport in Realistic Lung Models with and without Stenosis. Int. J. Multiph. Flow 2021, 145, 103842. [Google Scholar] [CrossRef]
- Rahimi-Gorji, M.; Gorji, T.B.; Gorji-Bandpy, M. Details of Regional Particle Deposition and Airflow Structures in a Realistic Model of Human Tracheobronchial Airways: Two-Phase Flow Simulation. Comput. Biol. Med. 2016, 74, 1–17. [Google Scholar] [CrossRef] [PubMed]
- Talaat, M.; Si, X.; Xi, J. Effect of MDI Actuation Timing on Inhalation Dosimetry in a Human Respiratory Tract Model. Pharmaceuticals 2022, 15, 61. [Google Scholar] [CrossRef]
- Gurumurthy, A.; Kleinstreuer, C. Helical Fluid-Particle Flow Dynamics for Controlling Micron-Particle Deposition in a Representative Human Upper Lung-Airway Model. J. Aerosol Sci. 2021, 151, 105656. [Google Scholar] [CrossRef]
- Kim, Y.H.; Li, D.D.; Park, S.; Yi, D.S.; Yeoh, G.H.; Abbas, A. Computational Investigation of Particle Penetration and Deposition Pattern in a Realistic Respiratory Tract Model from Different Types of Dry Powder Inhalers. Int. J. Pharm. 2022, 612, 121293. [Google Scholar] [CrossRef] [PubMed]
- Jin, H.H.; Fan, J.R.; Zeng, M.J.; Cen, K.F. Large Eddy Simulation of Inhaled Particle Deposition within the Human Upper Respiratory Tract. J. Aerosol Sci. 2007, 38, 257–268. [Google Scholar] [CrossRef]
- Wedel, J.; Steinmann, P.; Štrakl, M.; Hriberšek, M.; Cui, Y.; Ravnik, J. Anatomy Matters: The Role of the Subject-Specific Respiratory Tract on Aerosol Deposition—A CFD Study. Comput. Methods Appl. Mech. Eng. 2022, 401, 115372. [Google Scholar] [CrossRef]
- Zhao, J.; Feng, Y.; Koshiyama, K.; Wu, H. Prediction of Airway Deformation Effect on Pulmonary Air-Particle Dynamics: A Numerical Study. Phys. Fluids 2021, 33, 101906. [Google Scholar] [CrossRef]
- Hayati, H.; Feng, Y.; Hinsdale, M. Inter-Species Variabilities of Droplet Transport, Size Change, and Deposition in Human and Rat Respiratory Systems: An in Silico Study. J. Aerosol Sci. 2021, 154, 105761. [Google Scholar] [CrossRef]
- Poorbahrami, K.; Mummy, D.G.; Fain, S.B.; Oakes, J.M. Patient-Specific Modeling of Aerosol Delivery in Healthy and Asthmatic Adults. J. Appl. Physiol. 2019, 127, 1720–1732. [Google Scholar] [CrossRef] [PubMed]
- Spasov, G.H.; Rossi, R.; Vanossi, A.; Cottini, C.; Benassi, A. A Critical Analysis of the CFD-DEM Simulation of Pharmaceutical Aerosols Deposition in Upper Intra-Thoracic Airways: Considerations on Aerosol Transport and Deposition. 2024; In preparation. [Google Scholar]
- Kannan, R.; Guo, P.; Przekwas, A. Particle Transport in the Human Respiratory Tract: Formulation of a Nodal Inverse Distance Weighted Eulerian–Lagrangian Transport and Implementation of the Wind–Kessel Algorithm for an Oral Delivery. Int. J. Numer. Methods Biomed. Eng. 2016, 37, e02746. [Google Scholar] [CrossRef] [PubMed]
- Anjilvel, S.; Asgharian, B. A Multiple-Path Model of Particle Deposition in the Rat Lung. Toxicol. Sci. 1995, 28, 41–50. [Google Scholar] [CrossRef]
- Koblinger, L.; Hofmann, W. Monte Carlo Modeling of Aerosol Deposition in Human Lungs. Part I: Simulation of Particle Transport in a Stochastic Lung Structure. J. Aerosol Sci. 1990, 21, 661–674. [Google Scholar] [CrossRef]
- Sonnenberg, A.H.; Herrmann, J.; Grinstaff, M.W.; Suki, B. A Markov Chain Model of Particle Deposition in the Lung. Sci. Rep. 2020, 10, 13573. [Google Scholar] [CrossRef]
- Cai, F.S.; Yu, C.P. Inertial and Interceptional Deposition of Spherical Particles and Fibers in a Bifurcating Airway. J. Aerosol Sci. 1988, 19, 679–688. [Google Scholar] [CrossRef]
- Gurumurthy, A.; Kleinstreuer, C. Analysis of Improved Oral Drug Delivery with Different Helical Stream Inhalation Modes. Comput. Biol. Med. 2022, 141, 105132. [Google Scholar] [CrossRef]
- Taheri, M.H.; Pourmehran, O.; Sarafraz, M.M.; Ahookhosh, K.; Farnoud, A.; Cui, X. Effect of Swirling Flow and Particle-Release Pattern on Drug Delivery to Human Tracheobronchial Airways. Biomech. Model. Mechanobiol. 2021, 20, 2451–2469. [Google Scholar] [CrossRef]
- Li, Y.; Huang, F.; Zhou, X.; Tong, Z. In Silico Study on the Deposition and Distribution of Particles in a Realistic Airway Model with Handilaher®. BIO Web Conf. 2023, 59, 03010. [Google Scholar] [CrossRef]
- Pasquali, I.; Merusi, C.; Brambilla, G.; Long, E.J.; Hargrave, G.K.; Versteeg, H.K. Optical Diagnostics Study of Air Flow and Powder Fluidisation in Nexthaler®—Part I: Studies with Lactose Placebo Formulation. Int. J. Pharm. 2015, 496, 780–791. [Google Scholar] [CrossRef]
- Kuga, K.; Kizuka, R.; Khoa, N.D.; Ito, K. Effect of Transient Breathing Cycle on the Deposition of Micro and Nanoparticles on Respiratory Walls. Comput. Methods Programs Biomed. 2023, 236, 107501. [Google Scholar] [CrossRef] [PubMed]
- Luo, H.Y.; Liu, Y. Particle Deposition in a CT-Scanned Human Lung Airway. J. Biomech. 2009, 42, 1869–1876. [Google Scholar] [CrossRef]
- Sadafi, H.; Monshi Tousi, N.; De Backer, W.; De Backer, J. Validation of Computational Fluid Dynamics Models for Airway Deposition with SPECT Data of the Same Population. Sci. Rep. 2024, 14, 5492. [Google Scholar] [CrossRef] [PubMed]
- Ohno, Y.; Seo, J.B.; Parraga, G.; Lee, K.S.; Gefter, W.B.; Fain, S.B.; Schiebler, M.L.; Hatabu, H. Pulmonary Functional Imaging: Part 1-State-of-the-Art Technical and Physiologic Underpinnings. Radiology 2021, 299, 508–523. [Google Scholar] [CrossRef]
- Bayat, S.; Wild, J.; Winkler, T. Lung Functional Imaging. Breathe 2023, 19, 220272. [Google Scholar] [CrossRef]
- Marchioli, C. Large-Eddy Simulation of Turbulent Dispersed Flows: A Review of Modelling Approaches. Acta Mech. 2017, 228, 741–771. [Google Scholar] [CrossRef]
- Calmet, H.; Oks, D.; Santiago, A.; Houzeaux, G.; Le Corfec, A.; Deruyver, L.; Rigaut, C.; Lambert, P.; Haut, B.; Goole, J. Validation and Sensitivity Analysis for a Nasal Spray Deposition Computational Model. Int. J. Pharm. 2022, 626, 122118. [Google Scholar] [CrossRef] [PubMed]
- Feng, Y.; Zhao, J.; Kleinstreuer, C.; Wang, Q.; Wang, J.; Wu, D.H.; Lin, J. An in Silico Inter-Subject Variability Study of Extra-Thoracic Morphology Effects on Inhaled Particle Transport and Deposition. J. Aerosol Sci. 2018, 123, 185–207. [Google Scholar] [CrossRef]
- Borojeni, A.A.T.; Gu, W.; Asgharian, B.; Price, O.; Kuprat, A.P.; Singh, R.K.; Colby, S.; Corley, R.A.; Darquenne, C. In Silico Quantification of Intersubject Variability on Aerosol Deposition in the Oral Airway. Pharmaceutics 2023, 15, 160. [Google Scholar] [CrossRef]


Disclaimer/Publisher’s Note: The statements, opinions and data contained in all publications are solely those of the individual author(s) and contributor(s) and not of MDPI and/or the editor(s). MDPI and/or the editor(s) disclaim responsibility for any injury to people or property resulting from any ideas, methods, instructions or products referred to in the content. |
© 2024 by the authors. Licensee MDPI, Basel, Switzerland. This article is an open access article distributed under the terms and conditions of the Creative Commons Attribution (CC BY) license (https://creativecommons.org/licenses/by/4.0/).
Share and Cite
Spasov, G.H.; Rossi, R.; Vanossi, A.; Cottini, C.; Benassi, A. A Critical Analysis of the CFD-DEM Simulation of Pharmaceutical Aerosols Deposition in Upper Intra-Thoracic Airways: Considerations on Aerosol Transport and Deposition. Pharmaceutics 2024, 16, 1119. https://doi.org/10.3390/pharmaceutics16091119
Spasov GH, Rossi R, Vanossi A, Cottini C, Benassi A. A Critical Analysis of the CFD-DEM Simulation of Pharmaceutical Aerosols Deposition in Upper Intra-Thoracic Airways: Considerations on Aerosol Transport and Deposition. Pharmaceutics. 2024; 16(9):1119. https://doi.org/10.3390/pharmaceutics16091119
Chicago/Turabian StyleSpasov, Georgi H., Riccardo Rossi, Andrea Vanossi, Ciro Cottini, and Andrea Benassi. 2024. "A Critical Analysis of the CFD-DEM Simulation of Pharmaceutical Aerosols Deposition in Upper Intra-Thoracic Airways: Considerations on Aerosol Transport and Deposition" Pharmaceutics 16, no. 9: 1119. https://doi.org/10.3390/pharmaceutics16091119