
Direct and Abscopal Antitumor Responses Elicited by AlPcNE-Mediated Photodynamic Therapy in a Murine Melanoma Model
 , , , , , , , , , ,
  , , ,
, , , 

Abstract
1. Introduction
2. Materials and Methods
2.1. Cell Culture
2.2. Animals
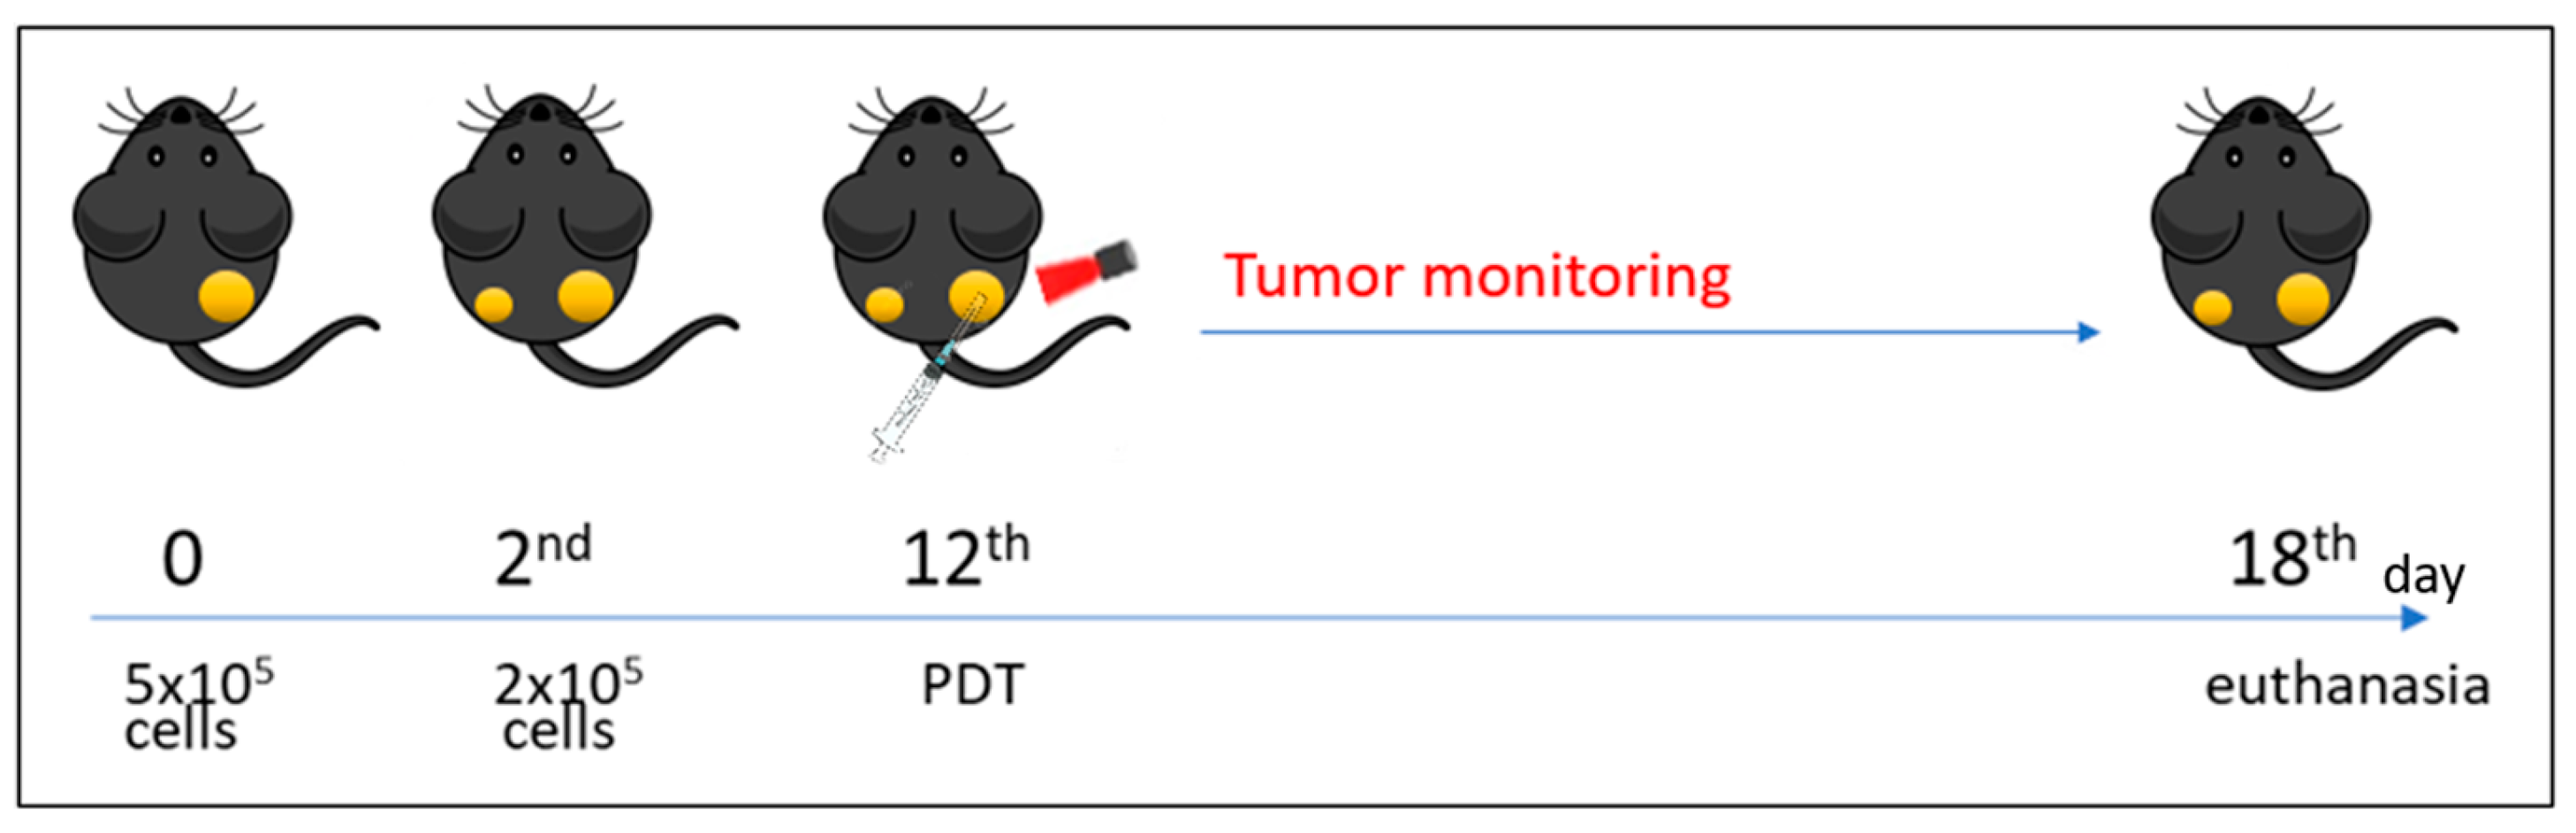
2.3. Tumor Model
2.4. Photodynamic Therapy Protocols
2.5. Hematological Parameters Analysis
2.6. Histology Analysis
2.7. Flow Cytometry Analysis
2.8. Gene Expression Evaluation
2.9. Statistical Analysis
3. Results
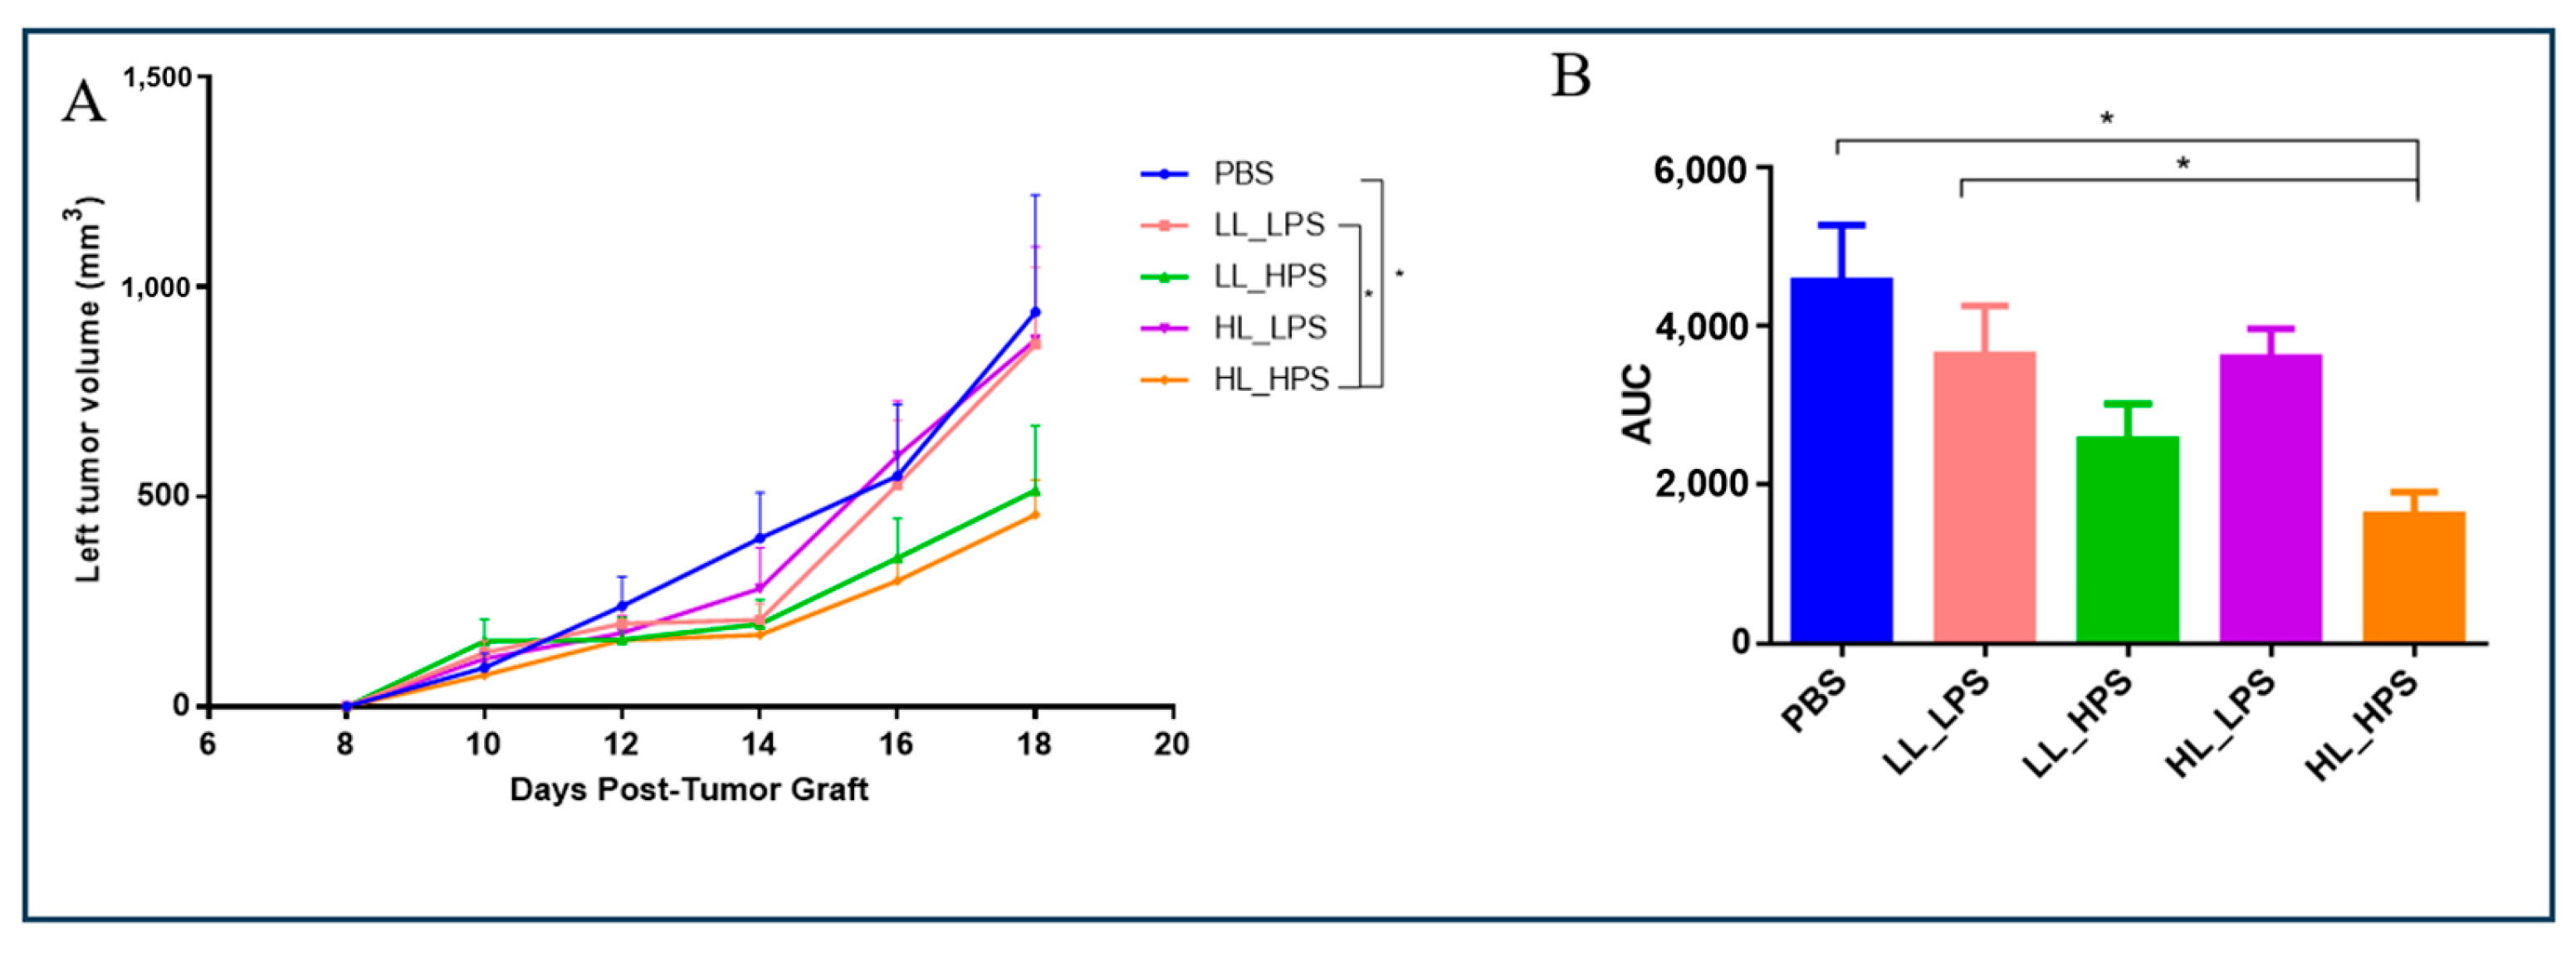
3.1. The PDT Protocols, except LL_LPS, Reduced the Growth of the Irradiated Tumor
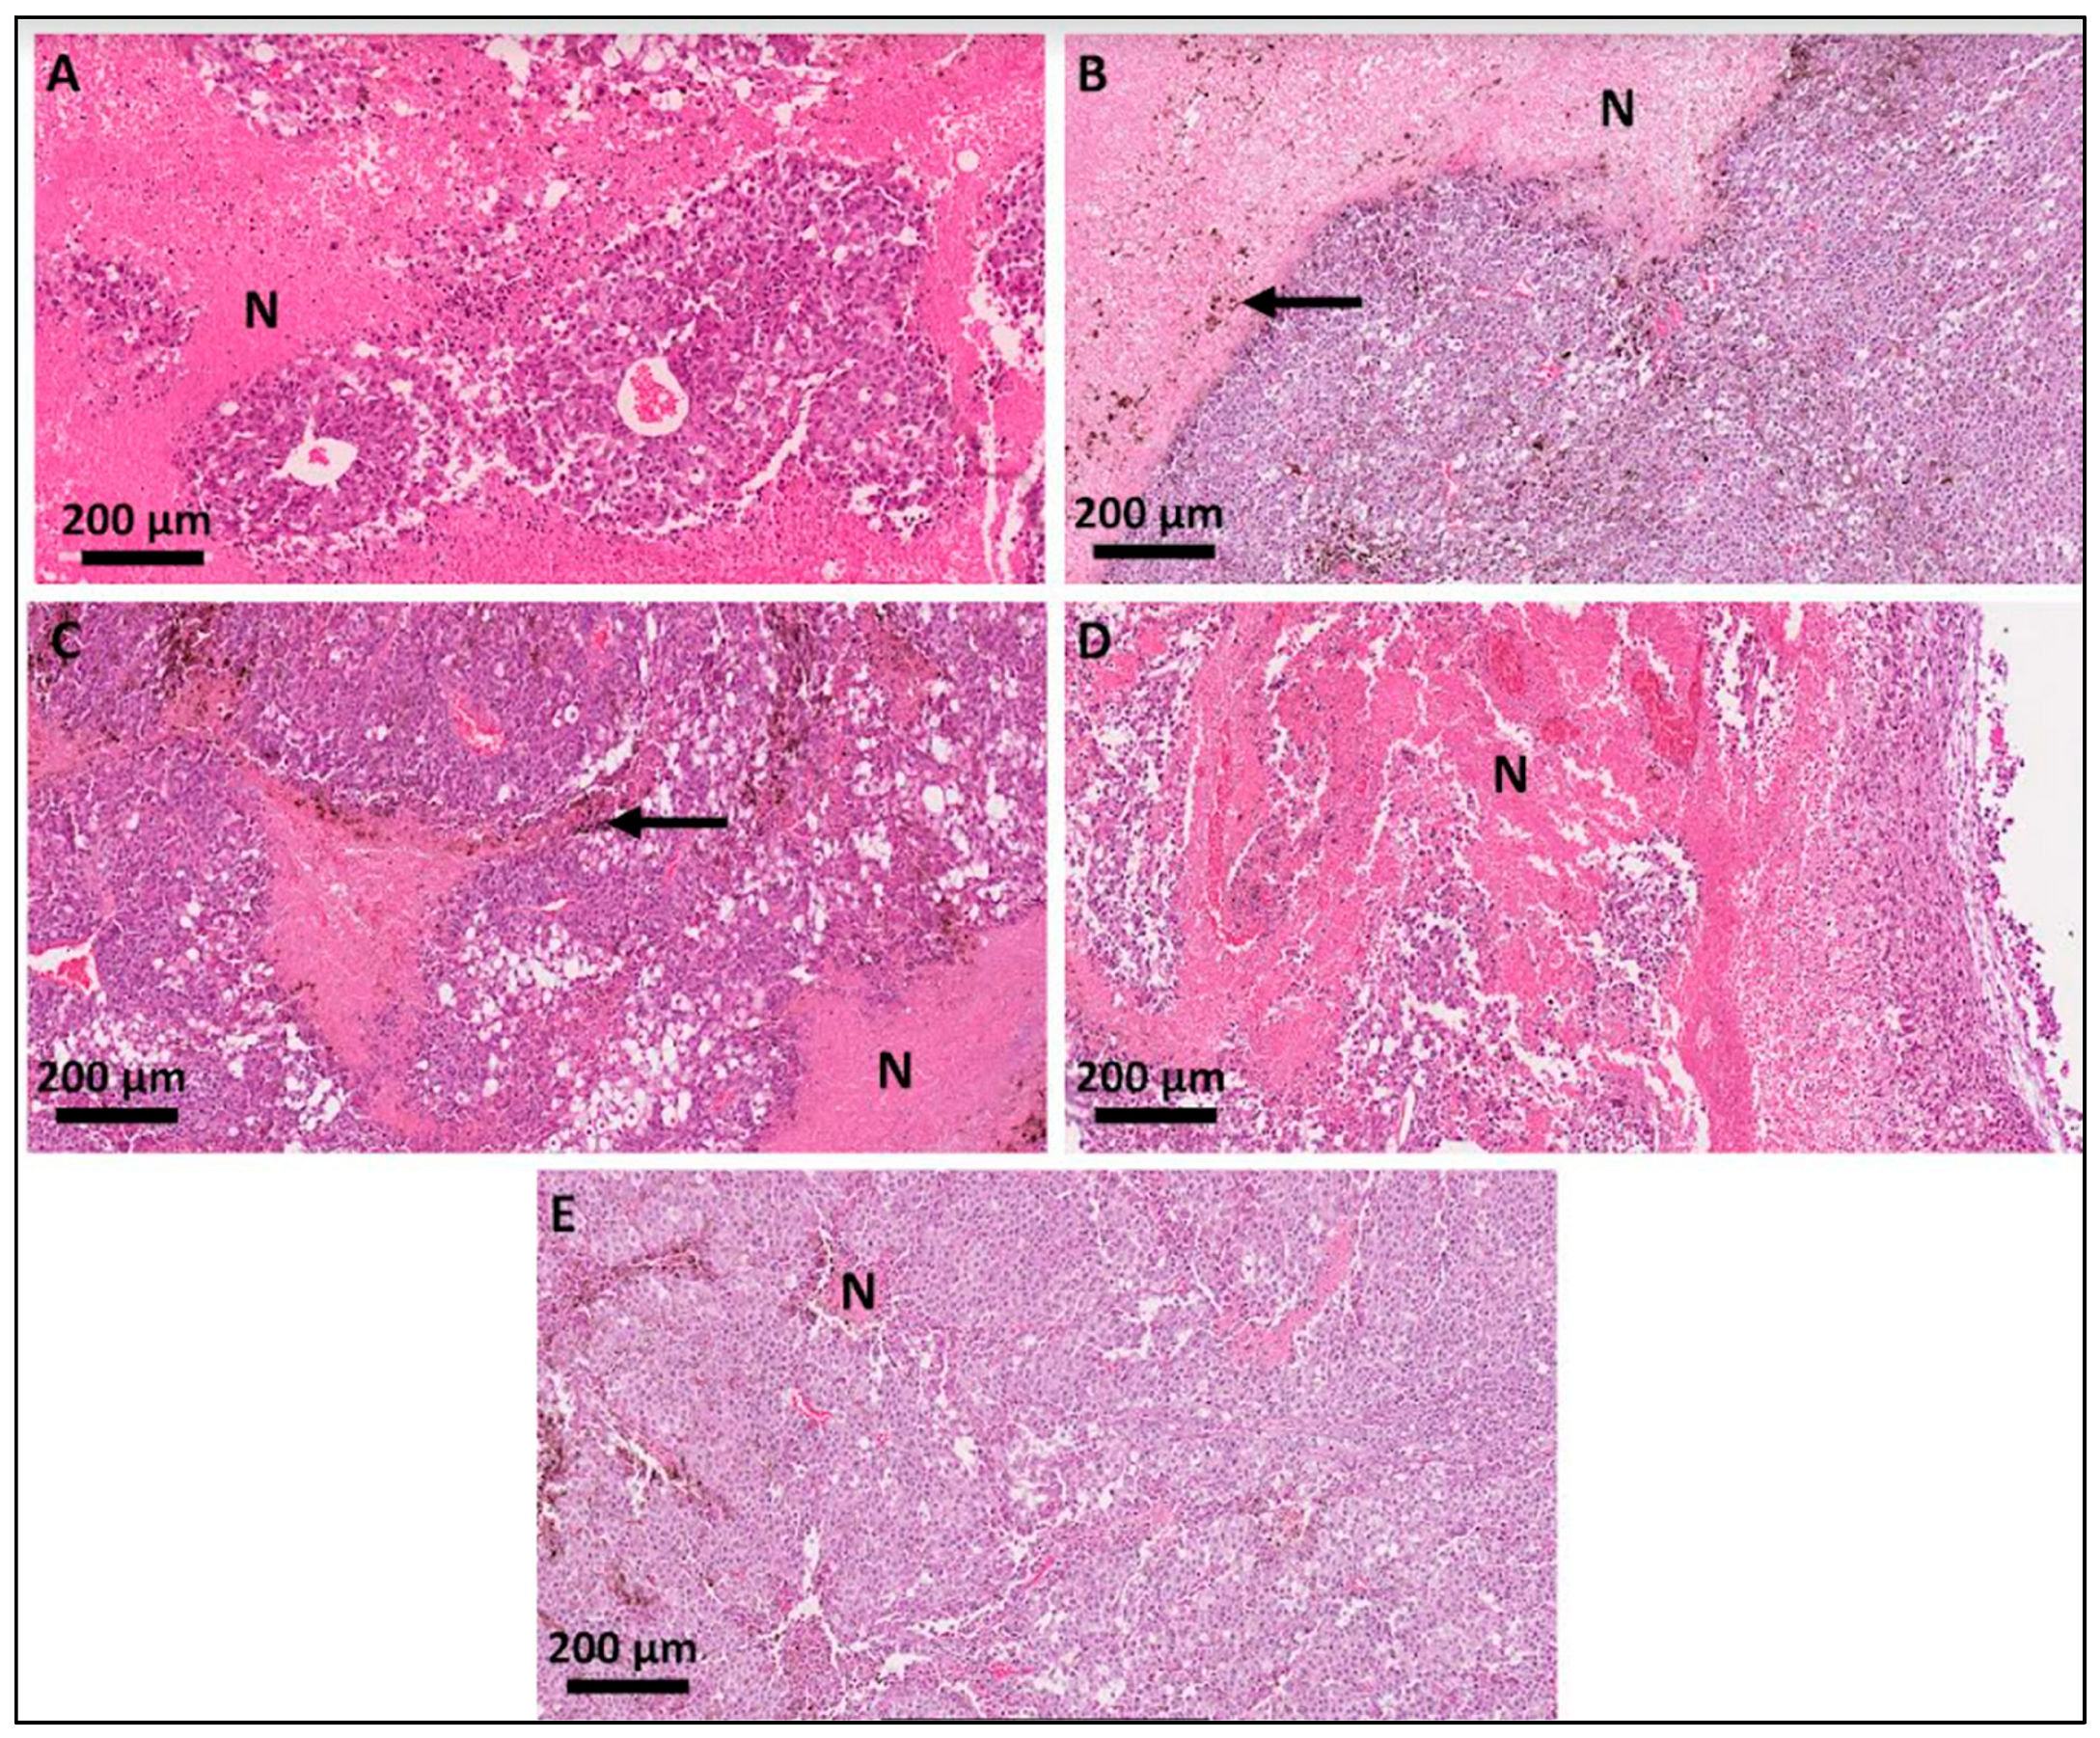
3.2. Histological Analyses of the Primary-Site Tumors
3.3. The Growth of the Non-Treated Tumors of the HL_HPS Group Is Significantly Reduced after PDT
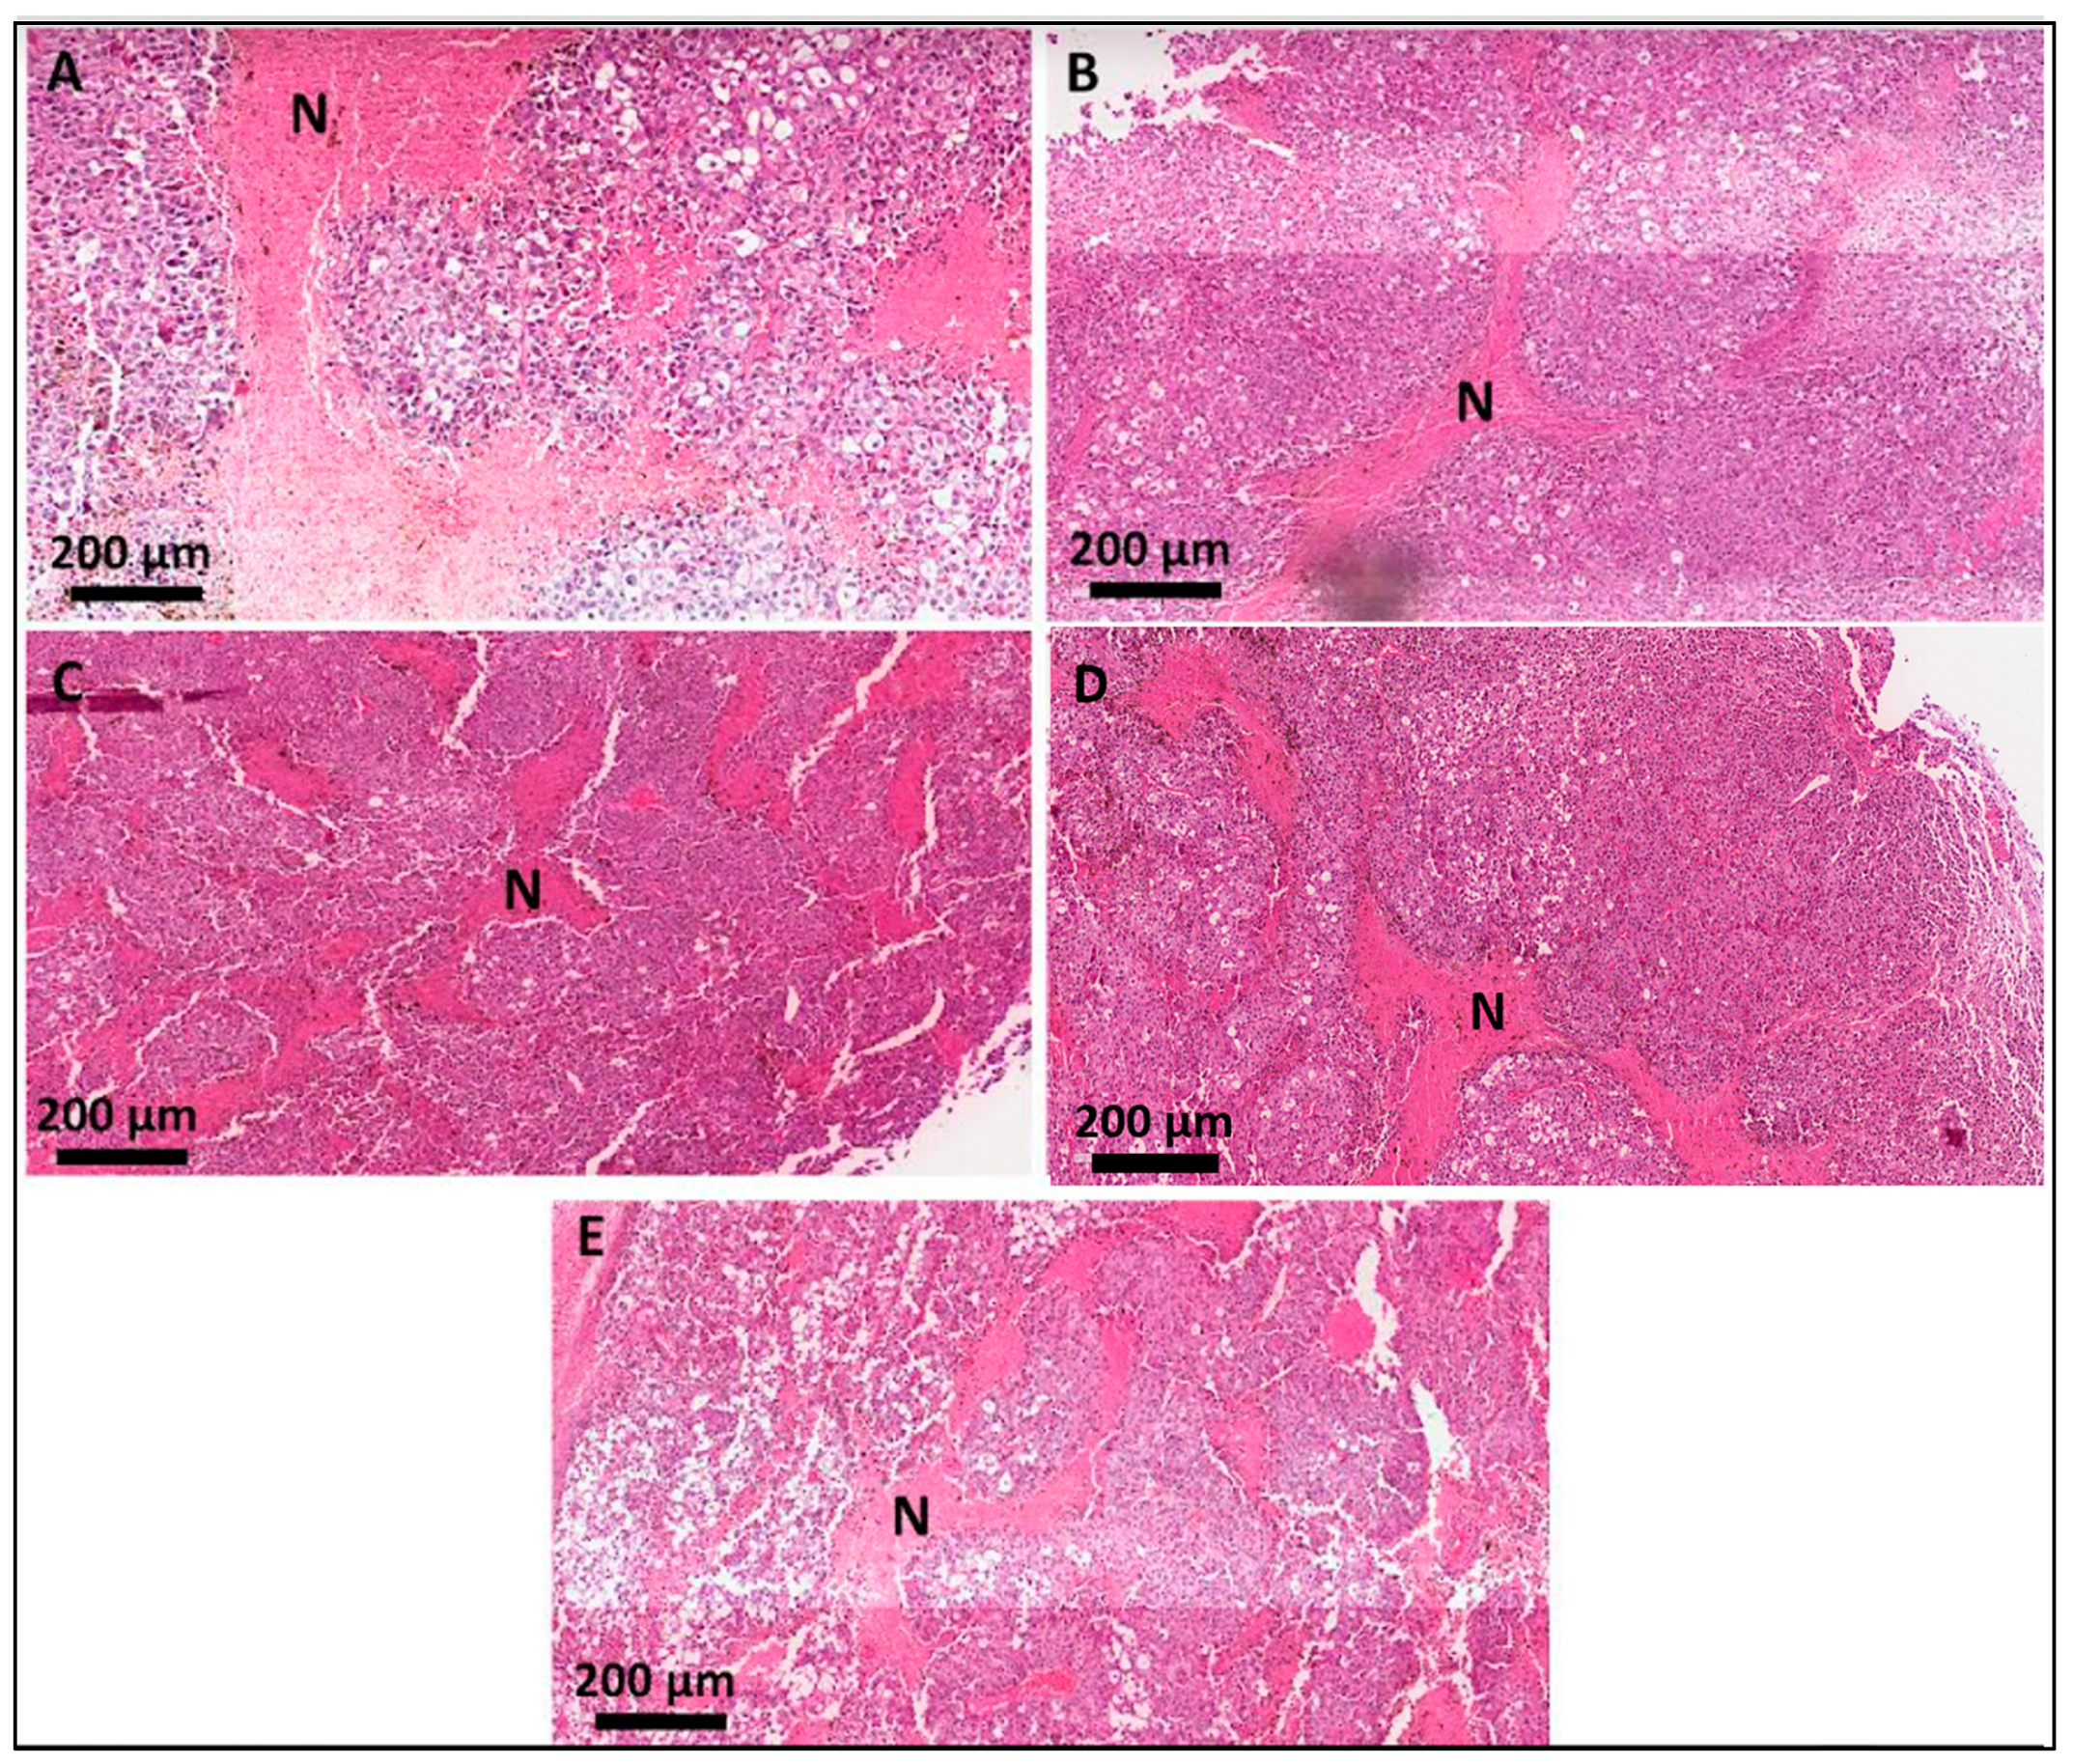
3.4. Histological Analyses of the Secondary-Site Tumors
3.5. Hematological Analysis
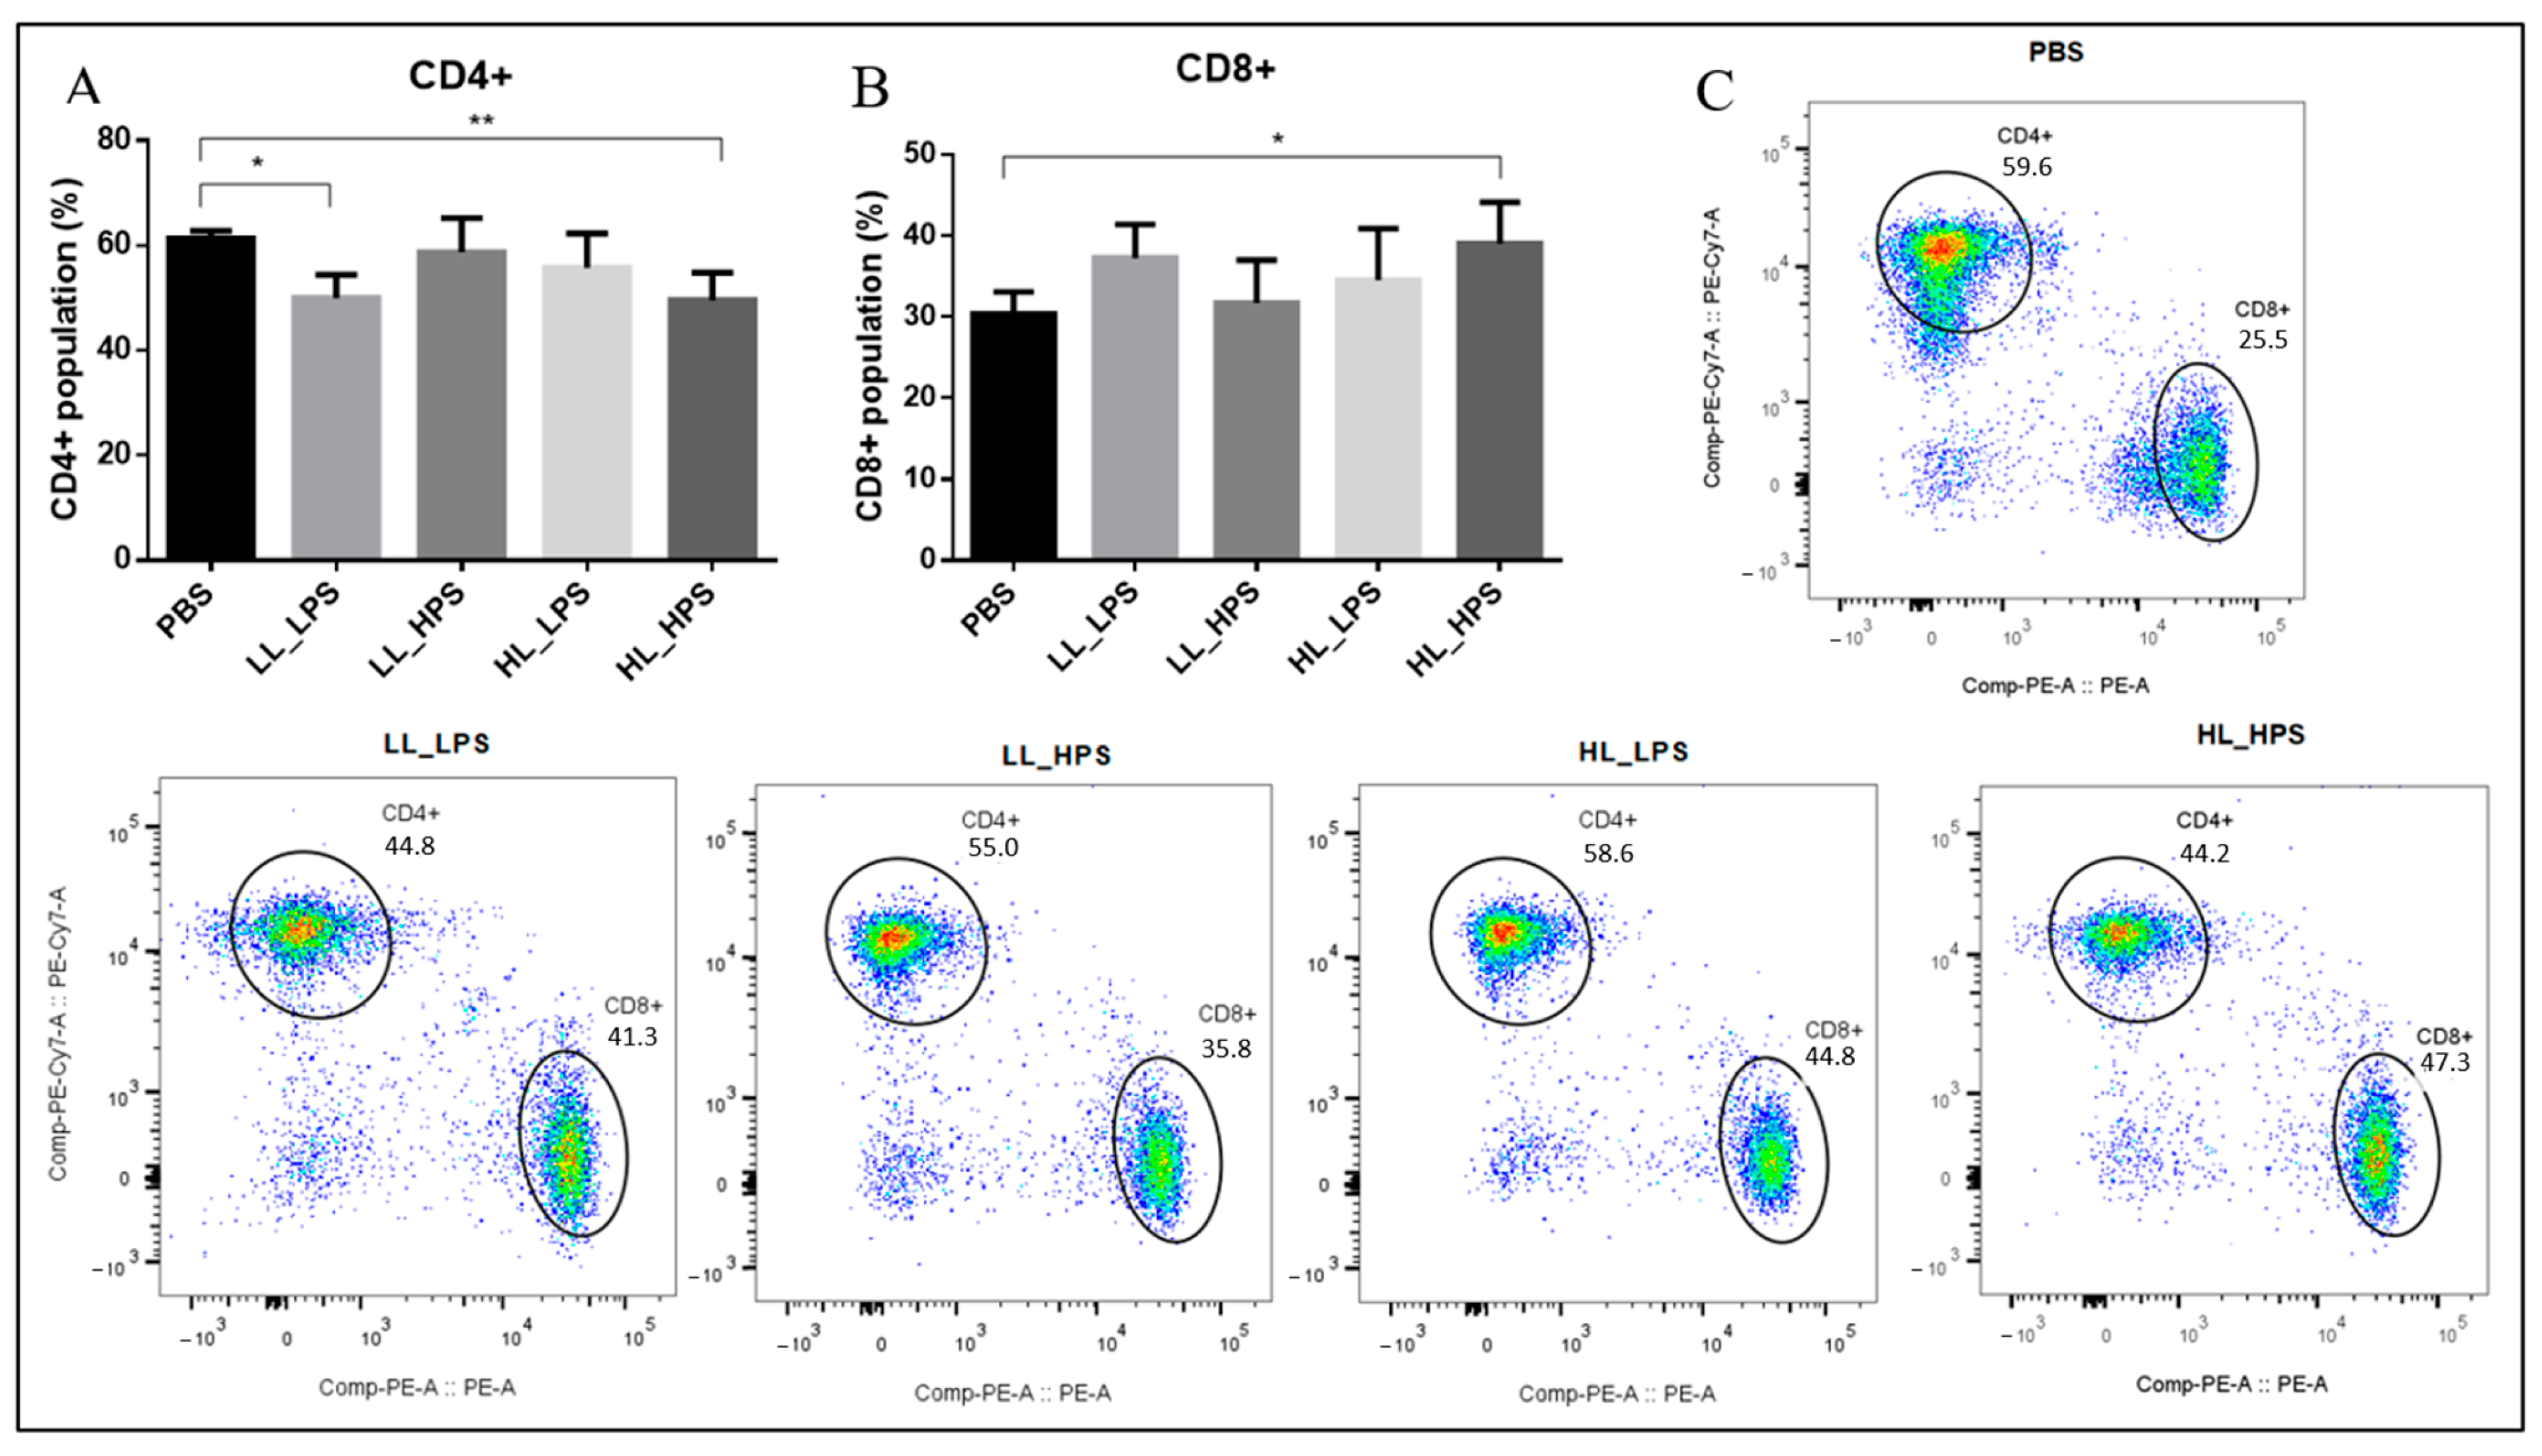
3.6. Flow Cytometry Analyses
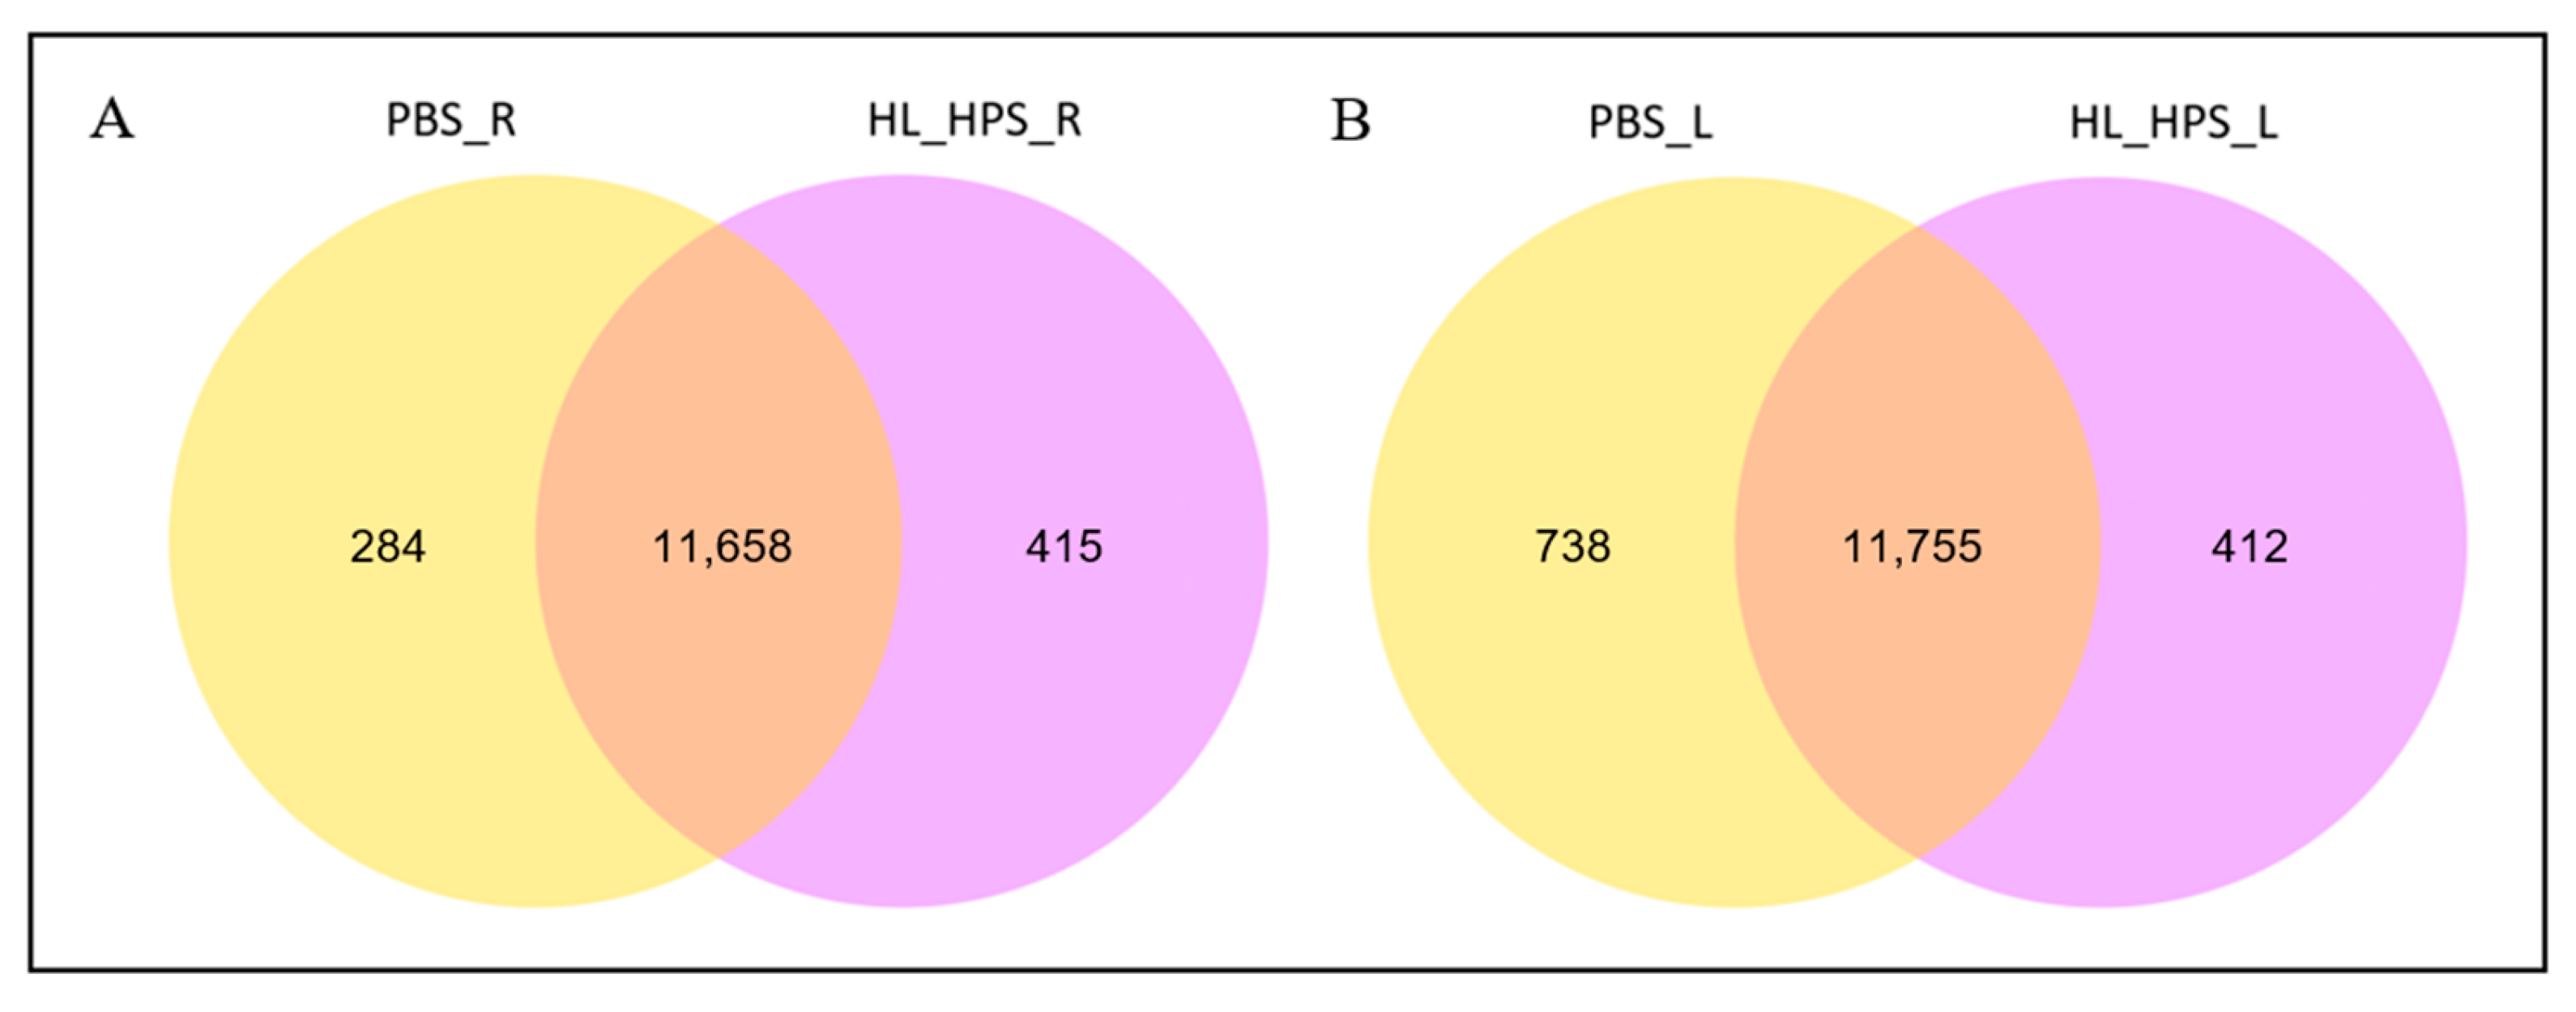
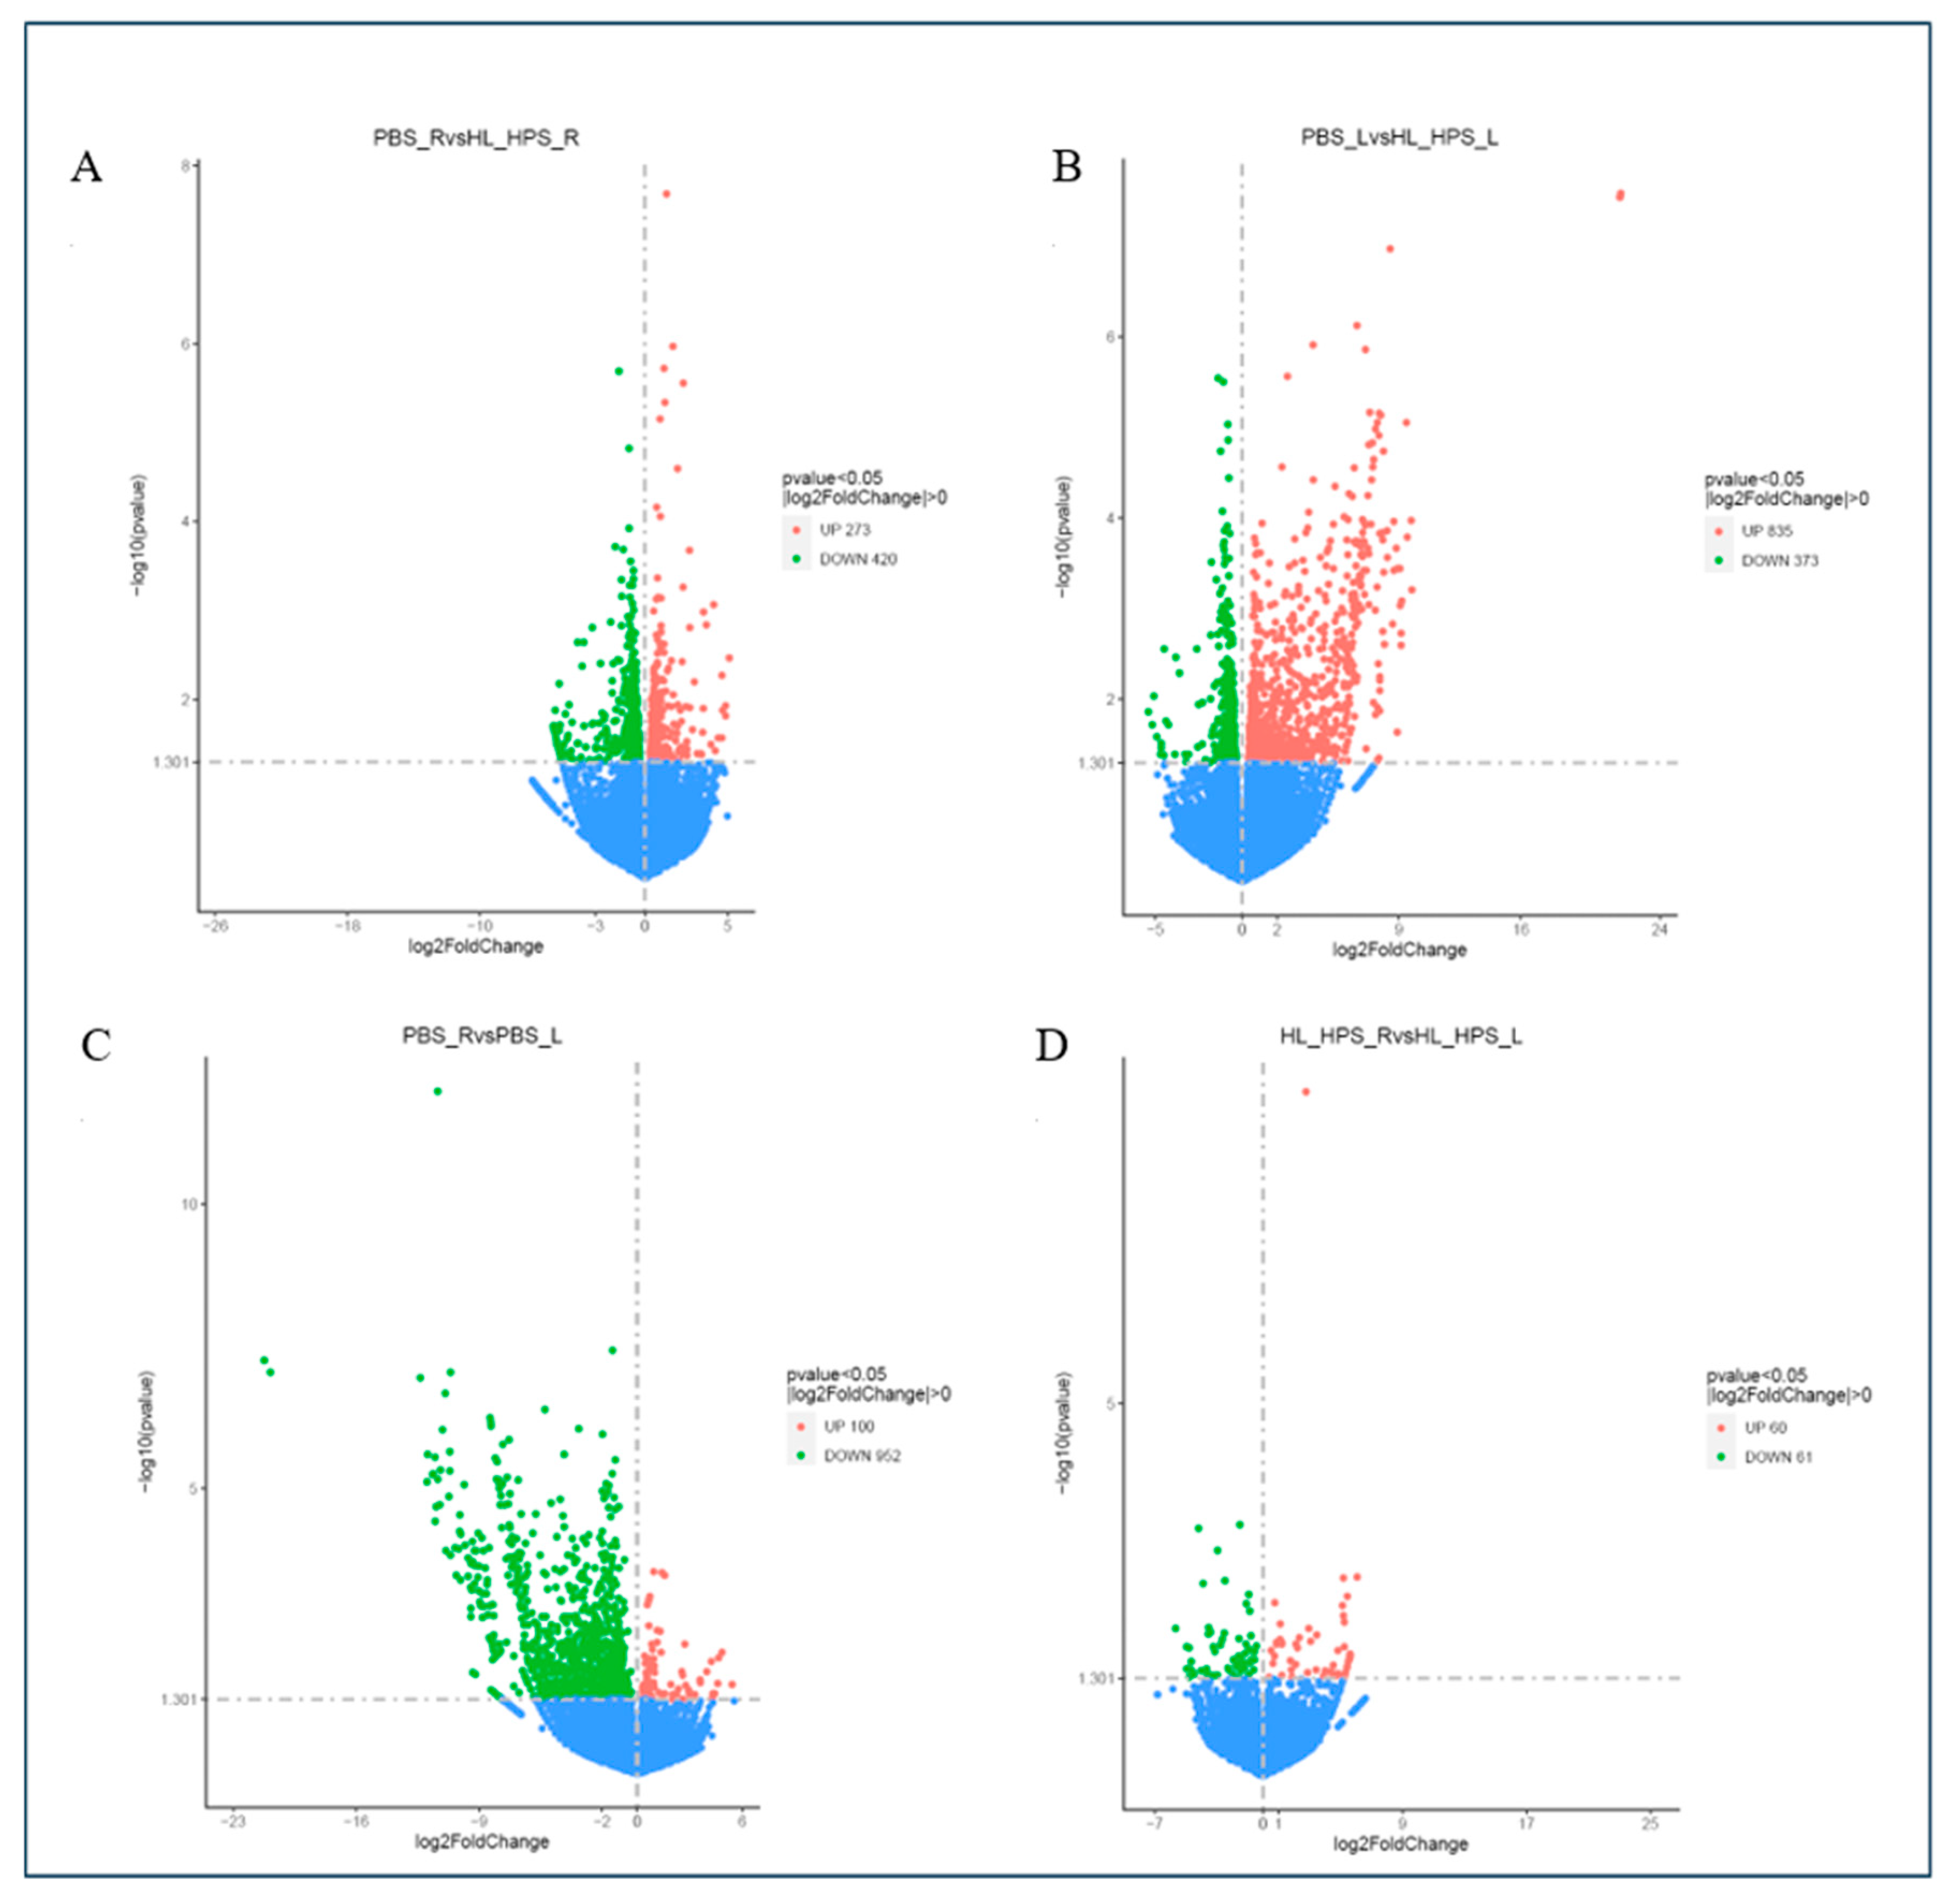
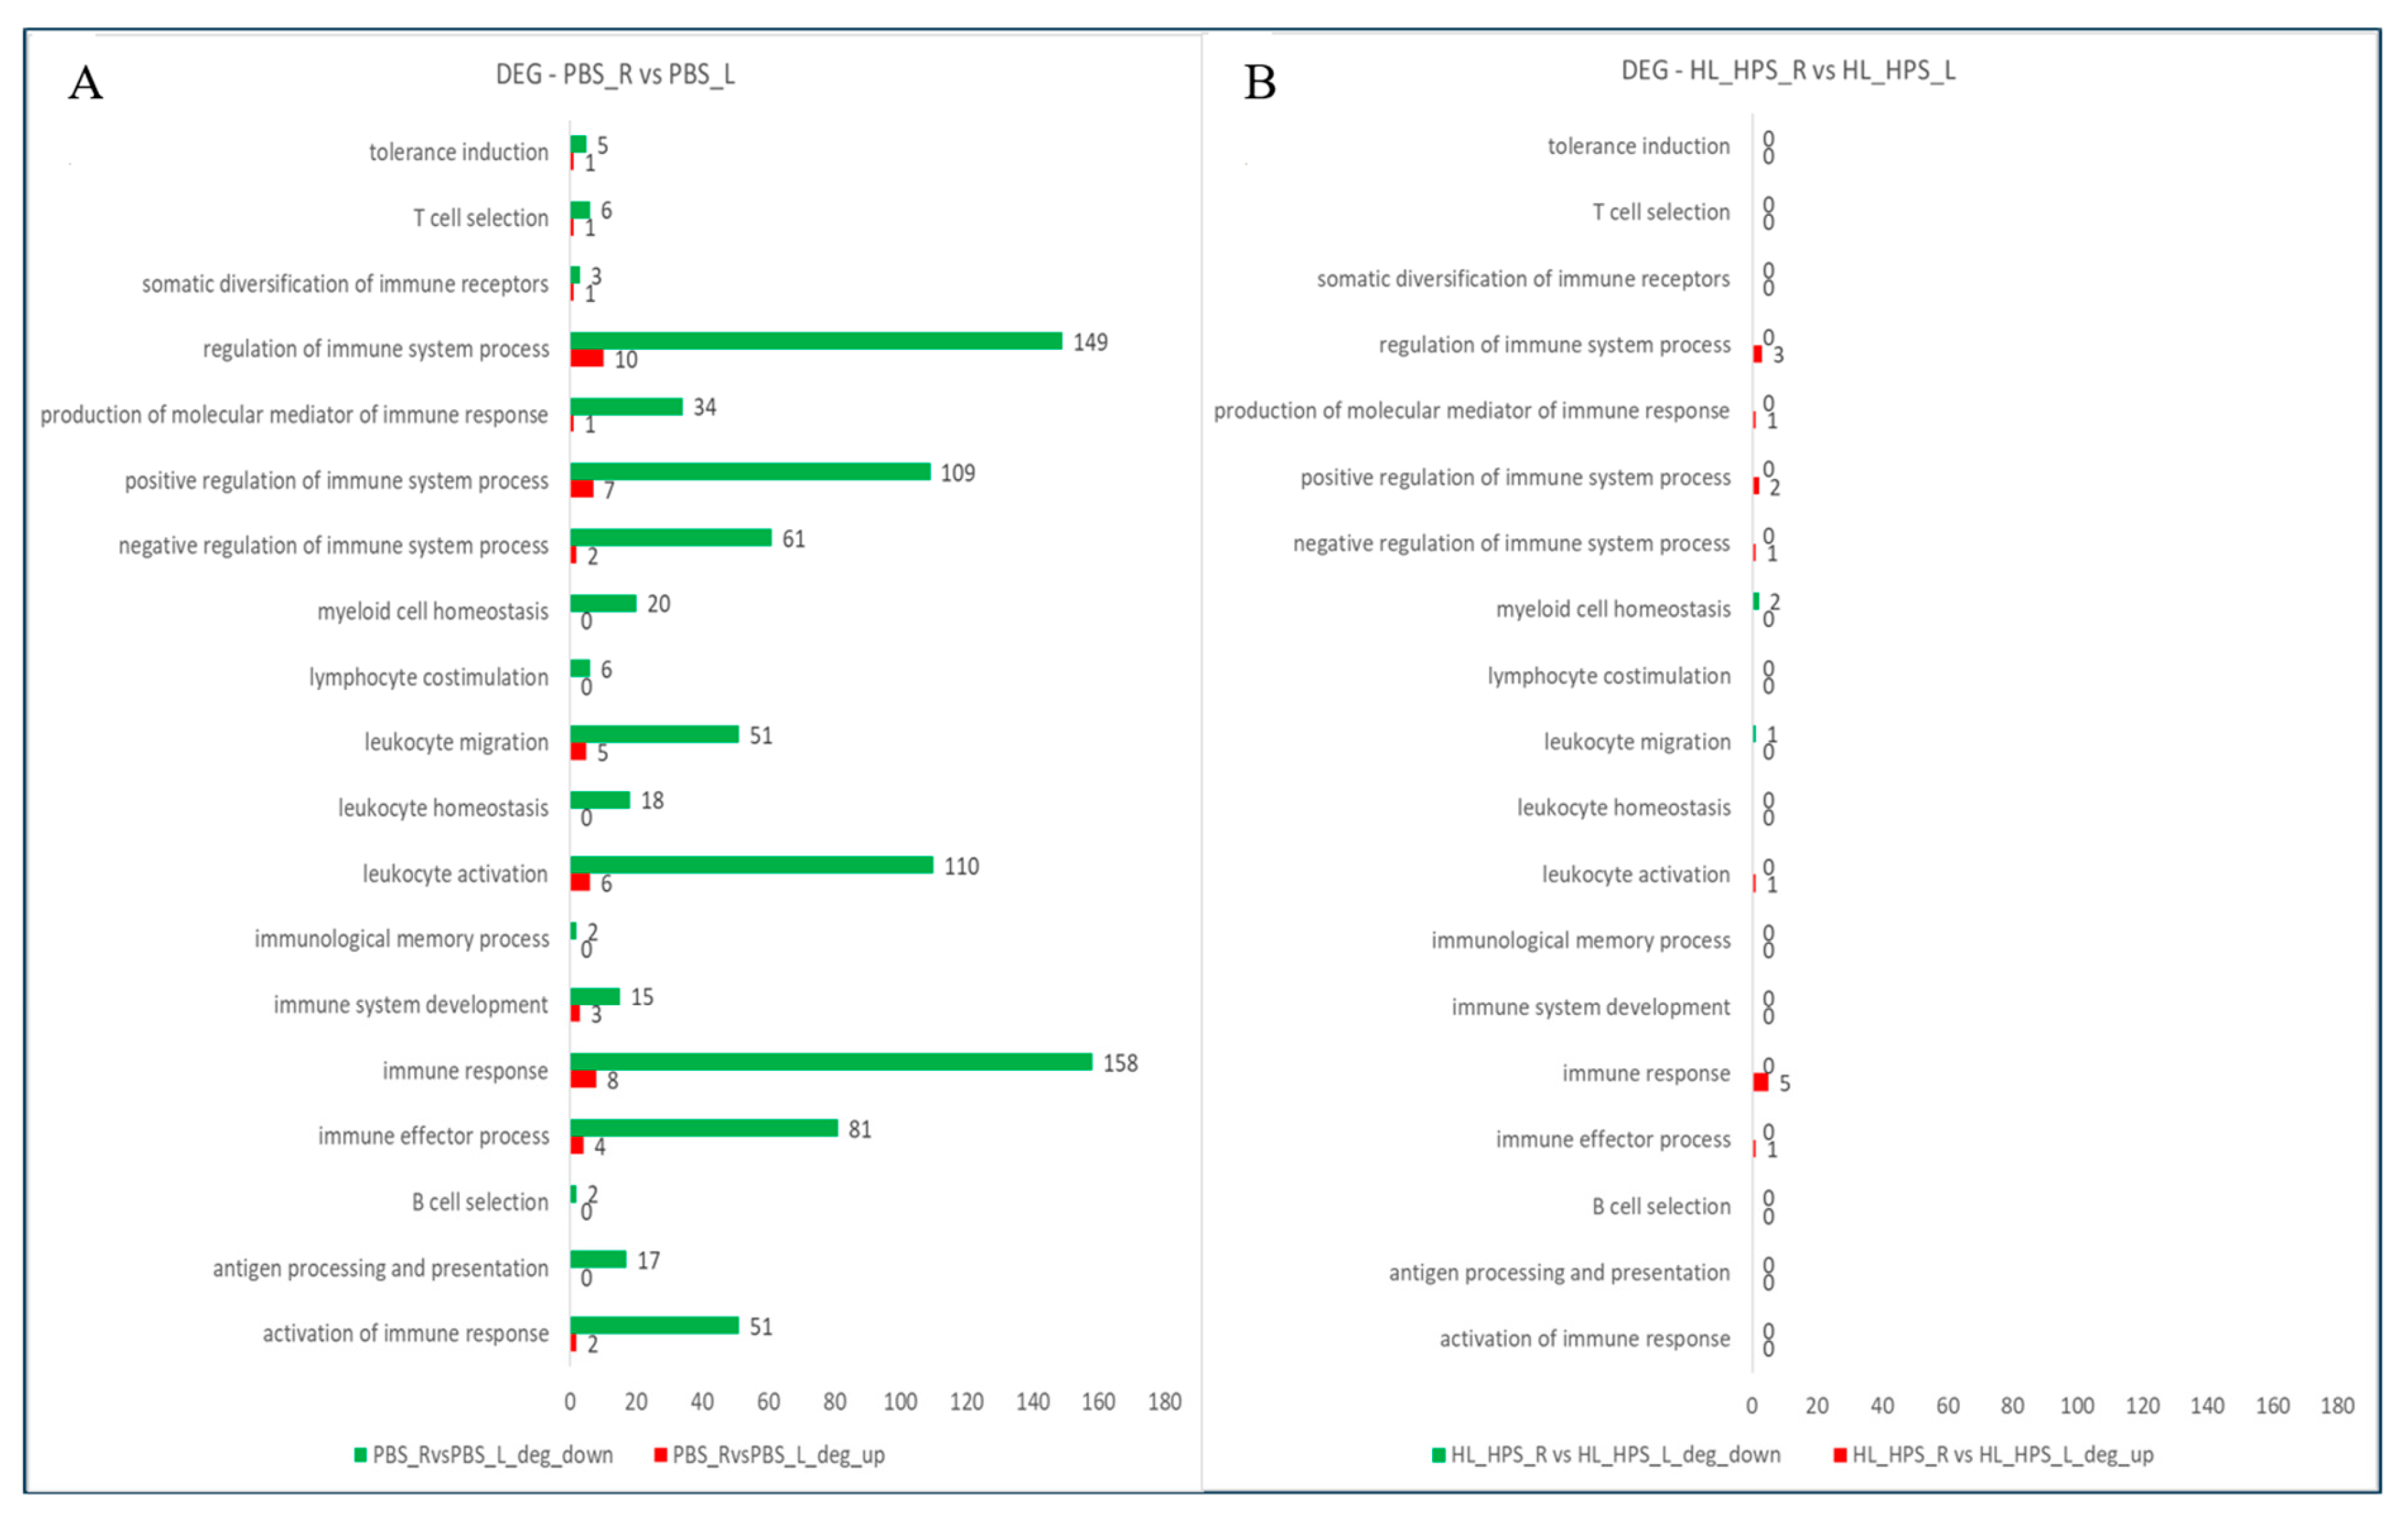
3.7. The HL_HPS Protocol Induced Distinct Expression Profiles for Immune Response Genes in Primary- and Secondary-Site Tumors
4. Discussion
5. Conclusions
Author Contributions
Funding
Institutional Review Board Statement
Informed Consent Statement
Data Availability Statement
Conflicts of Interest
References
- Hayward, N.K.; Wilmott, J.S.; Waddell, N.; Johansson, P.A.; Field, M.A.; Nones, K.; Patch, A.-M.; Kakavand, H.; Alexandrov, L.B.; Burke, H.; et al. Whole-genome landscapes of major melanoma subtypes. Nature 2017, 545, 175–180. [Google Scholar] [CrossRef] [PubMed]
- Schadendorf, D.; van Akkooi, A.C.J.; Berking, C.; Griewank, K.G.; Gutzmer, R.; Hauschild, A.; Stang, A.; Roesch, A.; Ugurel, S. Melanoma. Lancet 2018, 392, 971–984. [Google Scholar] [CrossRef]
- Teh, J.L.F.; Aplin, A.E. Playing the melanoma endgame. Clin. Cancer Res. 2018, 24, 4629–4630. [Google Scholar] [CrossRef] [PubMed]
- Weiss, S.A.; Wolchok, J.D.; Sznol, M. Immunotherapy of Melanoma: Facts and Hopes. Clin. Cancer Res. 2019, 25, 5191–5201. [Google Scholar] [CrossRef] [PubMed]
- Chin, L.; Garraway, L.A.; Fisher, D.E. Malignant melanoma: Genetics and therapeutics in the genomic era. Genes. Dev. 2006, 20, 2149–2182. [Google Scholar] [CrossRef]
- Jiang, W.; Liang, M.; Lei, Q.; Li, G.; Wu, S. The Current Status of Photodynamic Therapy in Cancer Treatment. Cancers 2023, 15, 585. [Google Scholar] [CrossRef]
- Castano, A.P.; Demidova, T.N.; Hamblin, M.R. Mechanisms in photodynamic therapy: Part one—Photosensitizers, photochemistry and cellular localization. Photodiagn. Photodyn. Ther. 2004, 1, 279–293. [Google Scholar] [CrossRef]
- Beltrán Hernández, I.; Yu, Y.; Ossendorp, F.; Korbelik, M.; Oliveira, S. Preclinical and Clinical Evidence of Immune Responses Triggered in Oncologic Photodynamic Therapy: Clinical Recommendations. J. Clin. Med. 2020, 9, 333. [Google Scholar] [CrossRef]
- Morais, J.A.V.; Almeida, L.R.; Rodrigues, M.C.; Azevedo, R.B.; Muehlmann, L.A. The induction of immunogenic cell death by photodynamic therapy in B16F10 cells in vitro is effected by the concentration of the photosensitizer. Photodiagn. Photodyn. Ther. 2021, 35, 102392. [Google Scholar] [CrossRef]
- Theodoraki, M.; Lorenz, K.; Lotfi, R.; Fürst, D.; Tsamadou, C.; Jaekle, S.; Mytilineos, J.; Brunner, C.; Theodorakis, J.; Hoffmann, T.; et al. Influence of photodynamic therapy on peripheral immune cell populations and cytokine concentrations in head and neck cancer. Photodiagn. Photodyn. Ther. 2017, 19, 194–201. [Google Scholar] [CrossRef]
- Shams, M.; Owczarczak, B.; Manderscheid, P.; David, K.; Gollnick, S.O. Development of photodynamic therapy regimens that control primary tumor growth and inhibit secondary disease. Cancer Immunol. Immunother. 2015, 64, 287–297. [Google Scholar] [CrossRef] [PubMed]
- Muehlmann, L.A.; Rodrigues, M.C.; Longo, J.P.F.; Garcia, M.P.; Py-Daniel, K.R.; Veloso, A.B.; de Souza, P.E.N.; da Silva, S.W.; Azevedo, R.B. Aluminium-phthalocyanine chloride nanoemulsions for anticancer photodynamic therapy: Development and in vitro activity against monolayers and spheroids of human mammary adenocarcinoma MCF-7 cells. J. Nanobiotechnol. 2015, 13, 36. [Google Scholar] [CrossRef] [PubMed]
- Rodrigues, M.C.; Vieira, L.G.; Horst, F.H.; de Araújo, E.C.; Ganassin, R.; Merker, C.; Meyer, T.; Böttner, J.; Venus, T.; Longo, J.P.F.; et al. Photodynamic therapy mediated by aluminium-phthalocyanine nanoemulsion eliminates primary tumors and pulmonary metastases in a murine 4T1 breast adenocarcinoma model. J. Photochem. Photobiol. B Biol. 2020, 204, 111808. [Google Scholar] [CrossRef]
- Goto, P.L.; Siqueira-Moura, M.P.; Tedesco, A.C. Application of aluminum chloride phthalocyanine-loaded solid lipid nanoparticles for photodynamic inactivation of melanoma cells. Int. J. Pharm. 2017, 518, 228–241. [Google Scholar] [CrossRef] [PubMed]
- Rocha, M.S.T.; Lucci, C.M.; dos Santos, J.A.M.; Longo, J.P.F.; Muehlmann, L.A.; Azevedo, R.B. Photodynamic therapy for cutaneous hemangiosarcoma in dogs. Photodiagn. Photodyn. Ther. 2019, 27, 39–43. [Google Scholar] [CrossRef]
- Calori, I.R.; Tedesco, A.C. Aluminum chloride phthalocyanine in MCF-7: Rationally accounting for state of aggregation of photosensitizers inside cells. Dyes Pigments 2020, 173, 107940. [Google Scholar] [CrossRef]
- Rodrigues, G.B.; Brancini, G.T.P.; Pinto, M.R.; Primo, F.L.; Wainwright, M.; Tedesco, A.C.; Braga, G.L. Photodynamic inactivation of Candida albicans and Candida tropicalis with aluminum phthalocyanine chloride nanoemulsion. Fungal Biol. 2020, 124, 297–303. [Google Scholar] [CrossRef]
- Morais, J.A.V.; Rodrigues, M.C.; Ferreira, F.F.; Ranjan, K.; Azevedo, R.B.; Poças-Fonseca, M.J.; Muehlmann, L.A. Photodynamic therapy inhibits cell growth and enhances the histone deacetylase-mediated viability impairment in Cryptococcus spp. in vitro. Photodiagn. Photodyn. Ther. 2020, 29, 101583. [Google Scholar] [CrossRef]
- Simões, M.M.; Paiva, K.L.R.; de Souza, I.F.; Mello, V.C.; Martins da Silva, I.G.; Souza, P.E.N.; Muehlmann, L.A.; Báo, S.N. The Potential of Photodynamic Therapy Using Solid Lipid Nanoparticles with Aluminum Phthalocyanine Chloride as a Nanocarrier for Modulating Immunogenic Cell Death in Murine Melanoma In Vitro. Pharmaceutics 2024, 16, 941. [Google Scholar] [CrossRef]
- Mkhobongo, B.; Chandran, R.; Abrahamse, H. In Vitro Photodynamic Treatment Modality for A375 Melanoma Cell Line Using a Sulphonated Aluminum Phthalocyanine Chloride-Photosensitizer-Gold Nanoparticle Conjugate. Pharmaceutics 2022, 14, 2474. [Google Scholar] [CrossRef]
- Tatsuno, K.; Yamazaki, T.; Hanlon, D.; Han, P.; Robinson, E.; Sobolev, O.; Yurter, A.; Rivera-Molina, F.; Arshad, N.; Edelson, R.L.; et al. Extracorporeal photochemotherapy induces bona fide immunogenic cell death. Cell Death Dis. 2019, 10, 578. [Google Scholar] [CrossRef] [PubMed]
- Zhu, Z.; Scalfi-Happ, C.; Ryabova, A.; Gräfe, S.; Wiehe, A.; Peter, R.-U.; Loschenov, V.; Steiner, R.; Wittig, R. Photodynamic activity of Temoporfin nanoparticles induces a shift to the M1-like phenotype in M2-polarized macrophages. J. Photochem. Photobiol. B Biol. 2018, 185, 215–222. [Google Scholar] [CrossRef]
- Hwang, H.S.; Shin, H.; Han, J.; Na, K. Combination of photodynamic therapy (PDT) and anti-tumor immunity in cancer therapy. J. Pharm. Investig. 2018, 48, 143–151. [Google Scholar] [CrossRef]
- Kolarova, H.; Nevrelová, P.; Bajgar, R.; Jírová, D.; Kejlová, K.; Strnad, M. In vitro photodynamic therapy on melanoma cell lines with phthalocyanine. Toxicol. In Vitro 2007, 21, 249–253. [Google Scholar] [CrossRef]
- Gurung, P.; Lim, J.; Shrestha, R.; Kim, Y.-W. Chlorin e6-associated photodynamic therapy enhances abscopal antitumor effects via inhibition of PD-1/PD-L1 immune checkpoint. Sci. Rep. 2023, 13, 4647. [Google Scholar] [CrossRef] [PubMed]
- Udartseva, O.O.; Zhidkova, O.V.; Ezdakova, M.I.; Ogneva, I.V.; Andreeva, E.R.; Buravkova, L.B.; Gollnick, S.O. Low-dose photodynamic therapy promotes angiogenic potential and increases immunogenicity of human mesenchymal stromal cells. J. Photochem. Photobiol. B Biol. 2019, 199, 111596. [Google Scholar] [CrossRef] [PubMed]
- Doix, B.; Trempolec, N.; Riant, O.; Feron, O. Low Photosensitizer Dose and Early Radiotherapy Enhance Antitumor Immune Response of Photodynamic Therapy-Based Dendritic Cell Vaccination. Front. Oncol. 2019, 9, 811. [Google Scholar] [CrossRef]
- White, J.R.; Gong, H.; Colaizy, T.T.; Moreland, J.G.; Flaherty, H.; Mcelroy, S.J. Evaluation of hematologic variables in newborn C57/BL6 mice up to day 35. Vet. Clin. Pathol. 2016, 45, 87–95. [Google Scholar] [CrossRef]
- Wang, D.; DuBois, R.N. Immunosuppression associated with chronic inflammation in the tumor microenvironment. Carcinogenesis 2015, 36, 1085–1093. [Google Scholar] [CrossRef]
- Zhou, Y.; Li, Y.; Bandi, S.; Tang, L.; Shinton, S.; Hayakawa, K.; Hardy, R. Lin28b promotes fetal B lymphopoiesis through the transcription factor Arid3a. J. Exp. Med. 2015, 212, 569–580. [Google Scholar] [CrossRef]
- Was, H.; Cichon, T.; Smolarczyk, R.; Lackowska, B.; Mazur-Bialy, A.; Mazur, M.; Szade, A.; Dominik, P.; Mazan, M.; Kotlinowski, J.; et al. Effect of Heme Oxygenase-1 on Melanoma Development in Mice—Role of Tumor-Infiltrating Immune Cells. Antioxidants 2020, 9, 1223. [Google Scholar] [CrossRef] [PubMed]
- Mroz, P.; Hashmi, J.T.; Huang, Y.; Lange, N.; Hamblin, M.R. Stimulation of anti-tumor immunity by photodynamic therapy. Expert Rev. Clin. Immunol. 2011, 7, 75–91. [Google Scholar] [CrossRef]
- Castano, A.P.; Mroz, P.; Hamblin, M.R. Photodynamic therapy and anti-tumour immunity. Nat. Rev. Cancer 2006, 6, 535–545. [Google Scholar] [CrossRef]
- Martin, D.; Rödel, F.; Winkelmann, R.; Balermpas, P.; Rödel, C.; Fokas, E. Peripheral Leukocytosis Is Inversely Correlated with Intratumoral CD8+ T-Cell Infiltration and Associated with Worse Outcome after Chemoradiotherapy in Anal Cancer. Front. Immunol. 2017, 8, 1225. [Google Scholar] [CrossRef] [PubMed]
- Valero, C.; Zanoni, D.K.; McGill, M.R.; Ganly, I.; Morris, L.G.; Quer, M.; Shah, J.P.; Wong, R.J.; León, X.; Patel, S.G. Pretreatment peripheral blood leukocytes are independent predictors of survival in oral cavity cancer. Cancer 2020, 126, 994–1003. [Google Scholar] [CrossRef] [PubMed]
- Grivennikov, S.I.; Greten, F.R.; Karin, M. Immunity, Inflammation, and Cancer. Cell 2010, 140, 883–899. [Google Scholar] [CrossRef]
- Zhu, J.; Yamane, H.; Paul, W.E. Differentiation of Effector CD4 T Cell Populations. Annu. Rev. Immunol. 2010, 28, 445–489. [Google Scholar] [CrossRef]
- Hermiston, M.L.; Xu, Z.; Weiss, A. CD45: A Critical Regulator of Signaling Thresholds in Immune Cells. Annu. Rev. Immunol. 2003, 21, 107–137. [Google Scholar] [CrossRef]
- Raskov, H.; Orhan, A.; Christensen, J.P.; Gögenur, I. Cytotoxic CD8+ T cells in cancer and cancer immunotherapy. Br. J. Cancer. 2021, 124, 359–367. [Google Scholar] [CrossRef]
- Farhood, B.; Najafi, M.; Mortezaee, K. CD8 + cytotoxic T lymphocytes in cancer immunotherapy: A review. J. Cell Physiol. 2019, 234, 8509–8521. [Google Scholar] [CrossRef]
- Maeding, N.; Verwanger, T.; Krammer, B. Boosting Tumor-Specific Immunity Using PDT. Cancers 2016, 8, 91. [Google Scholar] [CrossRef] [PubMed]
- Mroz, P.; Vatansever, F.; Muchowicz, A.; Hamblin, M.R. Photodynamic Therapy of Murine Mastocytoma Induces Specific Immune Responses against the Cancer/Testis Antigen P1A. Cancer Res. 2013, 73, 6462–6470. [Google Scholar] [CrossRef] [PubMed]
- Deng, H.; Yang, W.; Zhou, Z.; Tian, R.; Lin, L.; Ma, Y.; Song, J.; Chen, X. Targeted scavenging of extracellular ROS relieves suppressive immunogenic cell death. Nat. Commun. 2020, 11, 4951. [Google Scholar] [CrossRef]
- Mao, X.; Sethi, G.; Zhang, Z.; Wang, Q. The Emerging Roles of the HERC Ubiquitin Ligases in Cancer. Curr. Pharm. Des. 2018, 24, 1676–1681. [Google Scholar] [CrossRef] [PubMed]
- Sala-Gaston, J.; Martinez-Martinez, A.; Pedrazza, L.; Lorenzo-Martín, L.F.; Caloto, R.; Bustelo, X.R.; Ventura, F.; Rosa, J.L. HERC Ubiquitin Ligases in Cancer. Cancers 2020, 12, 1653. [Google Scholar] [CrossRef] [PubMed]
- Swanson, B.J.; Jäck, H.-M.; Lyons, G.E. Characterization of myocyte enhancer factor 2 (MEF2) expression in B and T cells: MEF2C is a B cell-restricted transcription factor in lymphocytes. Mol. Immunol. 1998, 35, 445–458. [Google Scholar] [CrossRef]
- Newman, D.M.; Voss, A.K.; Thomas, T.; Allan, R.S. Essential role for the histone acetyltransferase KAT7 in T cell development, fitness, and survival. J. Leukoc. Biol. 2017, 101, 887–892. [Google Scholar] [CrossRef]
- Gao, Y.; Zhao, H.; Mu, L. LncRNA-KAT7 Negatively Regulates miR-10a Through an Epigenetic Pathway to Participate in Nonsmall Cell Lung Cancer. Cancer Biother. Radiopharm. 2021, 36, 441–445. [Google Scholar] [CrossRef]
- Dong, H.; Zhang, H.; Mao, X.; Liu, S.; Xu, W.; Zhang, Y. RBM15 Promates the Proliferation, Migration and Invasion of Pancreatic Cancer Cell Lines. Cancers 2023, 15, 1084. [Google Scholar] [CrossRef]
- Susvirkar, V.; Faesen, A.C. Shieldin complex assembly kinetics and DNA binding by SHLD3. Commun. Biol. 2023, 6, 384. [Google Scholar] [CrossRef]
- Wei, Z.; Shen, Y.; Zhou, C.; Cao, Y.; Deng, H.; Shen, Z. CD3D: A prognostic biomarker associated with immune infiltration and immunotherapeutic response in head and neck squamous cell carcinoma. Bioengineered 2022, 13, 13784–13800. [Google Scholar] [CrossRef]
- Yang, Y.; Zang, Y.; Zheng, C.; Li, Z.; Gu, X.; Zhou, M.; Wang, Z.; Xiang, J.; Chen, Z.; Zhou, Y. CD3D is Associated with Immune Checkpoints and Predicts Favorable Clinical Outcome in Colon Cancer. Immunotherapy 2020, 12, 25–35. [Google Scholar] [CrossRef] [PubMed]
- Kuo, P.T.; Zeng, Z.; Salim, N.; Mattarollo, S.; Wells, J.W.; Leggatt, G.R. The Role of CXCR3 and Its Chemokine Ligands in Skin Disease and Cancer. Front. Med. 2018, 5, 271. [Google Scholar] [CrossRef] [PubMed]
- Calabrese, V.; Mallette, F.A.; Deschênes-Simard, X.; Ramanathan, S.; Gagnon, J.; Moores, A.; Ilangumaran, S.; Ferbeyre, G. SOCS1 Links Cytokine Signaling to p53 and Senescence. Mol. Cell 2009, 36, 754–767. [Google Scholar] [CrossRef] [PubMed]
- Zheng, S.; Yang, B.; Li, L.; Chen, M.; Zhang, L.; Chi, W.; Shao, Z.-M.; Xiu, B.; Chi, Y.; Wu, J. CRTAM promotes antitumor immune response in triple negative breast cancer by enhancing CD8+ T cell infiltration. Int. Immunopharmacol. 2024, 129, 111625. [Google Scholar] [CrossRef]
- Huang, B.; Han, W.; Sheng, Z.-F.; Shen, G.-L. Identification of immune-related biomarkers associated with tumorigenesis and prognosis in cutaneous melanoma patients. Cancer Cell Int. 2020, 20, 195. [Google Scholar] [CrossRef] [PubMed]
- Sade-Feldman, M.; Yizhak, K.; Bjorgaard, S.L.; Ray, J.P.; de Boer, C.G.; Jenkins, R.W.; Lieb, D.J.; Chen, J.H.; Frederick, D.T.; Barzily-Rokni, M.; et al. Defining T Cell States Associated with Response to Checkpoint Immunotherapy in Melanoma. Cell 2018, 175, 998–1013.e20. [Google Scholar] [CrossRef]
- Haqq, C.; Nosrati, M.; Sudilovsky, D.; Crothers, J.; Khodabakhsh, D.; Pulliam, B.L.; Federman, S.; Miller, J.R.; Allen, R.E.; Singer, M.I.; et al. The gene expression signatures of melanoma progression. Proc. Natl. Acad. Sci. USA 2005, 102, 6092–6097. [Google Scholar] [CrossRef]
- Eliades, P.; Abraham, B.J.; Ji, Z.; Miller, D.M.; Christensen, C.L.; Kwiatkowski, N.; Kumar, R.; Ni Njauw, C.; Taylor, M.; Miao, B.; et al. High MITF Expression Is Associated with Super- Enhancers and Suppressed by CDK7 Inhibition in Melanoma. J. Investig. Dermatol. 2018, 138, 1582–1590. [Google Scholar] [CrossRef]
- Cirenajwis, H.; Ekedahl, H.; Lauss, M.; Harbst, K.; Carneiro, A.; Enoksson, J.; Rosengren, F.; Werner-Hartman, L.; Törngren, T.; Kvist, A.; et al. Molecular stratification of metastatic melanoma using gene expression profiling: Prediction of survival outcome and benefit from molecular targeted therapy. Oncotarget 2015, 6, 12297–12309. [Google Scholar] [CrossRef]


| PBS | LL_LPS | LL_HPS | HL_LPS | HL_HPS | |
|---|---|---|---|---|---|
| Erythrogram | |||||
| RBC (×103/µL) | 6.6 ± 1.1 | 4.0 ± 1.7 | 5.6 ± 1.5 | 4.4 ± 2.6 | 3.4 ± 1.3 |
| HGB (g/dL) | 10.9 ± 1.6 | 7.0 ± 2.7 | 9.1 ± 2.3 | 7.1 ± 4.1 | 5.8 ± 2.2 |
| HCT (%) | 31.3 ± 4.7 | 19.8 ± 8.1 a | 27.0 ± 7.6 | 20.8 ± 11.9 | 17.6 ± 7.1 a |
| MCV (fL) | 47.3 ± 2.0 | 50.2 ± 4.3 | 48.0 ± 1.0 | 48.5 ± 8.1 | 52.1 ± 2.8 |
| MCH (pg) | 16.5 ± 0.4 | 17.7 ± 1.0 | 16.4 ± 0.2 | 16.3 ± 0.4 | 17.2 ± 0.2 |
| MCHC (g/dL) | 35.0 ± 0.1 | 35.4 ± 1.4 | 34.0 ± 1.0 | 34.4 ± 4.7 | 33.1 ± 2.0 |
| RDW-CV (%) | 16.1 ± 3.8 | 19.6 ± 6.7 | 19.9 ± 5.4 | 24.6 ± 7.7 | 23.0 ± 5.6 |
| RDW-SD (fL) | 34.4 ± 10.3 | 44.4 ± 18.8 | 42.9 ± 13.3 | 54.7 ± 22.8 a | 54.3 ± 15.6 a |
| Leukogram | |||||
| WBC (×103/µL) | 10.8 ± 2.7 | 4.9 ± 1.3 a | 5.1 ± 1.5 a | 5.0 ± 0.2 a | 4.4 ± 1.7 a |
| NEU (×103/µL) | 3.2 ± 0.9 | 1.9 ± 0.7 a | 1.4 ± 0.7 a | 1.2 ± 0.4 a | 1.4 ± 0.6 a |
| LYM (×103/µL) | 6.2 ± 1.3 | 2.5 ± 1.0 a | 3.1 ± 0.7 a | 3.0 ± 0.8 a | 2.7 ± 1.4 a |
| MON (×103/µL) | 1.4 ± 0.7 | 0.5 ± 0.1 a | 0.4 ± 0.5 | 0.6 ± 0.4 | 0.3 ± 0.2 a |
| EOS (×103/µL) | 0.1 ± 0.0 | 0.0 ± 0.0 | 0.2 ± 0.2 | 0.1 ± 0.1 | 0.1 ± 0.0 |
| BAS (×103/µL) | 0.0 ± 0.0 | 0.0 ± 0.0 | 0.0 ± 0.0 | 0.0 ± 0.0 | 0.0 ± 0.0 |
| NEU (%) | 29.7 ± 3.7 | 39.5 ± 11.3 | 25.2 ± 7.7 | 24.2 ± 7.8 | 31.1 ± 9.4 |
| LYM (%) | 59.2 ± 7.0 | 49.6 ± 9.8 | 65.4 ± 14.3 | 60.6 ± 15.9 | 60.4 ± 13.1 |
| MON (%) | 10.2 ± 5.3 | 10.0 ± 2.4 | 7.1 ± 6.1 | 12.3 ± 7.8 | 6.7 ± 3.4 |
| EOS (%) | 0.9 ± 0.3 | 0.9 ± 0.8 | 2.4 ± 2.6 | 2.9 ± 1.6 | 1.9 ± 0.7 |
| BAS (%) | 0.0 ± 0.0 | 0.0 ± 0.0 | 0.0 ± 0.0 | 0.0 ± 0.0 | 0.0 ± 0.0 |
| Platelet parameters | |||||
| PLT (×103/µL) | 682.6 ± 107.0 a | 509.8 ± 187.9 | 476.8 ± 293.4 | 624.0 ± 308.0 | 530.8 ± 59.2 a |
| MPV (fL) | 5.5 ± 0.5 | 6.2 ± 1.0 | 5.4 ± 0.2 | 5.8 ± 0.2 | 6.6 ± 0.5 |
| PDW | 15.8 ± 0.4 | 15.9 ± 0.4 | 15.8 ± 0.2 | 16.0 ± 0.6 | 16.3 ± 0.4 |
| PCT (%) | 0.4 ± 0.1 | 0.3 ± 0.1 | 0.3 ± 0.2 | 0.4 ± 0.2 | 0.4 ± 0.1 |
| DEGs_UP | DEGs_DOWN | |
|---|---|---|
| PBS_R vs. HL_HPS_R | Asxl1, Brpf1, Cacnb4, Cd3d, Chid1, Cmtm7, Cnpy3, Crtam, Cxcl11, Gli3, Gpr17, H2-Eb2, Herc6, Kat7, Kit, Klrk1, Mef2c, Nuggc, Prss56, Rbm15, Shld3, Slc25a38, Socs1, Sox6, Spp1, Stxbp4, Tab1, Traf4. | Ackr3, Acvr1b, Ahr, Arg1, C6, Ccnd3, Cd36, Cdc42ep2, Cdkn1a, Cebpg, Ctla2a, Defb1, Dusp10, Ecm1, Egr3, Emp2, Ephb3, Fosl2, Fzd9, Gprc5b, Gramd4, Grem1, Hcfc2, Hexim1, Il36g, Ivl, Jun, Jund, Kcnj8, Lrp1, Mavs, Meis1, Mitf, Mospd2, Nfkb2, Nos2, Nr4a3, Pde4b, Plec, Prkd2, Ptk6, Pura, Pvr, Rarg, Sfn, Sh2b2, Six1, Sox9, Tbkbp1, Thra, Tmem45b, Tnfaip3, Tnfsf14, Tnfsf9, Trpm4, Ttbk1, Vegfa, Xkr8, Zbtb7a, Zbtb7b. |
| PBS_L vs. HL_HPS_L | Adgre1, Adgrf4, Adtrp, Alcam, Angpt1, Aqp3, Bank1, Bcl11a, Bcl11b, Bcl2a1d, Blnk, Bmi1, Bmp4, Bpifc, Ccl28, Ccn3, Cd180, Cd209b, Cd55, Ciita, Coch, Crhr1, Ctsc, Ctse, Cx3cl1, Cx3cr1, Cxadr, Cxcl10, Cxcr6, Cyld, Dapk2, Dapl1, Ddx3x, Defb1, Dhx15, Dnase1l3, Dock11, Edn2, Egr3, Emp2, Endou, Erap1, Evpl, Ext1, F2rl1, F830016B08Rik, Fgfr3, Fgl2, Foxn1, Foxp1, Fzd5, Gata3, Gbp10, Gbp6, Herc6, Igf1, Ighm, Il1rap, Irf4, Itgal, Itgax, Itgb8, Ivl, Kat7, Kif5b, Lacc1, Lair1, Lcp2, Lef1, Ly6d, Marchf7, Mecom, Mef2c, Mill1, Mysm1, Nedd9, Nfkbiz, Notch1, Padi4, Pag1, Pdgfd, Pik3ap1, Pla2g2f, Pparg, Ppl, Prdm1, Prkcb, Prlr, Psg17, Ptger4, Ptprc, Pycard, Rasgrp1, Rbm15, Rel, Ret, Rnf115, S100a14, Selp, Serpinb9, Sfn, Sfrp1, Shld3, Sirpb1a, Sirt1, Skil, Slamf8, Slc40a1, Socs6, Sp1, Sp3, Spn, Tbx1, Tcea1, Trim29, Usp14, Usp9x, Vav3, Wdfy4, Wnt5a, Ythdf2, Zbtb6. | Aire, Ccr10, Cdc42ep2, Cebpg, Cxcl1, Cybc1, Cyren, Ephb4, F7, Fkbp1b, Fzd9, Gata2, Gdf15, Gpr137, Gprc5b, Hexim1, Hs1bp3, Il15, Il17d, Irf3, Jmjd6, Kcnj8, Kcnn4, Kmt5c, Mark4, Men1, Mitf, Mospd2, Nemp1, Nfkb2, Nr4a3, Orai1, Ppbp, Prdm16, Prelid1, Prkd2, Rac3, Rara, Rarg, Rbm14, Slc37a4, Sppl2b, Tal1, Tbkbp1, Trim68, Tusc2, Vegfa, Xkr8, Zbtb7b. |
| DEGs_UP | DEGs_DOWN | |
|---|---|---|
| PBS_R vs. PBS_L | Aire, Cdh17, Evl, Gpr137, Kcnj8, Kcnn4, Kmt5c, Ppbp, Prss56, Prxl2a, Rara, Vegfb | Acp5, Adgre1, Adgrf4, Adipoq, Adtrp, Aim2, Alox5, Ang, Angpt1, Anxa3, Aqp3, Bcl11b, Bcl2a1d, Blnk, Bmp4, Bpifc, Bst1, Btk, C1qb, C1qc, C3ar1, C6, Camk1d, Ccl21a, Ccl6, Ccl7, Ccl8, Ccl9, Ccn3, Ccr2, Ccr5, Cd209b, Cd209d, Cd244a, Cd24a, Cd36, Cd37, Cd55, Cd84, Cd86, Cebpa, Cfh, Clec2d, Clec2g, Clec4a1, Clec4a2, Clec4a3, Cmklr1, Coch, Coro1a, Crhr1, Csf1r, Csf2rb, Csf2rb2, Ctsc, Ctse, Ctss, Cxcl12, Cxcl14, Cxcl16, Cybb, Cysltr1, Dapk1, Dapk2, Dapl1, Defb1, Dock2, Dpp4, Dtx4, Ear2, Edn2, Ednrb, Egr1, Egr3, Emp2, Ephb3, Evpl, F2rl1, Fcer1g, Fcgr2b, Fcgr3, Fcgr4, Fgfr3, Fgl2, Fgr, Foxn1, Gas6, Gata3, Gbp2b, Gm5431, Gpr55, H2-T24, Hck, Hspb1, Ifi204, Ifi205, Ifi207, Ifi209, Igf1, Ighm, Ikzf1, Il1rl2, Il4ra, Il6ra, Inpp5d, Irf5, Itgal, Itgam, Itgb2, Ivl, Kitl, Lair1, Laptm5, Lcp2, Lef1, Lfng, Lilrb4a, Lilrb4b, Lmo2, Lpxn, Ly6d, Ly86, Lyn, Lyve1, Mafb, Marchf1, Mill1, Mpeg1, Mrgprb1, Myo1f, Myo1g, Mysm1, Naip6, Ncf1, Nckap1l, Nedd9, Nfam1, Notch1, P2ry14, Padi4, Pag1, Pck1, Pdgfd, Pik3ap1, Pirb, Pla2g2f, Plcl2, Pld4, Plscr2, Pou2f2, Pparg, Ppl, Prdm1, Prkcb, Prkch, Prlr, Psg17, Ptafr, Ptger4, Ptprc, Ptpre, Ptpro, Rac2, Rasgrp1, Rftn1, Rnase4, S100a14, S1pr1, Sash3, Selp, Sema4a, Sfn, Sfrp1, Sirpb1c, Slamf7, Slc11a1, Slc7a2, Slfn1, Slfn2, Spink5, Svep1, Tbx1, Themis2, Tifab, Tlr13, Tlr8, Tlr9, Tmem229b, Tmem98, Tnfaip8l2, Tnfrsf13b, Tnfrsf1b, Tnfrsf21, Tnip3, Trem2, Trim29, Trpm2, Tyrobp, Vav1, Vcam1, Vsig4, Vsir, Wdfy4, Wfdc17, Wnt10b, Zeb1 |
| HL_HPS_R vs. HL_HPS_L | Egr3, Endou, Il36g, Il36rn, Klk5, Ptk6, Sox9 | Dpep1, Hba-a1, Hba-a2 |
Disclaimer/Publisher’s Note: The statements, opinions and data contained in all publications are solely those of the individual author(s) and contributor(s) and not of MDPI and/or the editor(s). MDPI and/or the editor(s) disclaim responsibility for any injury to people or property resulting from any ideas, methods, instructions or products referred to in the content. |
© 2024 by the authors. Licensee MDPI, Basel, Switzerland. This article is an open access article distributed under the terms and conditions of the Creative Commons Attribution (CC BY) license (https://creativecommons.org/licenses/by/4.0/).
Share and Cite
Morais, J.A.V.; Barros, P.H.A.; Brigido, M.d.M.; Marina, C.L.; Bocca, A.; Mariano, A.d.L.e.S.; Souza, P.E.N.d.; Paiva, K.L.R.; Simões, M.M.; Bao, S.N.; et al. Direct and Abscopal Antitumor Responses Elicited by AlPcNE-Mediated Photodynamic Therapy in a Murine Melanoma Model. Pharmaceutics 2024, 16, 1177. https://doi.org/10.3390/pharmaceutics16091177
Morais JAV, Barros PHA, Brigido MdM, Marina CL, Bocca A, Mariano AdLeS, Souza PENd, Paiva KLR, Simões MM, Bao SN, et al. Direct and Abscopal Antitumor Responses Elicited by AlPcNE-Mediated Photodynamic Therapy in a Murine Melanoma Model. Pharmaceutics. 2024; 16(9):1177. https://doi.org/10.3390/pharmaceutics16091177
Chicago/Turabian StyleMorais, José Athayde Vasconcelos, Pedro H. A. Barros, Marcelo de Macedo Brigido, Clara Luna Marina, Anamelia Bocca, André de Lima e Silva Mariano, Paulo E. N. de Souza, Karen L. R. Paiva, Marina Mesquita Simões, Sonia Nair Bao, and et al. 2024. "Direct and Abscopal Antitumor Responses Elicited by AlPcNE-Mediated Photodynamic Therapy in a Murine Melanoma Model" Pharmaceutics 16, no. 9: 1177. https://doi.org/10.3390/pharmaceutics16091177
APA StyleMorais, J. A. V., Barros, P. H. A., Brigido, M. d. M., Marina, C. L., Bocca, A., Mariano, A. d. L. e. S., Souza, P. E. N. d., Paiva, K. L. R., Simões, M. M., Bao, S. N., Camargo, L. C., Longo, J. P. F., Morais, A. A. C., Azevedo, R. B. d., Fonseca, M. J. P., & Muehlmann, L. A. (2024). Direct and Abscopal Antitumor Responses Elicited by AlPcNE-Mediated Photodynamic Therapy in a Murine Melanoma Model. Pharmaceutics, 16(9), 1177. https://doi.org/10.3390/pharmaceutics16091177