
Innovative Solid Lipid Nanoparticle-Enriched Hydrogels for Enhanced Topical Delivery of L-Glutathione: A Novel Approach to Anti-Ageing

 ,
,  , ,
, , 
Abstract
:
1. Introduction
2. Materials and Methods
2.1. Materials
2.2. Analytical Method of GSH
2.3. Preparation of GSH-Loaded Solid Lipid Nanoparticle-Enriched Hydrogels (GSH-SLN-EH)
2.3.1. Fabrication of Hydrogels
2.3.2. Fabrication of GSH-SLN-EH
2.4. Characterisation Studies of GSH-Loaded Solid Lipid Nanoparticle-Enriched Hydrogels (GSH-SLN-EH)
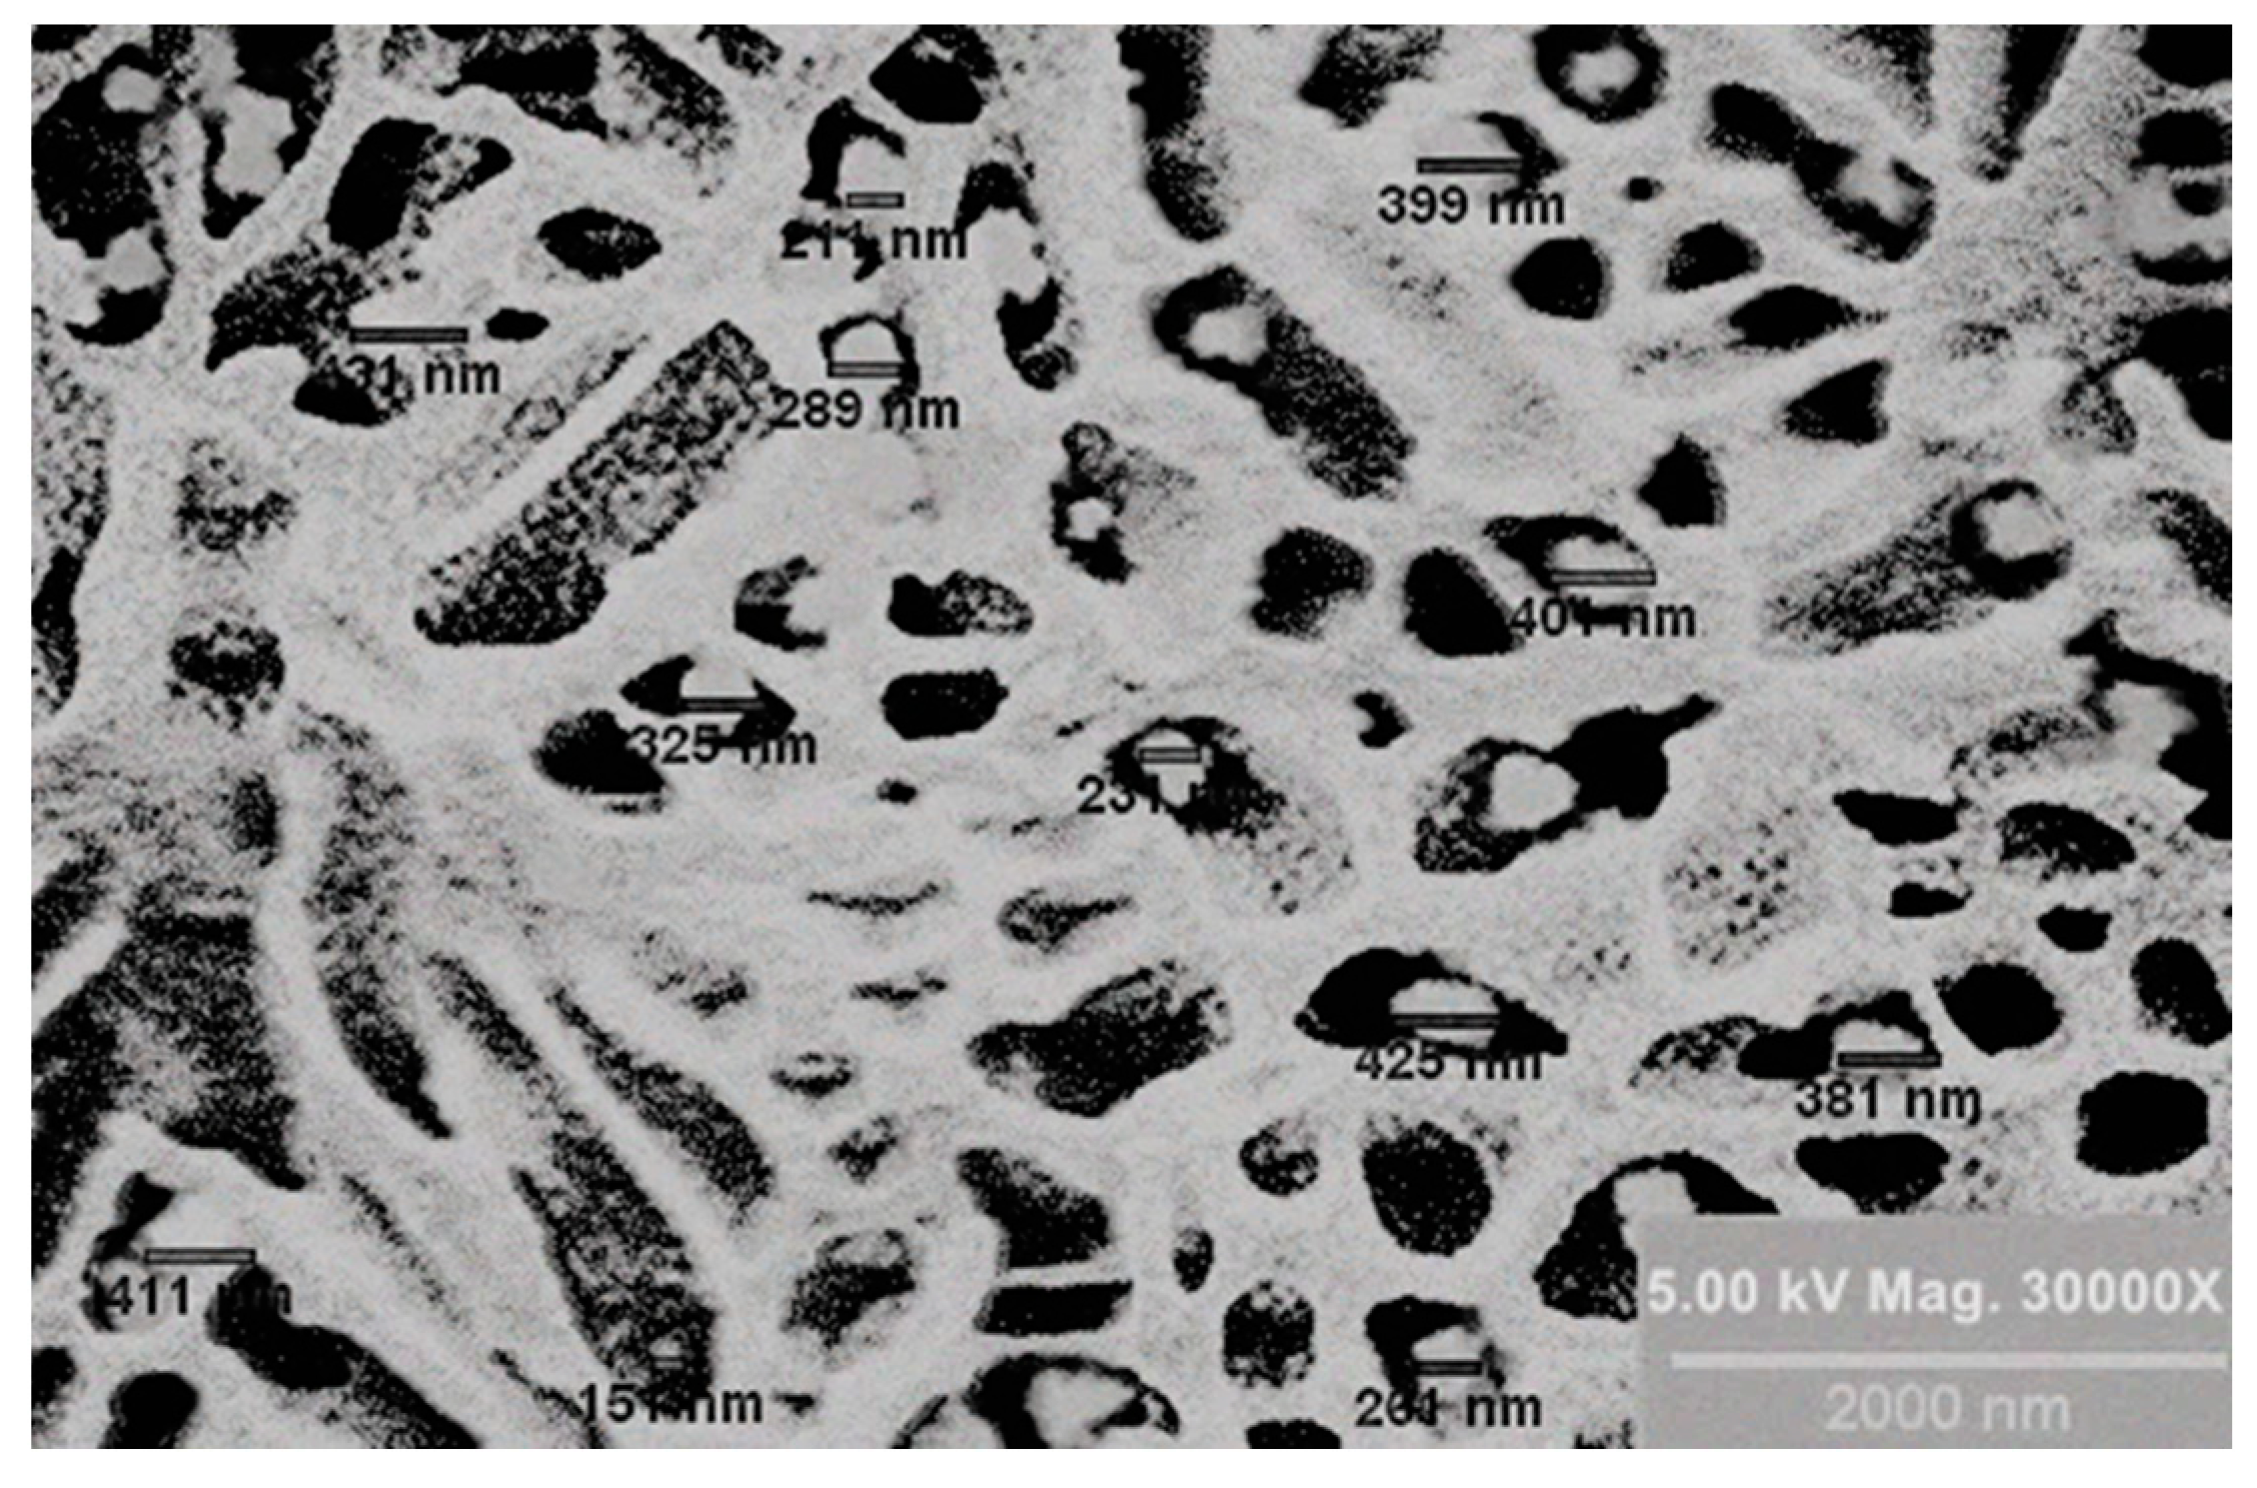
2.4.1. Morphological Study
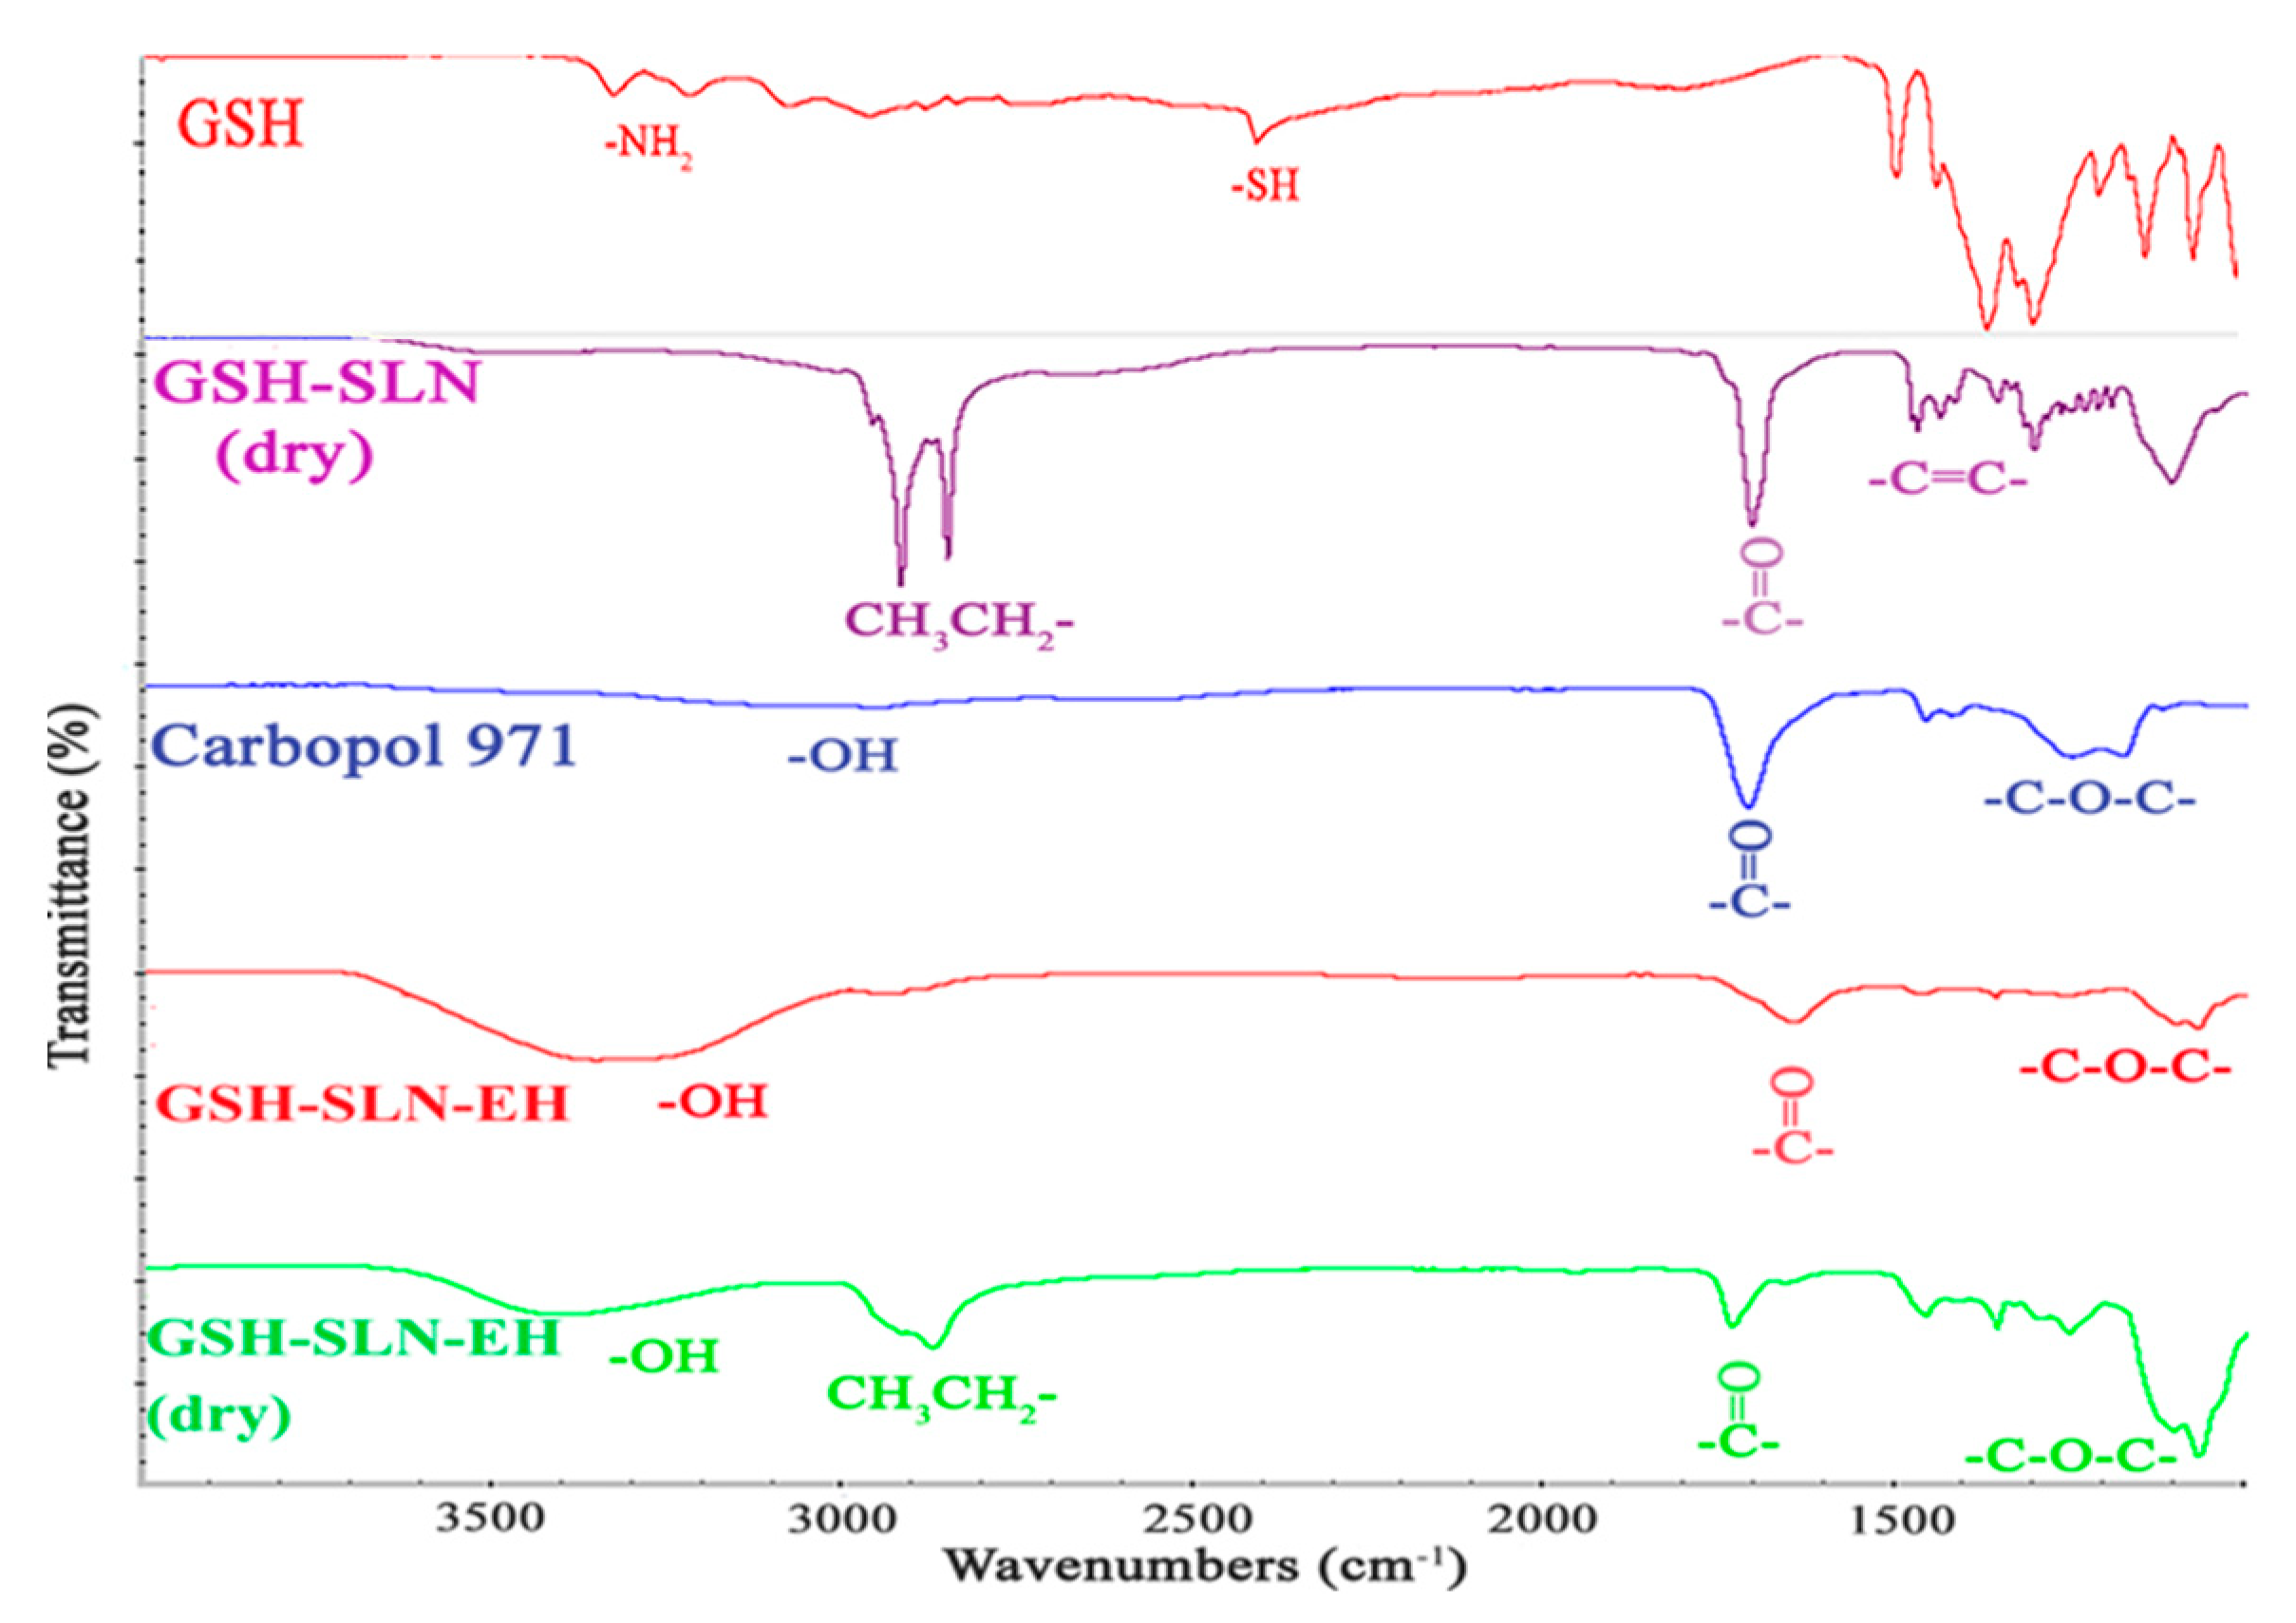
2.4.2. FTIR Analysis
2.4.3. Texture Profile Analysis
Gel Strength
Gel Spreadability
2.4.4. Rheological Studies
Flow Behavior and Thixotropic Properties
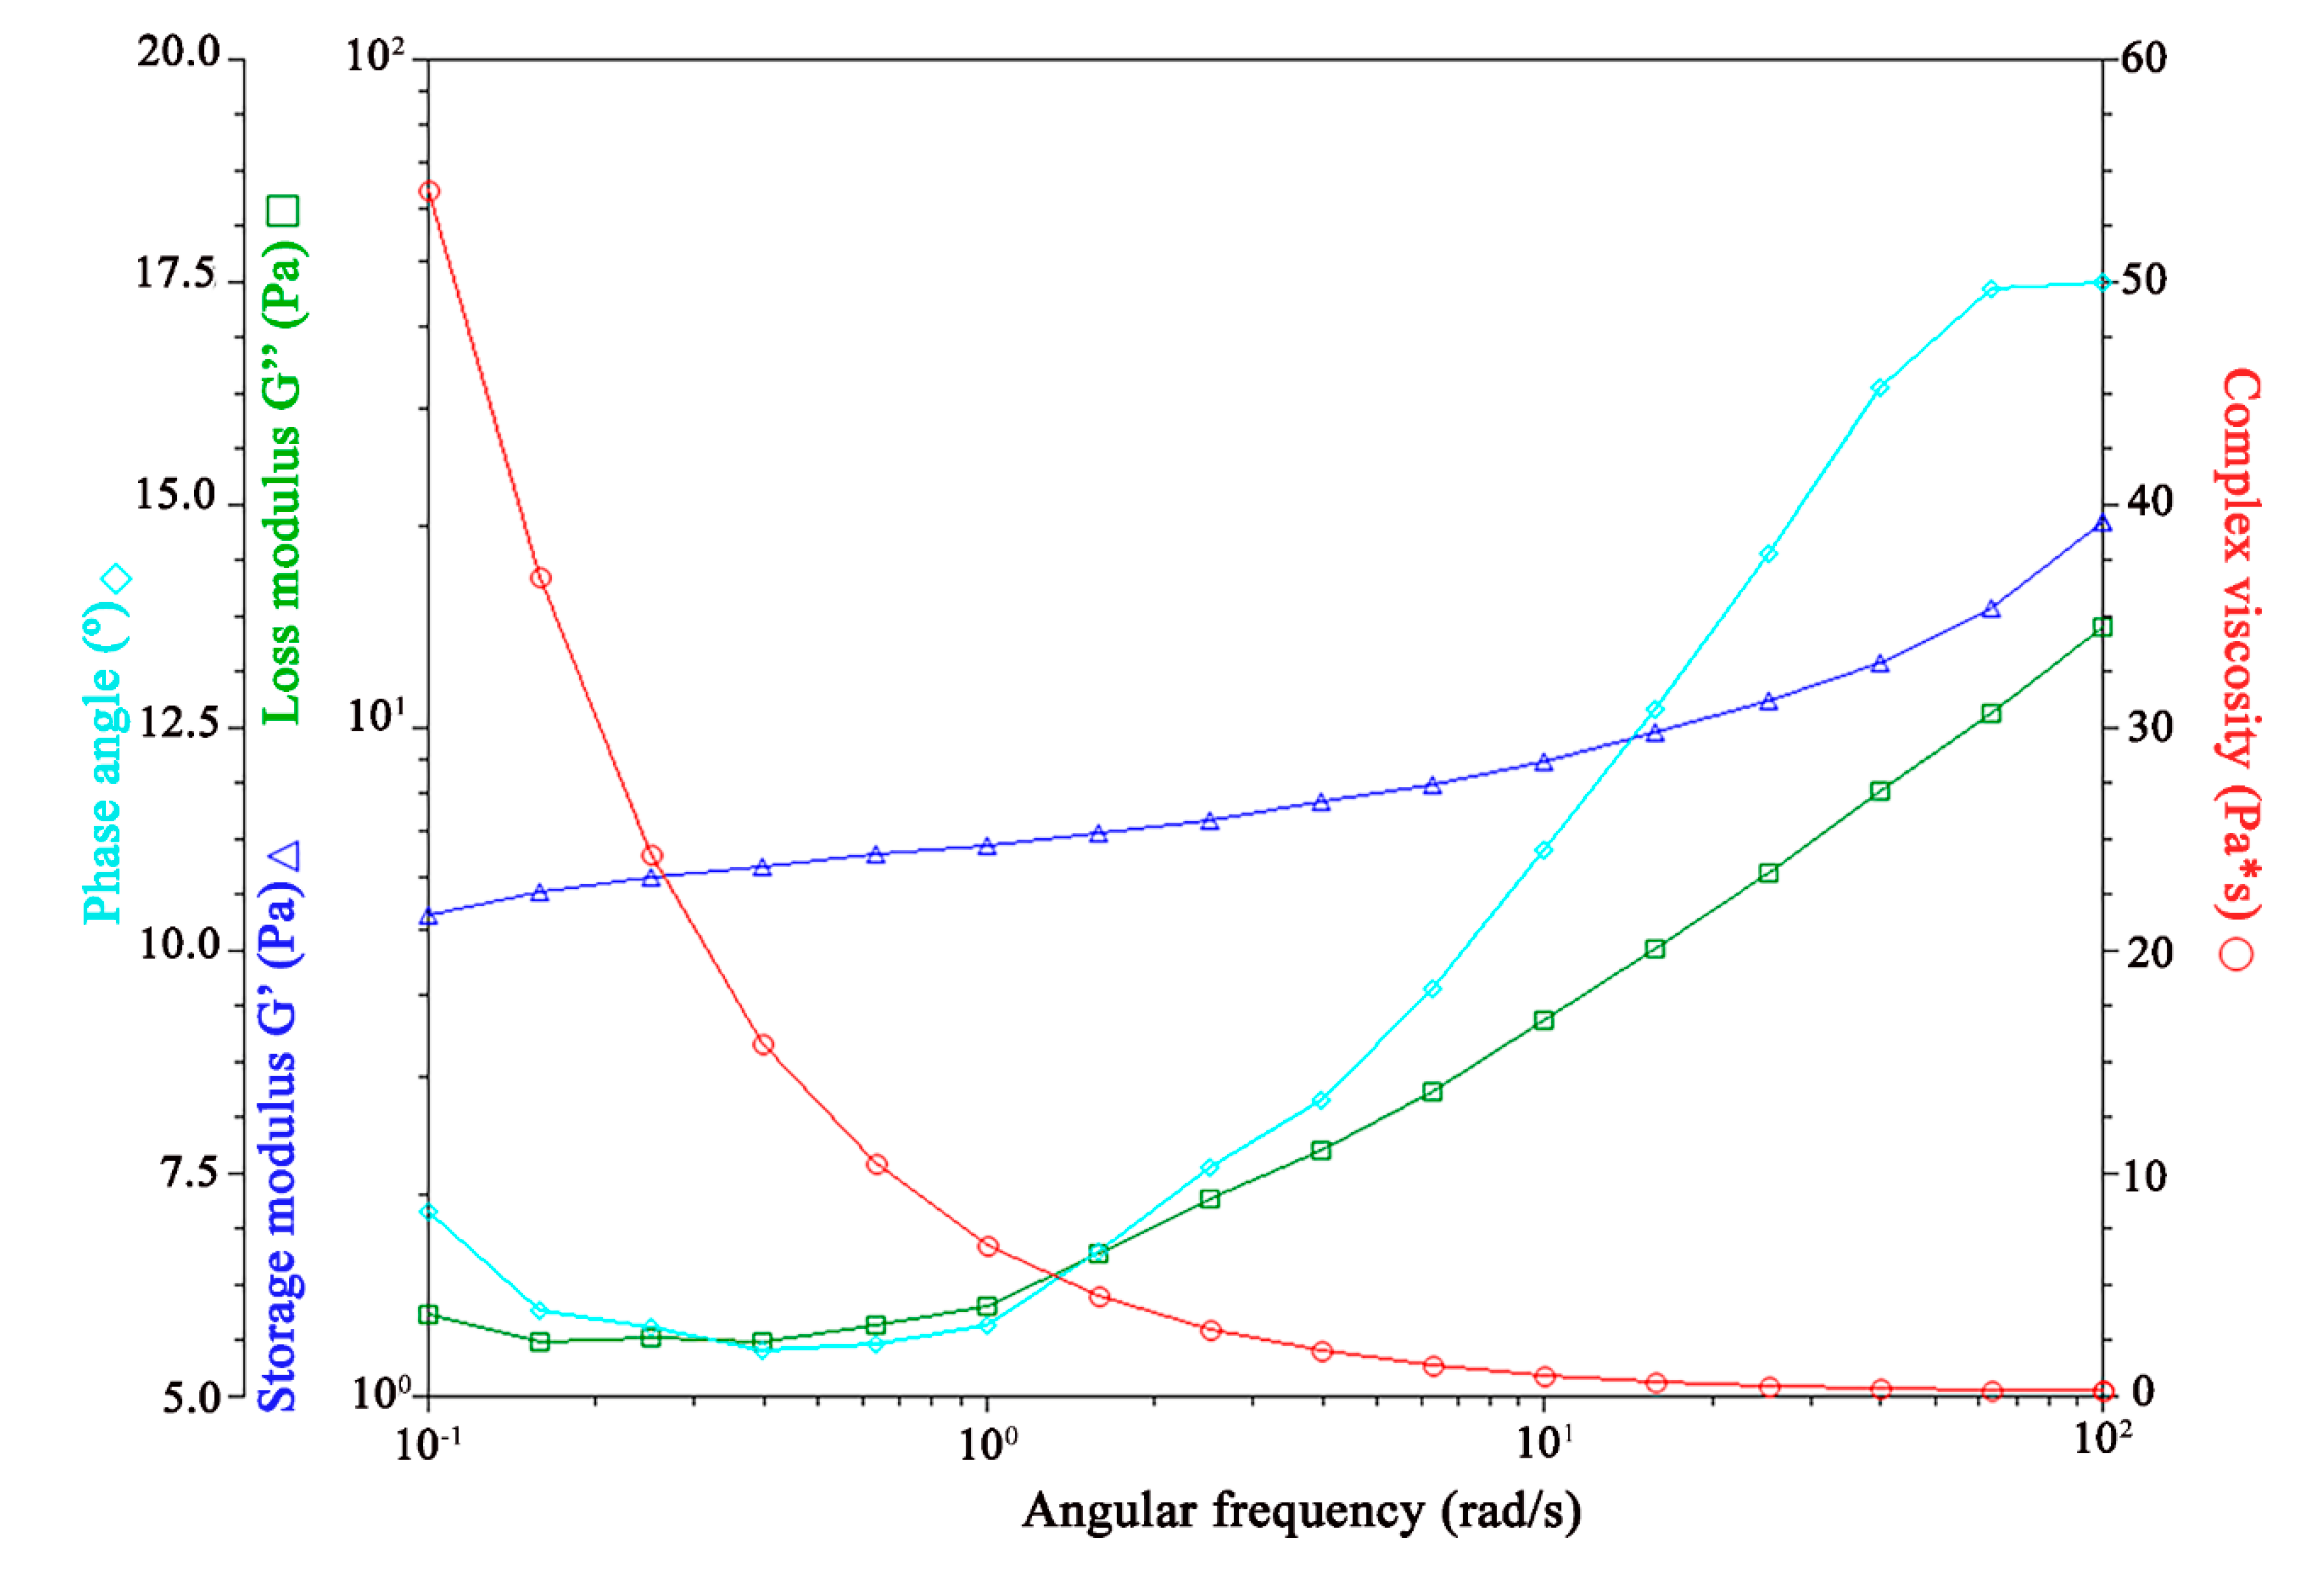
Viscoelasticity Properties
2.4.5. In Vitro Release Studies
2.4.6. Stability Studies
2.5. In Vitro Cell Culture Investigation
2.5.1. Cell Culture
2.5.2. Cytotoxicity Study
2.5.3. Antioxidant Activity Evaluation—UVA Irradiation Rescue
2.6. Ex Vivo Human Skin Evaluation
2.6.1. Skin Tissue Preparation
2.6.2. Franz Diffusion Cell Preparation
2.6.3. Evaluation of Skin Integrity
2.6.4. Permeation Studies
2.6.5. Deposition Studies
Stripping of the SC
Drug Extraction from Viable Epidermis and Dermis
2.7. Statistical Analysis
3. Results and Discussion
3.1. Analytical Method of GSH
3.2. Characterization Studies of GSH-SLN-EH
3.2.1. Morphological Study
3.2.2. FTIR Analysis
3.2.3. Texture Profile Analysis
Gel Strength
Gel Spreadability
3.2.4. Rheological Studies
Flow Behavior and Thixotropic Properties
Viscoelasticity Properties
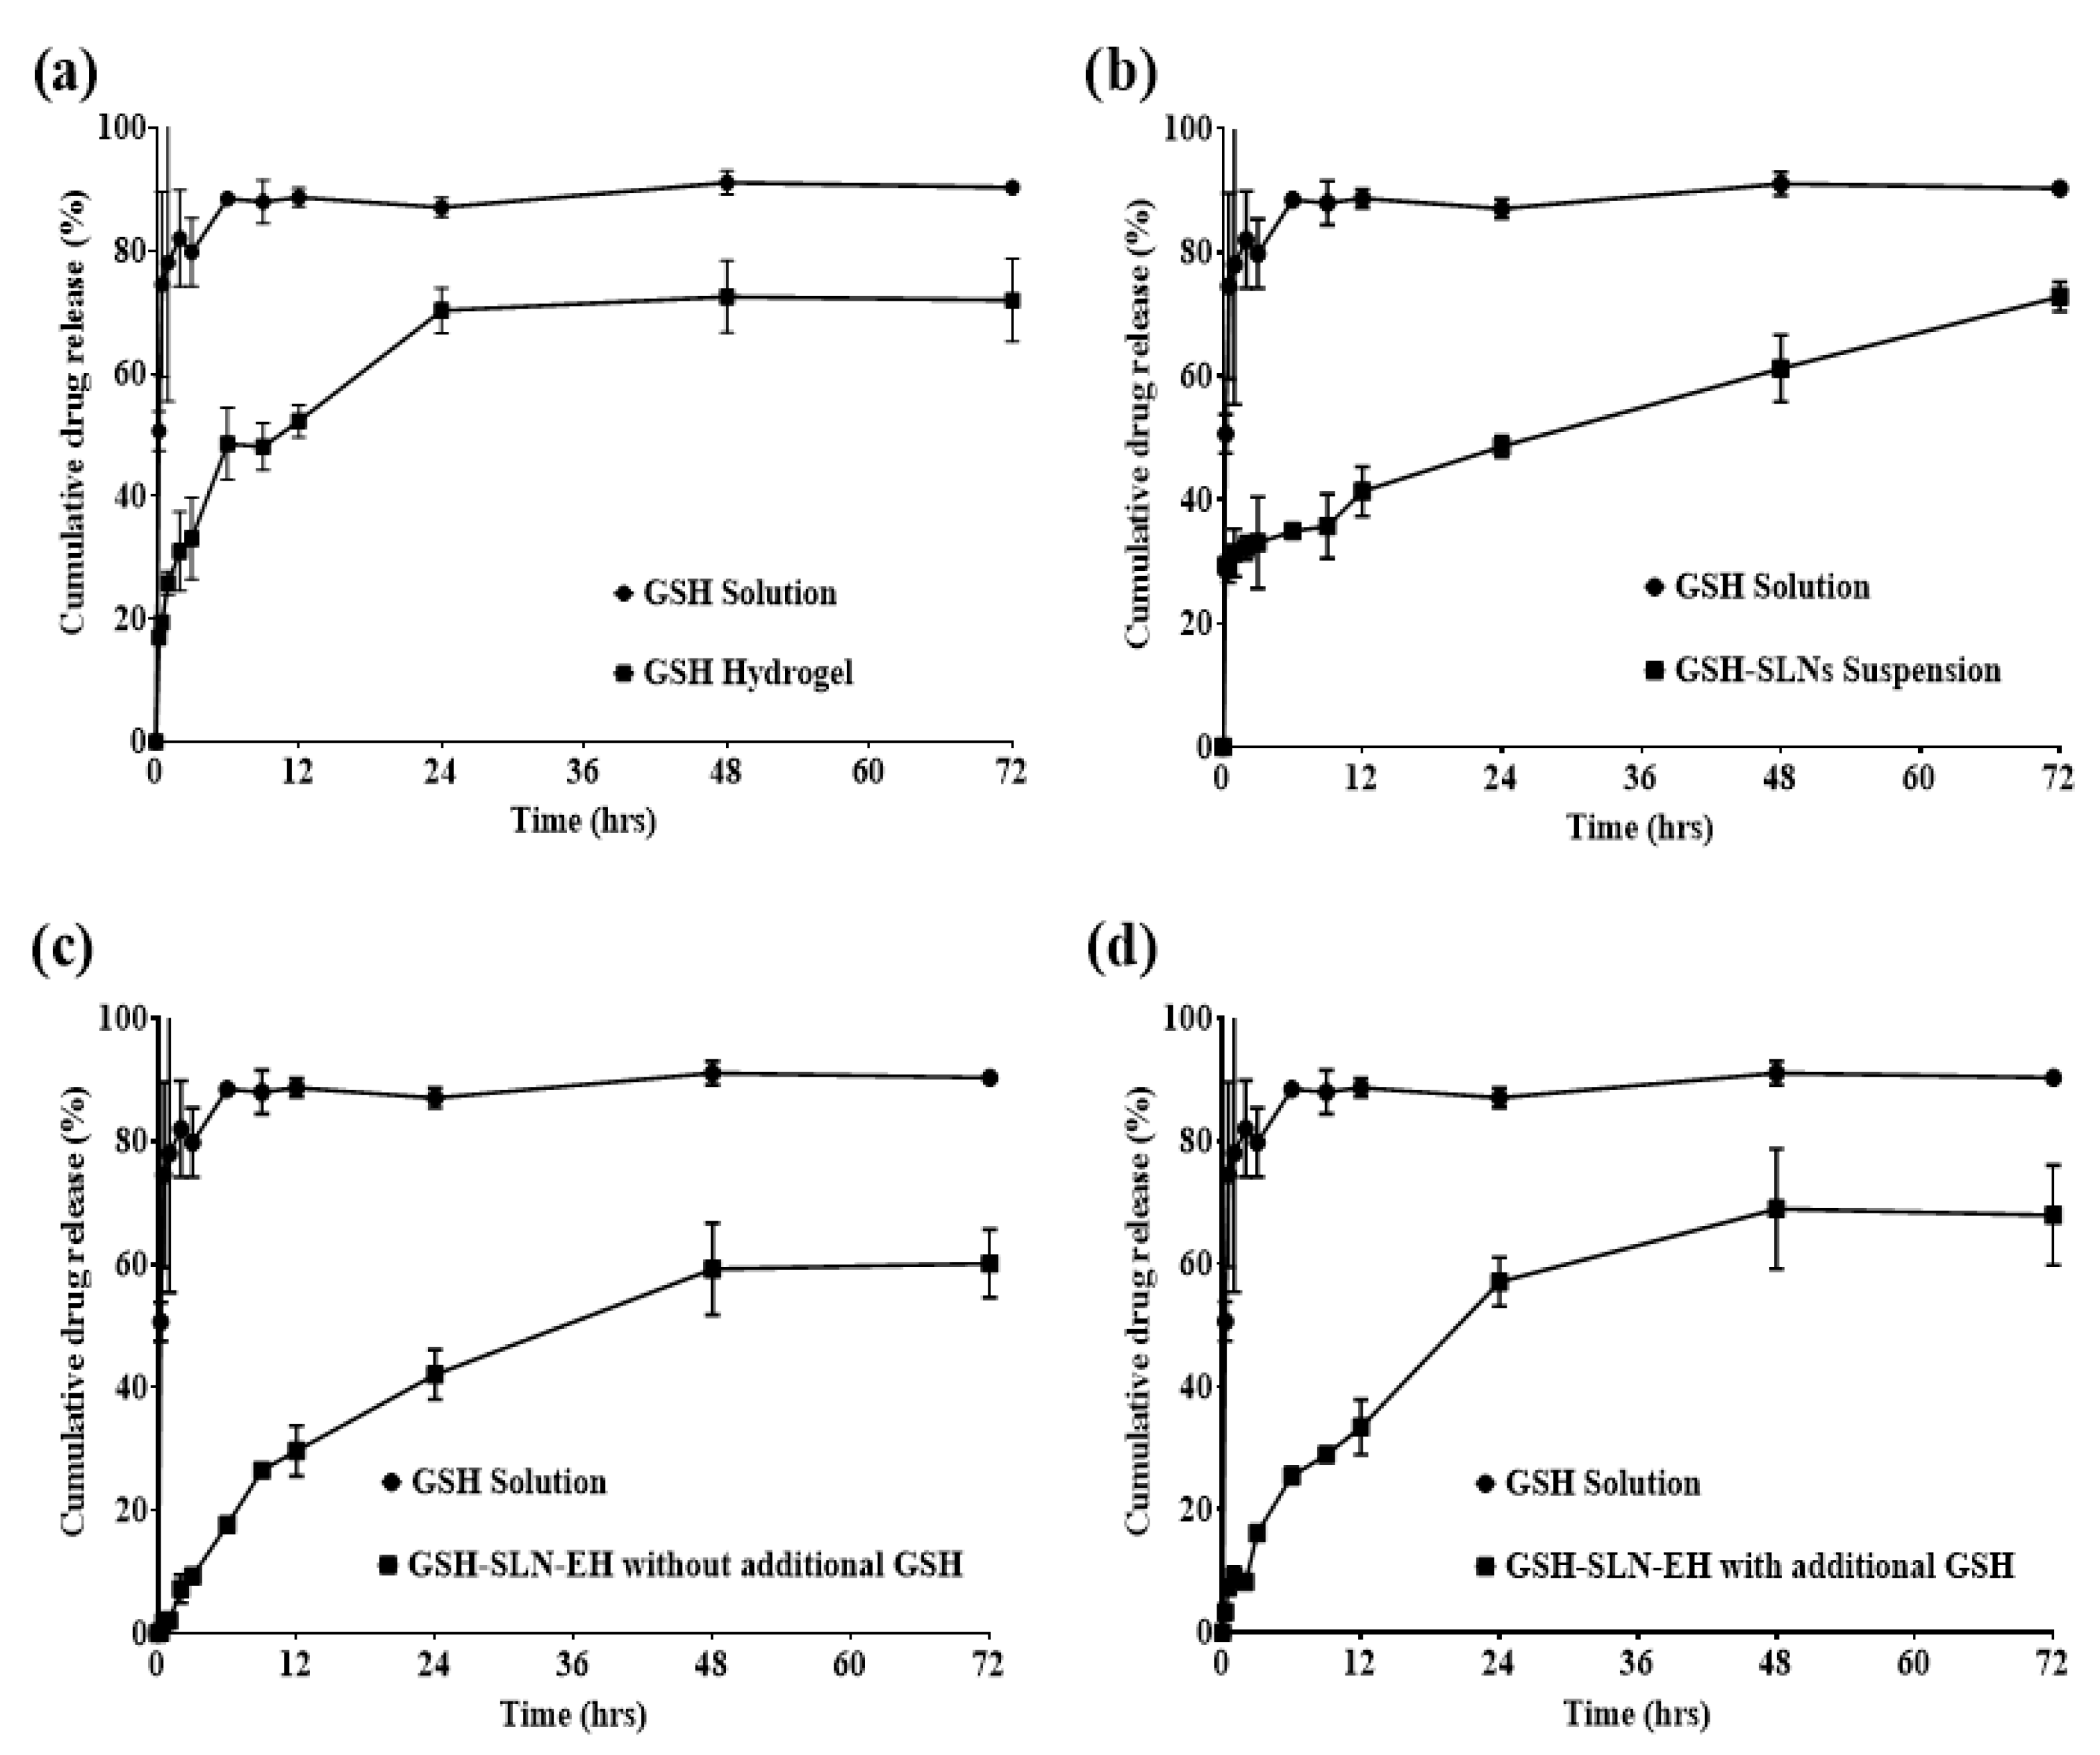
3.2.5. In Vitro Drug Release Studies
3.3. In Vitro Cell Culture Investigation
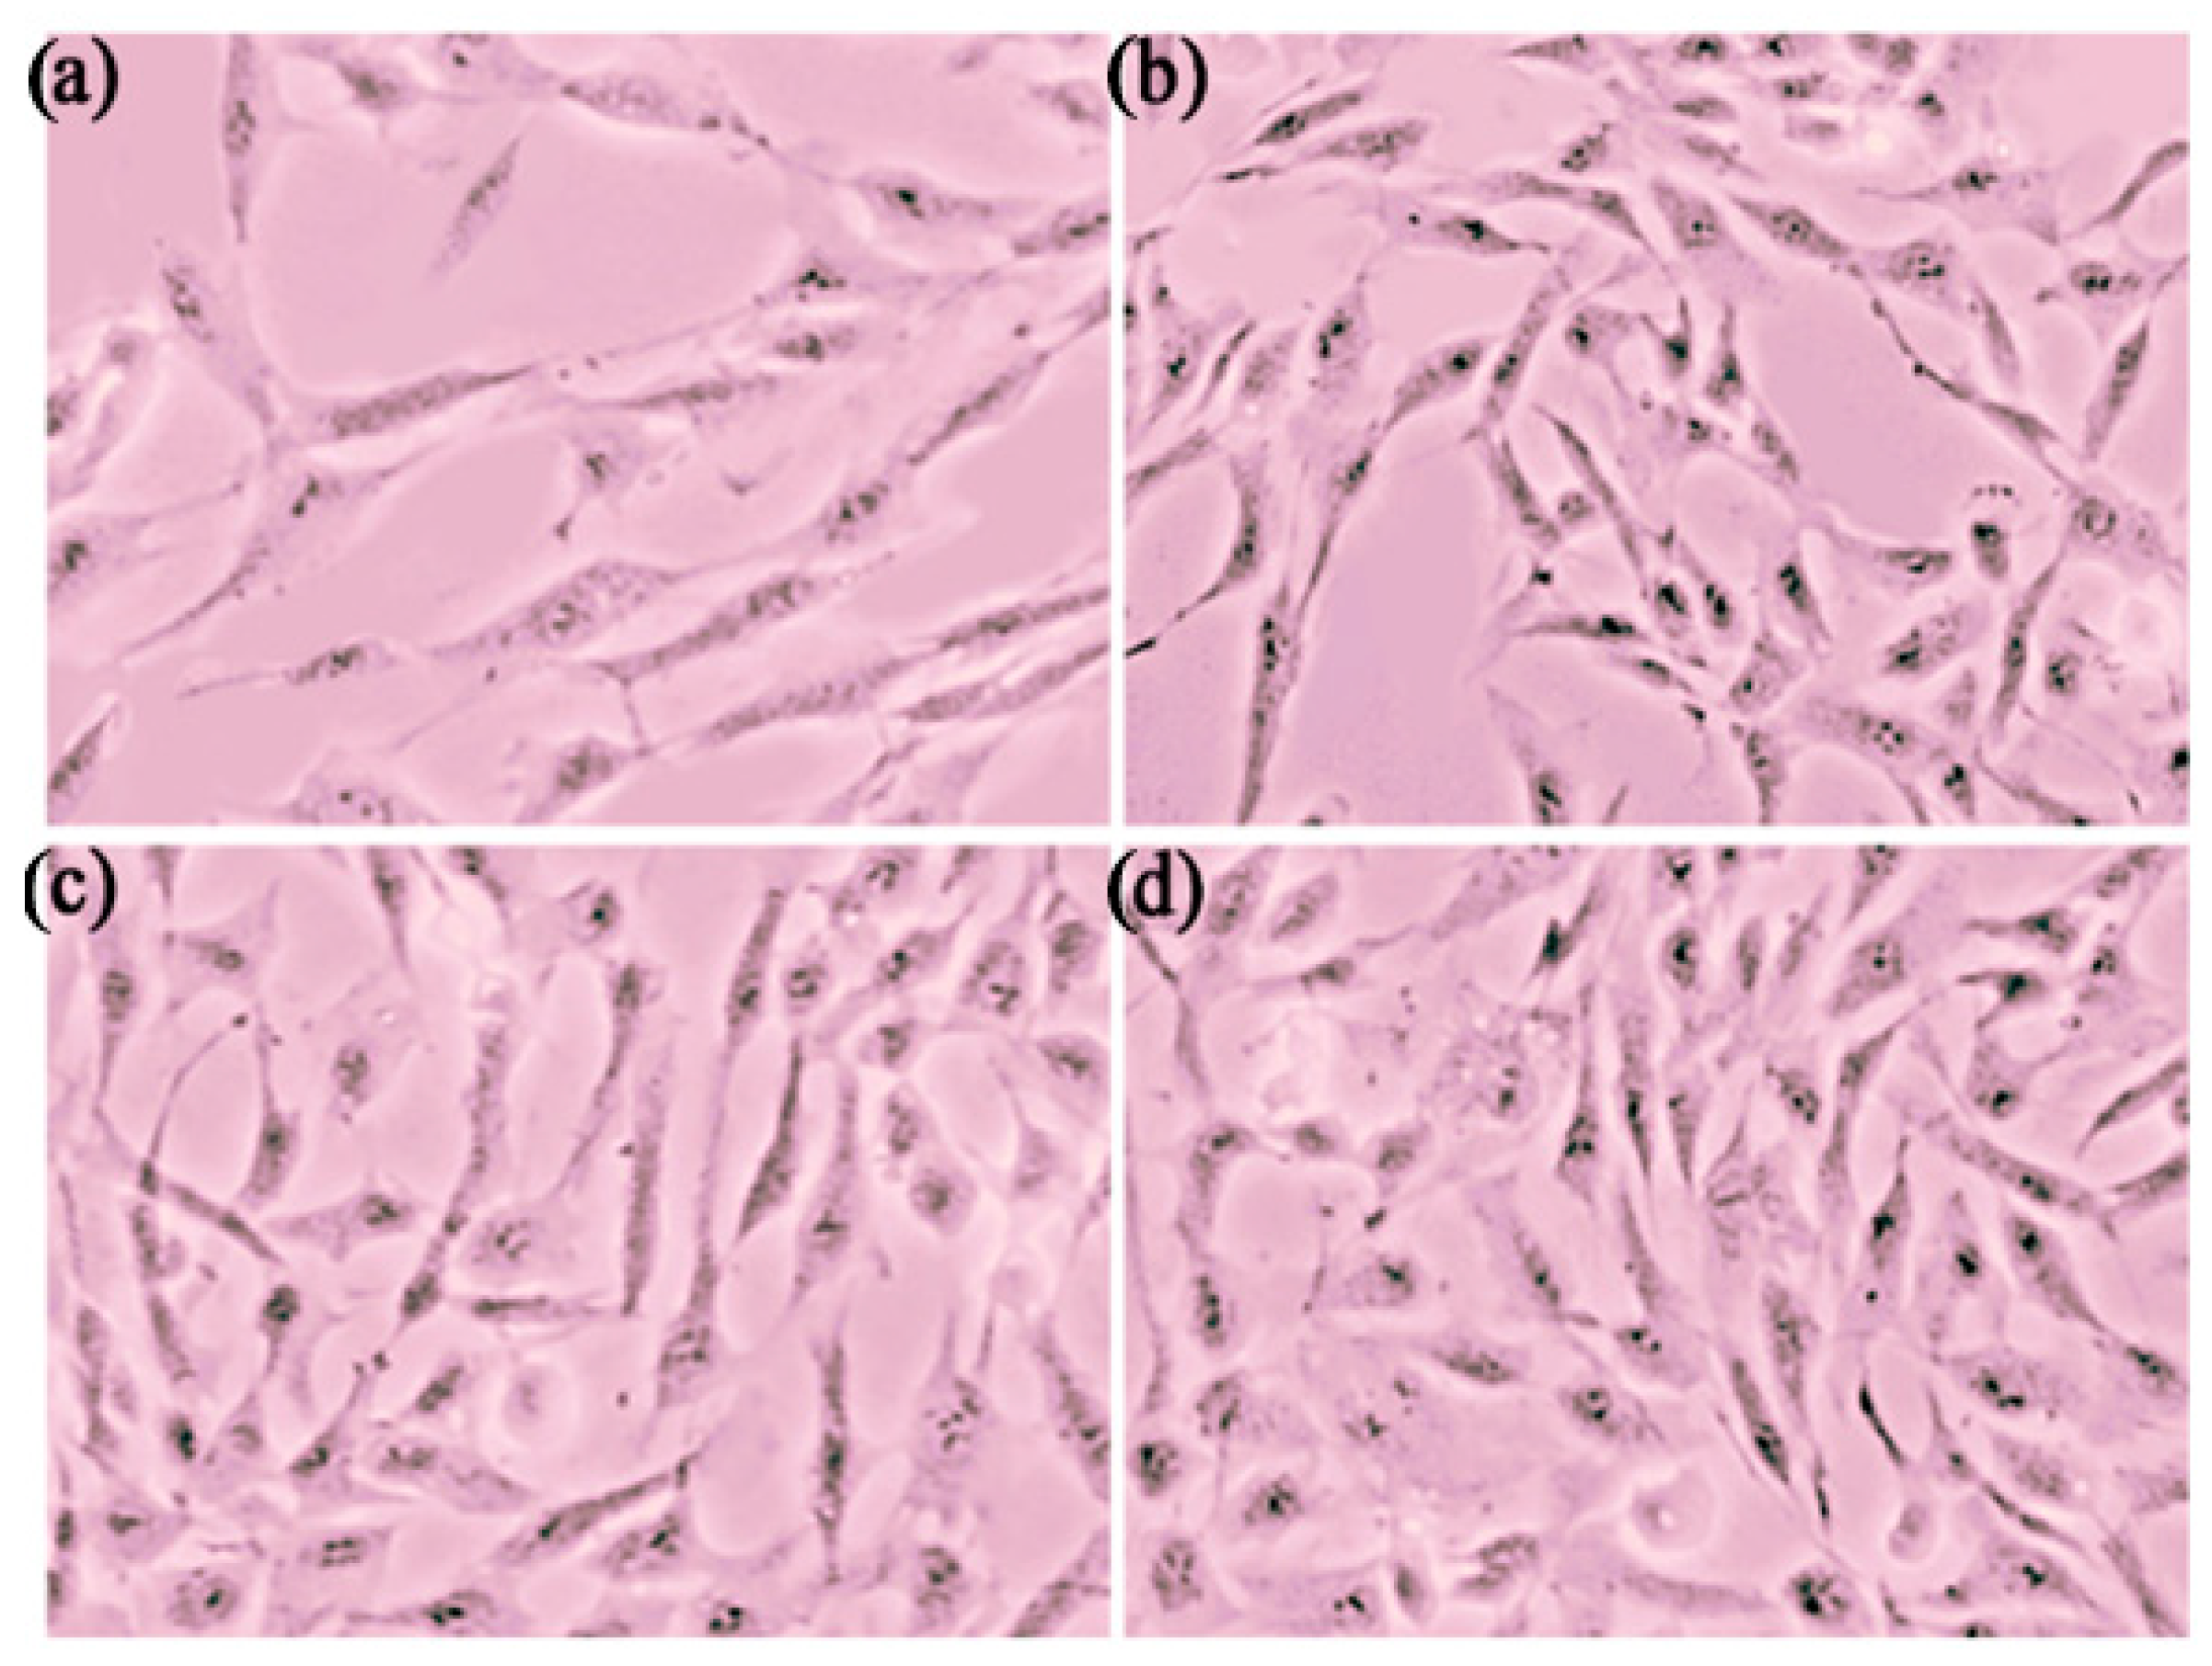
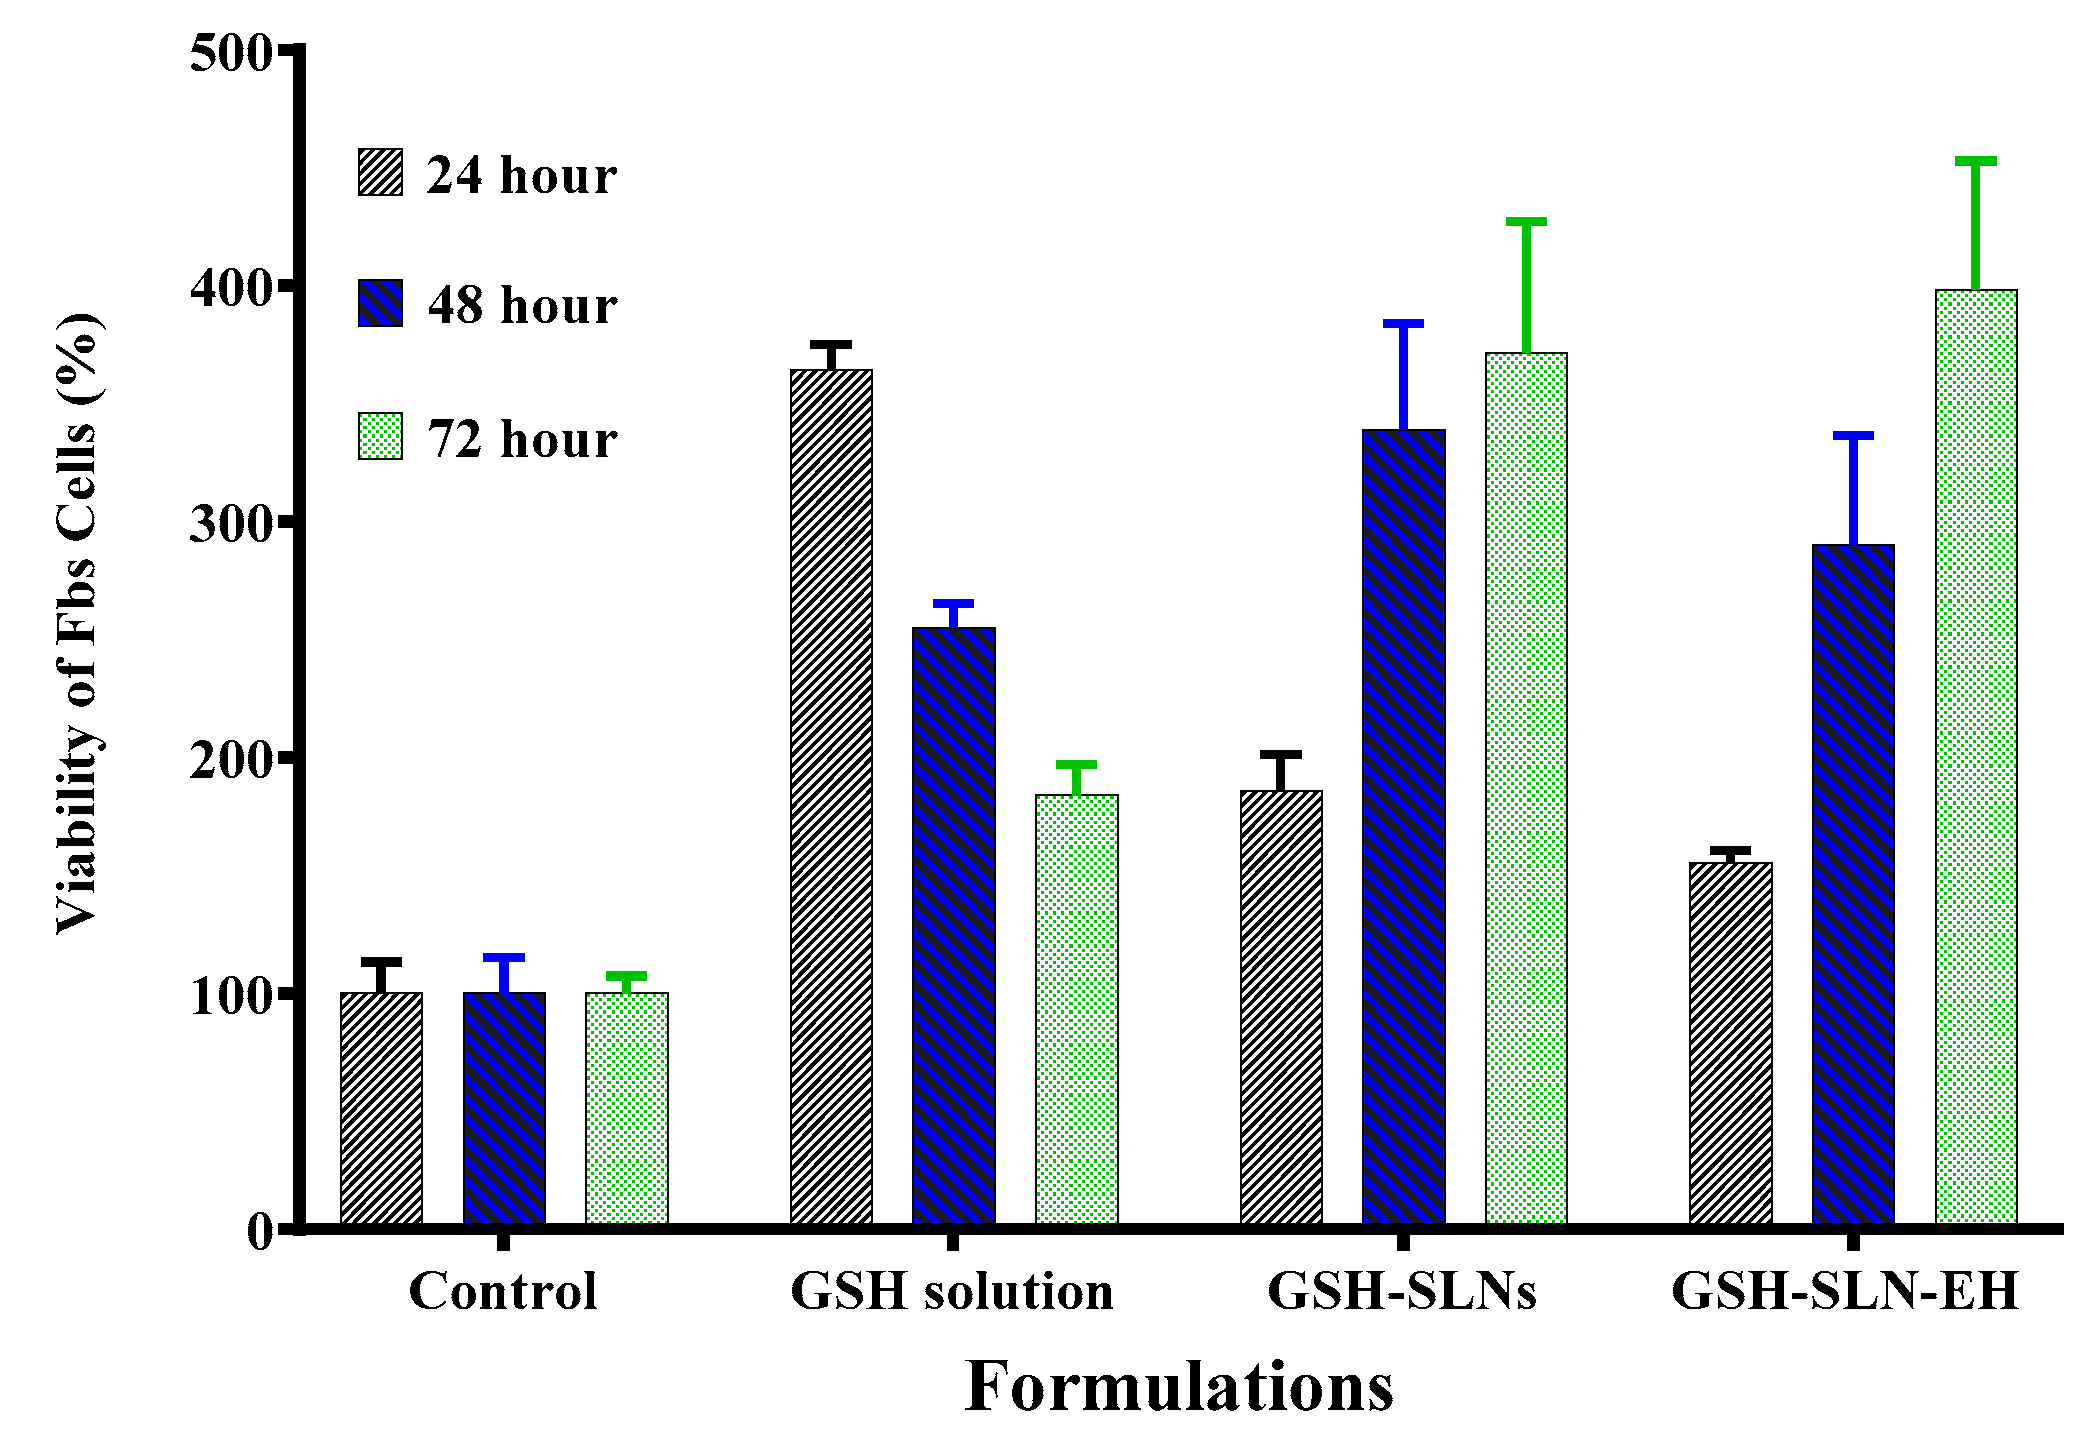
3.3.1. Cytotoxicity Study
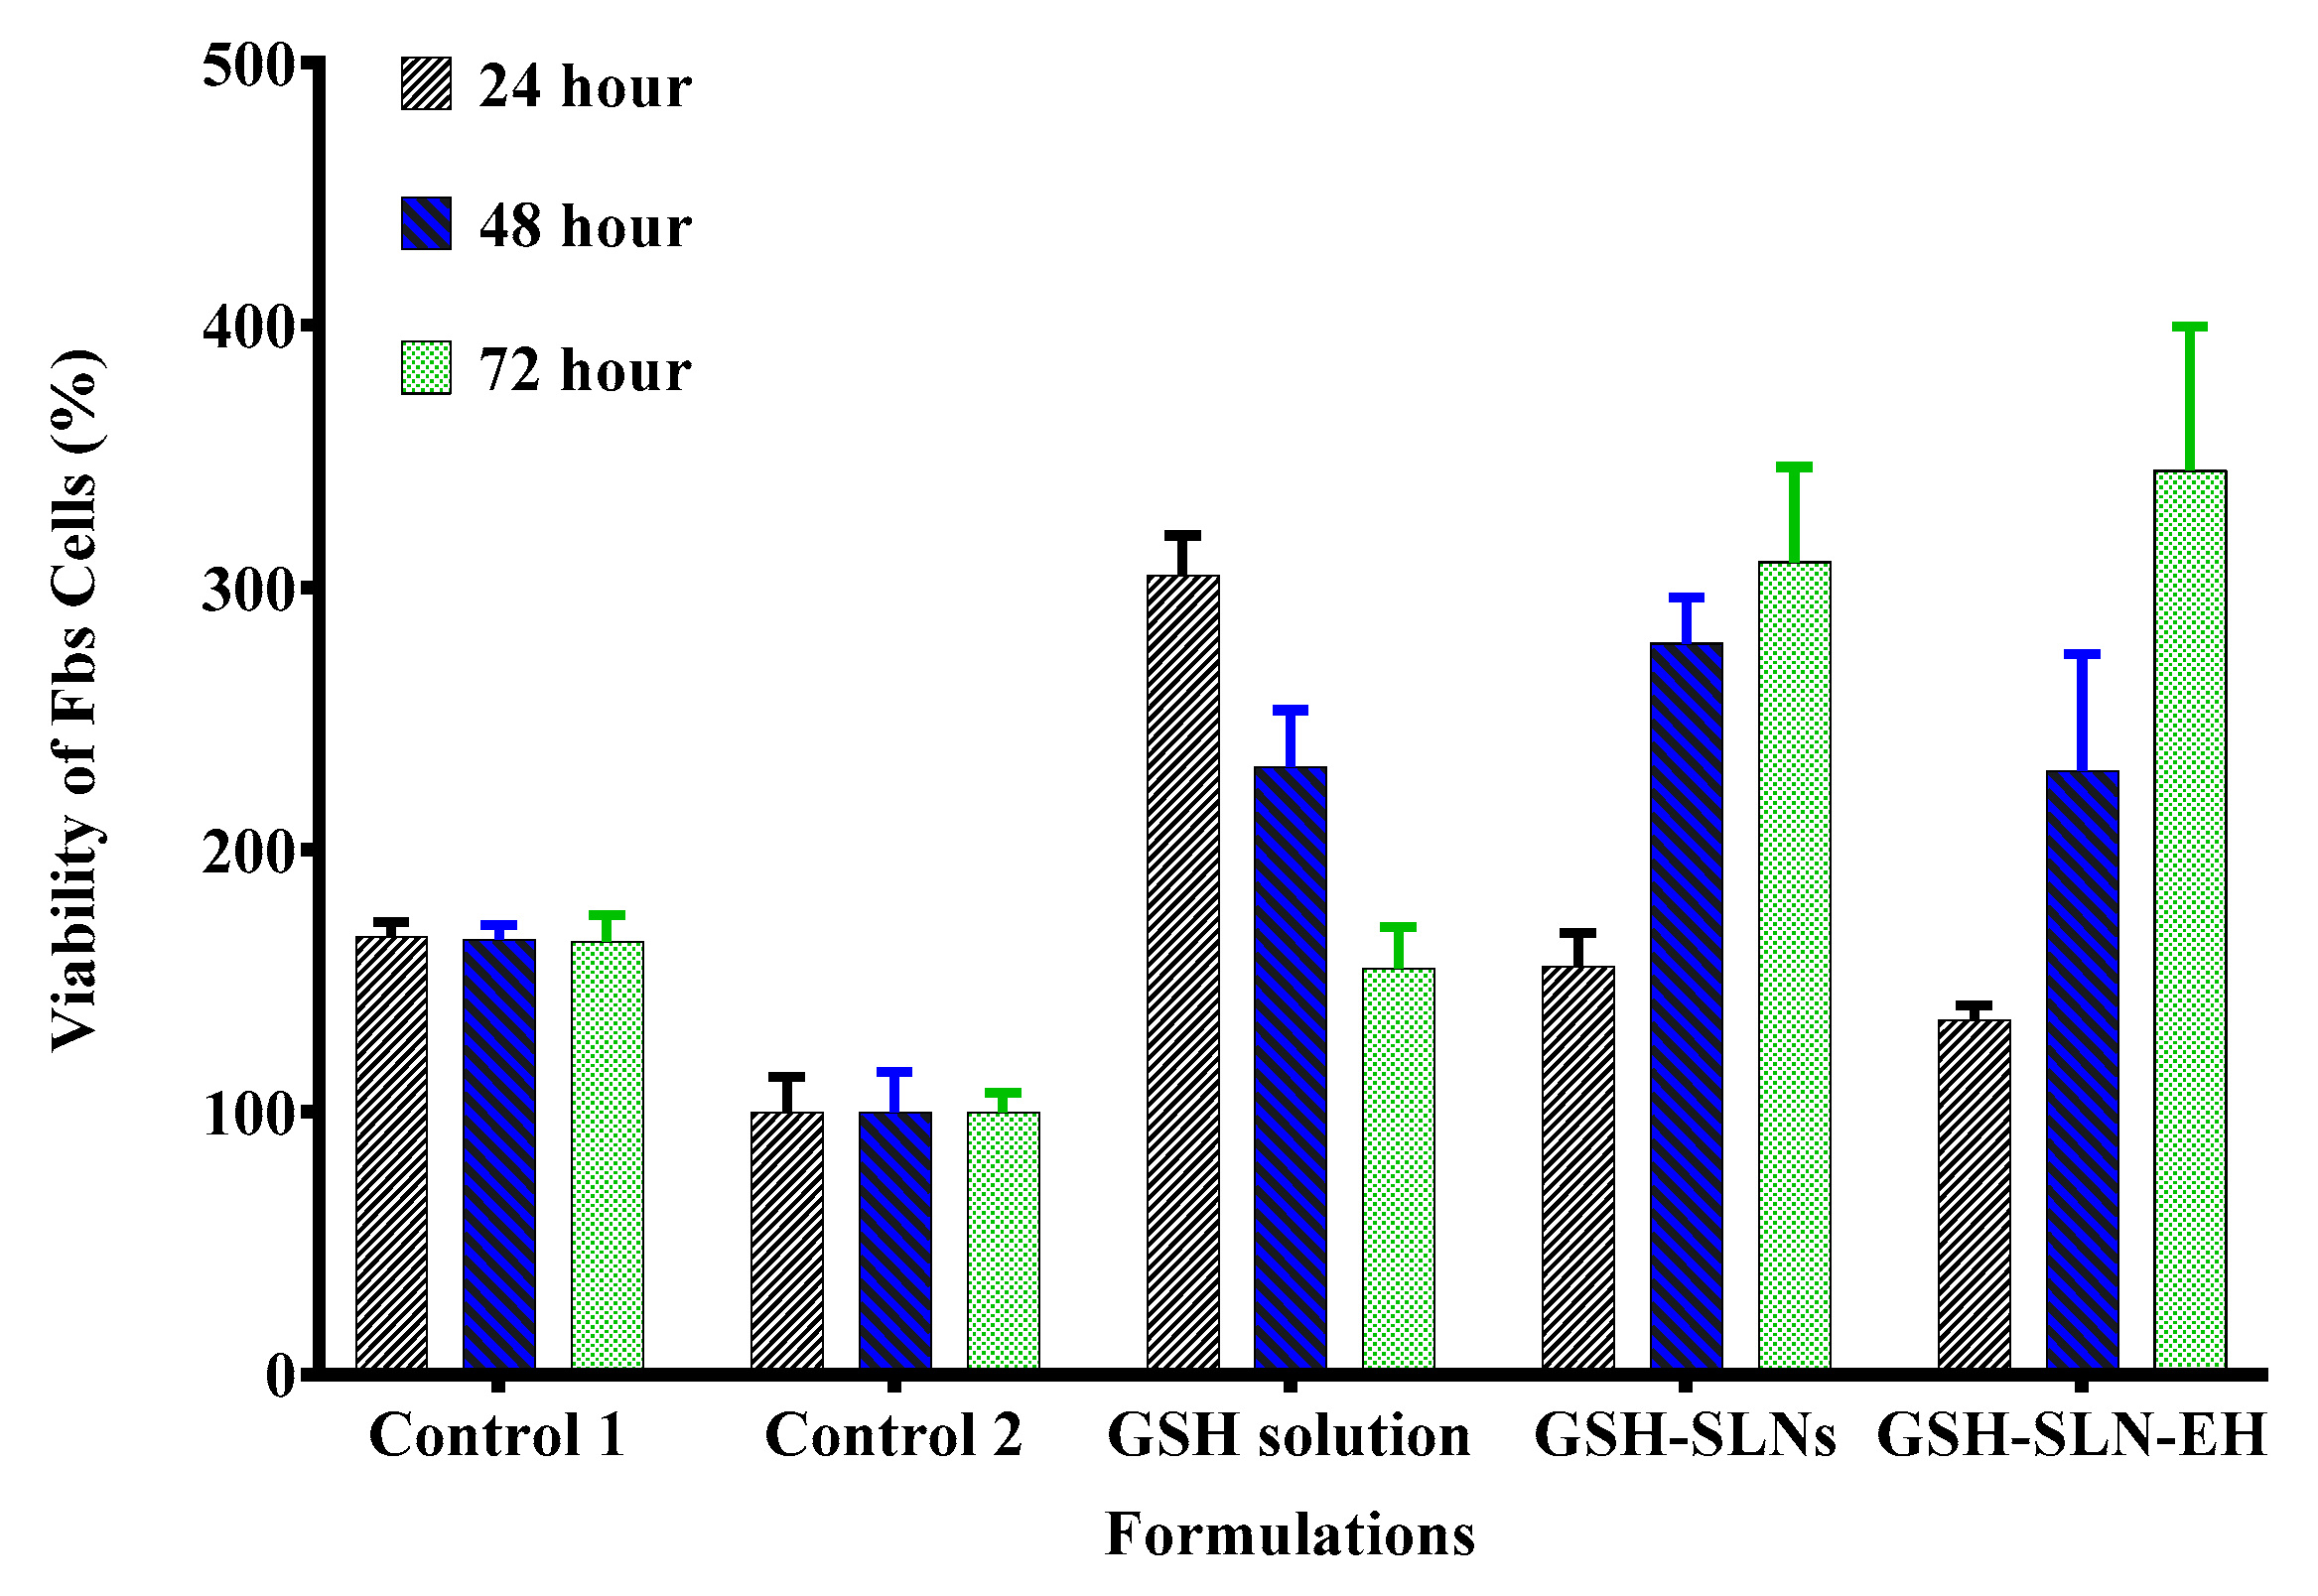
3.3.2. Antioxidant Activity Evaluation—UVA Irradiation Rescue
3.4. Ex Vivo Human Skin Evaluation Studies
3.4.1. Evaluation of Human Skin Integrity
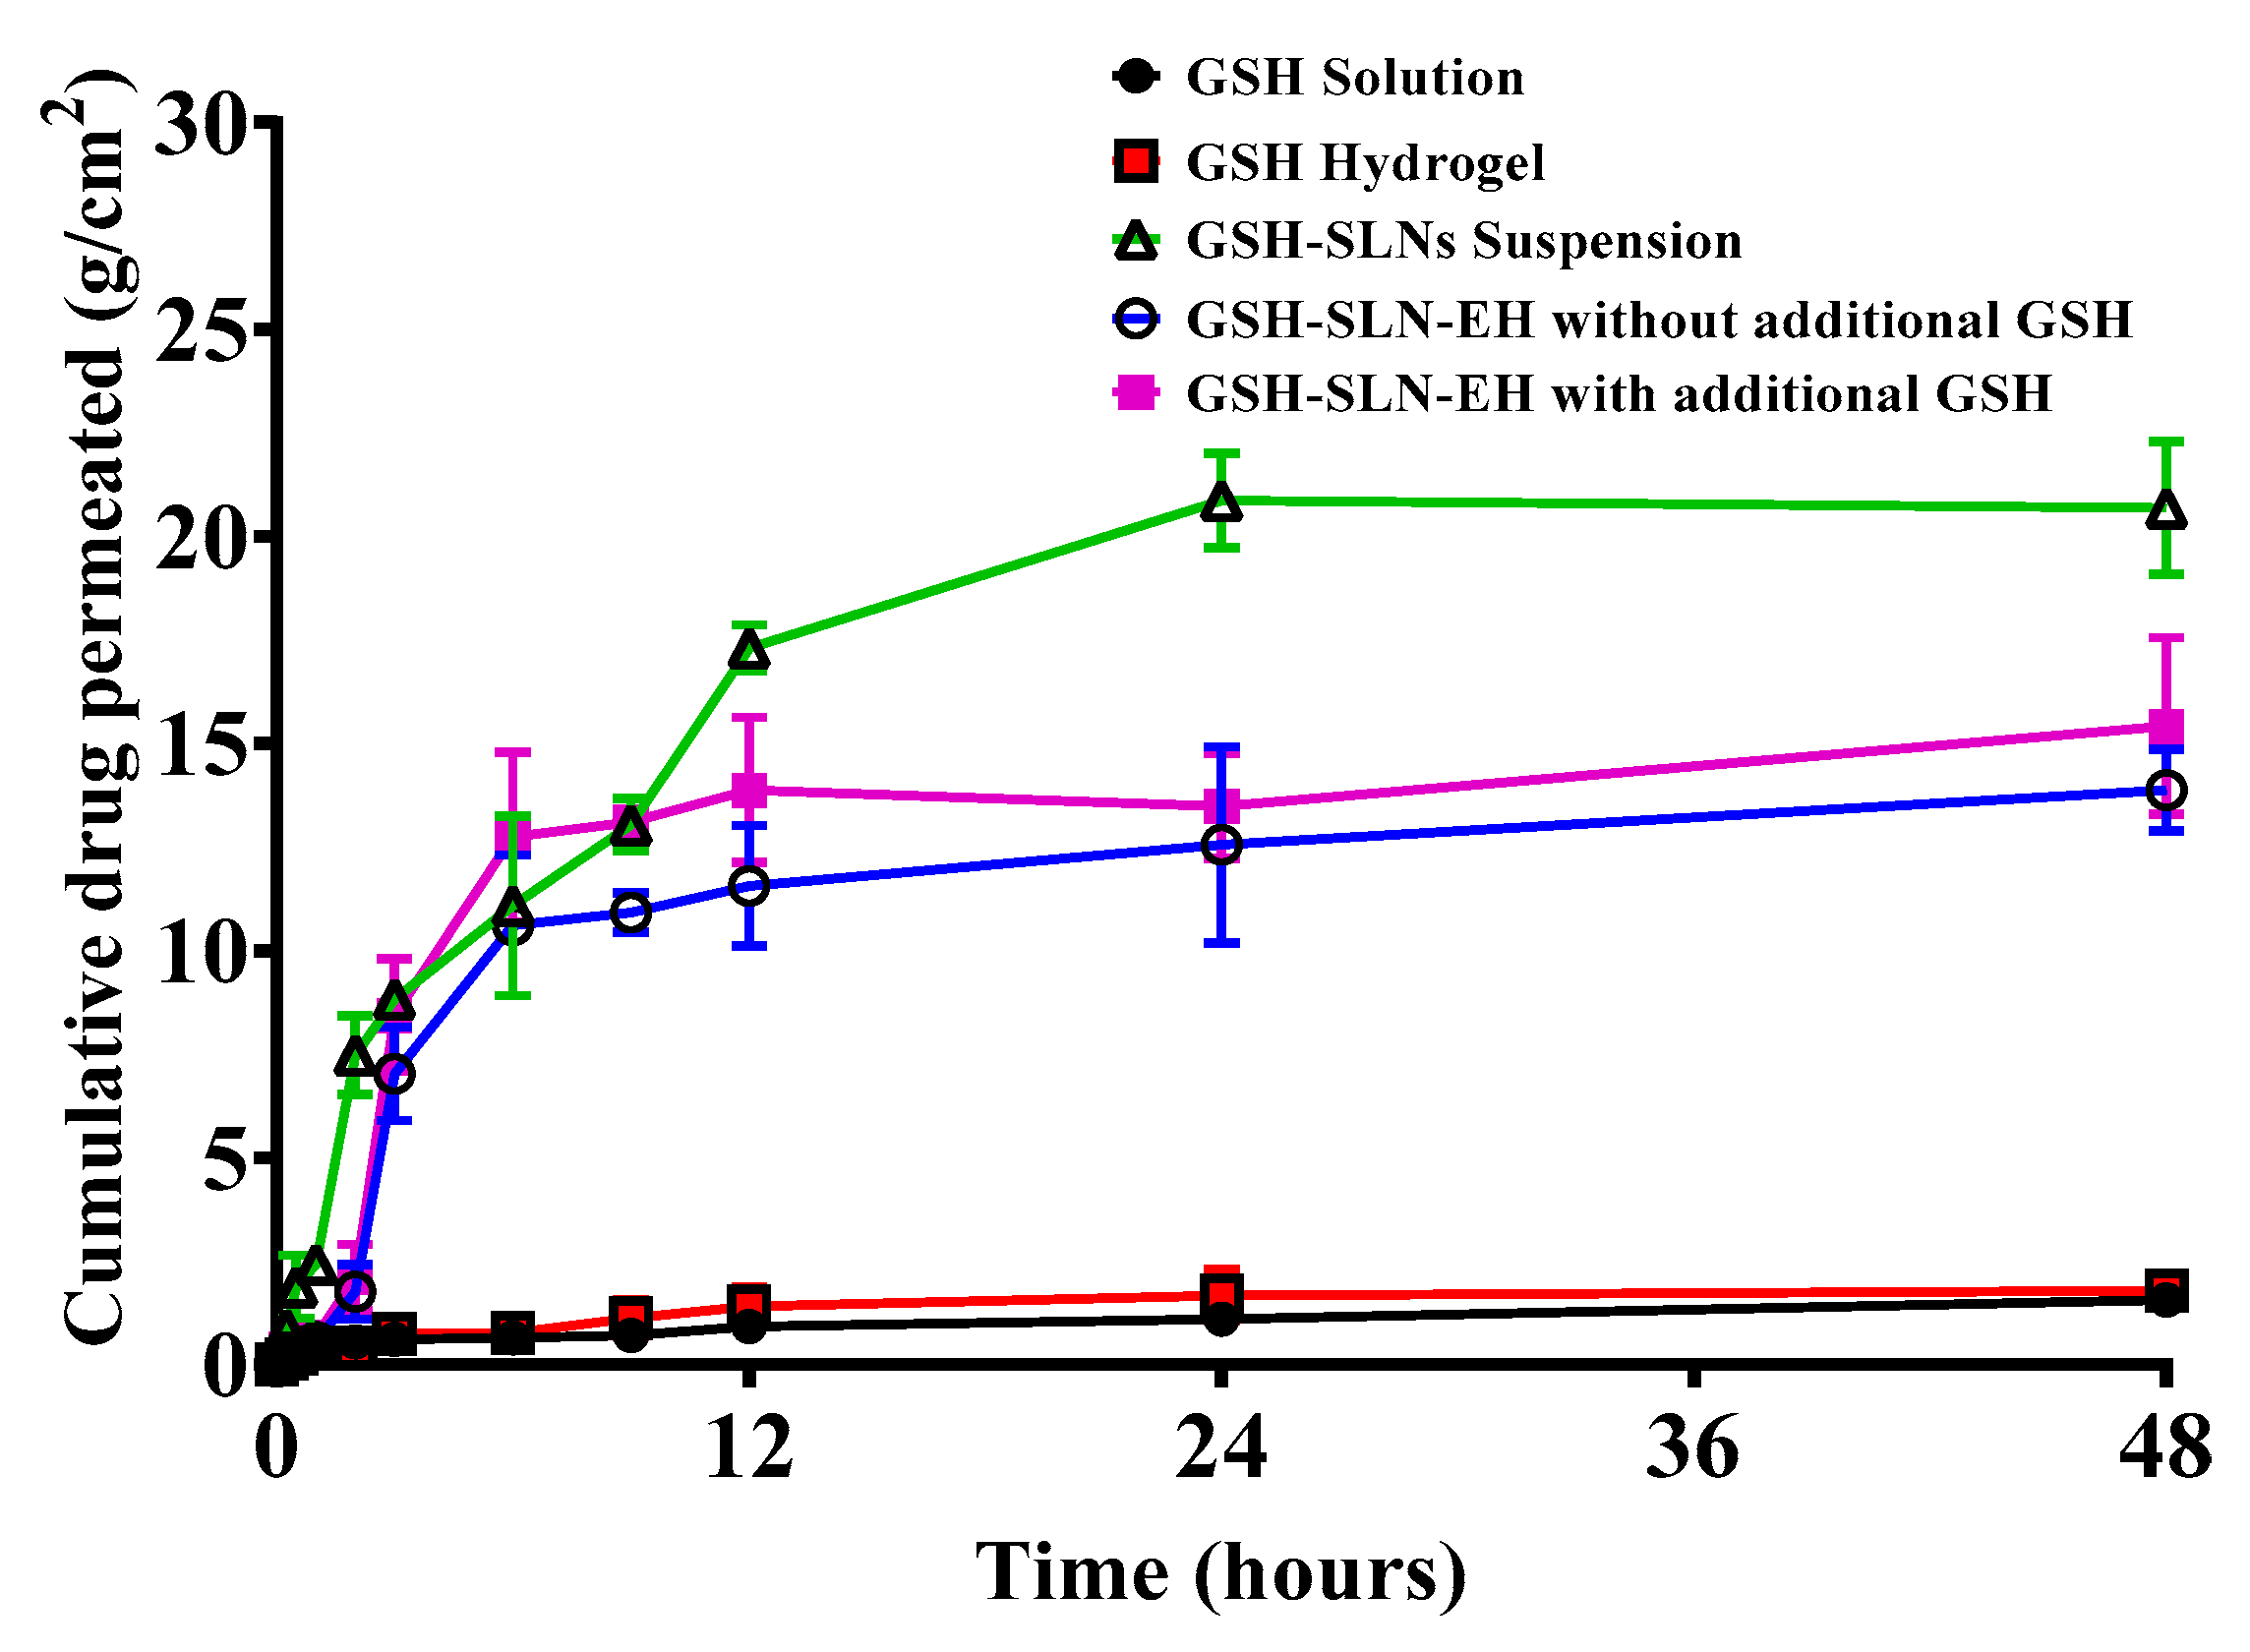
3.4.2. Permeation Studies
3.4.3. Deposition Studies
4. Conclusions
Supplementary Materials
Author Contributions
Funding
Institutional Review Board Statement
Informed Consent Statement
Data Availability Statement
Conflicts of Interest
References
- Chen, G.; Li, D.; Jin, Y.; Zhang, W.; Teng, L.; Bunt, C.; Wen, J. Deformable Liposomes by Reverse-Phase Evaporation Method for an Enhanced Skin Delivery of (+)-Catechin. Drug Dev. Ind. Pharm. 2014, 40, 260–265. [Google Scholar] [CrossRef]
- Chen, S.; Hanning, S.; Falconer, J.; Locke, M.; Wen, J. Recent Advances in Non-Ionic Surfactant Vesicles (Niosomes): Fabrication, Characterization, Pharmaceutical and Cosmetic Applications. Eur. J. Pharm. Biopharm. 2019, 144, 18–39. [Google Scholar] [CrossRef] [PubMed]
- Liu, M.; Wen, J.; Sharma, M. Solid Lipid Nanoparticles for Topical Drug Delivery: Mechanisms, Dosage Form Perspectives, and Translational Status. Curr. Pharm. Des. 2020, 26, 3203–3217. [Google Scholar] [CrossRef] [PubMed]
- Dorf, N.; Maciejczyk, M. Skin Senescence—From Basic Research to Clinical Practice. Front. Med. 2024, 11, 1484345. [Google Scholar] [CrossRef] [PubMed]
- Li, D.; Martini, N.; Liu, M.; Falconer, J.R.; Locke, M.; Wu, Z.; Wen, J. Non-Ionic Surfactant Vesicles as a Carrier System for Dermal Delivery of (+)-Catechin and their Antioxidant Effects. J. Drug Target. 2021, 29, 310–322. [Google Scholar] [CrossRef]
- Jiang, X.; Zeng, Y.; Zhang, W.; Wang, C.; Li, W. Advances in Microneedle Patches for Long-Acting Contraception. Acta Mater. Medica 2023, 2, 1–8. [Google Scholar] [CrossRef]
- Su, C.; Chen, Y.; Tsai, Y.; Weng, S.; Jan, J. Antioxidant Activity of Linear and Star-Shaped Polypeptides Modified with Dopamine and Glutathione. Eur. Polym. J. 2021, 152, 110497. [Google Scholar] [CrossRef]
- Wen, J.; Du, Y.; Li, D.; Alany, R. Development of Water-in-Oil Microemulsions with the Potential of Prolonged Release for Oral Delivery of L-Glutathione. Pharm. Dev. Technol. 2013, 18, 1424–1429. [Google Scholar] [CrossRef]
- Chen, G.; Bunt, C.; Wen, J. Mucoadhesive Polymers-Based Film as a Carrier System for Sublingual Delivery of Glutathione. J. Pharm. Pharmacol. 2015, 67, 26–34. [Google Scholar] [CrossRef] [PubMed]
- Al Gailani, M.; Liu, M.; Wen, J. Ligands for Oral Delivery of Peptides Across the Blood-Brain-Barrier. Acta Mater. Medica 2022, 1, 106–123. [Google Scholar] [CrossRef]
- Wei, T.; Thakur, S.S.; Liu, M.; Wen, J. Oral Delivery of Glutathione: Antioxidant Function, Barriers and Strategies. Acta Mater. Medica 2022, 1, 177–192. [Google Scholar] [CrossRef]
- Flagg, E.W.; Coates, R.J.; Jones, D.P.; Byers, T.E.; Greenberg, R.S.; Gridley, G.; McLaughlin, J.K.; Blot, W.J.; Haber, M.; Preston-Martin, S. Dietary Glutathione Intake and the Risk of Oral and Pharyngeal Cancer. Am. J. Epidemiol. 1994, 139, 453–465. [Google Scholar] [CrossRef] [PubMed]
- Lu, S.C. Regulation of Glutathione Synthesis. Mol. Asp. Med. 2009, 30, 42–59. [Google Scholar] [CrossRef] [PubMed]
- Yin, G.; Gan, Y.; Jiang, H.; Yu, T.; Liu, M.; Zhang, Y.; Li, H.; Yin, P.; Yao, S. Direct Quantification and Visualization of Homocysteine, Cysteine, and Glutathione in Alzheimer’s and Parkinson’s Disease Model Tissues. Anal. Chem. 2021, 93, 9878–9886. [Google Scholar] [CrossRef]
- Han, Y.; Spicer, J.; Huang, Y.; Bunt, C.; Liu, M.; Wen, J. Advancements in Oral Insulin: A Century of Research and the Emergence of Targeted Nanoparticle Strategies. Eur. J. Lipid Sci. Technol. 2024, 126, 2300271. [Google Scholar] [CrossRef]
- Liu, M.; Sharma, M.; Lu, G.; Yin, N.; Gailani, M.A.; Sreebhavan, S.; Wen, J. Preformulation Studies of L-Glutathione: Physicochemical Properties, Degradation Kinetics, and In vitro Cytotoxicity Investigations. Drug Dev. Ind. Pharm. 2020, 46, 717–731. [Google Scholar] [CrossRef] [PubMed]
- Liu, M.; Chen, S.; Zhang, Z.; Li, H.; Sun, G.; Yin, N.; Wen, J. Anti-Ageing Peptides and Proteins for Topical Applications: A Review. Pharm. Dev. Technol. 2022, 27, 108–125. [Google Scholar] [CrossRef]
- Liu, M.; Svirskis, D.; Proft, T.; Loh, J.; Chen, S.; Kang, D.; Wen, J. Exploring Ex Vivo Peptideolysis of Thymopentin and Lipid-Based Nanocarriers Towards Oral Formulations. Int. J. Pharm. 2022, 625, 122123. [Google Scholar] [CrossRef]
- Liu, M.; Svirskis, D.; Proft, T.; Loh, J.M.S.; Wen, J. Preformulation Studies of Thymopentin: Analytical Method Development, Physicochemical Properties, Kinetic Degradation Investigations and Formulation Perspective. Drug Dev. Ind. Pharm. 2022, 47, 1680–1692. [Google Scholar] [CrossRef] [PubMed]
- Liu, M.; Svirskis, D.; Proft, T.; Loh, J.; Huang, Y.; Wen, J. Cellular Uptake and Transport Mechanism Investigations of PEGylated Niosomes for Improving the Oral Delivery of Thymopentin. Pharmaceutics 2024, 16, 397. [Google Scholar] [CrossRef] [PubMed]
- Reid, I.R.; Wen, J.; Mellar, A.; Liu, M.; Jabr, A.; Horne, A.M. Effect of Oral Zoledronate Administration on Bone Turnover in Older Women. Br. J. Clin. Pharmacol. 2023, 89, 1099–1104. [Google Scholar] [CrossRef] [PubMed]
- Liu, M.; Sharma, M.; Lu, G.; Zhang, Z.; Yin, N.; Wen, J. Full Factorial Design, Physicochemical Characterization, Ex Vivo Investigation, and Biological Assessment of Glutathione-Loaded Solid Lipid Nanoparticles for Topical Application. Int. J. Pharm. 2023, 630, 122381. [Google Scholar] [CrossRef] [PubMed]
- Malhotra, H.; Gautam, R.K. Biomedical Applications of Chitosan and its Derivatives. Biopolym. Biomed. Appl. 2024, 25–51. [Google Scholar] [CrossRef]
- Pillai, O.; Panchagnula, R. Transdermal Delivery of Insulin from Poloxamer Gel: Ex Vivo and in Vivo Skin Permeation Studies in Rat using Iontophoresis and Chemical Enhancers. J. Control Release 2003, 89, 127–140. [Google Scholar] [CrossRef] [PubMed]
- Li, H.; Gou, R.; Liao, J.; Wang, Y.; Qu, R.; Tang, Q.; Gan, J.; Zou, L.; Shi, S. Recent Advances in Nano-Targeting Drug Delivery Systems for Rheumatoid Arthritis Treatment. Acta Mater. Medica 2023, 2, 23–41. [Google Scholar] [CrossRef]
- Zhang, C.; He, Y.; Sun, X.; Wei, W.; Liu, Y.; Rao, Y. PROTACs Targeting Epigenetic Proteins. Acta Mater. Medica 2023, 2, 409–429. [Google Scholar] [CrossRef]
- Cao, H.; Wang, M.; Ding, J.; Lin, Y. Hydrogels: A Promising Therapeutic Platform for Inflammatory Skin Diseases Treatment. J. Mater. Chem. B 2024, 12, 8007–8032. [Google Scholar] [CrossRef] [PubMed]
- Zöller, K.; To, D.; Bernkop-Schnürch, A. Biomedical Applications of Functional Hydrogels: Innovative Developments, Relevant Clinical Trials and Advanced Products. Biomaterials 2024, 27, 122718. [Google Scholar] [CrossRef] [PubMed]
- Lunter, D.; Klang, V.; Eichner, A.; Savic, S.M.; Savic, S.; Lian, G.; Erdő, F. Progress in Topical and Transdermal Drug Delivery Research—Focus on Nanoformulations. Pharmaceutics 2024, 16, 817. [Google Scholar] [CrossRef] [PubMed]
- Parhi, R.; Sahoo, S.K.; Das, A. Applications of Polysaccharides in Topical and Transdermal Drug Delivery: A Recent Update of Literature. Braz. J. Pharm. Sci. 2023, 58, e20802. [Google Scholar] [CrossRef]
- Maury, V.; Kushwaha, K.; Katiyar, P.; Gautam, H.; Patel, A.S.; Sinha, A.; Kannojiya, S.; Mishra, A. In-Situ Gelling System: An Alternative Contender for Conventional Drug Delivery. Zibaldone Estud. Ital. 2024, 11, 49–66. [Google Scholar]
- Heremans, J.; Ballet, S.; Martin, C. The Versatility of Peptide Hydrogels: From Self-assembly to Drug Delivery Applications. J. Pept. Sci. 2024, e3662. [Google Scholar] [CrossRef] [PubMed]
- Feng, D.; Li, D.; Wang, J.; Wu, R.; Zhang, C. Senescence-Associated lncRNAs Indicate Distinct Molecular Subtypes Associated with Prognosis and Androgen Response in Patients with Prostate Cancer. Acta Mater. Medica 2023, 2, 299–309. [Google Scholar] [CrossRef]
- Foudazi, R.; Zowada, R.; Manas-Zloczower, I.; Feke, D.L. Porous Hydrogels: Present Challenges and Future Opportunities. Langmuir 2023, 39, 2092–2111. [Google Scholar] [CrossRef] [PubMed]
- Yang, J.; Chen, Y.; Zhao, L.; Zhang, J.; Luo, H. Constructions and Properties of Physically Cross-Linked Hydrogels Based on Natural Polymers. Polym. Rev. 2023, 63, 574–612. [Google Scholar] [CrossRef]
- Guo, Y.; Bae, J.; Fang, Z.; Li, P.; Zhao, F.; Yu, G. Hydrogels and Hydrogel-Derived Materials for Energy and Water Sustainability. Chem. Rev. 2020, 120, 7642–7707. [Google Scholar] [CrossRef] [PubMed]
- Amasya, G.; Inal, O.; Sengel-Turk, C.T. SLN Enriched Hydrogels for Dermal Application: Full Factorial Design Study to Estimate the Relationship between Composition and Mechanical Properties. Chem. Phys. Lipids 2020, 228, 104889. [Google Scholar] [CrossRef] [PubMed]
- Ciolacu, D.E.; Nicu, R.; Ciolacu, F. Cellulose-Based Hydrogels as Sustained Drug-Delivery Systems. Materials 2020, 13, 5270. [Google Scholar] [CrossRef]
- Suhag, D.; Kaushik, S.; Taxak, V.B. Hydrogels in Drug Delivery. In Handbook of Biomaterials for Medical Applications, Volume 1: Fundamentals; Springer: Berlin/Heidelberg, Germany, 2024; pp. 213–246. [Google Scholar]
- Mansoor, S.; Kondiah, P.P.; Choonara, Y.E. Advanced Hydrogels for the Controlled Delivery of Insulin. Pharmaceutics 2021, 13, 2113. [Google Scholar] [CrossRef] [PubMed]
- Hu, X.; Zhang, C.; Xiong, Y.; Ma, S.; Sun, C.; Xu, W. A Review of Recent Advances in Drug Loading, Mathematical Modeling and Applications of Hydrogel Drug Delivery Systems. J. Mater. Sci. 2024, 59, 15077–15116. [Google Scholar]
- Sharma, A.K.; Sharma, R.; Pani, B.; Sarkar, A.; Tripathi, M. A Review on Engineering the Future with Hydrogels: Advancements in Energy Storage Devices and Biomedical Technologies. New J. Chem. 2024. [Google Scholar] [CrossRef]
- Dmour, I. Absorption Enhancement Strategies in Chitosan-Based Nanosystems and Hydrogels Intended for Ocular Delivery: Latest Advances for Optimization of Drug Permeation. Carbohydr. Polym. 2024, 343, 122486. [Google Scholar] [CrossRef]
- Bhattarai, N.; Gunn, J.; Zhang, M. Chitosan-Based Hydrogels for Controlled, Localized Drug Delivery. Adv. Drug Deliv. Rev. 2010, 62, 83–99. [Google Scholar] [CrossRef] [PubMed]
- Andrews, G.P.; Laverty, T.P.; Jones, D.S. Mucoadhesive Polymeric Platforms for Controlled Drug Delivery. Eur. J. Pharm. Biopharm. 2009, 71, 505–518. [Google Scholar] [CrossRef] [PubMed]
- Wu, S.J.; Zhao, X. Bioadhesive Technology Platforms. Chem. Rev. 2023, 123, 14084–14118. [Google Scholar] [CrossRef]
- Zhang, Z.; Yao, A.; Raffa, P. Transparent, Highly Stretchable, Self-Healing, Adhesive, Freezing-Tolerant, and Swelling-Resistant Multifunctional Hydrogels for Underwater Motion Detection and Information Transmission. Adv. Funct. Mater. 2024, 34, 2407529. [Google Scholar] [CrossRef]
- Trapani, A.; Tripodo, G.; Mandracchia, D.; Cioffi, N.; Ditaranto, N.; De Leo, V.; Cordero, H.; Esteban, M.A. Glutathione-Loaded Solid Lipid Nanoparticles Based on Gelucire® 50/13: Spectroscopic Characterization and Interactions with Fish Cells. J. Drug Deliv. Sci. Technol. 2018, 47, 359–366. [Google Scholar] [CrossRef]
- Peres, L.B.; Peres, L.B.; de Araújo, P.H.; Sayer, C. Solid Lipid Nanoparticles for Encapsulation of Hydrophilic Drugs by an Organic Solvent Free Double Emulsion Technique. Colloids Surf. B Biointerfaces 2016, 140, 317–323. [Google Scholar] [CrossRef] [PubMed]
- Sun, H.; Jiang, Y.; Zhang, Y.; Jiang, L. A Review of Constitutive Models for Non-Newtonian Fluids. Fract. Calc. Appl. Anal. 2024, 27, 1483–1526. [Google Scholar] [CrossRef]
- Katoueizadeh, E.; Rasouli, M.; Zebarjad, S.M. The Rheological Behavior of the Non-Newtonian Thixotropic Colloidal Silica Gels from Sodium Silicate. Mater. Chem. Phys. 2021, 272, 124994. [Google Scholar] [CrossRef]
- Ren, J.; Yang, X. Nanomotor-Hydrogel Delivery System with Enhanced Antibacterial Performance for Wound Treatment. Langmuir 2024, 40, 15741–15748. [Google Scholar] [CrossRef]
- Askarizadeh, M.; Esfandiari, N.; Honarvar, B.; Sajadian, S.A.; Azdarpour, A. Kinetic Modeling to Explain the Release of Medicine from Drug Delivery Systems. ChemBioEng Rev. 2023, 10, 1006–1049. [Google Scholar] [CrossRef]
- Lough, W.J. The distinctiveness of the British Pharmacopoeia and its relationship to other Pharmacopeia. In Specification of Drug Substances and Products; Elsevier: Amsterdam, The Netherlands, 2025; pp. 205–220. [Google Scholar]
- Vyas, A.J.; Jadav, C.D.; Patel, A.I.; Patel, A.B.; Shah, S.R.; Sheth, D.; Dholakia, S. Review on Stability Indicating Assay Method Or Forced Degradation Study: Strategy and Regulatory Consideration. Asian J. Pharm. Anal. 2023, 13, 131–139. [Google Scholar] [CrossRef]
- Lee, S.; Goo, B.L. High-Intensity Focused Ultrasound Enhances Drug Penetration into the Human Skin in the Franz Diffusion Cell. Clin. Cosmet. Investig. Dermatol. 2024, 17, 1711–1721. [Google Scholar] [CrossRef] [PubMed]
- Knoth, K.; Zäh, R.; Veldung, B.; Burgio, D.; Wiegand, B.; Smola, H.; Bock, U.; Lehr, C.; Hittinger, M.; Groß, H. Development and Evaluation of a Quality Control System Based on Transdermal Electrical Resistance for Skin Barrier Function in Vitro. Skin Res. Technol. 2021, 27, 668–675. [Google Scholar] [CrossRef]
- Krenczkowska, D.; Mojsiewicz-Pieńkowska, K.; Wielgomas, B.; Bazar, D.; Jankowski, Z. Ex Vivo Human Skin is Not a Barrier for Cyclic Siloxanes (Cyclic Silicones): Evidence of Diffusion, Bioaccumulation, and Risk of Dermal Absorption using a New Validated GC-FID Procedure. Pharmaceutics 2020, 12, 586. [Google Scholar] [CrossRef] [PubMed]
- Sølberg, J.; Jacobsen, S.B.; Andersen, J.D.; Litman, T.; Ulrich, N.H.; Ahlström, M.G.; Kampmann, M.; Morling, N.; Thyssen, J.P.; Johansen, J.D. The Stratum Corneum Transcriptome in Atopic Dermatitis can be Assessed by Tape Stripping. J. Dermatol. Sci. 2021, 101, 14–21. [Google Scholar] [CrossRef] [PubMed]
- Hogan, K.J.; Perez, M.R.; Öztatlı, H.; Si, S.; Wang, Z.; Jiang, E.Y.; Diba, M.; Garipcan, B.; Mikos, A.G. Development of 3D-Printing Composite Inks Based on Photoreactive Cartilage Extracellular Matrix and Gelatin Nanoparticles. Bioprinting 2023, 36, e00317. [Google Scholar] [CrossRef]
- Surassmo, S.; Saengkrit, N.; Ruktanonchai, U.R.; Suktham, K.; Woramongkolchai, N.; Wutikhun, T.; Puttipipatkhachorn, S. Surface Modification of PLGA Nanoparticles by Carbopol to Enhance Mucoadhesion and Cell Internalization. Colloids Surf. B Biointerfaces 2015, 130, 229–236. [Google Scholar] [CrossRef]
- Wang, Q.J. Encyclopedia of Tribology; Springer Science + Business Media: New York, NY, USA, 2013. [Google Scholar]
- Yazar, G.; Demirkesen, I. Linear and Non-Linear Rheological Properties of Gluten-Free Dough Systems Probed by Fundamental Methods. Food Eng. Rev. 2023, 15, 56–85. [Google Scholar] [CrossRef]
- Karavana, S.Y.; Rençbe, S.; Şenyiğit, Z.A.; Baloğlu, E. A New in-Situ Gel Formulation of Itraconazole for Vaginal Administration. Pharmacol. Pharm. 2012, 3, 417. [Google Scholar] [CrossRef]
- Gupta, S.; Kaur, I.P.; Prabha, V. Evaluation of Antifertility Effect of Gel Formulation Containing Sperm Immobilizing Factor: In Vitro and in Vivo Studies. Eur. J. Pharm. Sci. 2016, 81, 67–74. [Google Scholar] [CrossRef] [PubMed]
- Edsman, K.; Carlfors, J.; Petersson, R. Rheological Evaluation of Poloxamer as an in Situ Gel for Ophthalmic Use. Eur. J. Pharm. Sci. 1998, 6, 105–112. [Google Scholar] [CrossRef] [PubMed]
- Souto, E.B.; Wissing, S.A.; Barbosa, C.M.; Müller, R.H. Development of a Controlled Release Formulation Based on SLN and NLC for Topical Clotrimazole Delivery. Int. J. Pharm. 2004, 278, 71–77. [Google Scholar] [CrossRef] [PubMed]
- Agrawal, Y.; Petkar, K.C.; Sawant, K.K. Development, Evaluation and Clinical Studies of Acitretin Loaded Nanostructured Lipid Carriers for Topical Treatment of Psoriasis. Int. J. Pharm. 2010, 401, 93–102. [Google Scholar] [CrossRef] [PubMed]
- Costa, P.; Sousa Lobo, J.M. Modeling and Comparison of Dissolution Profiles. Eur. J. Pharm. Sci. 2001, 13, 123–133. [Google Scholar] [CrossRef]
- Korsmeyer, R.W.; Gurny, R.; Doelker, E.; Buri, P.; Peppas, N.A. Mechanisms of Solute Release from Porous Hydrophilic Polymers. Int. J. Pharm. 1983, 15, 25–35. [Google Scholar] [CrossRef]
- Ritger, P.L.; Peppas, N.A. A Simple Equation for Description of Solute Release I. Fickian and Non-Fickian Release from Non-Swellable Devices in the Form of Slabs, Spheres, Cylinders Or Discs. J. Control. Release 1987, 5, 23–36. [Google Scholar] [CrossRef]
- Sander, C.; Holm, P. Porous Magnesium Aluminometasilicate Tablets as Carrier of a Cyclosporine Self-Emulsifying Formulation. AAPS PharmSciTech 2009, 10, 1388–1395. [Google Scholar] [CrossRef]
- Schwartz, J.B.; Simonelli, A.P.; Higuchi, W.I. Drug Release from Wax Matrices. I. Analysis of Data with First-Order Kinetics and with the Diffusion-Controlled Model. J. Pharm. Sci. 1968, 57, 274–277. [Google Scholar] [CrossRef] [PubMed]
- Higuchi, T. Mechanism of Sustained-Action Medication. Theoretical Analysis of Rate of Release of Solid Drugs Dispersed in Solid Matrices. J. Pharm. Sci. 1963, 52, 1145–1149. [Google Scholar] [CrossRef] [PubMed]
- Xue, T.; Hartikainen, H.; Piironen, V. Antioxidative and Growth-Promoting Effect of Selenium on Senescing Lettuce. Plant Soil. 2001, 237, 55–61. [Google Scholar] [CrossRef]
- Starr, J.M.; Starr, R.J. Aging: Chapter 2—Skin Aging and Oxidative Stress; Preedy, V.R., Ed.; Academic Press: San Diego, CA, USA, 2014; pp. 15–22. [Google Scholar]
- Vile, G.F.; Tyrrell, R.M. Uva Radiation-Induced Oxidative Damage to Lipids and Proteins in Vitro and in Human Skin Fibroblasts is Dependent on Iron and Singlet Oxygen. Free Radic. Biol. Med. 1995, 18, 721–730. [Google Scholar] [CrossRef]
- Yue, Y.; Zhou, H.; Liu, G.; Li, Y.; Yan, Z.; Duan, M. The Advantages of a Novel CoQ10 Delivery System in Skin Photo-Protection. Int. J. Pharm. 2010, 392, 57–63. [Google Scholar] [CrossRef]
- Eroglu, S.; Pandir, D.; Uzun, F.G.; Bas, H. Protective Role of Vitamins C and E in Diclorvos-Induced Oxidative Stress in Human Erythrocytes in Vitro. Biol. Res. 2013, 46, 33–38. [Google Scholar] [CrossRef]
- Dugard, P.H.; Walker, M.; Mawdsley, S.J.; Scott, R.C. Absorption of some Glycol Ethers through Human Skin in Vitro. Environ. Health Perspect. 1984, 57, 193–197. [Google Scholar] [CrossRef]
- Nangia, A.; Patil, S.; Berner, B.; Boman, A.; Maibach, H. In Vitro Measurement of Transepidermal Water Loss: A Rapid Alternative to Tritiated Water Permeation for Assessing Skin Barrier Functions. Int. J. Pharm. 1998, 170, 33–40. [Google Scholar] [CrossRef]
- Heylings, J.R.; Clowes, H.M.; Hughes, L. Comparison of Tissue Sources for the Skin Integrity Function Test (SIFT). Toxicol. Vitr. 2001, 15, 597–600. [Google Scholar] [CrossRef] [PubMed]
- Spears, M.J.; McKillop, K.; Marshall, J.L.; Stone, K.J.; Lilly, N.A.; Warner, R.R.; Boissy, Y.L. Water Disrupts Stratum Corneum Lipid Lamellae: Damage is Similar to Surfactants1. J. Investig. Dermatol. 1999, 113, 960–966. [Google Scholar] [CrossRef] [PubMed]
- Chilcott, R.P.; Jenner, C.J. A Rapid Technique to Identify Structurally Non-Viable Epidermal Membranes during in Vitro Percutaneous Penetration Studies. Hum. Exp. Toxicol. 1996, Y 15, 161. [Google Scholar]
- Davies, D.J.; Ward, R.J.; Heylings, J.R. Multi-Species Assessment of Electrical Resistance as a Skin Integrity Marker for in Vitro Percutaneous Absorption Studies. Toxicol. Vitr. 2004, 18, 351–358. [Google Scholar] [CrossRef] [PubMed]
- Hasler-Nguyen, N.; Shelton, D.; Ponard, G.; Bader, M.; Schaffrik, M.; Mallefet, P. Evaluation of the in Vitro Skin Permeation of Antiviral Drugs from Penciclovir 1% Cream and Acyclovir 5% Cream used to Treat Herpes Simplex Virus Infection. BMC Dermatol. 2009, 9, 3. [Google Scholar] [CrossRef]
- Jui-Chen, T.; Weiner, N.D.; Flynn, G.L.; Ferry, J. Properties of Adhesive Tapes used for Stratum Corneum Stripping. Int. J. Pharm. 1991, 72, 227–231. [Google Scholar] [CrossRef]
- Pinkus, H. Examination of the Epidermis by the Strip Method of Removing Horny Layers. I. Observations on Thickness of the Horny Layer, and on Mitotic Activity After Stripping. J. Invest. Dermatol. 1951, 16, 383–386. [Google Scholar] [CrossRef]
- du Plessis, J.; Ramachandran, C.; Weiner, N.; Müller, D.G. The Influence of Particle Size of Liposomes on the Deposition of Drug into Skin. Int. J. Pharm. 1994, 103, 277–282. [Google Scholar] [CrossRef]
- Moser, K.; Kriwet, K.; Naik, A.; Kalia, Y.N.; Guy, R.H. Passive Skin Penetration Enhancement and its Quantification in Vitro. Eur. J. Pharm. Biopharm. 2001, 52, 103–112. [Google Scholar] [CrossRef] [PubMed]
- Rabiei, M.; Kashanian, S.; Samavati, S.S.; Jamasb, S.; McInnes, S.J. Nanomaterial and Advanced Technologies in Transdermal Drug Delivery. J. Drug Target. 2020, 28, 356–367. [Google Scholar] [CrossRef]
- Shankar, R.; Upadhyay, P.K.; Kumar, M. Invasomes for Enhanced Delivery through the Skin: Evaluation of Systems to Meet with Clinical Challenges. Pharm. Nanotechnol. 2021, 9, 317–325. [Google Scholar] [CrossRef]
- Umeyor, C.E.; Jadhav, S.A.; Hanjankar, S.N.; Nimkar, K.R.; Patravale, V. Pharmaceutical polymers in conventional dosage forms. In Polymers for Pharmaceutical and Biomedical Applications; Elsevier: Amsterdam, The Netherlands, 2024; pp. 153–198. [Google Scholar]
- Kreilgaard, M. Influence of Microemulsions on Cutaneous Drug Delivery. Adv. Drug Deliv. Rev. 2002, 54 (Suppl. 1), 77. [Google Scholar] [CrossRef]
- El Maghraby, G.M. Transdermal Delivery of Hydrocortisone from Eucalyptus Oil Microemulsion: Effects of Cosurfactants. Int. J. Pharm. 2008, 355, 285–292. [Google Scholar] [CrossRef] [PubMed]


| Items | Control Gel | 1% Carbopol | 3% Carbopol | 5% Carbopol |
|---|---|---|---|---|
| Gel strength (g) | 6.0 ± 0.5 | 2.4 ± 1.2 | 5.1 ± 0.5 | 4.3 ± 0.9 |
| Adhesion (g·s) | 6.2 ± 0.6 | 0.5 ± 1.2 | 2.5 ± 0.6 | 1.9 ± 1.0 |
| Stickiness (g) | 7.1 ± 0.8 | 0.6 ± 1.1 | 1.9 ± 0.5 | 1.9 ± 1.0 |
| Items | Control | 1% Carbopol | 3% Carbopol | 5% Carbopol |
|---|---|---|---|---|
| Spreadability (g·s) | 34.3 ± 2.2 | 10.1 ± 3.1 | 33.6 ± 1.9 | 52.2 ± 5.9 |
| Samples | Zero Order | First Order | Higuchi | Korsmeyer–Peppas | |||||
|---|---|---|---|---|---|---|---|---|---|
| R2 | k0 | R2 | k1 | R2 | kk | R2 | n | kh | |
| GSH-gel | 0.613 | 0.812 | 0.729 | 0.007 | 0.848 | 8.168 | 0.974 * | 0.29 | 1.407 |
| GSH-SLN | 0.755 | 0.689 | 0.908 * | 0.908 | 0.832 | 6.276 | 0.856 | 0.15 | 1.485 |
| EH | 0.844 | 0.901 | 0.908 | 0.006 | 0.971 * | 8.255 | 0.884 | 0.97 | 0.320 |
| EH and GSH | 0.811 | 0.987 | 0.878 | 0.007 | 0.964 | 9.151 | 0.965 * | 0.54 | 0.926 |
| Formulations | Cumulative amount of GSH at 24 h (µg/cm2) | Cumulative Amount of GSH at 48 h (µg/cm2) |
|---|---|---|
| GSH solution | 1.1 ± 0.2 | 1.6 ± 0.4 |
| GSH hydrogels | 1.7 ± 0.6 | 1.8 ± 0.2 |
| GSH-SLNs | 20.9 ± 1.2 | 20.7 ± 1.6 |
| GSH-SLN-EH | 12.6 ± 2.4 | 13.9 ± 1.0 |
| EH and GSH | 13.5 ± 1.3 | 15.4 ± 2.1 |
| Formulations | SC Deposition of GSH After 48 h (µg/cm2) | Epi/Dermis Deposition of GSH After 48 h (µg/cm2) |
|---|---|---|
| GSH solution | 105.3 ± 5.0 | 9.5 ± 1.2 |
| GSH gel | 107.2 ± 4.2 | 8.07 ± 2.3 |
| GSH-SLNs | 19.4 ± 1.9 | 35.3 ± 3.3 |
| GSH-SLN-EH | 15.0 ± 1.8 | 35.4 ± 2.0 |
| EH and GSH | 69.1 ± 1.7 | 38.5 ± 1.6 |
Disclaimer/Publisher’s Note: The statements, opinions and data contained in all publications are solely those of the individual author(s) and contributor(s) and not of MDPI and/or the editor(s). MDPI and/or the editor(s) disclaim responsibility for any injury to people or property resulting from any ideas, methods, instructions or products referred to in the content. |
© 2024 by the authors. Licensee MDPI, Basel, Switzerland. This article is an open access article distributed under the terms and conditions of the Creative Commons Attribution (CC BY) license (https://creativecommons.org/licenses/by/4.0/).
Share and Cite
Liu, M.; Sharma, M.; Lu, G.; Zhang, Z.; Song, W.; Wen, J. Innovative Solid Lipid Nanoparticle-Enriched Hydrogels for Enhanced Topical Delivery of L-Glutathione: A Novel Approach to Anti-Ageing. Pharmaceutics 2025, 17, 4. https://doi.org/10.3390/pharmaceutics17010004
Liu M, Sharma M, Lu G, Zhang Z, Song W, Wen J. Innovative Solid Lipid Nanoparticle-Enriched Hydrogels for Enhanced Topical Delivery of L-Glutathione: A Novel Approach to Anti-Ageing. Pharmaceutics. 2025; 17(1):4. https://doi.org/10.3390/pharmaceutics17010004
Chicago/Turabian StyleLiu, Mengyang, Manisha Sharma, Guoliang Lu, Zhiwen Zhang, Wenting Song, and Jingyuan Wen. 2025. "Innovative Solid Lipid Nanoparticle-Enriched Hydrogels for Enhanced Topical Delivery of L-Glutathione: A Novel Approach to Anti-Ageing" Pharmaceutics 17, no. 1: 4. https://doi.org/10.3390/pharmaceutics17010004
APA StyleLiu, M., Sharma, M., Lu, G., Zhang, Z., Song, W., & Wen, J. (2025). Innovative Solid Lipid Nanoparticle-Enriched Hydrogels for Enhanced Topical Delivery of L-Glutathione: A Novel Approach to Anti-Ageing. Pharmaceutics, 17(1), 4. https://doi.org/10.3390/pharmaceutics17010004