3.1. Results of Solubilisation by Surfactants
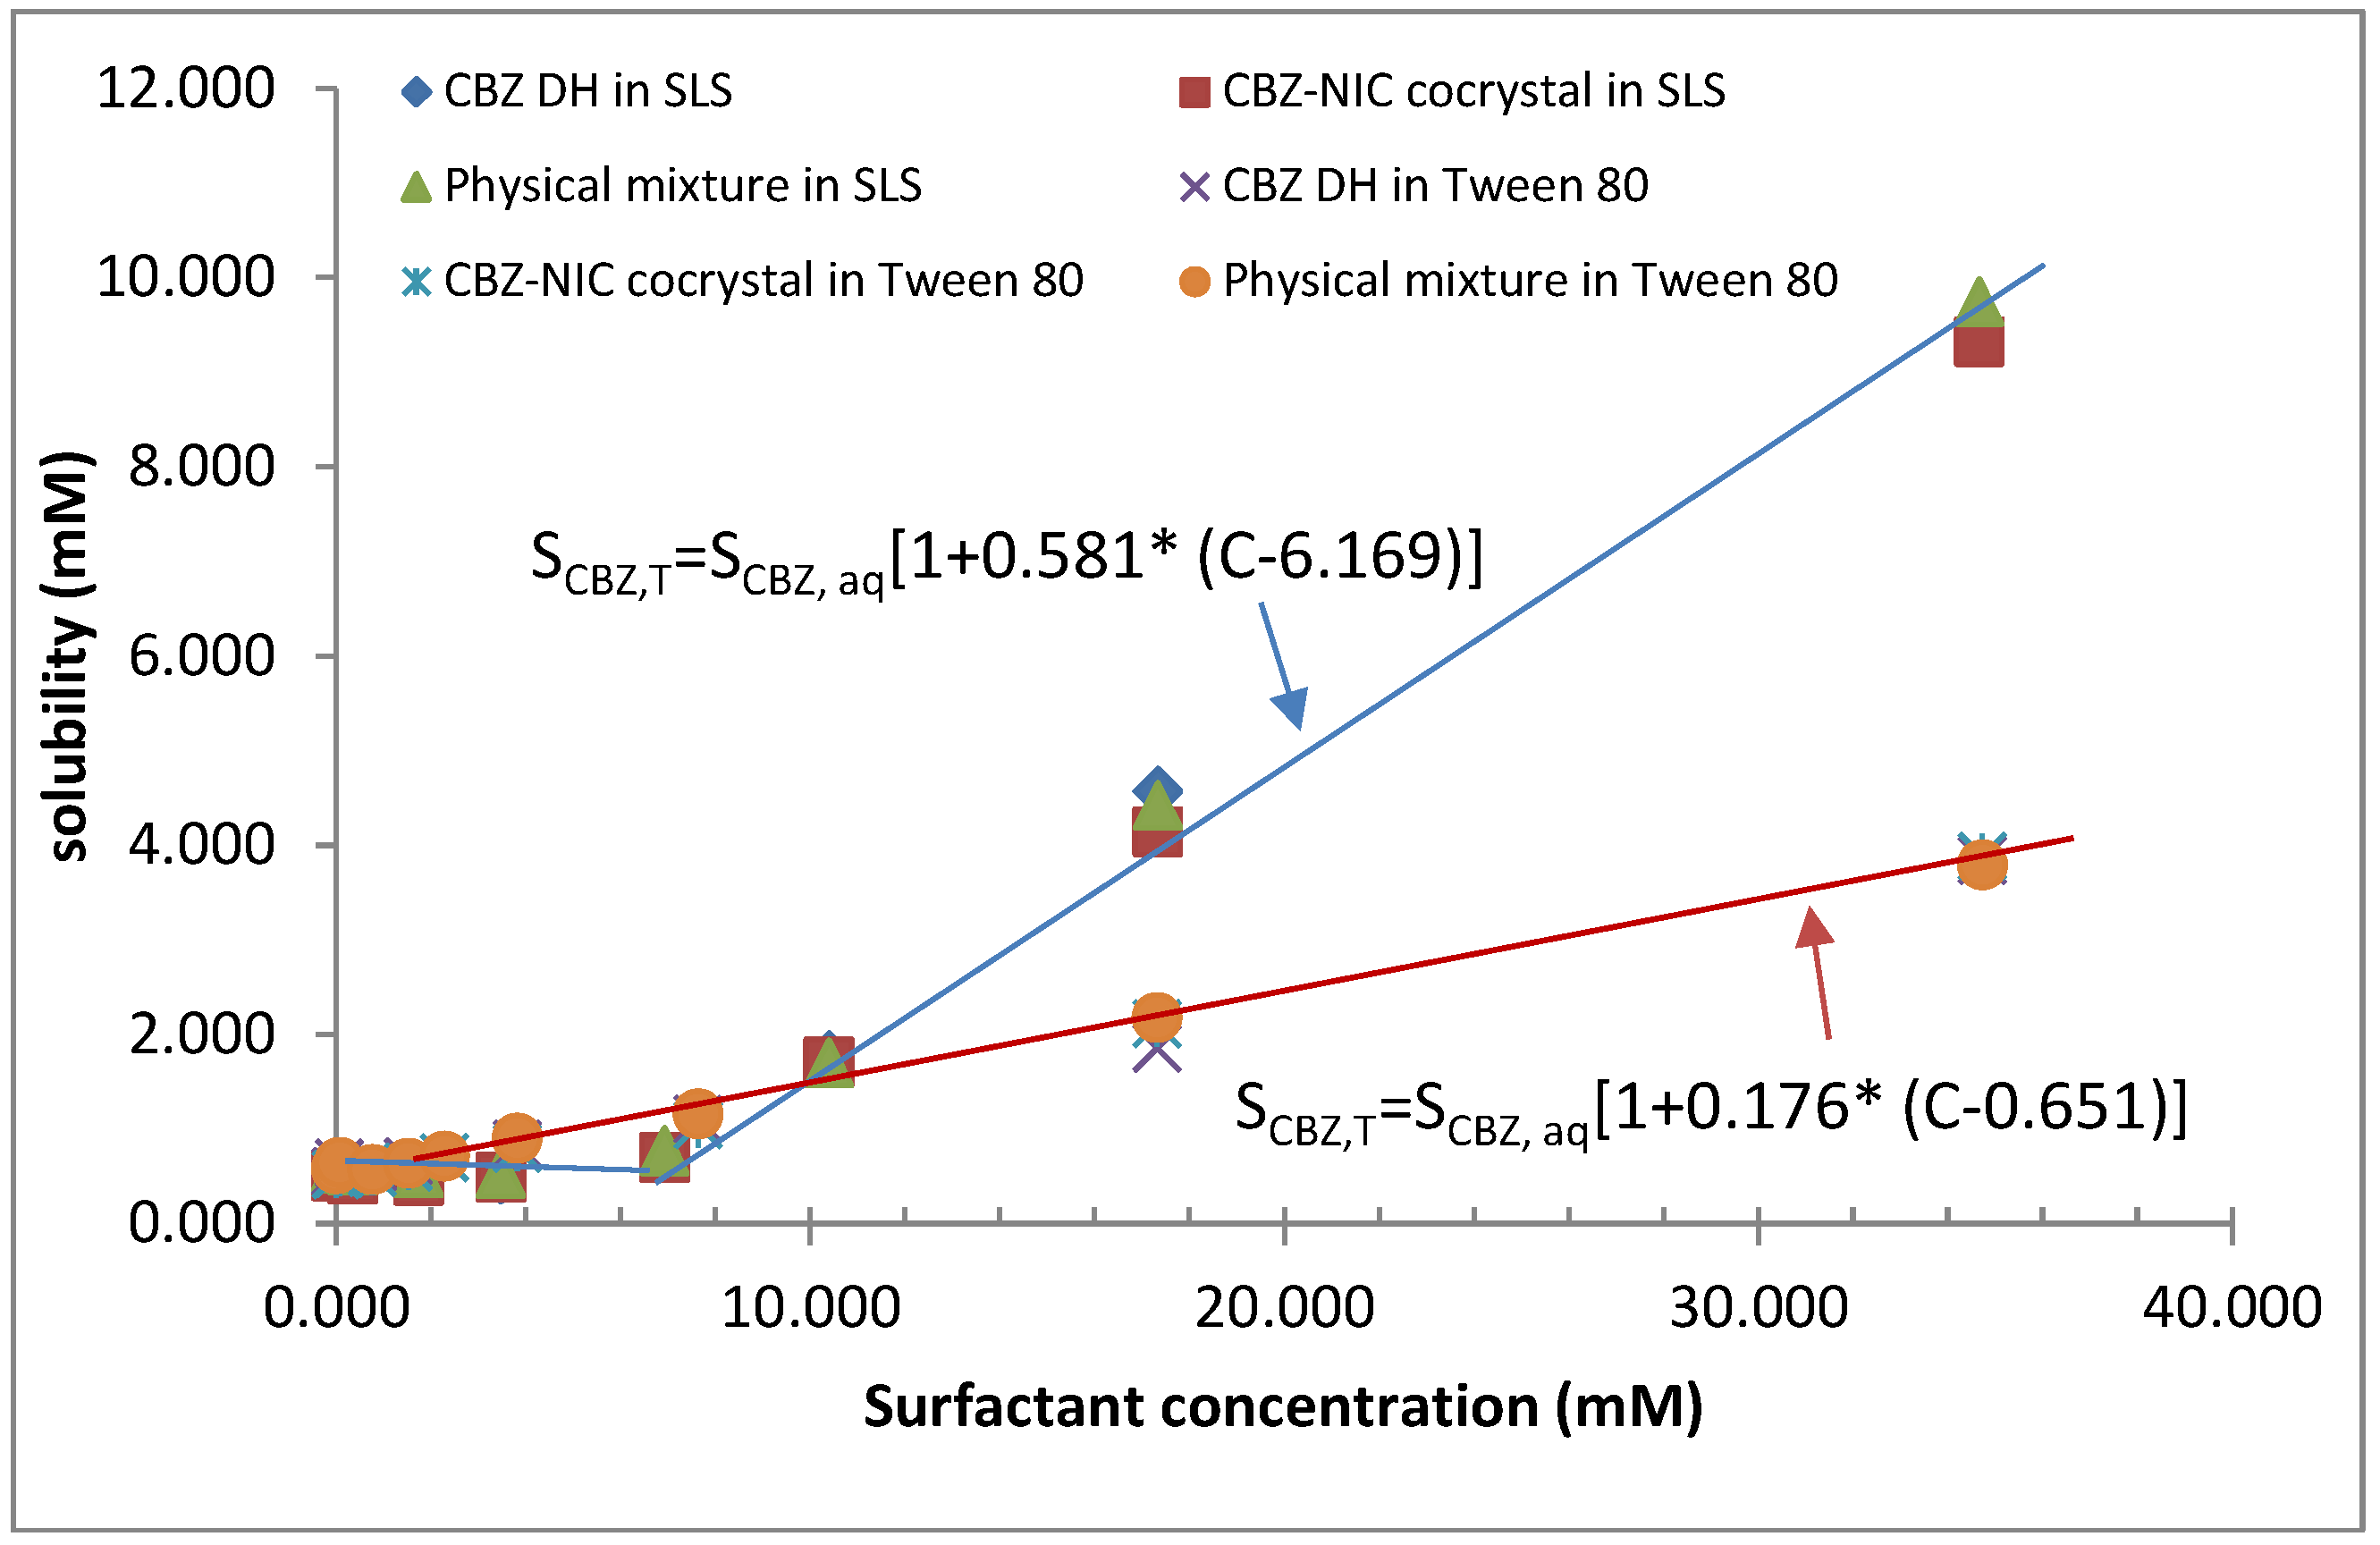
The apparent solubility of CBZ of CBZ DH (CBZ III), the CBZ–NIC cocrystal and the physical mixture of CBZ III and NIC in water, and at different concentrations of SLS and Tween 80 after 72 h are shown in
Figure 2 and details of data are in
Table S1 in Supplementary material. Generally, there was no significant difference in the apparent solubility of CBZ between the parent drug, CBZ, the cocrystal and the physical mixture. FTIR, Raman and DSC data (not shown) of the solid residue indicated that the CBZ–NIC cocrystal had totally converted to CBZ DH; therefore, the same apparent solubility of CBZ of the cocrystal and CBZ DH was found.
Figure 2.
Apparent solubility of CBZ as a function of surfactant concentration.
Figure 2.
Apparent solubility of CBZ as a function of surfactant concentration.
Based on the measured solubility data of CBZ, the molar solubilisation capacities and CMCs of SLS and Tween 80 can be estimated, as summarised in
Table 1. It is shown that the estimated CMCs of SLS and Tween 80 are in good agreement with those measured by the surface tension technique. The change of surface tension at different surfactant concentrations of aqueous solutions in the presence of saturated CBZ is shown in
Figure S1 in Supplementary material. Tween 80 has a higher solubilisation capacity at a low concentration due to its lower CMC. However, the anionic surfactant SLS showed a dramatic solubilizing ability with CBZ when its concentration was higher than its CMC. When the concentration of SLS is higher than a critical value of 8.567 mM, SLS has a higher solubilisation capacity for CBZ than Tween 80, which can be seen from the solubility data of CBZ in
Figure 2.
Table 1.
Estimated molar solubilisation capacity and CMC.
Table 1.
Estimated molar solubilisation capacity and CMC.
| Surfactant | Solubilisation capacity (mM−1) | CMC estimated (mM) | CMC measured (mM) |
|---|
| SLS | 0.581 | 6.196 | 5.5 |
| Tween 80 | 0.176 | 0.651 | 0.012–1.05 |
Figure 3.
Apparent CBZ solubility profile as a function of NIC concentration after 72 h.
Figure 3.
Apparent CBZ solubility profile as a function of NIC concentration after 72 h.
The apparent solubility of CBZ was measured as a function of the coformer NIC concentration in order to determine CBZ–NIC cocrystal eutectic point (shown in
Figure 3), in which four regions can be identified:
Region I: from 0 to 1000 mM initial NIC concentrations, the apparent solubility of CBZ increases rapidly with increasing concentration of NIC, indicating the 1:1 complex formation of CBZ and NIC. The apparent solubility of CBZ can increase up to 10 times in comparison to apparent CBZ solubility in water. In this region, the solubility limit of the complex formed is not exceeded and the solid residue should be CBZ DH only, which was confirmed by DSC, FTIR and Raman analyses (
Figures S2–S4 in the Supplementary material). In this region, the measured concentration of NIC was the same as that of the initial NIC.
Region II: from 1000 to 2400 mM initial NIC concentrations, the apparent solubility of CBZ increases at a higher rate. When the apparent solubility limit of CBZ of the 1:1 complex formed was exceeded in this region, the CBZ–NIC cocrystal precipitated. In the meantime, higher order complexes of CBZ and NIC were generated, resulting in a further 18-fold increase in the apparent CBZ solubility in water. The solid residue indicated the presence of two phases of CBZ–NIC cocrystal and CBZ DH confirmed by DSC, FTIR and Raman analyses (
Figures S2–S4 in the Supplementary material). According to the definition, any point in the region II should be a eutectic point of CBZ–NIC cocrystal. In this study, we set the highest total CBZ concentration point as its eutectic point shown in
Figure 3 as [
CBZ]
eu = 15.1 mM and [
NIC]
eu = 1956.8 mM.
Region III: from 2400 to 3000 mM initial NIC concentrations, the concentration of CBZ decreases with increasing NIC concentration in solution. In this region, all of the solid CBZ DH was consumed to form the complex to generate the supersaturated solution of the complex, resulting in precipitation of large amount of CBZ–NIC cocrystal and reduction of CBZ concentration in solution. For this reason, the overall CBZ concentration decreased in the solution shown in
Figure 3. It has been shown that the CBZ–NIC cocrystal and NIC are coexisting in the solid residues, shown in DSC, FTIR and Raman analyses (
Figures S2–S4 in the Supplementary material).
Region IV: Above 3000 mM initial NIC concentration, the concentrations of CBZ and NIC in the solution are constant. The solid residues indicated the presence of two phases of CBZ–NIC cocrystal and NIC, confirmed by DSC, FTIR and Raman analyses (
Figures S2–S4 in the Supplementary material).
Table 2 shows the total concentrations of CBZ and NIC at the eutectic points of different concentrations of SLS and Tween 80. Compared with the eutectic point in water, the apparent solubility of CBZ increased slightly with an increase in SLS concentration while the concentration of INC was constant with SLS concentration (which was slightly smaller than that in pure water). According to the solubility definition of a 1:1 cocyrstal in Equation 1, the solubility of the CBZ–NIC cocrystal at different concentrations of SLS is shown in
Table 2. The solubility of the CBZ–NIC cocrystal was nearly constant and same as that in water when the SLS concentration was below its CMC and it increased slightly when the SLS concentration was above its CMC.
Table 2.
CBZ–NIC cocrystal eutectic point, cocrystal solubility and solubility ratio.
Table 2.
CBZ–NIC cocrystal eutectic point, cocrystal solubility and solubility ratio.
| Solvent concentration (mM) | [CBZ]eu (mM) | [NIC]eu (mM) | Cocrystal solubility Scc (mM) | Solubility ratio Scc/SCBZ,aq |
|---|
| Water | 15.10 ± 1.32 | 1,956.8 ± 126.8 | 171.9 | 319 |
| SLS | 0.35 | 15.9 ± 1.8 | 1,665.2 ± 62.6 | 162.8 | 302 |
| 1.7 | 16.3 ± 0.76 | 1,807.9 ± 90.3 | 171.5 | 319 |
| 3.5 | 17.6 ± 0.63 | 1,818.9 ± 57.0 | 178.7 | 332 |
| 6.7 | 17.5 ± 0.65 | 1,914.0 ± 136.3 | 183.2 | 340 |
| 10.4 | 17.7 ± 0.42 | 1,811.1 ± 65.7 | 179.2 | 333 |
| 17.3 | 18.1 ± 0.70 | 1,934.6 ± 51.8 | 187.3 | 348 |
| 34.7 | 16.1 ± 2.77 | 1,839.5 ± 255.9 | 171.8 | 319 |
| Tween 80 | 0.076 | 15.5 ± 0.68 | 1,847.3 ± 15.6 | 169.5 | 315 |
| 0.76 | 15.9 ± 0.37 | 1,852.3 ± 56.9 | 171.7 | 319 |
| 1.5 | 16.0 ± 0.70 | 2,024.3 ± 50.9 | 180.2 | 335 |
| 2.3 | 17.4 ± 1.65 | 1,853.3 ± 109.9 | 179.5 | 334 |
| 3.8 | 16.75 ± 2.78 | 1,624.5 ± 69.1 | 164.9 | 306 |
| 7.6 | 14.98 ± 0.45 | 1,691.1 ± 87.4 | 159.2 | 296 |
| 17.3 | 15.33 ± 0.89 | 1,638.9 ± 79.8 | 158.5 | 294 |
Compared with the eutectic point in water, the apparent solubility of CBZ was almost constant with an increase in Tween 80 concentration, while the concentration of NIC decreased at higher concentration of Tween 80 solutions. The solubility of the CBZ–NIC cocrystal was nearly same as that in water at a lower concentration of Tween 80 solution and then decreased slightly when the Tween 80 concentration increased (see
Table 2).
3.2. Results of Intrinsic Dissolution Rate
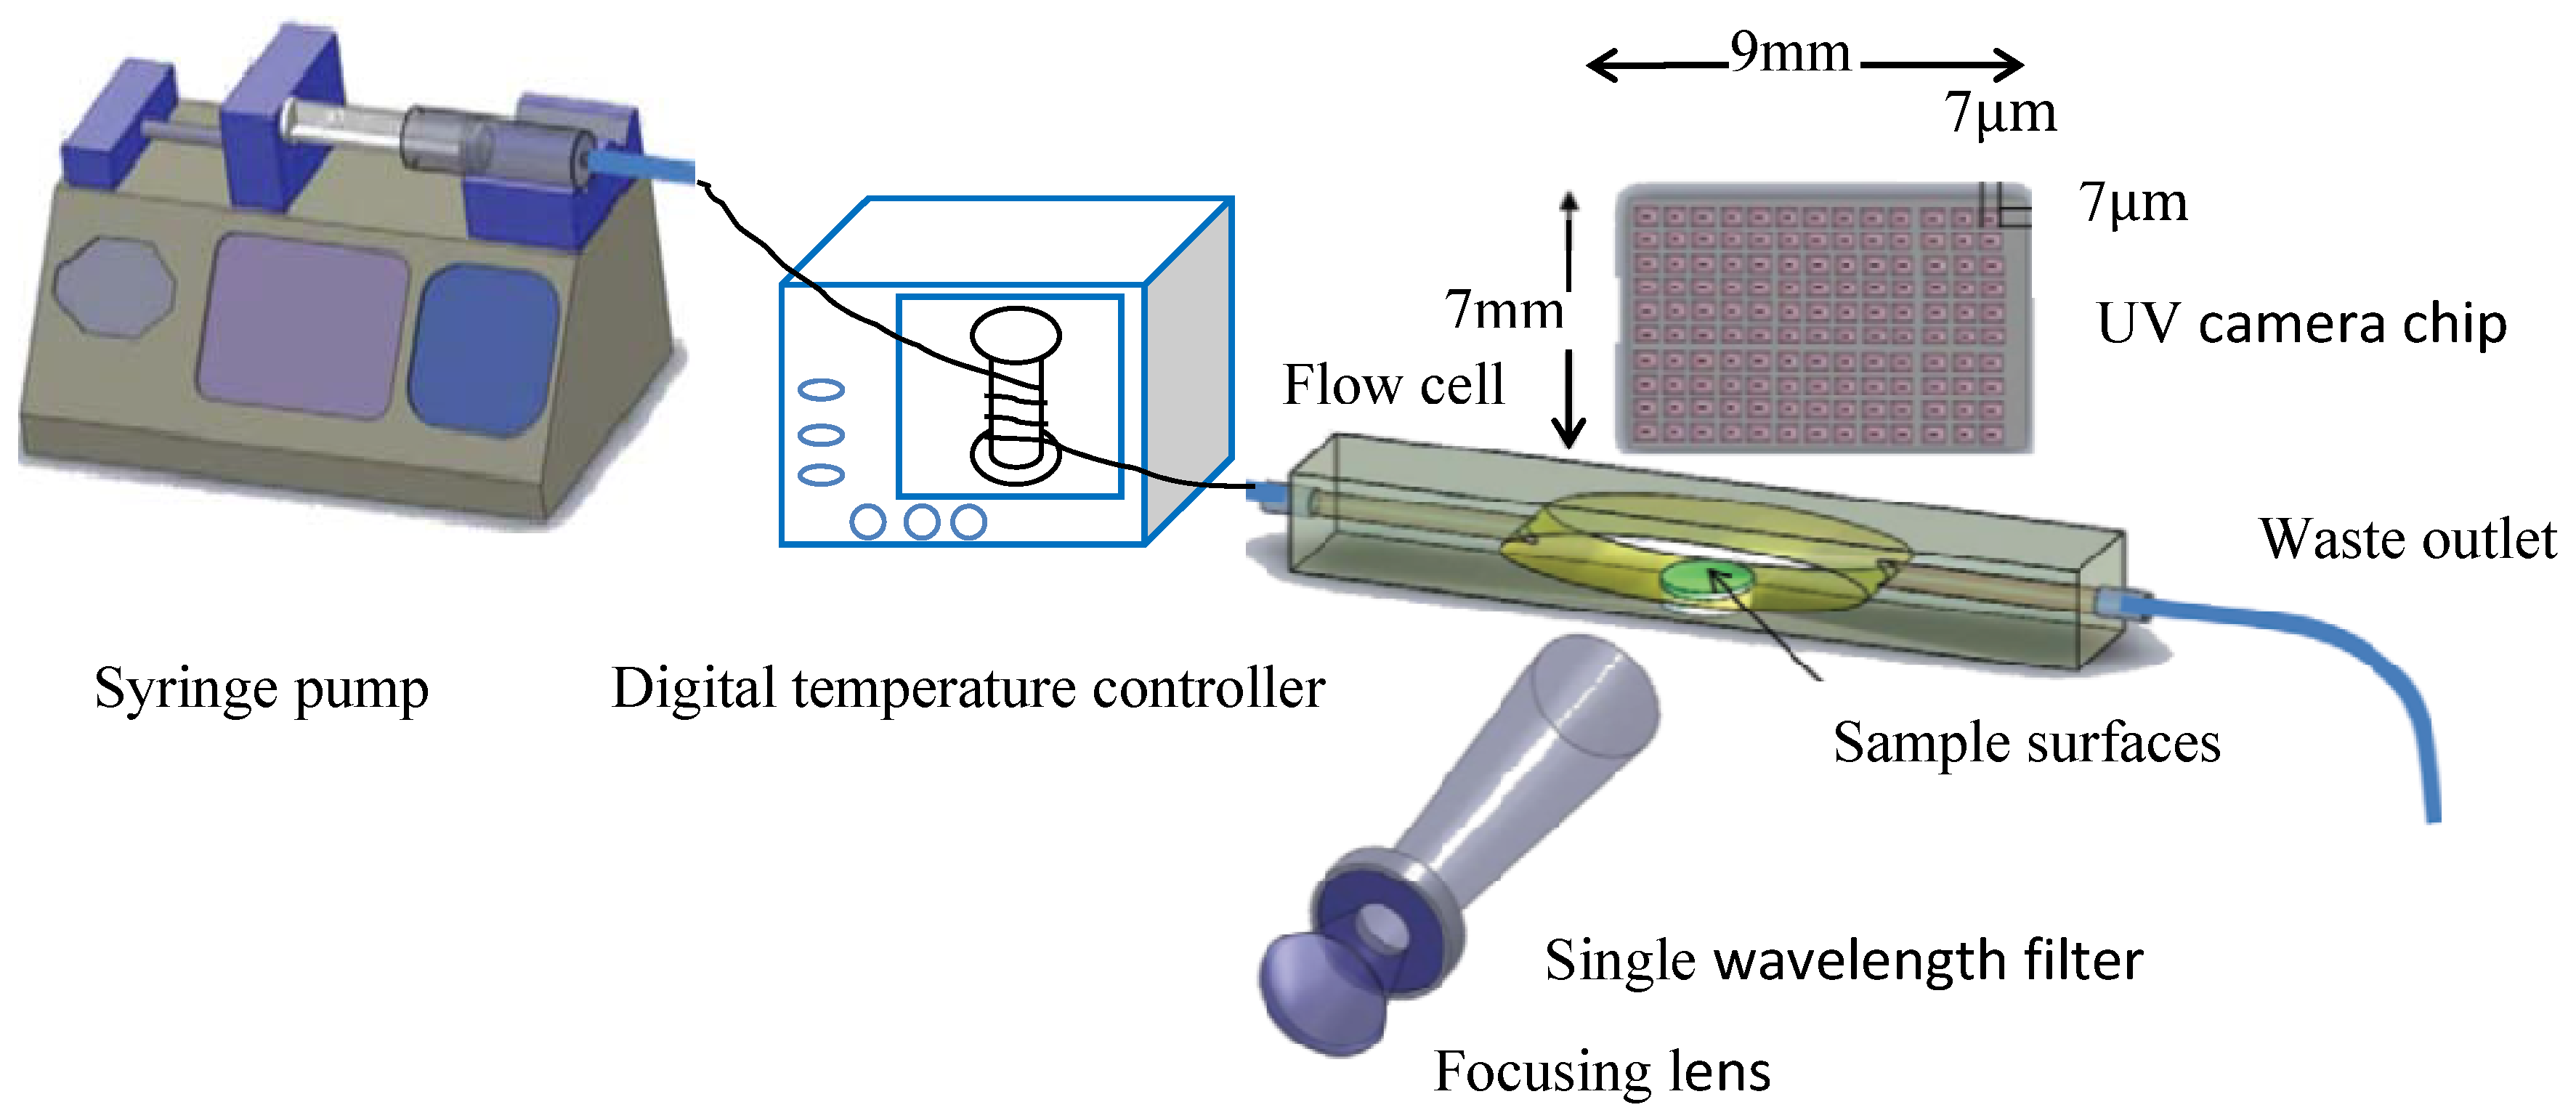
The IDR profiles from the compacts of the pure CBZ III, the CBZ–NIC cocrystal, and the physical mixtures of CBZ III and NIC at different dissolution media are shown in
Figure 4. A video clip of CBZ–NIC cocrystal dissolution at 10.4 mM SLS solution can be found in the
Supplementary material. All IDR profiles show the same trend: (1) within the first 2 min the IDR of a test sample reached its maximum value and then decreased quickly within 10 min; (2) after 20 min of dissolution, all IDRs of the test samples reached static values. The IDR of each sample during dissolution in each dissolution medium was decreasing, indicated by the growth of solid material on the surface of the sample compact that can be visualised by light microscopy (see
Table 3). Prior to the dissolution tests, all of the compact surfaces were smooth. After the dissolution tests, the microscope images show that small needle-shaped crystals have appeared on the compact surfaces, indicating that the solid-state changes due to crystallisation of CBZ DH from the supersaturated solutions on the compact surfaces.
Figure 4.
Dissolution profiles of test samples at different dissolution media. (a) CBZ–NIC cocrystal; (b) CBZ III; (c) equimolar physical mixture of CBZ III and NIC.
Figure 4.
Dissolution profiles of test samples at different dissolution media. (a) CBZ–NIC cocrystal; (b) CBZ III; (c) equimolar physical mixture of CBZ III and NIC.
The IDRs of the CBZ–NIC cocrystal are shown in
Figure 4a. It was found that the IDR profile of CBZ in the 0.35 mM SLS dissolution medium was almost identical to that in water. In the 0.076 mM Tween 80 dissolution medium, its dissolution profile was slightly lower than in pure water. In the 10.4 mM SLS dissolution medium, the IDR profile of the CBZ–NIC cocrystal increased significantly in comparison with that in water, indicating that SLS can increase the cocrystal dissolution rate when its concentration was higher than its CMC. To our surprise, in the 7.6 mM Tween 80 dissolution medium, the CBZ dissolution profile was much lower than that in water.
Raman spectroscopy was used before and after UV imaging to characterise the solid state (see
Figure S5 in the Supplementary materials), and showed some significant changes before and after the dissolution tests, which are in good agreement with previous findings [
8]. In order to quantify the solid-state change during dissolution, a calibration model was built to quantify the percentage of CBZ DH on the surface of a sample compact after dissolution [
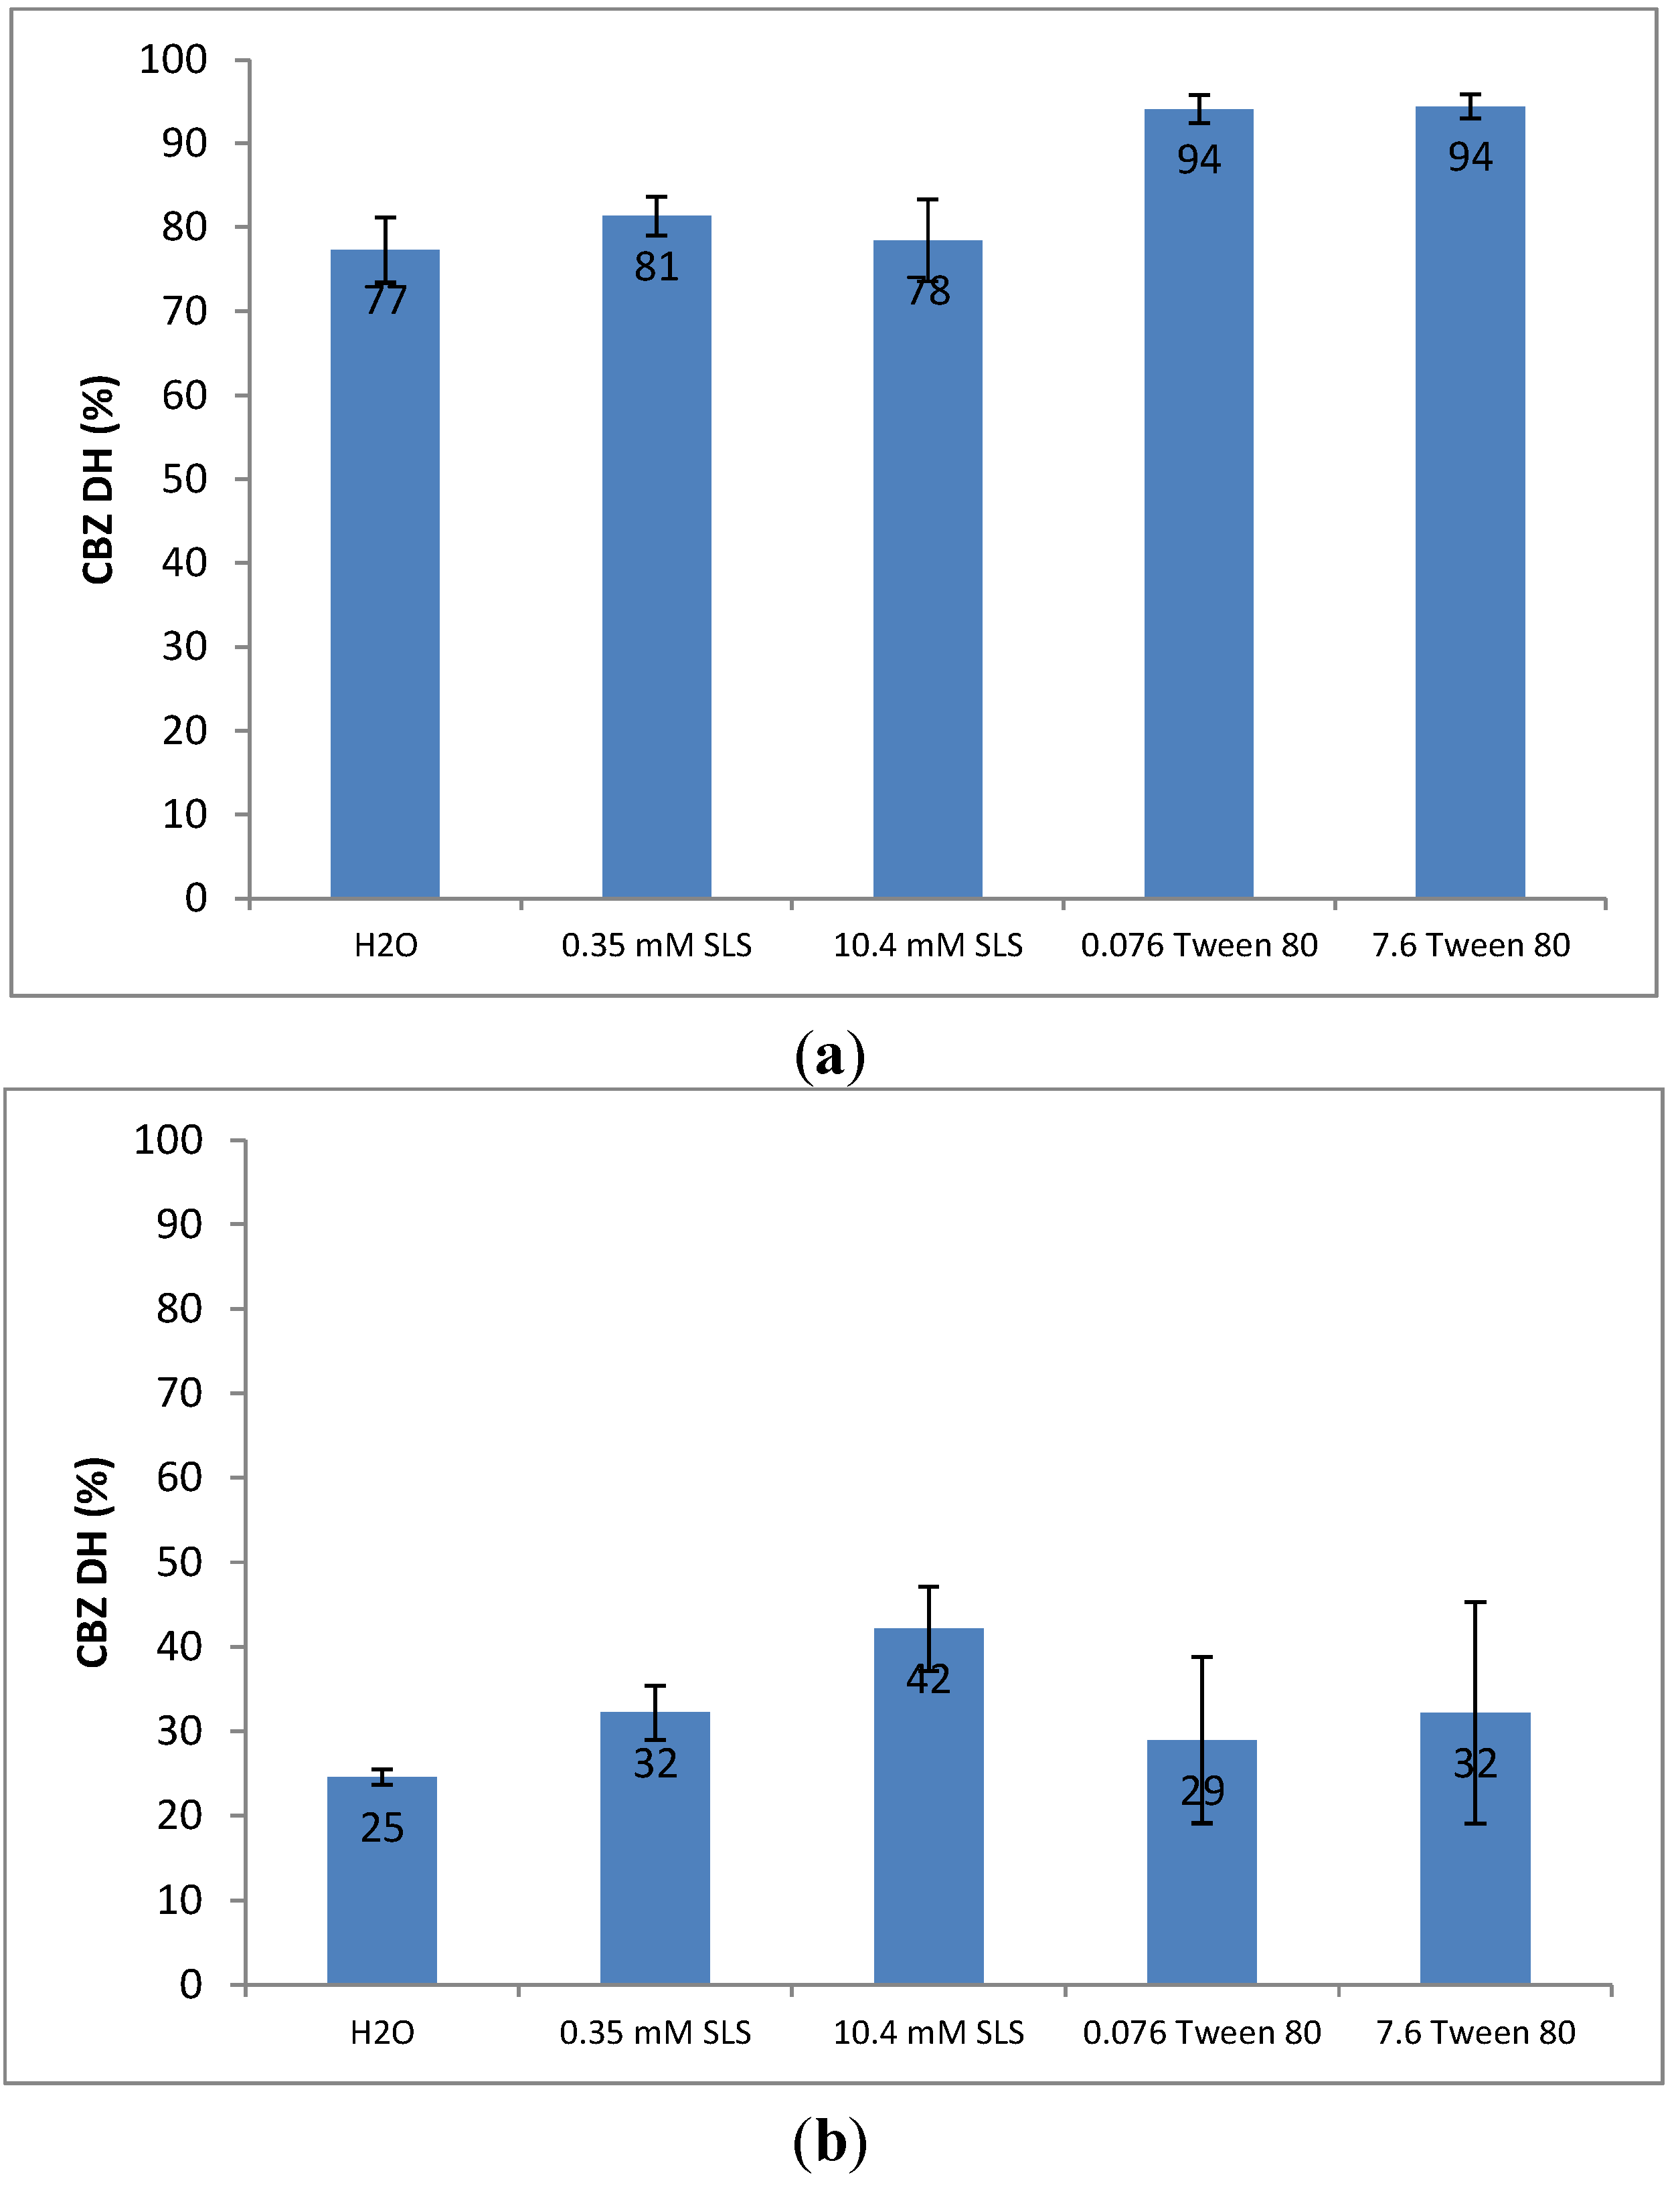
8]. The percentage of CBZ DH covering on the surface of sample compact for each dissolution test is shown in
Figure 5a. Interestingly the percentages of CBZ DH crystals on the surfaces of the CBZ–NIC cocrystal compacts in the 0.35 mM SLS and 10.4 mM SLS dissolution media are nearly constant (
i.e., 81% in 0.35 mM SLS solution and 78% in 10.4 mM SLS dissolution solution), which nearly equal to that (
i.e., 77%) of the CBZ–NIC cocrystal in water. By contrast, the percentages of CBZ DH covering the surfaces of the CBZ–NIC cocrystal compacts in both 0.076 mM Tween 80 and 7.6 mM Tween 80 (
i.e., 94% in both Tween 80 solutions) are much higher than that of CBZ–NIC cocrystal in water.
CBZ III is an anhydrous form of CBZ and has similar dissolution behaviour to that of the CBZ–NIC cocrystal in different surfactant solutions. If a surfactant concentration was less than its CMC, the IDR profile of CBZ III in the 0.35 mM SLS dissolution or 0.076 mM Tween 80 was similar to that in water, as shown in
Figure 4b. When compared with the dissolution behaviour of CBZ III in water, the IDR profile of the CBZ III increased significantly in the 10.4 mM SLS dissolution medium and decreased in the 7.6 mM Tween 80 dissolution medium. The percentage of CBZ DH covering on the surface of sample compact for each dissolution test based on Raman spectra is shown in
Figure 5b. The percentages of CBZ DH crystals on the surfaces of CBZ III compacts increased significantly with SLS concentration in comparison with that in pure water. A similar trend was found in a Tween 80 dissolution medium: the percentages of CBZ DH covering the surfaces of CBZ III compacts in both 0.076 mM Tween 80 and 7.6 mM Tween 80 dissolution media increased, but to a lesser extent than those in the SLS dissolution media.
Evolution of the IDRs of the equal molar physical mixture of CBZ III and NIC at different dissolution media is shown in
Figure 4c. The biggest variability of the IDRs of the physical mixture is shown, which is consistent with that of dissolving polyphase mixtures in which the more soluble component dissolves more rapidly from the surface of the compact, leaving behind a porous layer of the less soluble component [
28,
29]. Light microscopy showed that holes appeared on the compact surface due to dissolved NIC (see
Table 3), resulting in a significant change of the dissolution rate. Similar trends of effects of the dissolution media on the IDR of physical mixture was found with the 10.4 mM SLS dissolution medium, the IDR profile increased significantly compared with that of pure water in
Figure 4c.
Table 3.
Light microscopy photographs of the sample compacts before and after dissolution tests in 10.4 mM SLS and 7.7 mM Tween 80 dissolution media.
Figure 5.
Comparison of percentages of CBZ DH on the surfaces of sample compacts after dissolution test. (a) CBZ–NIC cocrystal; (b) CBZ III.
Figure 5.
Comparison of percentages of CBZ DH on the surfaces of sample compacts after dissolution test. (a) CBZ–NIC cocrystal; (b) CBZ III.
3.3. Discussion of Solubility Enhancement by Surfactants
From the study, it has been shown that the CBZ–NIC cocyrstal has the same apparent solubility of CBZ as that of CBZ DH (CBZ III) because of the dissociation of the individual components of CBZ–NIC cocrystal, which in turn is due to the weak hydrogen bonds in the molecular assembly of the two components of CBZ and NIC. There was no significant effect of the cocrystal coformer NIC on the apparent solubility of CBZ because of a low concentration of NIC in the solution. Based on the apparent CBZ solubility profile as a function of NIC concentration, it has been shown in
Figure 3 that at a low NIC concentration (up to 40 mM) the apparent solubility of CBZ was constant.
The phase solubility diagram of CBZ in the presence of NIC has shown that the apparent CBZ solubility has been enhanced significantly and in a nonlinear fashion as a function of NIC concentration (
Figure 3). The experimental observations can be explained by the stacking complexation mechanism of NIC with CBZ [
30], in which linear increases in the apparent solubility of CBZ may be attributed to the formation of 1:1 complexes in
Region I and nonlinear increases in
Region II, indicating that higher order complexes were formed due to self-association of NIC. Due to the strong interaction of CBZ and NIC in the solution, the eutectic point of the CBZ–NIC cocrystal was not a single point, but covered the whole range of
Region II from 1000 mM to 2400 mM of NIC concentrations. In this study, the highest total measured CBZ concentration was selected as the eutectic point of the CBZ–NIC cocrystal (
Figure 3), showing that the solubility ratio of
Scc/
SCBZ,aq was 319. If the lowest total measured CBZ concentration in the
Region II was selected as the eutectic point of the CBZ–NIC cocrystal, the solubility ratio of
Scc/
SCBZ,aq was 130. The reported value of the solubility ratio of
Scc/
SCBZ,aq was 152, which was in the
Region II of the phase solubility diagrams [
25].
SLS and Tween 80 have little effects on enhancing the solubility of the CBZ–NIC cocrystal in
Table 2, in which the solubility of the CBZ–NIC cocrystal increased slightly with SLS concentration and decreased with Tween 80 concentration; however, significant solubility enhancement for CBZ DH by SLS was observed above its CMC.
3.4. Discussion of Effects of Surfactants on SMPT of CBZ III and CBZ–NIC Cocrystal
Comparing the IDRs of CBZ III, the CBZ–NIC cocrystal and the physical mixture of CBZ III and NIC in the same dissolution medium, it has been shown that CBZ–NIC cocrystal has the highest IDR in
Figure 4, indicting the advantages of the CBZ–NIC cocrystal in enhancing the dissolution rate [
8].
From this study, it has also shown that the SMPT of CBZ III and the CBZ–NIC cocrystal can be altered by the inclusion of a surfactant in the dissolution medium. However, CBZ III and the CBZ–NIC cocrystal have shown different transformation behaviour affected by different surfactants.
It is well known that surfactants can enhance dissolution of poorly water-soluble drugs in two ways,
i.e., either by lowering the surface tension at the solid drug surface to increase the surface area available for dissolution or by increasing drug solubility [
31]. The ability of surfactants of SLS and Tween 80 to manipulate the SMPT of CBZ–NIC cocrystals and CBZ III affects the nucleation and/or growth of the new crystalline phase of CBZ DH.
Dissolution experiments with CBZ III have shown the increased percentages of CBZ DH precipitated on the surfaces of the sample compacts with increasing surfactant concentrations of SLS and Tween 80 (see
Figure 5b), indicating that both SLS and Tween 80 facilitated the surface-mediated nucleation of CBZ DH on the dissolving CBZ III. These results are in line with classic nucleation theory which predicts that crystal nucleation increases with decreasing interfacial tension by the inclusion of surfactants in the dissolution medium [
32]. Comparing the two surfactants, the anionic surfactant SLS has shown a more significant effect on nucleation of CBZ DH during dissolution of CBZ III than Tween 80, indicated by the higher percentages of CBZ DH covering on the surface of the dissolution compact.
Dissolution experiments of the CBZ–NIC cocrystal with and without SLS show the same percentage of CBZ DH precipitated on the surface of each sample compact (
Figure 5a), indicating that SLS does not facilitate the surface-mediated nucleation of CBZ DH on the dissolving CBZ–NIC cocrystal. The rate of CBZ DH nucleation for the CBZ–NIC cocrystal dissolution was influenced mainly by the coformer NIC, rather than as a consequence of decreasing the interfacial tension by SLS. Dissolution experiments of the CBZ–NIC cocrystal with 0.076 and 7.6 mM concentrations of Tween 80 have shown that significant higher of CBZ DH was precipitated as a covering on the sample compact surfaces, (94% compared with 77% of CBZ DH crystallised on the surface in pure water), indicating that the rate of CBZ DH nucleation during CBZ–NIC cocrystal dissolution was affected by both the coformer NIC and by Tween 80.
Dissolution rate is the net result of solubilisation rates of the original solid phase and the formation rates of a less soluble solid phase. SLS has a flexible alkyl chain that exhibits axial polarity (hydrophilic head group and hydrophobic tail) and a well-defined CMC. The transformation process of the CBZ–NIC cocrystal and CBZ III to CBZ DH is sensitive to the SLS concentration in a dissolution medium. The solubility of CBZ for solid of CBZ III has not increased in 0.35 mM SLS dissolution medium below its CMC. Due to increasing in rate of CBZ DH nucleation, the IDR profile of CBZ III in the 0.35 mM SLS dissolution medium was lower than its corresponding profile in water (
Figure 4b). Because SLS does not influence CBZ DH nucleation for the dissolving CBZ–NIC cocrystal, the IDR profile of the CBZ–NIC cocrystal in the 0.35 mM SLS dissolution medium was almost same as its corresponding profile in water (
Figure 4a). The solubility of CBZ for solids of CBZ III and the CBZ–NIC cocrystal have increased significantly when the concentration of SLS is higher than its CMC due to the inclusion of CBZ molecules into the surfactant micelles, resulting in a lack of growth material of CBZ in the solution which retards crystallization and inhibits growth of the stable crystal form CBZ DH on the compact surface. The IDR of CBZ III in the 10.4 mM SLS solution was increased 1.3 times relative to that in pure water whilst the IDR of the CBZ–NIC cocrystal in the same solution was increased to 1.6 times of its corresponding value in pure water.
Tween 80 is a non-ionic surfactant and has a wide range of CMC values because of progressive association and heterogeneous distribution of aggregates. Although Tween 80 can increase the solubility of CBZ in solution, its solubilisation capacity was limited—the large molecule sizes of Tween 80 and its aggregates in the solution mean it can form an interfacial barrier to prevent CBZ molecules getting into the bulk solution, resulting in accelerated nucleation and growth of the stable crystal form CBZ DH on the sample compact surface. Therefore, the experimental results in this work indicated that Tween 80 had the opposite effect on the IDRs of CBZ III and the CBZ–NIC cocrystal as those of SLS,
i.e., the inclusion of Tween 80 in the dissolution medium reduced the IDRs of CBZ III and CBZ–NIC cocrystal (
Figure 4).


