Article

A Yielding Protocol that Uses Inter-Vehicle Communication to Improve the Traffic of Vehicles on a Low-Priority Road at an Unsignalized Intersection

Information Systems Science Major, Graduate School of Engineering, Soka University, 1-236 Tangi-cho, Hachioji-shi 192-8577, Japan
*
Author to whom correspondence should be addressed.
Future Internet 2019, 11(5), 110; https://doi.org/10.3390/fi11050110
Submission received: 10 April 2019 / Revised: 5 May 2019 / Accepted: 8 May 2019 / Published: 9 May 2019
(This article belongs to the Special Issue Advances in Internet of Vehicles (IoV))

Abstract

:
Self-driven vehicles are being actively developed. When widespread, they will help reduce the number of traffic accidents and ease traffic congestion. They will coexist with human-driven vehicles for years. If there is a mismatch between human drivers’ operations and the judgments of self-driven vehicles, congestion may arise at an unsignalized intersection, in particular, where roads are prioritized. Vehicles on the low-priority road attempting to cross, or turn to, the priority road can significantly reduce the traffic flow. We have proposed a yielding protocol to deal with this problem and evaluated it using a simulation that focused on traffic flow efficiency at an intersection. In the simulation, we have varied the number of vehicles coming into the roads and the percentage of self-driven vehicles and confirmed that the proposed yielding protocol could improve the traffic flow of vehicles on the low-priority road.

1. Introduction

With a view to making road traffic in Japan the safest in the world, the Japanese government is pushing ahead with the research and development of self-driven vehicle systems as a national project. Self-driven vehicles are expected to reduce the number of accidents and ease traffic congestion [1]. They will coexist with human-driven vehicles for years. Mismatches between the operations and judgments of humans and machines may lead to accidents or traffic jams [2]. A completely self-driven vehicle only follows the specified procedures and does not communicate with drivers in a manner natural to humans, such as eye contact. It is necessary to provide a mechanism by which drivers can communicate with self-driven vehicles so that both the drivers and self-driven vehicles can convey their intentions to each other and drive in a coordinated manner. There have been many studies on controlling traffic at an intersection using inter-vehicle communication or road-to-vehicle communication [3,4,5,6,7]. Most of them [5,7] focus on enhancing traffic efficiency by enabling vehicles to pass through an intersection without stopping. Requiring precise speed control, they are not suitable for use in narrow residential roads, which abound in Japan. They do not consider pedestrians.
The authors have previously proposed a yielding method that is applied to an intersection where there is neither a traffic light nor a roadside unit and where a priority level is assigned to each road [8]. It is assumed that both human-driven and self-driven vehicles are equipped with a communication device, sensors, and cameras. It is further assumed that self-driven vehicles are completely automatic. In this yielding protocol, a vehicle on the low-priority road (hereafter “low-priority vehicle”) that wants to cross, or turn to, the priority road stops in front of the intersection and sends a yielding request to vehicles on the priority road (hereafter “priority vehicles”). Or, a priority vehicle that wants to turn right to a low-priority road sends a yielding request to oncoming vehicles. This yielding protocol is modeled on the way drivers communicate with each other, such as using headlight flashing and eye contact. In the present paper, we have evaluated the extent to which the proposed yielding protocol improves the traffic of low-priority vehicles. For this purpose, we have used simulation to examine how the protocol affects various traffic indicators concerning low-priority vehicles: Intersection passing rate, average number of stops, average stop time, average driving distance, average driving speed, and road occupancy of low-speed vehicles. Section 2 reviews related studies. Section 3 details the yielding protocol and the improvements made in the protocol to enhance the message transmission efficiency and vehicle identification accuracy. Section 4 presents the evaluation system and improved system functions. Section 5 describes the simulation conditions and evaluation results. Section 6 summarizes this paper and presents future issues.

2. Related Studies

2.1. Methods of Controlling the Traffic of Both Self-Driven and Human-Driven Vehicles

Methods of controlling the traffic of self-driven vehicles have been studied in [3,4,5,6,7]. This section compares the method proposed in this paper with these methods from the following four perspectives:

2.1.1. Intersection Shape, Road Prioritization, and Presence of A Traffic Light and A Roadside Unit

Reference [3] deals with an intersection where there is a roadside unit but no traffic light and no road prioritization. Reference [4] focuses on a T-shaped intersection where there is a roadside unit, but no traffic light and priority is assigned to each road. References [5,7] consider an intersection with no traffic light or roadside unit and no road prioritization. This paper addresses an intersection where there is no traffic light or roadside unit, and priority is defined on each road.

2.1.2. Pedestrians

References [3,4,5,7] do not consider pedestrians. The traffic control of [5,7], in particular, can become inefficient if vehicles cannot move due to the presence of a pedestrian crossing the road. In the present paper, the vehicle that has received a yielding request does not yield if there is a pedestrian crossing the road. This prevents the vehicle from stopping in vain in an attempt to yield the way to the requesting vehicle.

2.1.3. Differences in Judgments between Self-Driven and Human-Driven Vehicles

Reference [4] considers only response time as a factor that causes differences in judgments between self-driven and human-driven vehicles. In addition to response time, the method in this paper addresses a number of other factors: The maximum rate of acceleration, the maximum rate of deceleration, and the minimum inter-vehicle distance. The response time of a human-driven vehicle can be much longer than that of a self-driven vehicle because the driver observes the surroundings, selects one of the alternative decisions based on the understanding of the surrounding situation and finally operates the vehicle based on the selected decision. While self-driven vehicles are designed to accelerate or decelerate smoothly and efficiently, human drivers are likely to perform unnecessary operations. The minimum inter-vehicle distance can be more or less fixed with self-driven vehicles, but that of human-driven vehicles can vary widely depending on individual drivers. Differences in these factors between self-driven and human-driven vehicles are summarized in Table 1.

2.1.4. Control of Entry into an Intersection

Reference [3] extends a previous method [9] that avoids conflict in entering an intersection (hereafter “conflict situation”) by making each vehicle reserve its intersection passing time. It proposes to prevent interferences between a self-driven vehicle and a human-driven vehicle by restricting the direction that a human-driven vehicle can take on each of the three types of lane: Through lane, right-turn lane, and left-turn lane. This method can be effective only at a large intersection where there are several lanes in each direction.
In [4], a low-priority vehicle coming to an intersection sends the roadside unit a request message to enter the intersection. A priority vehicle that has received this message decides whether to enter the intersection by examining the distance from the intersection to see if it can safely reduce its speed. This method does not consider other factors. Another problem is that the communication between vehicles and the roadside unit is one way. The vehicles involved cannot directly communicate with each other. The method does not work if the requesting vehicle cannot identify the responding vehicle and needs to brake hard to avoid an accident. The present paper classifies yielding situations into four yielding patterns and defines how the vehicles involved behave in each pattern. The vehicles’ decisions are based on a number of conditions: What is the priority level of the road the given vehicle is running, whether there is enough space to move into, whether there is a traffic light, whether there is a conflict situation, and whether there are pedestrians wanting to cross the road. The low-priority vehicle and the priority vehicle identify each other and communicate the former’s yielding request and the latter’s response reliably using a handshake protocol.
In [5], vehicles that approach an intersection directly exchange vehicle information before they arrive at the intersection. If the times they pass through the intersection overlap, one of them is selected to play a traffic light role. It broadcasts traffic signal information so that the vehicles that have received this information behave as if the intersection had a traffic light. This virtual traffic light (VTL) method [6] is designed in detail for practical application. Reference [7] presents an improved VTL, which considers each vehicle’s moving direction in detecting a conflict situation, and allows the vehicles to go into the intersection if there is no conflict, thereby reducing the time needed for the vehicles to pass through the intersection. These methods assume only human-driven vehicles but have the potential for controlling traffic that involves both human-driven and self-driven vehicles. These are aimed at improving traffic efficiency by eliminating stops. They do not consider pedestrians.

2.2. Position of the Proposed Yielding Protocol

Table 2 compares the proposed yielding protocol with the other methods mentioned in Section 2.1. The present study deals with the traffic of both self-driven and human-driven vehicles at an unsignalized intersection with no roadside unit. It is aimed at improving the traffic flow by using a yielding protocol that allows vehicles to communicate with each other directly regarding yielding intention. The aim is to resolve mismatches in judgments among vehicles. It is assumed that the roads that meet at an intersection are prioritized and that a low-priority vehicle can go through the intersection if the priority vehicle yields the way. It considers pedestrians who want to cross the roads. Priority vehicles decide whether to yield the way based on a variety of factors that reflect a real situation: What is the priority level of the road the given vehicle is running, whether there is enough space to move into, whether there is a traffic light, whether there is a conflict situation, and whether there are pedestrians wanting to cross the road.

3. Proposed Yielding Protocol

3.1. Assumptions

This paper assumes the traffic environment in Japan that will emerge when self-driven vehicles begin to spread and studies a crossroads where there is no traffic light or roadside unit and where there is only one lane in each direction of the roads. The following is further assumed. The priority level of each road is unequivocally determined based on its relative width and the road signs and markings in accordance with the Road Traffic Law. All vehicles observe traffic regulations. Vehicles are equipped with a communication device, sensors, and cameras so that they can obtain all information needed for making yielding-related decisions. There is no traffic congestion, no motorcycles, no emergency vehicles, no obstacles, such as vehicles parked on the road, and no communication errors due to radio attenuation.

3.2. Overview of the Yielding Process

The authors previously proposed a yielding protocol in [8] (hereafter referred to as the “former method”) and verified its operation using an experimental system, which consisted of Raspberry Pi computers mounted on radio control cars. However, the former method had problems with the message transmission efficiency and vehicle identification accuracy. The present paper presents an improved method. This section details the improved method. The sequence of the yielding process is the same as the former method and is shown in Figure 1. Vehicle A sends a request. Vehicle B receives the request, makes a decision, and agrees to yield. Vehicle A proceeds to the intersection and sends a thanks message. The yielding protocol begins when a low-priority vehicle comes near the intersection, or when a priority vehicle wishing to turn right into a low-priority road is at the head of the line of vehicles and is running at a reduced speed or at a halt. Self-driven vehicles operate in accordance with this yielding process. Drivers in human-driven vehicles make the final judgment about driving and input their intentions by using a user interface (UI).

3.3. Yielding Patterns

Yielding is required at an unsignalized intersection when the driving course of a vehicle with low priority status intersects with that of another vehicle. Among the yielding patterns proposed in the former method, this paper focuses on the four situations at a crossroads shown in Table 3.
In Pattern 1, the course of the vehicle concerned intersects with that of a vehicle coming from the right wishing to go straight. In Pattern 2, the course of the vehicle intersects with that of a vehicle coming from the right wishing to either go straight or turn right, of a vehicle coming from the left wishing to either go straight or turn right, and of an oncoming vehicle wishing to either go straight or turn left. In Pattern 3, the course of the vehicle intersects with that of a vehicle coming from the right wishing to go either straight or turn right, and of a vehicle coming from the left. In Pattern 4, the course of the vehicle intersects with that of an oncoming vehicle wishing to either go straight or turn left. The vehicle can move on if the competing vehicle yields the way.

3.4. Yielding Messages

The inter-vehicle communication standard in Japan, ARIB STD-T109 [10], supports neither unicast nor multicast. Messages are always broadcast. However, in the yielding process, a vehicle does not need to communicate with all the vehicles in the surroundings, but with a specific vehicle. Therefore, it is desirable to specify the message destination in the message so that vehicles not involved in the yielding process need not process messages unrelated to them. The former method employed one-to-one communication using destination ID and sender ID. Thus, if the same message was to be sent to multiple destinations, it was necessary to send as many messages as the destinations. In this paper, we have revised the message structure to allow one-to-many communication, as shown in Table 4. The yielding ID is used as a multicast address. It is a unique ID consisting of a unique vehicle ID and the timestamp identifying the time when the given request message was generated. The message body consists of the sender vehicle information, the yielding pattern, and the message type. A vehicle that has received a message identifies the sender by examining the sender vehicle information, which consists of information about the maker, the vehicle model, the vehicle color, the longitude and latitude of the vehicle’s position and the vehicle’s angle of direction. The yielding pattern indicates which yielding pattern applies. The message type indicates whether the message is a request, agreement, rejection, thanks, time-out or termination message.

3.5. Identification of the Communicating Vehicle

The yielding process does not involve all the vehicles near the intersection but only two specific vehicles. The vehicle that requests yielding and the vehicle that responds and yields the way need to identify each other. However, it is not possible to pinpoint the position of a running vehicle, and the GPS information includes some error. Some vehicles may not communicate. Thus, the responding vehicle cannot be identified reliably by the position information alone. If a wrong vehicle is identified as the communicating vehicle, a dangerous situation may arise. To address this problem, the former method identified the communicating vehicle by recognizing the vehicle model from the video captured by the vehicle-mounted camera and based on the position information and vehicle information included in the received message. However, this approach has a problem in vehicle identification accuracy when there are several similar looking vehicles. The present method enhances the accuracy level of vehicle identification by narrowing down the vehicles to be detected by additionally calculating and using the vehicle direction. The vehicle identification algorithm used is described in Algorithm 1:
Algorithm 1. Vehicle Identification Algorithm
Step 1: Calculate the estimated distance to the vehicle from its longitude and latitude data.
Step 2: If the estimated distance is within the predefined threshold, calculate the relative position (ahead, back, right or left) from the longitude and latitude data, and the relative direction (moving forward, moving backward, moving right or moving left) from the angle-of-direction data.
Step 3: If the relative position and the relative direction indicate that the paths of the two vehicles are likely to intersect, detect vehicles at or near the calculated position in the calculated direction.
Step 4: From among the detected vehicles, find a vehicle that has the same information about the maker, vehicle model, and vehicle color.
Step 5: If only one vehicle is identified, it is the communicating vehicle. If no vehicle is identified or multiple vehicles are identified, it is decided that the communicating vehicle cannot be identified.
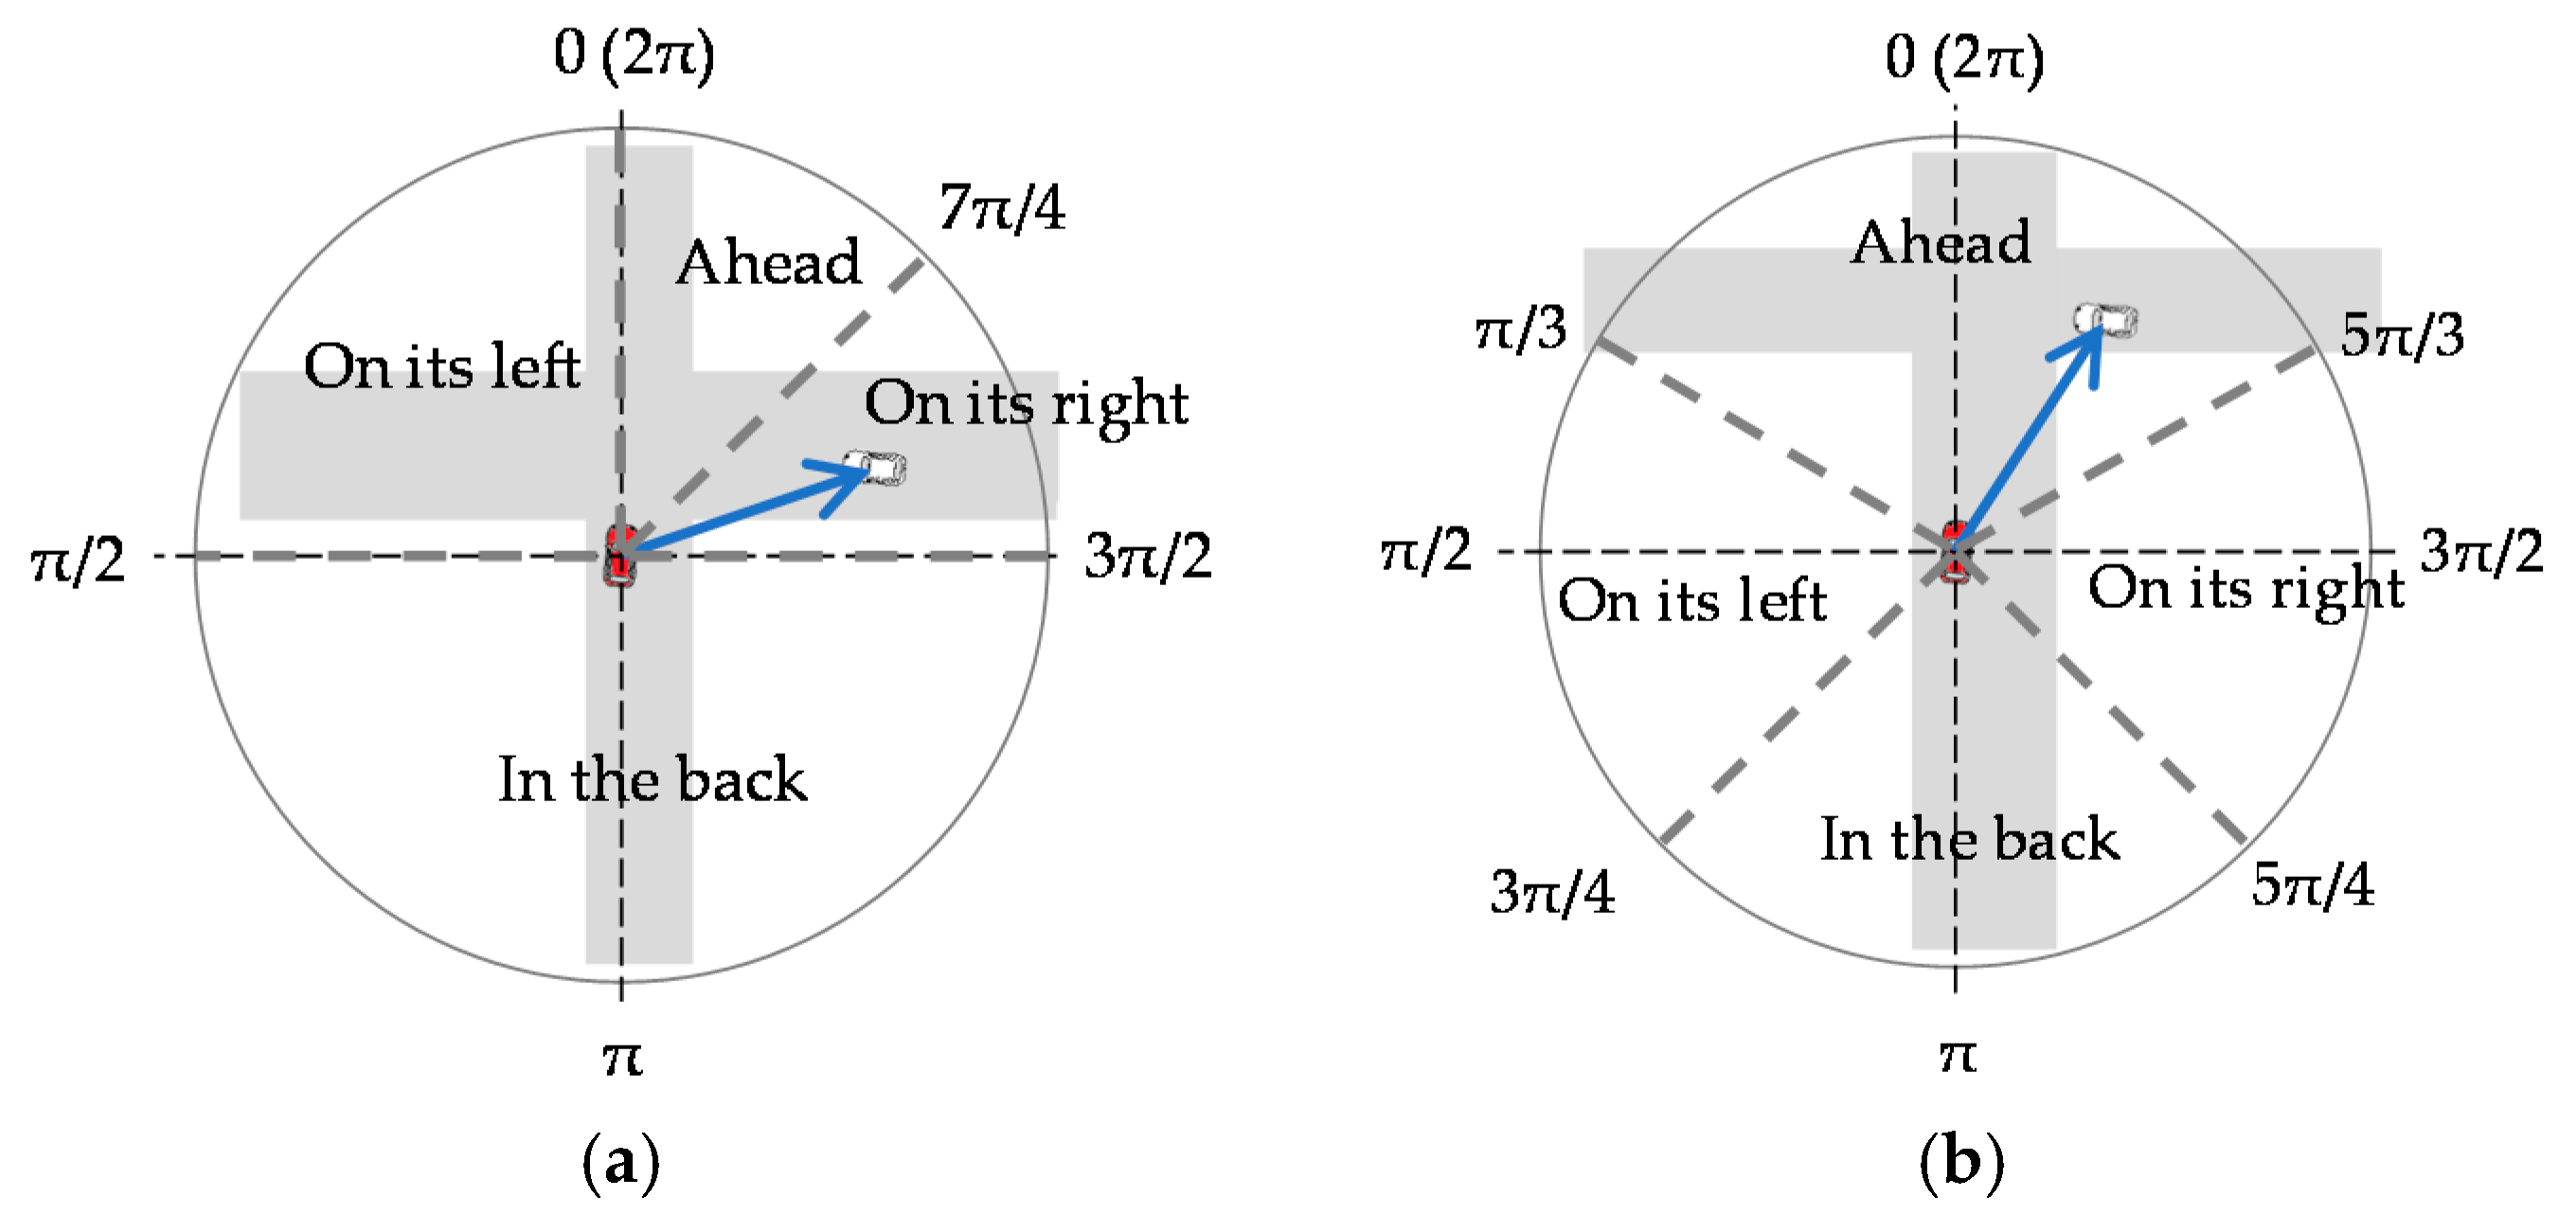
Here, the relative position in Step 2 is the direction from the own vehicle. It represents the angle of direction in which the other vehicle is located, θpos, in the counterclockwise rotation with the direction in which the own vehicle is moving defined as “0.” It is calculated by converting the longitude and the latitude into plane rectangular coordinates. In the case where the own vehicle is the requesting vehicle, it is near the intersection. Therefore, as shown in Figure 2a, it determines that an approaching vehicle is on its left if the latter is located within the 90° of 0 ≦ θpos ≦ π/2, in the back if it is located within the 180° of π/2 < θpos ≦ 3π/2, on its right if it is located within the 45° of 3π/2 < θpos ≦ 7π/4, and ahead if it is located within the 45° of 7π/4 < θpos ≦ 2π.
On the other hand, if the own vehicle is the responding vehicle, the requesting vehicle is near the intersection and the own vehicle may or may not be located near the intersection. Therefore, as shown in Figure 2b, it determines that a vehicle near the intersection is ahead if the latter is located within the 120° of 0 ≦ θpos ≦ π/3 and 5π/3 < θpos ≦ 2π, on its left if it is located within the 75° of π/3 < θpos ≦ 3π/4, in the back if is located within the 90° of 3π/4 < θpos ≦ 5π/4, and on its right if it is located within the 75° of 5π/4 < θpos ≦ 5π/3.
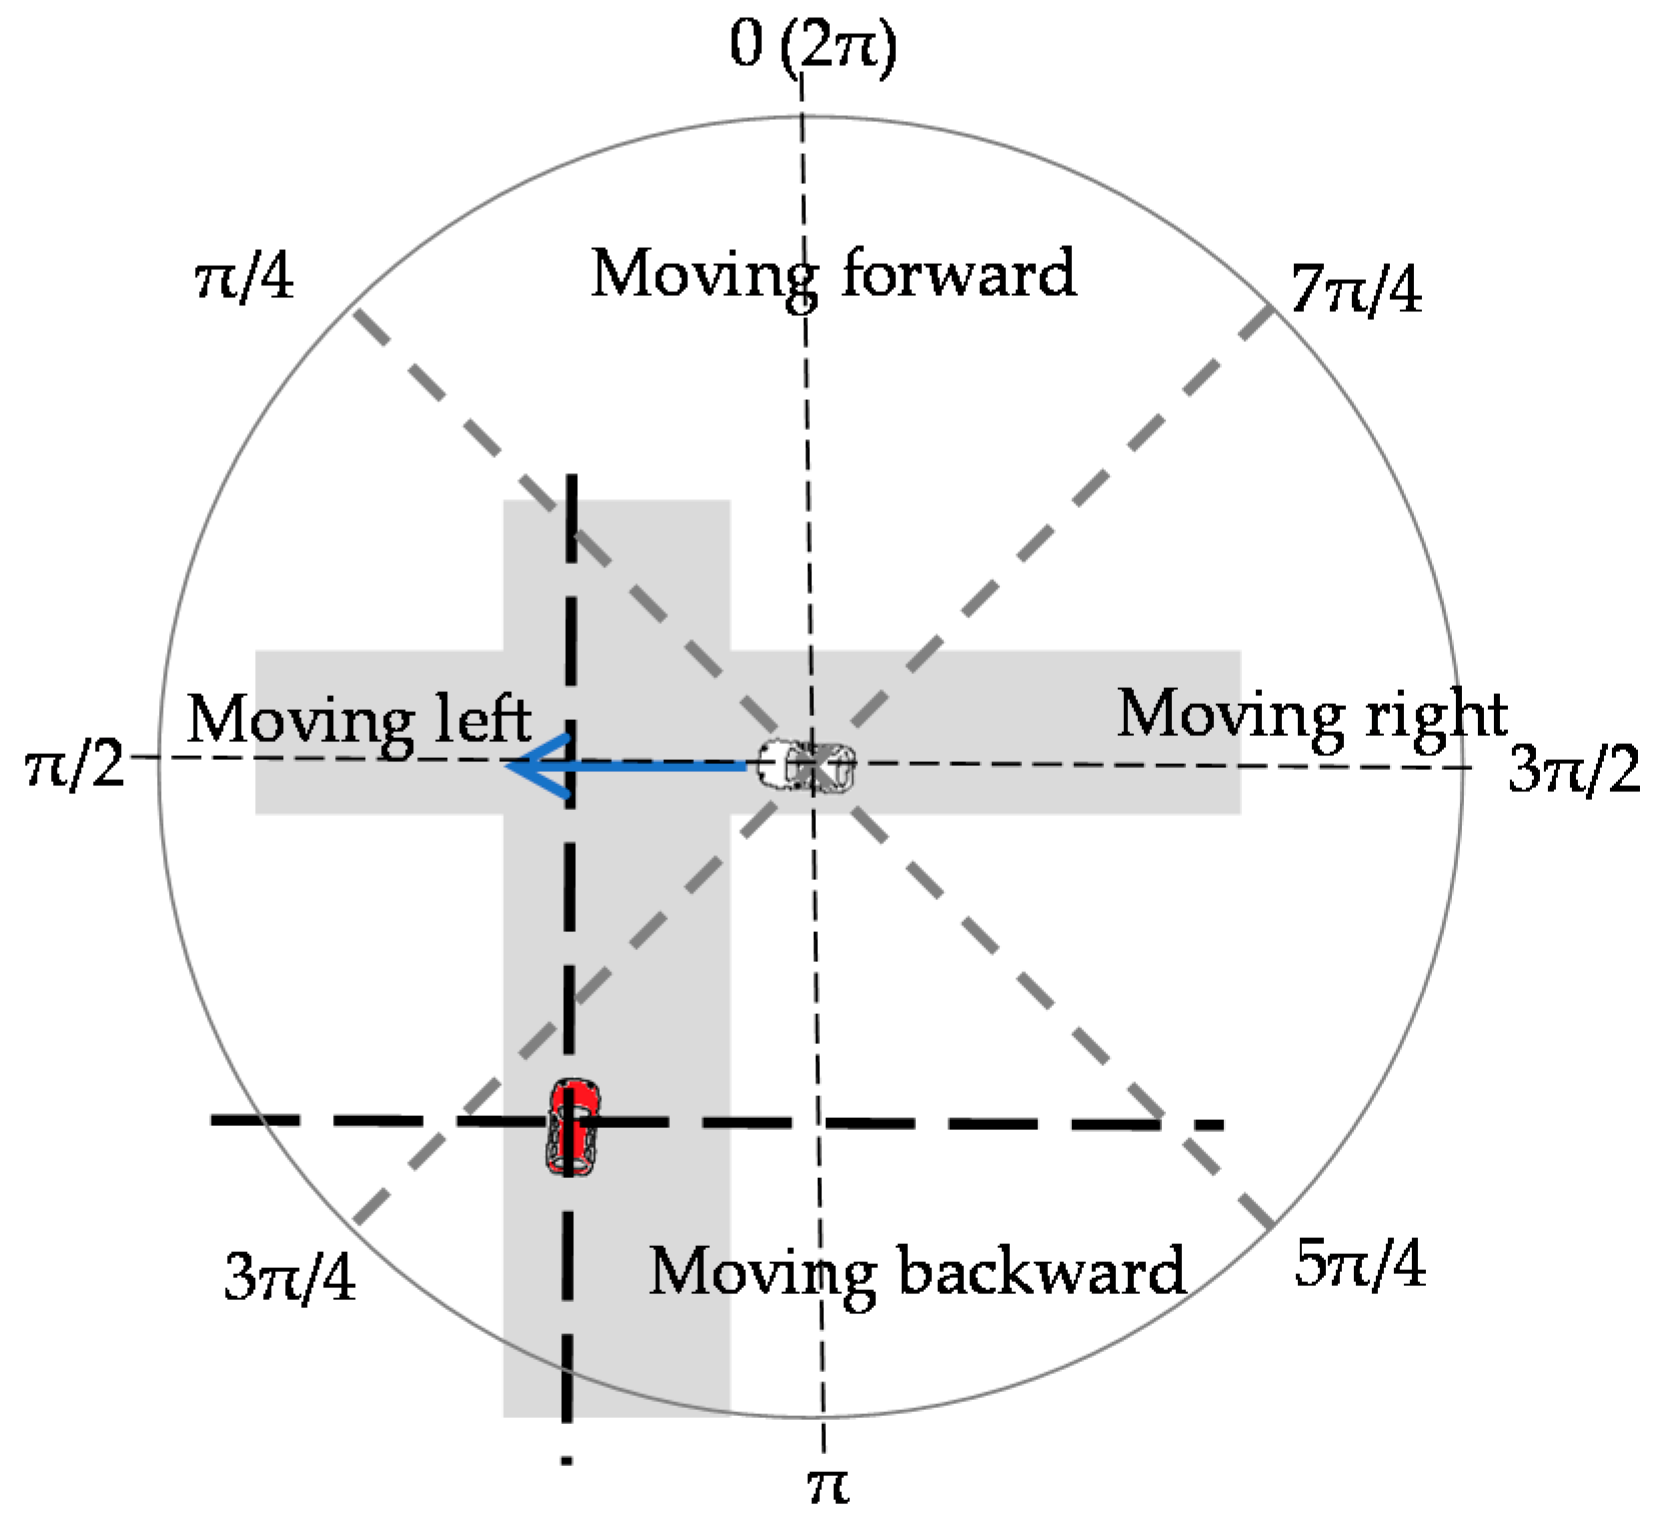
The relative direction in Step 2 is the direction in which the other vehicle is moving as seen from the own vehicle. It represents the angle of direction in which the other vehicle is moving, θdir, in the counterclockwise rotation with the direction in which the own vehicle is moving defined as “0.” As shown in Figure 3, the other vehicle is moving forward (the same direction as the own vehicle) if its direction is within the 90° of 0 ≦ θdir ≦ π/4 and 7π/4 < θdir ≦ 2π, is moving left if its direction is within the 90° of π/4 < θdir ≦ 3π/4, is moving backward (opposite to the direction of the own vehicle) if its direction is within the 90° of 3π/4 < θdir ≦ 5π/4, and is moving right if its direction is within the 90° of 5π/4 < θdir ≦ 7π/4. The own vehicle can determine whether the other vehicle is moving toward the intersection by combining the information about the relative direction with the information about the relative position. For example, consider a case where the own vehicle is a responding vehicle. If the relative position of the other vehicle is ahead and its relative direction indicates that it is moving left, it is approaching from the right side. If the relative direction indicates that it is moving forward, it is a vehicle ahead of the own vehicle. If the relative direction indicates that it is moving right, it is approaching from the left side.
Thus, a combination of the relative position and the relative direction provides information about whether the other vehicle is moving toward the own vehicle. For example, if the other vehicle is located ahead and is moving backward, it is heading toward the own vehicle. On the other hand, if the other vehicle is ahead and is moving forward, it is not coming this way. The own vehicle tries to identify the other vehicle only when the other vehicle is moving toward it.
A requesting vehicle can determine the direction from which the responding vehicle is approaching from the latter’s relative position and relative direction. Since it needs to recognize the vehicle model of only those vehicles that are moving in that direction, it is easy for it to identify the responding vehicle even when there are a number of vehicles of the same vehicle model. A responding vehicle can determine whether the requesting vehicle is a competing vehicle from the latter’s relative position and relative direction and the yielding pattern. Since it needs to recognize the vehicle model of only competing vehicles, it can reduce the processing load for vehicle model recognition.
In addition, this paper does not consider how the method of recognizing a vehicle model in Step 4 is implemented. Because, there are already methods that can recognize a vehicle model with a high level of accuracy [11,12].

3.6. Decision on Yielding

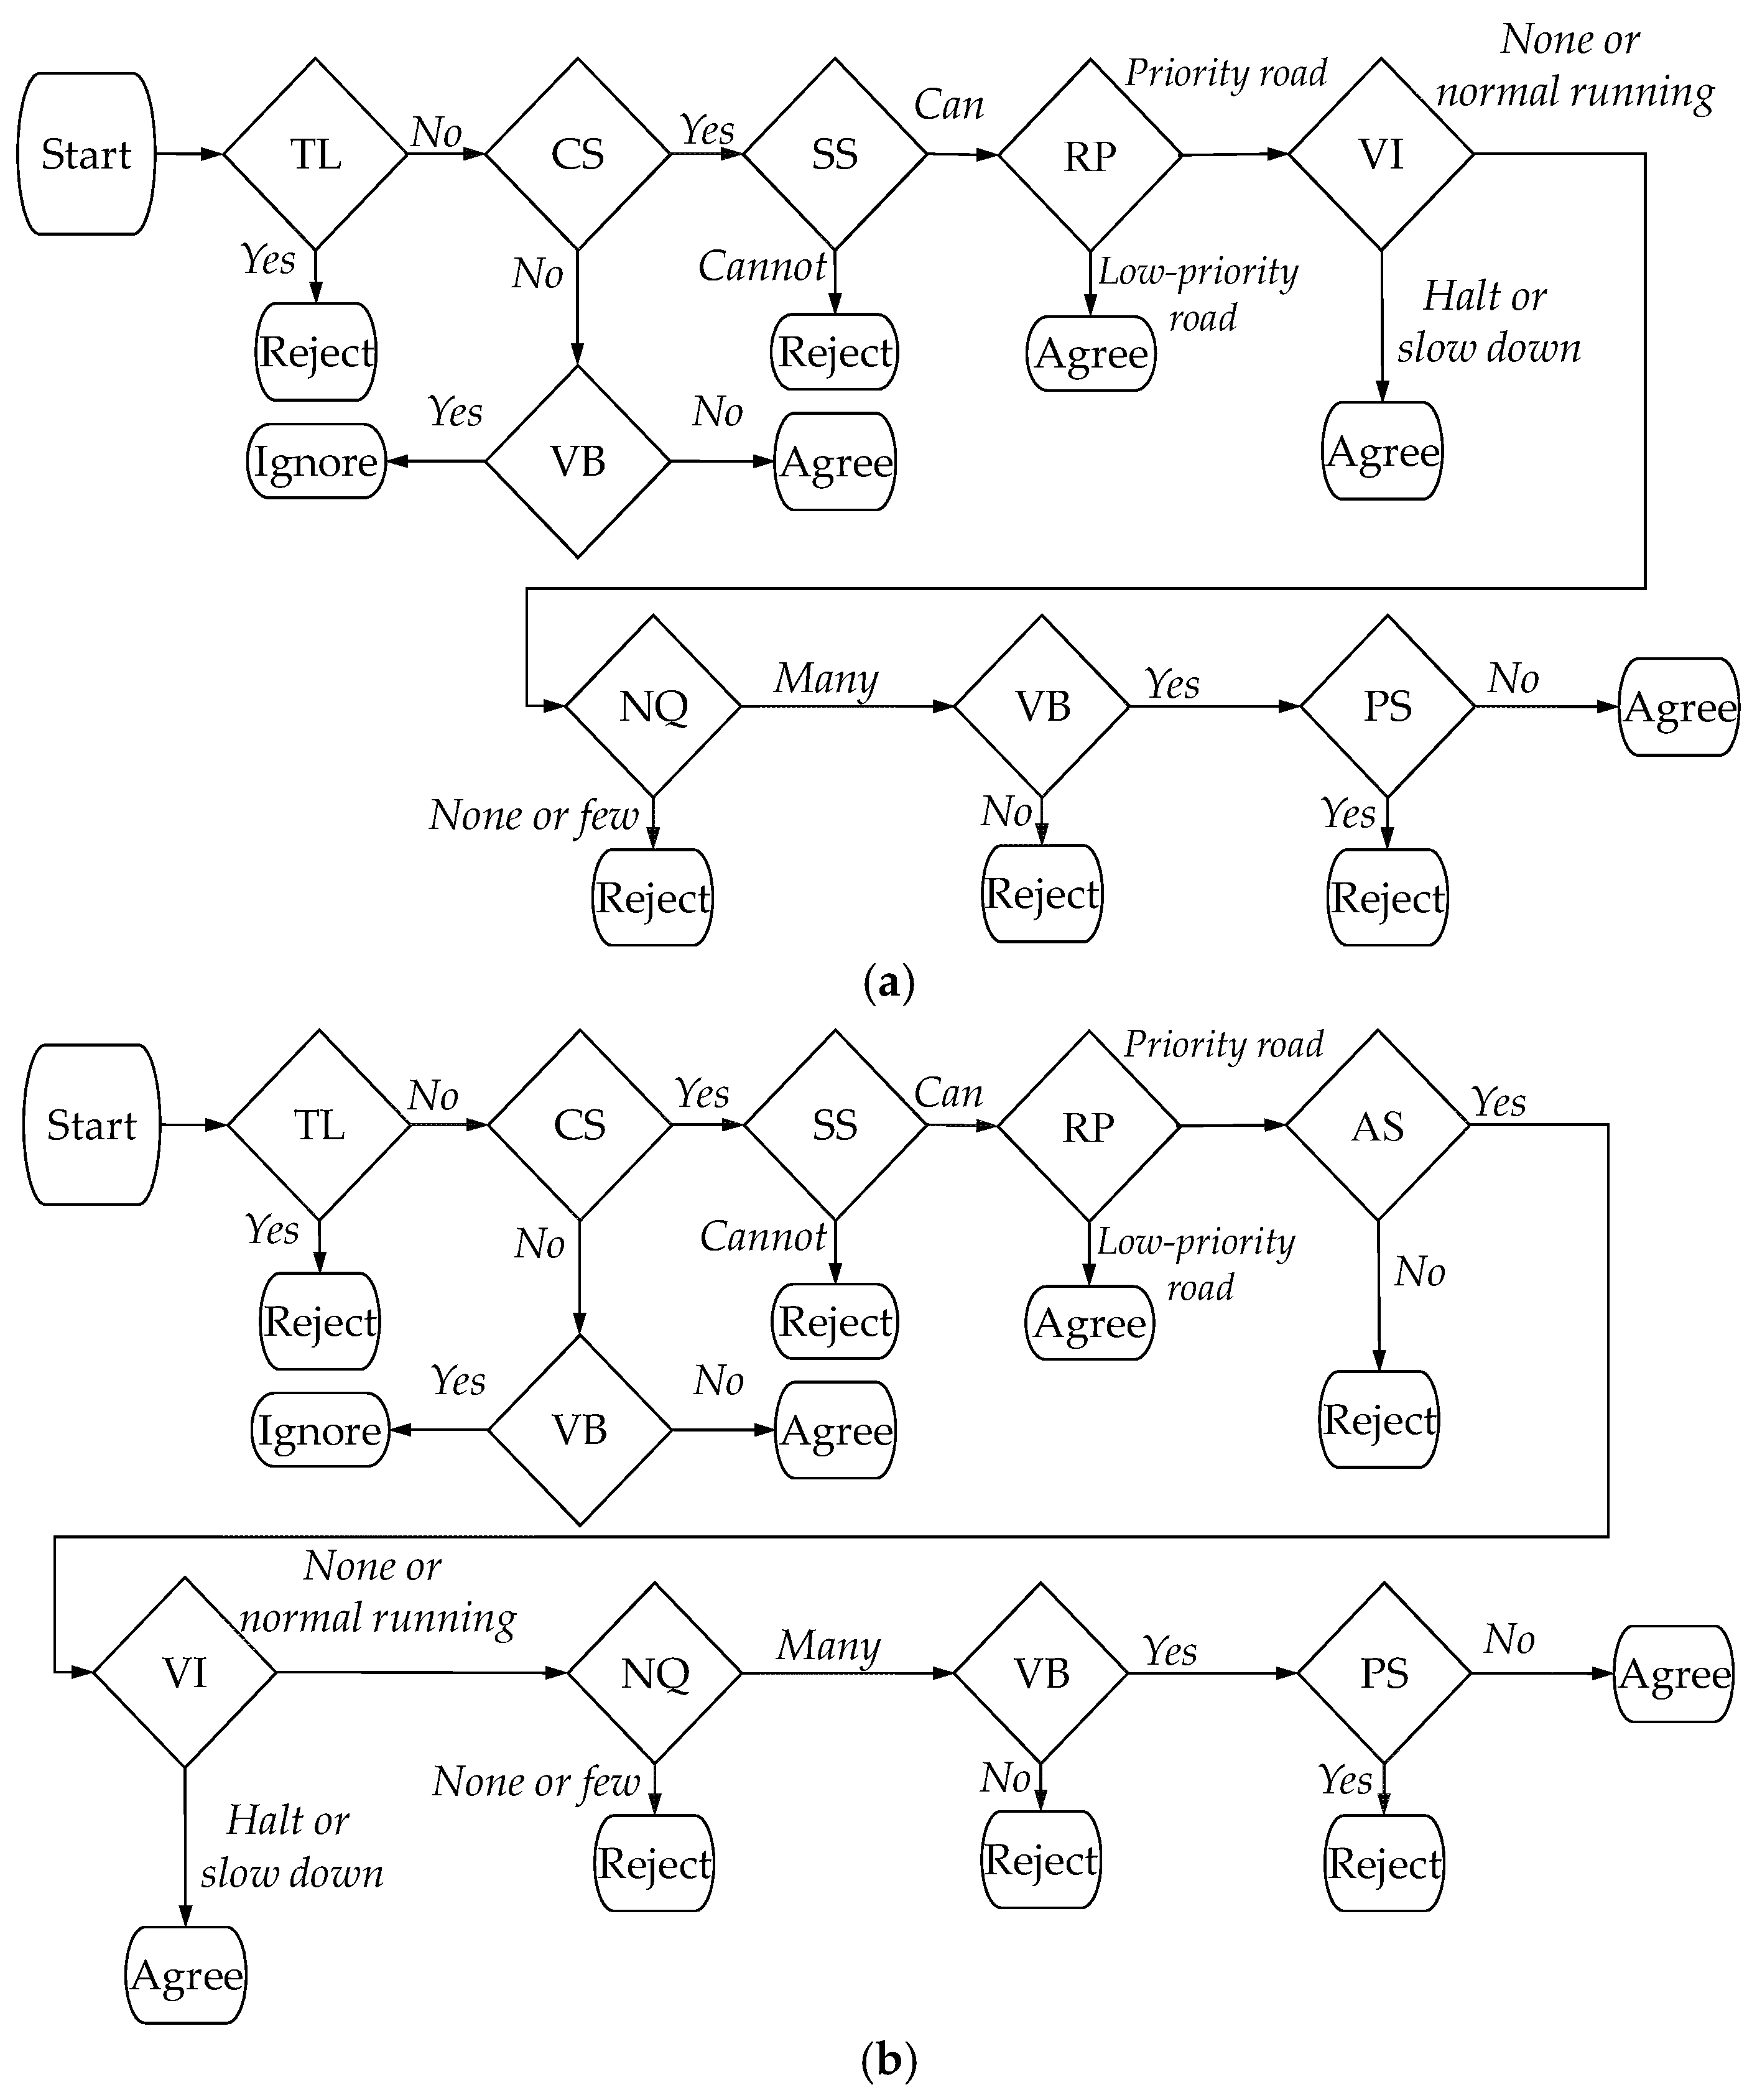
A vehicle that has received a yielding request decides whether to yield the way based on its speed, moving direction, and information about the surroundings captured by its sensors. The criteria used to make this decision depend on the particular yielding pattern. The former method considered several criteria, such as whether there is a traffic light, whether the vehicle can stop safely, how the vehicle ahead behaves, how many low-priority vehicles are queuing up, and whether there is a vehicle in the back. To enhance yielding efficiency, this paper additionally considers whether there is a conflict situation, whether there are pedestrians wanting to cross a road, whether there is enough space to move into, and what is the priority level of the road the own vehicle is running, as shown in Figure 4. Here, the space to move into means space on the target lane that the low-priority vehicle will move into when the responding vehicle has yielded the way. The driver in a human-driven vehicle sends an agreement message through a UI, as shown in Figure 1, but does not send an agreement message if there is no conflict situation.
If only one lane intersects with the course of the own vehicle as in Patterns 1 and 4 (the lane going left to which the own vehicle wants to turn in Pattern 1; the opposite lane that the own vehicle will cross when it turns right in Pattern 4), the yielding decision is made based on whether there is a traffic light, whether there is a conflict situation, whether the vehicle can stop safely, how the vehicle beyond the intersection behaves, how many low-priority vehicles are queuing up, whether there is a vehicle in the back, and whether there are pedestrians, as shown in Figure 4a.
If two lanes intersect with the course of the own vehicle as in Patterns 2 and 3 (the lane going left and the lane going right to which the own vehicle wants to turn in Pattern 2, or the two lanes that the own vehicle needs to cross in Pattern 3), the yielding decision is made based on whether there is a traffic light, whether there is a conflict situation, whether the vehicle can stop safely, whether there is enough space to move into for the vehicle on the opposite lane, how the vehicle beyond the intersection behaves, how many low-priority vehicles are queuing up, whether there is a vehicle in the back, and whether there are pedestrians, as shown in Figure 4b.
The general idea of the above decision flows is first to decide whether the situation warrants yielding, second to decide whether yielding can be done safely, and third to decide whether yielding improves traffic efficiency.
The decision on whether the situation warrants yielding is based on the first two criteria: Whether there is a traffic light and whether there is a conflict situation. If there is no conflict situation, the responding vehicle does not need to control its speed. It yields the way but does not slow down or stop. However, if there is a vehicle in the back, that vehicle may encounter a conflict situation. In such a case, the vehicle that has received a yielding request does not respond but leaves the yielding decision to the vehicle in the back. The decision on whether yielding can be done safely is based on whether the vehicle can stop safely. The vehicle can stop safely if the following is satisfied:
v ( v d e c + R T ) + v 2 2 d e c < d I
Where v is the current speed, d e c is the permitted maximum rate of deceleration, R T is the driver’s response time, and d I is the estimated distance to the intersection. The decision on whether yielding improves traffic efficiency is based on the remaining criteria: What is the priority level of the road the own vehicle is running, whether there is enough space to move into, how the vehicle beyond the intersection behaves, how many low-priority vehicles are queuing up, whether there is a vehicle in the back, and whether there are pedestrians. If the own vehicle is on a low-priority road, it always agrees to yield. If there are pedestrians crossing the road or there is not enough space to move into, it does not agree because, even if it does, it is highly likely that the requesting vehicle cannot move on. If the responding vehicle moves on in a situation where there are vehicles standing still ahead, it may need to stop and may block the traffic on the low-priority road. In such a situation, the responding vehicle agrees to yield to improve traffic efficiency. The responding vehicle also agrees to yield if there is a queue of low-priority vehicles. However, if there is no vehicle in the back, it does not yield the way because the requesting vehicle can move on after the responding vehicle has passed through the intersection.

3.7. Yielding Algorithms

While the yielding protocol is in operation, a vehicle constantly monitors the road conditions using its sensors. If it is at the head of traffic and is running at a slow enough speed when it comes to an unsignalized intersection, it checks if one of the yielding patterns applies. It also checks the turning signals of other vehicles. If a yielding pattern applies, the following yielding request algorithm as shown in Algorithm 2 is executed:
Algorithm 2. Yielding Request Algorithm
Step 1: The vehicle in question generates a yielding ID. This ID denotes the current yielding process.
Step 2: It sends a yielding request message and waits for a response.
Step 3: If there is no vehicle in the surroundings, it moves on. If it receives no response even though there are vehicles in the surroundings, it re-sends the message. If it receives an agreement message, it identifies the message sender vehicle and finalizes the agreement. If it receives a time-out message, it sends a cancellation message and restarts the yielding request algorithm all over again.
Step 4: If it receives an agreement from the competing responding vehicle and confirms that it can proceed safely, it moves on, sends a thanks message, and terminates the algorithm. Here, the required agreement is an agreement from the competing vehicle described in Section 3.3. It can vary depending on the particular yielding pattern. If it receives a time-out message before it begins to move on, it sends a cancellation message and restarts the yielding request algorithm all over again.
If the vehicle in question is not involved in any yielding process and receives a request message, it executes the following yielding response algorithm as shown in Algorithm 3.
Algorithm 3. Yielding Response Algorithm
Step 1: It uses the yielding ID included in the received request message as the yielding ID of the current yielding process.
Step 2: It identifies the message sender vehicle. If it cannot identify the sender vehicle, it terminates this algorithm.
Step 3: It decides whether to yield and sends either an agreement message or a rejection message accordingly. If it has sent a rejection message or if it has sent an agreement message but there is no conflict situation, it terminates this algorithm.
Step 4: It waits for a thanks message. When it has received a thanks message or a cancellation message, it terminates this algorithm. If the waiting time has expired, it sends a time-out message and terminates this algorithm.
A state transition diagram for these two algorithms is shown in Figure 5.

4. Evaluation System

We used a Scenargie 2.0 simulator [13] to evaluate the proposed method. The Multi-Agent Extension Module was used to represent vehicle mobility. ITS Extension Modules were used for communication. Vehicles communicated using ARIB STD-T109, which is the inter-vehicle communication standard in Japan.

4.1. Implementation of Differences between Human-Driven and Self-Driven Vehicles

4.1.1. Mobility Model

To build a realistic environment, we implemented the stop of a low-priority vehicle and the stop of a priority vehicle within an intersection. The Intelligent Driver Model (IDM) [14] was used as the vehicle tracking model. The IDM is expressed by Equation (2). It calculates the rate of acceleration suitable for tracking, v ˙ , from a number of parameter values: Vehicle speed, v , the maximum speed, v 0 , the maximum rate of acceleration, a , the maximum rate of deceleration, b , difference in speed from the vehicle ahead, Δ v , inter-vehicle distance, s , the minimum inter-vehicle distance, s 0 , the inter-vehicle distance additionally required at the maximum speed, s 1 , inter-vehicle time, T , and acceleration factor, δ .
v ˙ = a [ 1 ( v v 0 ) δ ( s 0 + s 1 v v 0 + T v + v Δ v 2 a b s ) 2 ]
Differences of human-driven vehicles from self-driven vehicles were represented by adding the response time, R T to the rate of acceleration, v ˙ , which is obtained using the IDM,
v ˙ ( t ) = v ˙ ( t + R T )
Or by varying the inter-vehicle distance or the maximum rate of acceleration. Self-driven vehicles were designed such that they change the speed smoothly and drive efficiently with no time wasted in deciding whether to go into the intersection. In contrast, human-driven vehicles were designed to have some delay in recognizing the situation of the road ahead and drive less efficiently. Differences in parameters set between the two types of vehicle are shown in Table 5. We set the response time of human-driven vehicles by referring to the response time reported in [15], and the maximum rate of deceleration of self-driven vehicles by referring to the maximum rate of deceleration that was reported not to give anxiety to the passengers in [16].

4.1.2. Inter-Vehicle Distance Used to Decide Whether to Enter the Intersection

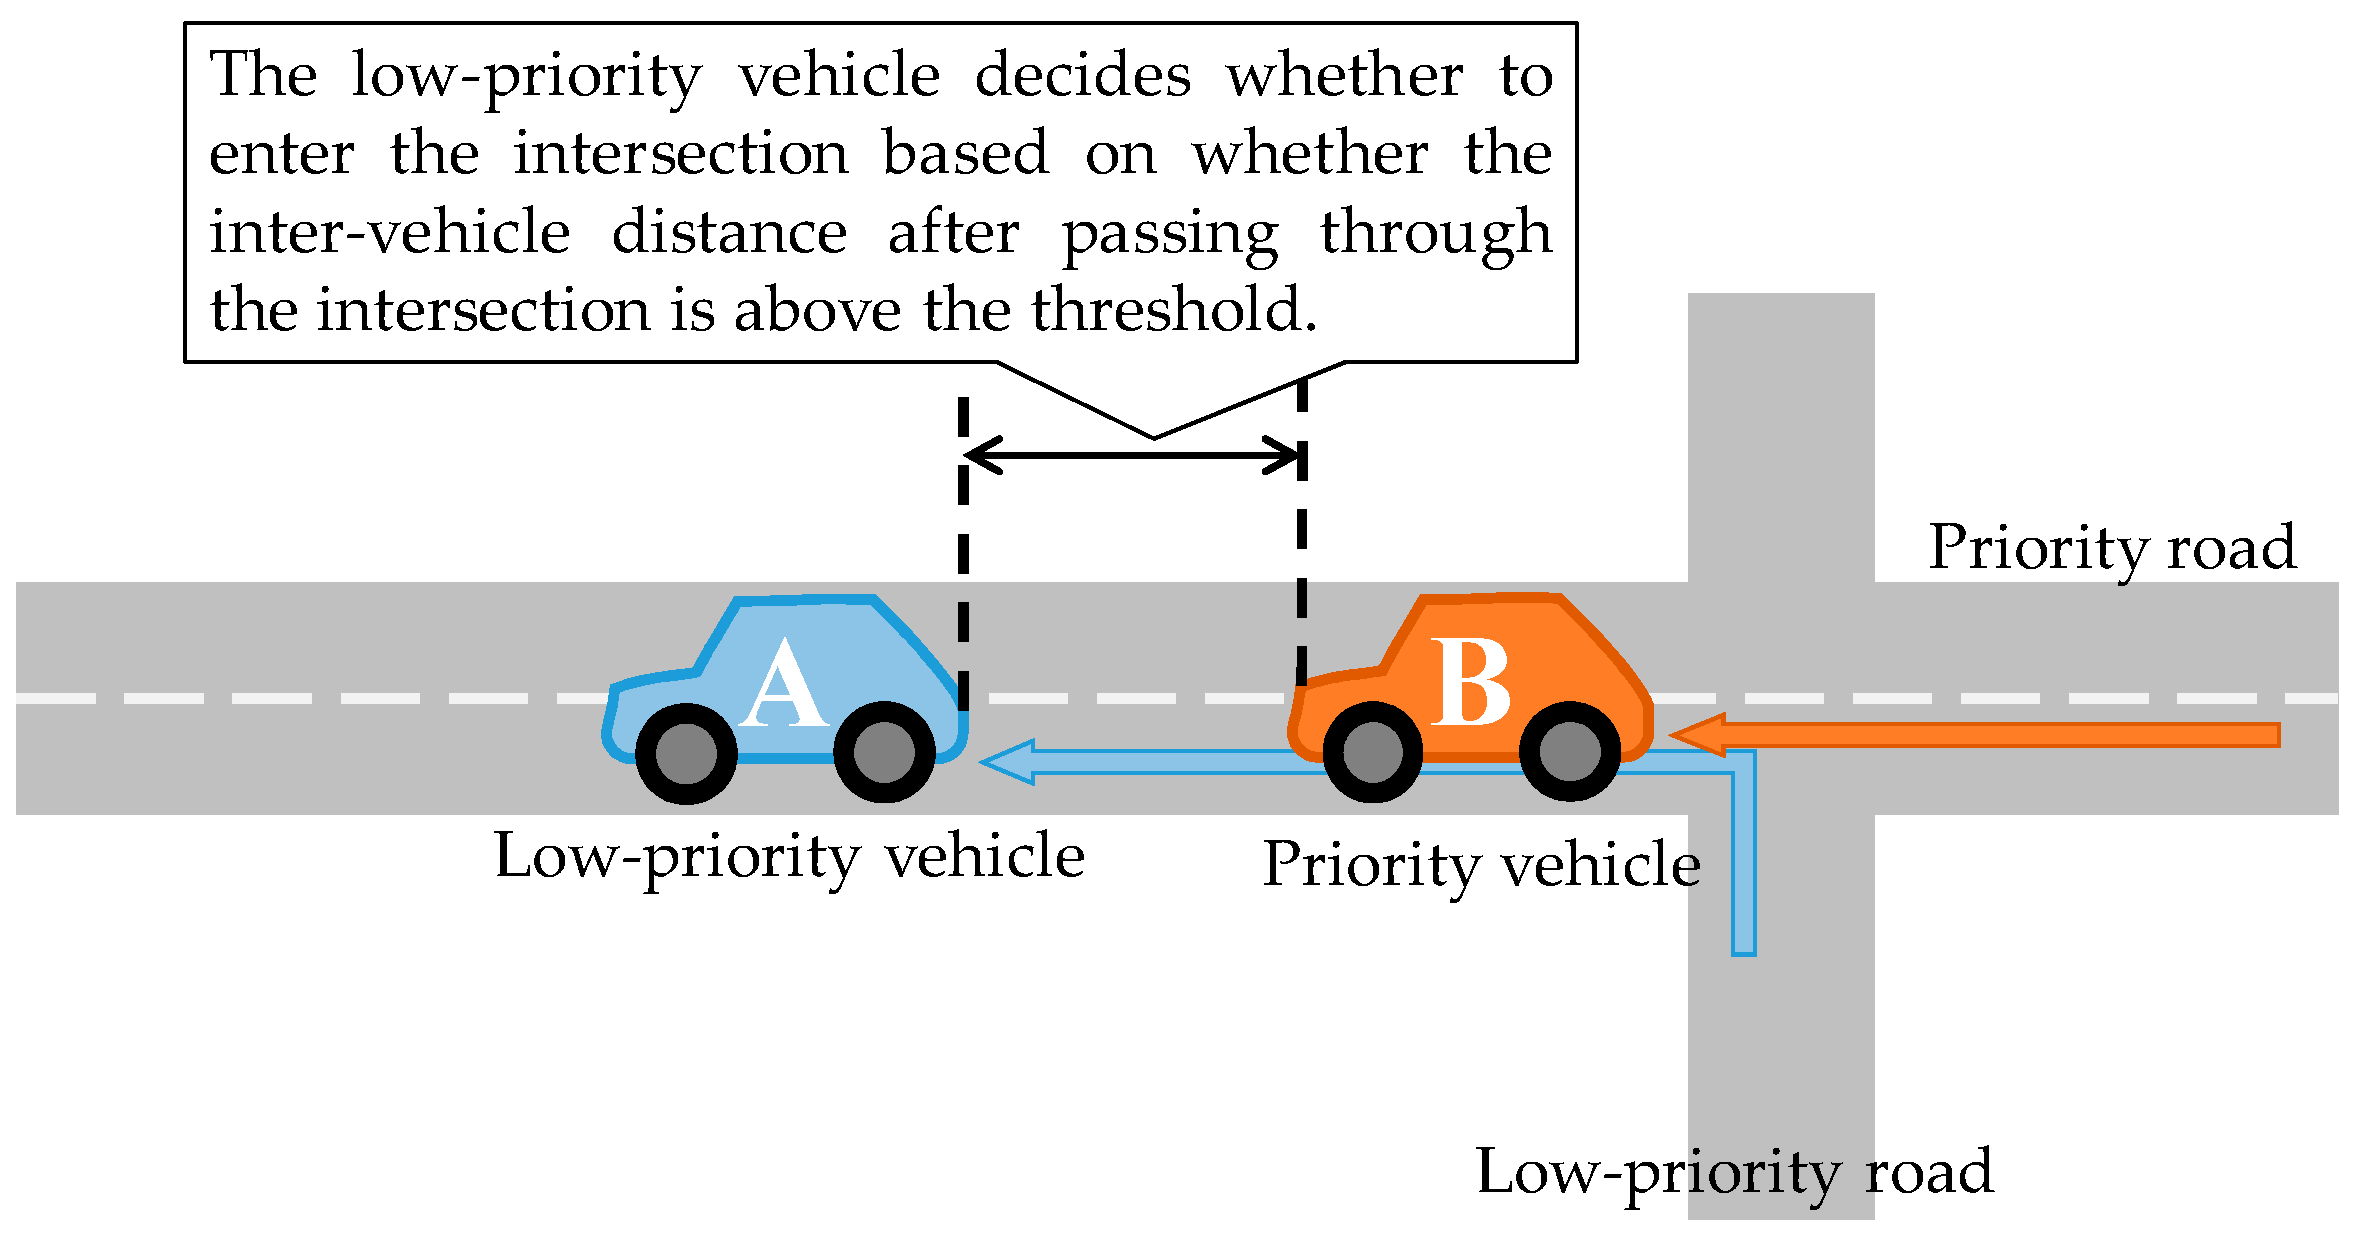
The low-priority vehicle decides whether to enter the intersection based on how far it will be from the priority vehicle in the back after it has passed through the intersection, as shown in Figure 6. The value we set to the inter-vehicle distance threshold was such that the priority vehicle does not need to brake even when the low-priority vehicle moves into a position in front of it. The inter-vehicle distance thresholds for the two types of vehicle were as follows:
  • Self-driven vehicle: The minimum inter-vehicle distance.
  • Human-driven vehicle: The minimum inter-vehicle distance + extra inter-vehicle distance.
In the case of a human-driven vehicle, the higher the speed of the priority vehicle, the greater the inter-vehicle distance that we set. The extra inter-vehicle distance was the distance that the priority vehicle moves per second. For example, if the priority vehicle is running at a speed of 10 km/h = 2.78 m/s, the extra inter-vehicle distance is 2.78 m. If the priority vehicle is running at a speed of 40 km/h = 11.11 m/s, the extra inter-vehicle distance is 11.11 m.

4.2. Differences in Behavior between Self-Driven and Human-Driven Vehicles

Differences in behavior between self-driven and human-driven vehicles adopted in the evaluation system are shown in Figure 7 and Figure 8. These figures indicate the following. Human-driven vehicles respond to the behavior of the vehicle ahead with a delay of the response time. Their speeds change unevenly. In contrast, self-driven vehicles change their speeds smoothly. In the case where the yielding protocol is not in operation, more vehicles can move from a low-priority road into a priority road if they are self-driven vehicles than if they are human-driven vehicles.

4.3. Simulated Field and Simulation Conditions

The simulated field was an unsignalized crossroad where a priority road and a low-priority road intersected, as shown in Figure 9. The roads extended 150 m from the center of the intersection. The speed limit was 40 km/h. Vehicles and pedestrians (with information about their destinations) came in at the point of interest (POI) located at the end of each road. Vehicles departed at POIs at random. Vehicles that departed at the end of the low-priority road selected their destination POIs at random while 75% of the vehicles that departed at the end of the priority road headed for the POI at the other end of the priority road and the remaining 25% selected their destination POIs at random. Pedestrians departed at random POIs at random time for random destinations. Since the destinations were already determined as above, vehicles obtained other vehicles’ turning signals (go straight, turn left, turn right or turn around), which were mentioned in Section 3.7, when they came within 30 m from the intersection.
In the simulation, it was not tried to use image processing to identify a vehicle. Instead, it was assumed that vehicle models can always be identified correctly. Based on the preliminary experiment we had conducted earlier, we set the transmission power of the communication device such that communication was possible up to 100 m. The fixed values shown in Table 6 were used in the simulation.

5. Evaluation Results

The simulation conditions are shown in Table 7. How much the proposed yielding protocol improves the traffic efficiency over the cases where the yielding protocol was not used was evaluated in terms of the intersection passing rate of low-priority vehicles, average number of stops, average stop time, average driving distance, average driving speed, and road occupancy of low-speed vehicles. The simulation was conducted under 4620 different conditions, with the percentage of self-driven vehicles and the number of vehicles coming in varied. Each round of simulation covered 1800 s.

5.1. Intersection Passing Rate

The intersection passing rate is the ratio of the number of vehicles that have passed through the intersection to the number of vehicles that have come in at POIs and started running. It is expressed by:
Intersection   passing   rate = No .   of   vehicles   that   have   passed   through   the   intersection No .   of   vehicles   that   have   started   running
As shown in Figure 10, the intersection passing rate of low-priority vehicles improved in all situations except for the case where the number of vehicles coming in on the priority road was 200, and the number of vehicles coming in on the low-priority road was between 100 and 200. The improvement was prominent in cases where the number of vehicles coming in on the priority road was large, and the number of vehicles coming in on the low-priority road was small. The intersection passing rate improved by 11.28% in the case where 1200 vehicles came in on the priority road and 100 vehicles came in on the low-priority road. As shown in Figure 11, the intersection passing rate improved by 7.80% in the case where the percentage of self-driven vehicles was 60%.
In contrast, the overall intersection passing rate involving both low-priority and priority vehicles improved only in some limited cases where the intersection passing rate of low-priority vehicles improved. For example, it improved by 0.74% when 800 vehicles came in on the priority road, and 100 vehicles came in on the low-priority road. The impact of the proposed yielding protocol on priority vehicles was minimal.

5.2. Average Number of Stops

The average number of stops is the average number of times when the speed of the vehicle that came in at a POI became higher than 0 and then dropped to 0. It is expressed by:
Average   number   of   stops = No .   of   times   when   the   speed   of   Vehicle   n   became   0 No .   of   vehicles   that   began   to   run
As shown in Figure 12, the average number of stops of low-priority vehicles improved in all situations. The improvement was prominent when the number of vehicles coming in on the priority road was large. The average number was reduced by 2.00 when 800 vehicles came in on the priority road, and 150 vehicles came in on the low-priority road. The proposed yielding protocol was the most effective when the percentage of self-driven vehicles was 30%, as shown in Figure 13. The number of stops was reduced by an average of 1.56.

5.3. Average Stop Time

The average stop time is the average duration in which vehicles that started at POIs stood still. It is expressed by:
Average   stop   time   [ s ] = Duration   in   which   Vehicle   n   stood   still   [ s ] No .   of   vehicles   that   began   to   run
As shown in Figure 14, the average stop time of low-priority vehicles improves in all situations except for cases where 200 vehicles came in on the priority road, and 100 to 200 vehicles came in on the low-priority road. The improvement is the most prominent when 800 vehicles came in on the priority road, and 150 vehicles came in on the low-priority road. The average stop time was reduced by an average of 25.49 s. As shown in Figure 15, the yielding protocol was the most effective when the percentage of self-driven vehicles was 40%. The stop time was reduced by an average of 19.07 s. However, when the percentage of self-driven vehicles was 90% or higher, the average stop time increased. The reason is that, since the maximum rate of deceleration of self-driven vehicles was low, there may be many cases where self-driven vehicles judged that they cannot stop safely and did not agree to yield.

5.4. Average Driving Distance

The average driving distance is that of vehicles that came in at POIs and began to run. It is expressed by:
Average   driving   distance   [ m ] = Driving   distance   of   Vehicle   n [ m ] No .   of   vehicles   that   began   to   run
Since vehicles disappear when they reach their destinations, the maximum driving distance is 300 m.
As shown in Figure 16, the average driving distance of low-priority vehicles shows improvement in all situations except for cases where 200 vehicles came in on the priority road, and 100 to 200 vehicles came in on the low-priority road. The improvement is marked in cases where both the number of vehicles that came in on the priority road and that of vehicles that came in on the low-priority road were large. The driving distance increased by an average of 41.00 m when 1400 vehicles came in on the priority road, and 200 vehicles came in on the low-priority road. As shown in Figure 17, the average driving distance was the longest when the percentage of self-driven vehicles was 60%. It was extended by an average of 30.86 m.

5.5. Average Driving Speed

The average driving speed is that of vehicles from the time they started at POIs to the time when they reached their destinations. It is expressed by:
Average   driving   speed   [ m / s ] = Driving   distance   of   Vehicle   n   [ m ] Time   it   took   for   Vehicle   n   to   reach   its   destination   [ s ] No .   of   vehicles   that   have   started   running
If a vehicle had not reached its destination by the time the simulation terminated, its speed was calculated by dividing the distance by the time up to the point it reached.
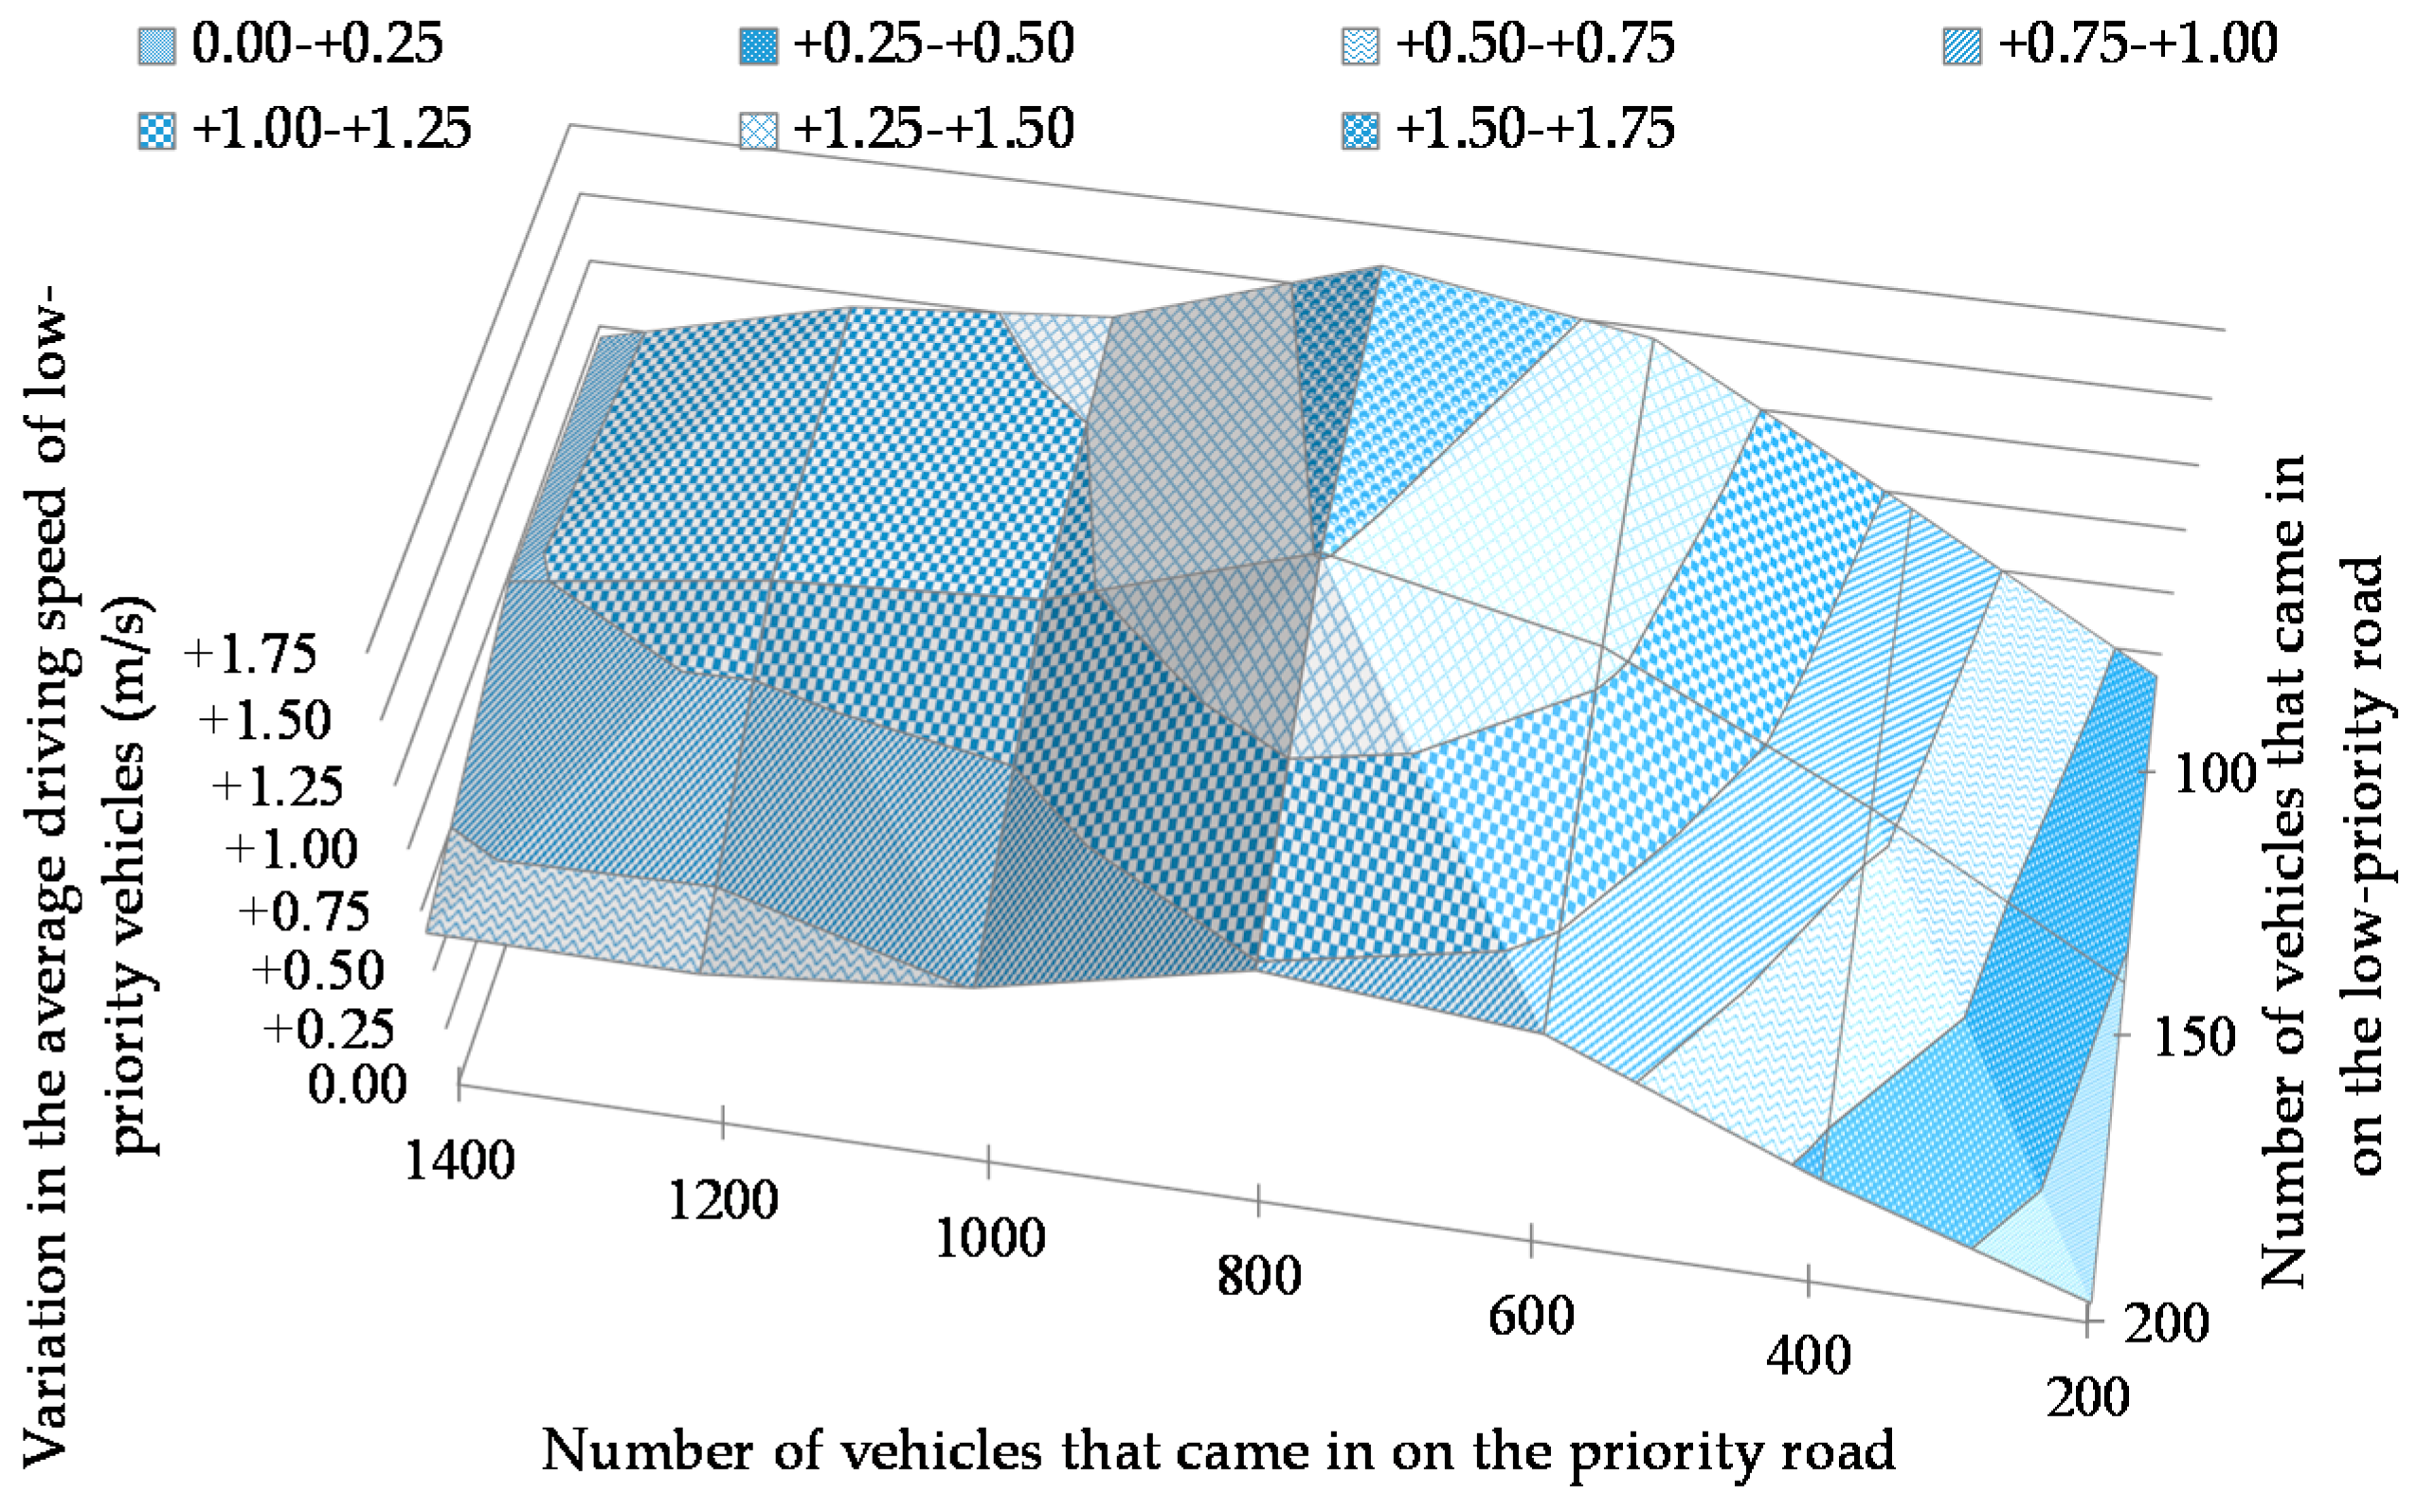
As shown in Figure 18, the average driving speed of low-priority vehicles improved in all situations. The improvement was prominent when the number of vehicles coming in on the low-priority road was small. The driving speed increased by an average of 1.60 m/s when 800 vehicles came in on the priority road, and 100 vehicles came in on the low-priority road. As shown in Figure 19, the average speed was the highest when the percentage of self-driven vehicles was 60%. It increased by an average of 1.00 m/s.

5.6. Road Occupancy of Low-Speed Vehicles

The road occupancy of low-speed vehicles is the average road occupancy of vehicles that came in at POIs and were running at below the defined slow speed. It is expressed by:
Road   occupancy   of   low speed   vehicles          = Total   length   of   vehicles   running   below   the   defined   slow   speed   [ m ] Total   length   of   the   roads   [ m ] Number   of   times   the   road   occupancy   was   measured
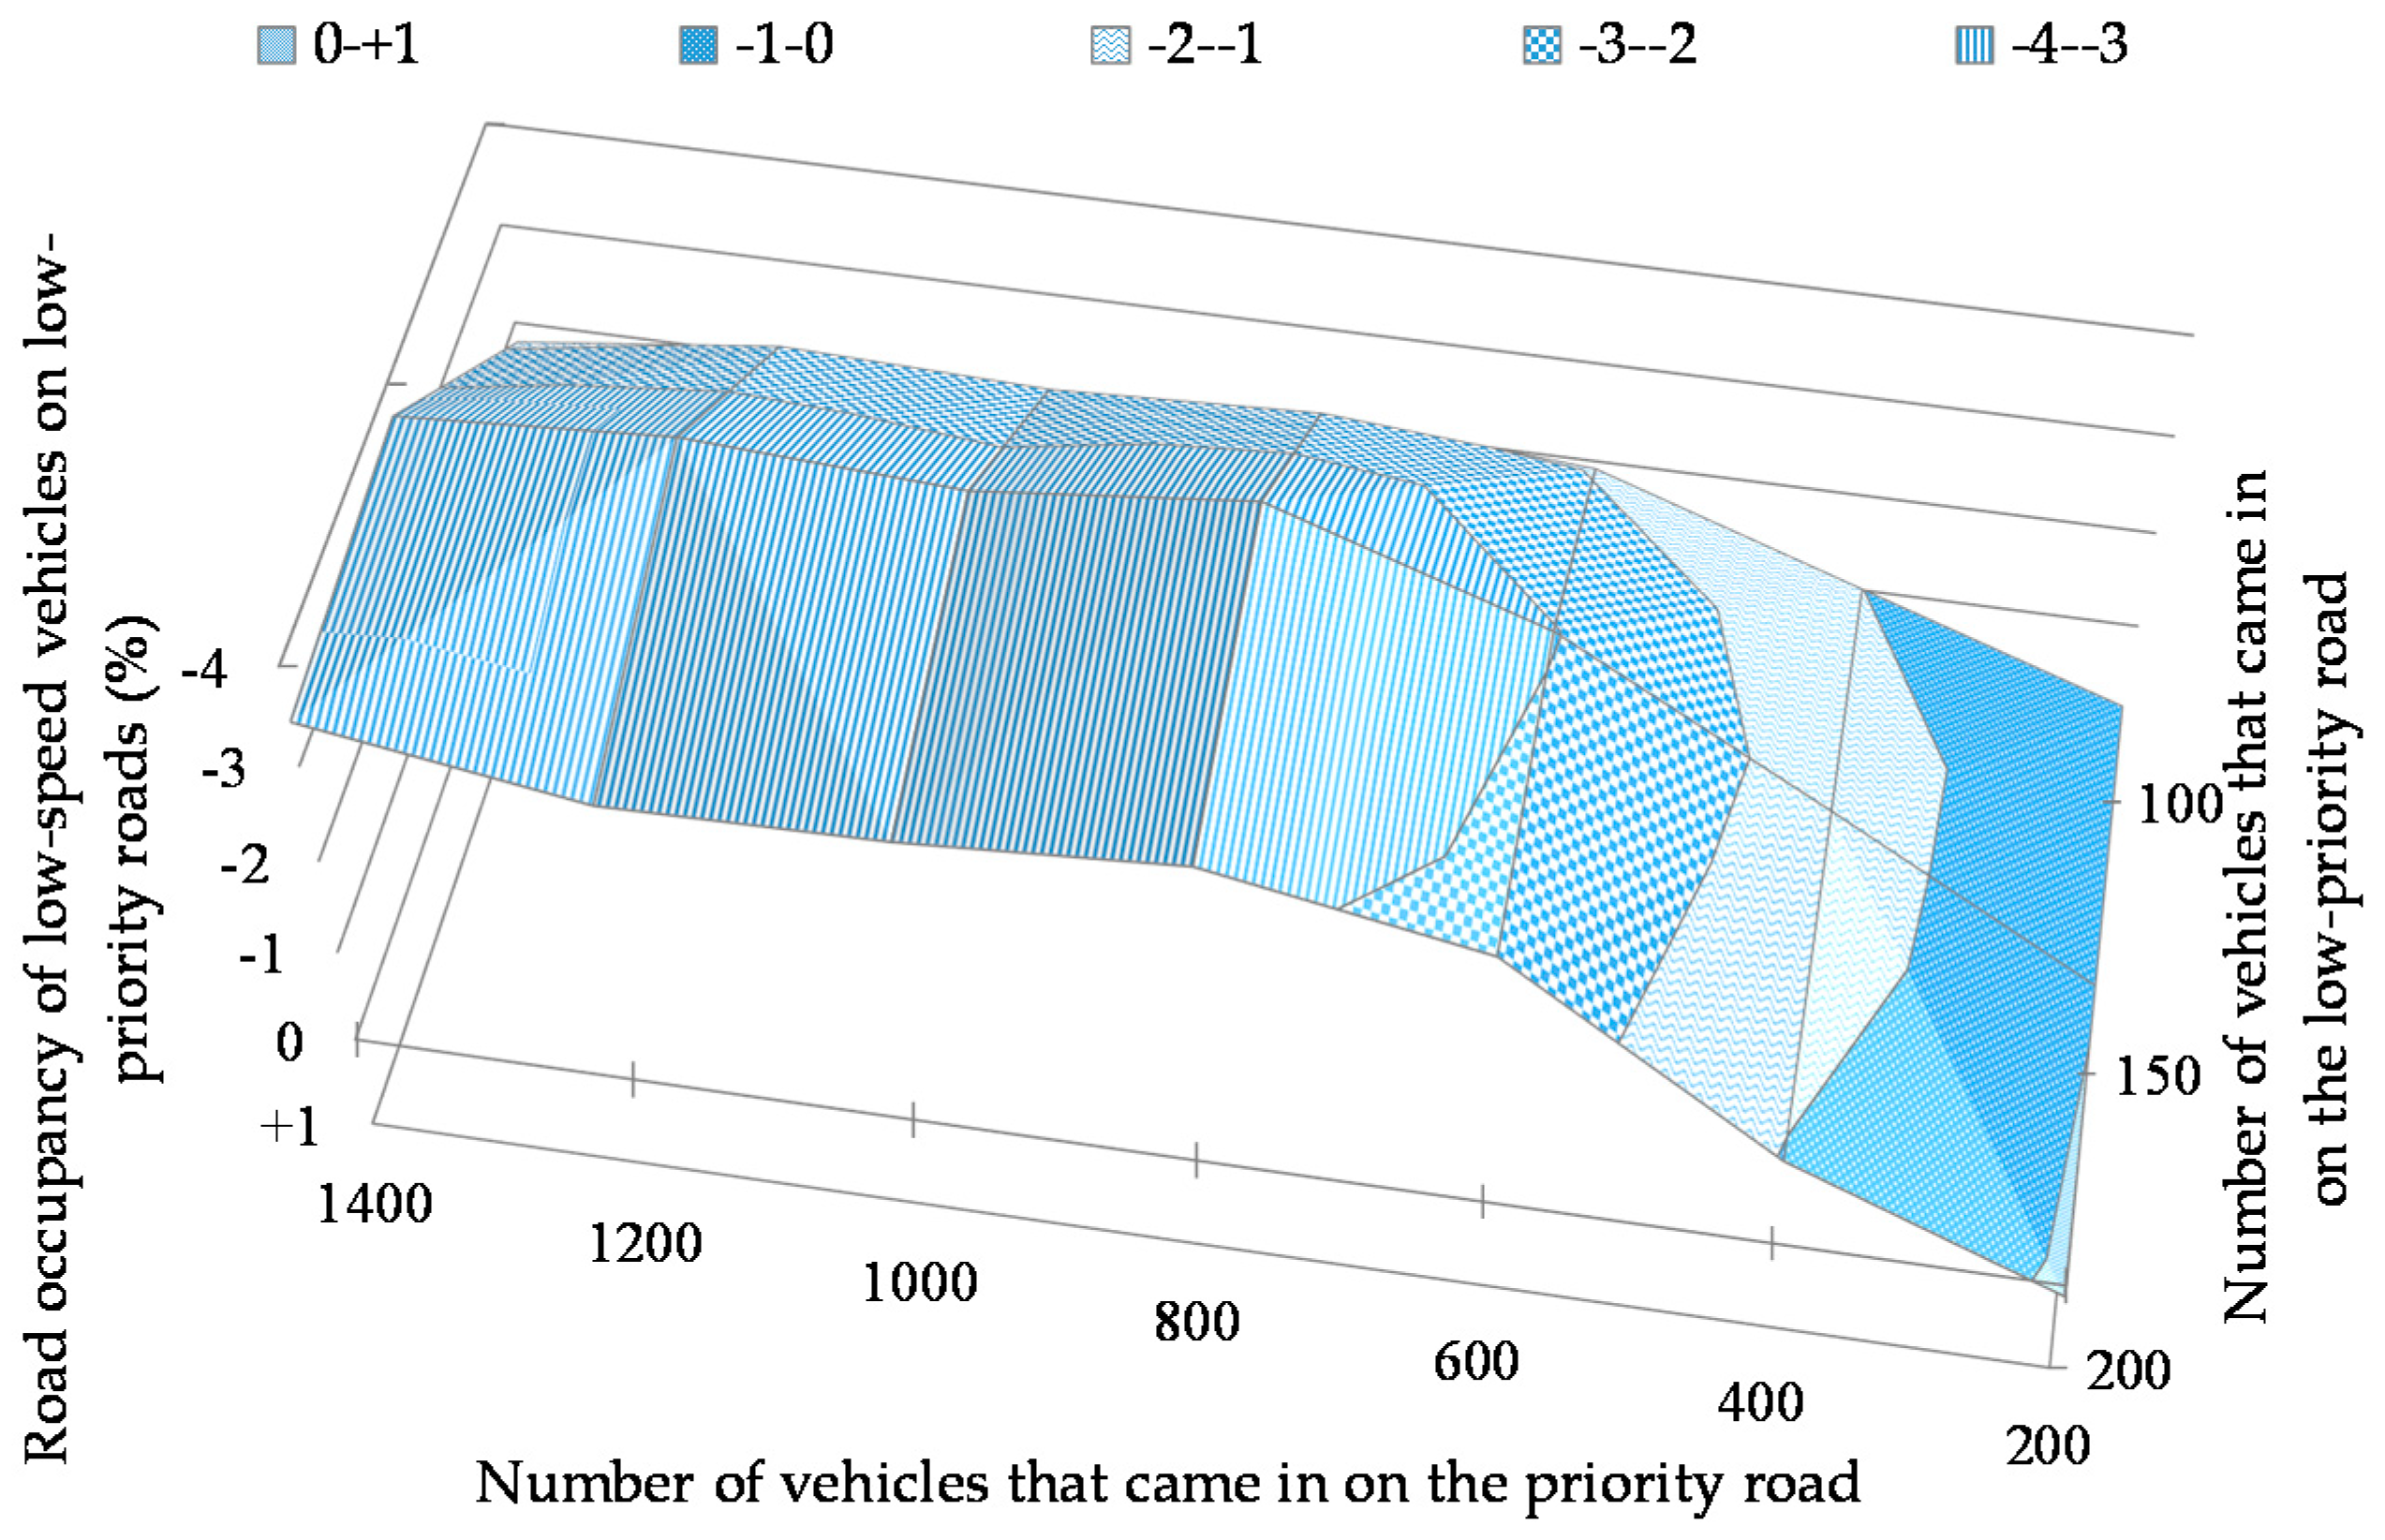
As shown in Figure 20, the road occupancy of low-speed vehicles on the low-priority road improved in all situations except for cases where 200 vehicles came in on the priority road, and 200 vehicles came in on the low-priority road. It improved more when the number of vehicles coming in on the priority road was larger. It was reduced by 3.95% when 800 vehicles came in on the priority road, and 150 vehicles came in on the low-priority road. As shown in Figure 21, it was the lowest when the percentage of self-driven vehicles was 60%. It was reduced by 2.50%.

5.7. Resolution of Differences in Judgments between Self-Driven and Human-Driven Vehicles

As can be seen from Figure 11, Figure 13, Figure 15, Figure 17, Figure 19 and Figure 21, every evaluation item showed the most significant improvement when the percentage of self-driven vehicles was around 50%. As long as all vehicles observe the yielding protocol, they behave according to the common yielding algorithm. Thus, if the condition in which vehicles come in is the same, the traffic condition will be more or less the same, although there may be minor variations as a result of yielding no matter what the percentage of self-driven vehicles is. Therefore, the result that a high degree of improvement was shown when the percentage of self-driven vehicles was around 50% implies that, if the yielding protocol is not used, the traffic condition was worse at that percentage than at other percentages. The fact that the yielding protocol remedies this situation means that it resolves differences in judgments between self-driven and human-driven vehicles.

5.8. Traffic Improvement Effect

The improvement was smaller in any evaluation item when the number of vehicles coming in on the priority road was small. The reason is that there were fewer occasions for low-priority vehicles to require yielding. When priority vehicles yield, the density of vehicles on the priority road rises, and also more priority vehicles need to slow down or stop. This implies that there is a trade-off relation between the traffic efficiency of low-priority vehicles and that of priority vehicles. If the degree of degradation in the traffic efficiency of priority vehicles was greater than the degree of improvement in the traffic efficiency of low-priority vehicles, the overall traffic efficiency is reduced. If we are to improve the overall traffic efficiency, it is necessary to revise the conditions on which the yielding decision is based in such a way that vehicles do not agree to yield if the expected improvement in traffic efficiency is minimal.
There were some situations in which low-priority vehicles did not see any improvement. The reason is that the present yielding algorithms do not allow multiple instances of yielding to taking place simultaneously. It will be necessary to improve the yielding algorithms so that multiple instances of yielding can proceed simultaneously.

6. Conclusions

This paper has proposed a yielding protocol that applies to a crossroad with no traffic control infrastructure (traffic light and roadside unit). Using simulation, we have examined how various traffic indicators improve when the proposed yield protocol is introduced. The examined traffic indicators were the intersection passing rate of vehicles on low-priority roads, average number of stops, average stop time, average driving distance, average driving speed, and road occupancy of low-speed vehicles. The simulation results showed that the yielding protocol improves the traffic efficiency of vehicles on low-priority roads. The improvement was the greatest when the percentage of self-driven vehicles was around 50%. This implies that the proposed yielding protocol resolves the differences in driving judgments between self-driven and human-driven vehicles. The overall improvement in traffic efficiency has not been evaluated sufficiently because the evaluation conditions were limited. The evaluation with the limited conditions showed that the improvement was not substantial. It is necessary to revise the conditions on which yielding decisions are based to enhance the effect of yielding.
We will refine the yielding conditions to increase the efficiency of yielding, and examine the effect of the yielding protocol using more varied and complex road scenarios. It is also necessary to study yielding patterns that take account of not only a crossroads where roads intersect at a right angle but also intersections when roads intersect at different angles.

Author Contributions

H.Y. designed the proposed method, developed the software prototype of the evaluation system, collected the evaluation data and wrote the initial draft of the paper. K.T. provided the direction for his research activities and refined the proposed method, the analysis of the evaluation results and the writing of the paper.

Funding

This research received no external funding.

Conflicts of Interest

The authors declare no conflict of interest.

References

  1. Cross-Ministerial Strategic Innovation Promotion Program (SIP)—Innovation of Automated Driving for Universal Services, Research & Development Plan, Cabinet Office, Government of Japan (online). Available online: http://www8.cao.go.jp/cstp/gaiyo/sip/keikaku/6_jidousoukou.pdf (accessed on 5 September 2017).
  2. Tsugawa, S. Challenges of automated driving. IEICE Fundam. Rev. 2016, 10, 93–99. [Google Scholar]
  3. Sharon, G.; Stone, P. A protocol for mixed autonomous and human-operated vehicles at intersections. In Proceedings of the International Conference on Autonomous Agents and Multiagent Systems (AAMAS2017) Workshops, São Paulo, Brazil, 8–12 May 2017; pp. 151–167. [Google Scholar]
  4. Furukawa, H.; Kiyohara, R. A study for improvement traffic flow method at intersection in the period of diffusion of autonomous vehicle. In Proceedings of the Multimedia, Distributed, Corporative, and Mobile Symposium (DICOMO), Awara-shi, Fukui, Japan, 4–6 October 2018; pp. 1355–1362. [Google Scholar]
  5. Zhang, R.; Schmutz, F.; Gerard, K.; Pomini, A.; Basseto, L.; Hassen, S.B.; Ishikawa, A.; Ozgunes, I.; Tonguz, O. Virtual traffic lights: System design and implementation. In Proceedings of the 88th IEEE Vehicular Technology Conference, Chicago, IL, USA, 27–30 August 2018. [Google Scholar]
  6. Ferreira, M.; Fernandes, R.; Conceiçao, H.; Viriyasitavat, W.; Tonguz, O.K. Self-organized traffic control. In Proceedings of the 7th ACM international workshop on Vehicular Internetworking, Chicago, IL, USA, 20–24 September 2010; pp. 85–90. [Google Scholar]
  7. Pisa, I.; Boquet, G.; Vicario, J.L.; Morell, A.; Serrano, J. VAIMA: A V2V based intersection traffic management algorithm. In Proceedings of the 14th Annual Conference on Wireless On-demand Network Systems and Services, Isola, France, 6–7 February 2018; pp. 125–128. [Google Scholar]
  8. Yajima, H.; Takami, K. Inter-Vehicle Communication Protocol Design for a Yielding Decision at an Unsignalized Intersection and Evaluation of the Protocol Using Radio Control Cars Equipped with Raspberry Pi. Computers 2019, 8, 16. [Google Scholar] [CrossRef]
  9. Dresner, K.; Stone, P. A multiagent approach to autonomous intersection management. J. Artif. Intell. Res. 2008, 31, 591–656. [Google Scholar] [CrossRef]
  10. 700 MHz Band Intelligent Transport Systems: ver.1.3 (ARIB: Association of Radio Industries and Businesses) (Online). Available online: http://www.arib.or.jp/english/html/overview/doc/5-STD-T109v1_3-E1.pdf (accessed on 13 September 2018).
  11. Dehghan, A.; Masood, S.Z.; Shu, G.; Ortiz, E.G. View Independent Vehicle Make, Model and Color Recognition Using Convolutional Neural Network (Online). Available online: https://arxiv.org/pdf/1702.01721.pdf (accessed on 10 February 2019).
  12. Zhao, S.; Zhu, X.L.; Li, Y.B.; Zhang, L. Research on the recognition of car models based on deep-learning networks. In Proceedings of the 2017 Asia-Pacific Engineering and Technology Conference, Lancaster, PA, USA, 25–26 May 2017; pp. 1770–1775. [Google Scholar]
  13. Space-Time Engineering (Online). Available online: https://www.spacetime-eng.com (accessed on 16 October 2017).
  14. Treiber, M.; Hennecke, A.; Helbing, D. Congested traffic states in empirical observations and microscopic simulations. Phys. Rev. E 2000, 62, 1805–1824. [Google Scholar] [CrossRef]
  15. Johansson, G.; Rumar, K. Drivers’ brake reaction times. Hum. Factors 1971, 13, 23–27. [Google Scholar] [CrossRef] [PubMed]
  16. Tanaka, H.; Takemori, D.; Miyachi, T.; Iribe, Y.; Oguri, H. The study on the scare and secure for adaptive driver assistant system. DENSO Tech. Rev. 2016, 21, 30–36. [Google Scholar]
Figure 1. Overview of the yielding process.
Futureinternet 11 00110 g001
Figure 2. Determining the relative position of the communicating vehicle. The red vehicle is the own vehicle and the white vehicle is the other vehicle. (a) The own vehicle is the requesting vehicle; (b) the own vehicle is the responding vehicle.
Futureinternet 11 00110 g002
Figure 3. Determining the relative direction of the communicating vehicle. The red vehicle is the own vehicle.
Futureinternet 11 00110 g003
Figure 4. Yielding decision flow. TL: Traffic light; CS: Conflict situation; SS: Stop safely; RP: Road priority; VI: Vehicle beyond the intersection; VB: Vehicle in the back; NQ: Number of queuing vehicles; PS: Pedestrians in the surroundings; AS: Availability of enough space. (a) Patterns 1 and 4; (b) patterns 2 and 3.
Futureinternet 11 00110 g004
Figure 5. State transition diagram for the yielding algorithms. R1: Receive the message; R2: Receive a thanks message or receive a cancellation message; R3: Receive a time-out message; C1: Communicating vehicle unidentified; C2: Communicating vehicle identified; A1: Incomplete agreement; A2: Complete agreement; M1: Can move ahead safely.
Futureinternet 11 00110 g005
Figure 6. Concept of the inter-vehicle distance based on which the low-priority vehicle decides whether to enter the intersection.
Futureinternet 11 00110 g006
Figure 7. Impact on the vehicle in the back after the low-priority vehicle has stopped at, and then passed through, the intersection. (a) Human-driven vehicle; (b) self-driven vehicle.
Futureinternet 11 00110 g007
Figure 8. The behavior of vehicles that move from the low-priority road into the priority road in the case where the yielding protocol is not in operation. (a) Human-driven vehicle; (b) self-driven vehicle.
Futureinternet 11 00110 g008
Figure 9. Simulated field.
Futureinternet 11 00110 g009
Figure 10. Variation in the intersection passing rate of low-priority vehicles when the number of vehicles that came in were varied. The intersection passing rate was the average for the entire percentage range of self-driven vehicles.
Futureinternet 11 00110 g010
Figure 11. Variation in the intersection passing rate of low-priority vehicles when the percentage of self-driven vehicles was varied. The intersection passing rate was the average for all the vehicles that came in.
Futureinternet 11 00110 g011
Figure 12. Variation in the average number of stops of low-priority vehicles when the number of vehicles coming in was varied. The average number of stops was the average for the entire percentage range of self-driven vehicles.
Futureinternet 11 00110 g012
Figure 13. Variation in the average number of stops of low-priority vehicles when the percentage of self-driven vehicles was varied. The average number of stops was the average for all the vehicles that came in.
Futureinternet 11 00110 g013
Figure 14. Variation in the average stop time when the number of vehicles that came in was varied. The average stop time was the average for the entire percentage range of self-driven vehicles.
Futureinternet 11 00110 g014
Figure 15. Variation in the average stop time of low-priority vehicles when the percentage of self-driven vehicles was varied. The average stop time was the average for all the vehicles that came in.
Futureinternet 11 00110 g015
Figure 16. Variation in the average driving distance of low-priority vehicles that came in when the number of vehicles that came in was varied. The average driving distance was the average for the entire percentage range of self-driven vehicles.
Futureinternet 11 00110 g016
Figure 17. Variation in the average driving distance of low-priority vehicles when the percentage of self-driven vehicles was varied. The average driving distance was the average for all the vehicles that came in.
Futureinternet 11 00110 g017
Figure 18. Variation in the average driving speed of low-priority vehicles when the number of vehicles that came in was varied. The average driving speed was the average for the entire percentage range of self-driven vehicles.
Futureinternet 11 00110 g018
Figure 19. Variation in the average driving speed of low-priority vehicles when the percentage of self-driven vehicles was varied. The average driving speed was the average for all the vehicles that came in.
Futureinternet 11 00110 g019
Figure 20. Variation in the road occupancy of low-speed vehicles on low-priority roads when the number of vehicles that came in was varied. The average driving speed was the average for the entire percentage range of self-driven vehicles.
Futureinternet 11 00110 g020
Figure 21. Variation in the road occupancy of low-speed vehicles on low-priority roads when the percentage of self-driven vehicles was varied. The average driving speed was the average for all the vehicles that came in.
Futureinternet 11 00110 g021
Table 1. Factors that cause differences in judgments between self-driven and human-driven vehicles.
Factors that Cause Differences in JudgmentsSelf-Driven VehiclesHuman-Driven Vehicles
Response timeSelf-driven << human-driven
Max. rate of accelerationSelf-driven < human-driven
Max. rate of deceleration
Min. inter-vehicle distanceFixedWidely varied
Table 2. Comparison of methods of controlling the traffic of both self-driven and human-driven vehicles.
Method[3][4][5,7]Proposed Method
Comparison Item
Intersection shapeCrossroads with multiple lanesT-shapedCrossroads
Traffic lightNone
Roadside unitPresentNone
Prioritization of roads at the intersectionNoYesNoYes
PedestriansNot consideredConsidered
Differences in judgments between self-driven and human-driven vehiclesNot consideredOnly the difference in response time is consideredNot consideredAll factors shown in Table 1 are considered
Control of entry into the intersectionThe order in which vehicles enter each lane at the intersection is adjusted based on the intersection passing reservation notices that vehicles send to the roadside unitIntersection passing times of competing vehicles are adjusted based on the entry requests they send to the roadside unitThe order in which two competing vehicles enter the intersection is adjusted based on the intersection passing time each sends to the other directly via inter-vehicle communicationWhether a vehicle yields the way to the other vehicle is adjusted based on the entry request the latter sends to the former via inter-vehicle communication
Table 3. Situations in which yielding is required.
Pattern No.SituationSchematic View
1Turning left from a low-priority road Futureinternet 11 00110 i001
2Turning right from a low-priority road
3Going straight from a low-priority road
4Turning right from a priority road
(There are no lanes that are dedicated to vehicles going to any specific direction)
Futureinternet 11 00110 i002
Table 4. Yielding message structure.
ItemMessage Element
HeaderYielding message identifier
Message length
Yielding ID
BodySender vehicle informationMaker
Vehicle model
Vehicle color
Longitude
Latitude
Angle of moving direction
Yielding pattern number
Message type
Table 5. Parameter values that cause differences in operations between self-driven and human-driven vehicles.
ParameterSelf-Driven VehicleHuman-Driven Vehicle
Response time [s]0.10.9
Max. rate of acceleration [G]0.150.25
Max. rate of deceleration [G]−0.175−0.25
Min. inter-vehicle distance [m]32.5~3.5
Table 6. Thresholds.
ItemValue
Defined slow speed2.78 m/s
Number of queuing low-priority vehicles5
Distance to the vehicle in the back50 m
Maximum communication distance100 m
Time-out5 s
Table 7. Simulation conditions.
ItemValue
Simulation time1800 s
Execution time step100 ms
Whether the yielding protocol is in operationYes and no
Percentage of self-driven vehicles0, 10, 20, 30, 40, 50, 60, 70, 80, 90, 100
Number of vehicles that came in on the priority road100, 200, 300,400, 500, 600, 700 per POI
Number of vehicles that came in on the low-priority road50, 75, 100 per POI
Number of pedestrians20
Mobility seed value123-132