5.1. Assessment of the Measurement Model
We use the partial least squares (PLS) approach to analyze the data for both the measurement and structural models. The main PLS analysis tool we used SmartPLS 2.0. We selected the PLS approach because it uses a two-step process to test proposed models: (1) An assessment of the measurement model and; (2) an evaluation of the structural model. In other words, the PLS approach can simultaneously evaluate the reliability and validity of the study measures and the structural model (hypothesis test). Prior to hypothesis testing, we tested the measurement model to confirm the reliability and validity (convergent and discriminant) of the measures. For this purpose, we used three test results: (1) Cronbach’s alpha (construct reliability); (2) factor loadings for individual item validity, composite reliability (CR), and average variance extracted (AVE) (convergent validity test) and; (3) the square root of AVE and correlation value (discriminant validity test). First, to confirm reliability, the Cronbach’s alpha should be greater than 0.7 [
46]. Second, the factor loading values for each item and CR, and for the AVE should be greater than 0.7 and 0.5, respectively [
47]. Finally, the discriminant validity, which measures the lack of relationship among items, can be confirmed by comparing the square root of AVE and correlation values. To confirm discriminant validity, the square root of AVE should be greater than the correlation values [
47].
First, we analyzed the descriptive statistics for each construct using SPSS 25.
Table 3 shows the results. Then, we conducted the uni-dimensionality validation tests referred to as two types of validity (convergent and discriminant validity) and item reliability using SmartPLS 2.0.
Table 4 shows the result of the reliability test for the measurement model. The test showed that three items (eng3, fat4, and id3) reduced reliability; we, therefore, removed these items. Thereafter, the Cronbach’s alpha value for all latent constructs fulfilled the recommended value (0.7), ranging from 0.789 to 0.870. The tests thus verified the reliability of the measurement model.
As shown in
Table 5, all items fulfilled the factor loading threshold (0.7). Furthermore, the CR for all latent constructs ranged from 0.811 to 0.901, and the AVE ranged from 0.589 to 0.752, indicating convergent validity. These results show that each item accurately measured the latent constructs measured in the research model. To further confirm this result, we conducted exploratory factor analysis (EFA) to test the validity of the measures and identify any potential cross-loading issues.
Table 6 shows the EFA results 6. All items loaded well to the latent constructs that they were designed to measure without any cross-loading issues; we thus confirmed the validity of measurement model.
Finally, we verified discriminant validity to confirm that the items were not related to other items or latent constructs other than the latent constructs they were designed to measure. As shown in
Table 7, the values in the diagonal representing the square root of AVE for each latent construct were greater than the longitudinal and transverse correlation values. We thus confirmed discriminant validity. The measurement model test results enabled us to fully verify the reliability and validity of each measure, which allowed us to formulate the structural model to test the proposed hypotheses.
Since we used various measures in relation to the same participants and since each construct showed a relatively high degree of correlation, common method bias (CMB) was a real possibility in this study. To test for CMB issues, we used Harman’s [
48] single factor method. The method performs exploratory factor analysis on all the variables and assumes that bias exists when variance for a single factor is large based on factors that had eigenvalues greater than 1 [
49]. Unrotated factor analysis using principal component analysis yielded eight factors. The first factor explained about 32.9% of the variance, which certainly does not constitute the majority of the total variance, given that Malhotra et al. [
50] reported that 40% was not a majority of the variance. Thus, the result of Harman’s single-factor test indicated that the CMB in this study was not likely a source of major issues.
5.2. The Structural Model Test
After confirming the measurement model, we tested the independent relationships (H1 to H6) among the study’s proposed constructs using variance-based structural equation modeling (SEM) with the collected data. We formulated the structural model with SmartPLS 2.0, generating two important values: The path coefficients (standardized betas:
β) and the squared multiple correlations (R
2) value for each endogenous variable. Path coefficients indicate the strength of the relationships between two constructs. Acceptance or rejection of hypotheses is based on the value of the path coefficient along with the corresponding
t-value. The squared multiple correlations (R
2) value for each endogenous construct indicates the predictive power of the research model [
47]. The R
2 values can be used to determine the amount of variance explained by exogenous constructs within the structural model [
51].
As shown in
Figure 3, we found that three external constructs had significant positive impacts on SNS fatigue, which was also significantly associated with living disorder, though the strengths of the paths varied. First, irrelevant information overload had a standardized path coefficient of 0.297 with a
t-value of 4.120, which was significant at
p < 0.01. Thus, H1 was supported. This result implies that there is a large amount of information on SNSs, but much of it is not relevant to users’ purposes. This predominance of irrelevant information makes it necessary for SNS users to spend considerable time searching for the information they want. This phenomenon can cause immense mental and physical fatigue among SNS users. In this regard, Boyd and Ellison [
3] argued that SNSs are the main gateway to substantial information production, but that excessive unnecessary information is generated, which may increase fatigue by increasing SNS users’ Internet usage time.
Second, we found that engagement (
β = 0.323,
t-value = 5.129) and maintaining self-reputation (
β = 0.406,
t-value = 5.235) were positively associated with SNS fatigue. Thus, H3 and H4 were supported at
p < 0.01. These results concern SNS users’ personal use habits, suggesting that users become immersed in SNSs to express themselves on the web, and this phenomenon results in transient SNS use, resulting in fatigue. Prior studies e.g., [
10,
52] have shown that transient commitment to specific services produced negative results. In addition, many SNS users share information about their interests on the web with others, and constantly strive to maintain their reputations by garnering praise from others who use this information. This process leads to excessive SNS use, resulting in mental and physical fatigue [
20]. Among the three constructs, maintaining self-reputation had the greatest effect on SNS fatigue.
Meanwhile, we did not find a significant association between open reachability and SNS fatigue; therefore, H2 was rejected. These results can be interpreted as evidence that users use SNS in self-centered manners. In other words, the concept of open reachability refers to the existence of open communication methods between SNS users and others who surround them. Certain SNS users are always openly communicating—for example, sending texts or providing updates to other users with whom they have relationships. In this sense, if an SNS user ignores all communications from other users, the user will not personally feel particularly high levels of SNS fatigue. Park and Kim [
13] claimed that open communication among both information producers and consumers of SNSs is a great advantage of SNSs. However, users often use SNSs for the purpose of self-expression and ignore information about other people.
Regarding the relationship between the constructs involved in the process of reduced intention to use SNSs, first, SNS fatigue had a significant effect (at
p < 0.01) on living disorder (
β = 0.411,
t-value = 7.236). Thus, H5 was supported. This result implies that when users suffer SNS use-related fatigue, they experience various living disorders in their daily lives. Between 2017 and 2018, as various information technologies become increasingly popular, the number of SNS users worldwide expanded from 2.46 billion to 2.62 billion [
53]. Kuss et al. [
40] claimed that proactive use of SNSs may have an adverse effect on privacy and business. Furthermore, Turel et al. [
54] argued that if the technology used during work results in stress or exhaustion, it causes conflict between technology and life, which negatively affects the latter. Second, our analysis showed a significant relationship between living disorder and reduced SNS use intention, with a path coefficient of 0.324 and a
t-value of 4.322. Thus, H6 was supported at
p < 0.01. This result is consistent with prior studies e.g., [
20,
31] showing that the addictive use of SNSs leads to both living and job disorders that negatively influence users’ intentions to use the services.
Figure 3 shows the structural model analysis of the direct effects (H1 to H6) and
Table 8 summarizes the results of the hypotheses tests (H1 to H6).
The R2 of the endogenous variables suggested that the four external constructs—irrelevant information overload, open reachability, engagement, and maintaining self-reputation—explained 51.8% of the variance in SNS fatigue, which explained 16.9% of the variance in living disorder. These results imply that the direction in which the four exogenous variables move determined 51.8% of the information related to SNS fatigue (endogenous variable). Similarly, 16.9% of the information related to living disorder moved in the same direction as SNS fatigue. Lastly, living disorder explained 10.5% of the information related to reduced SNS use intention.
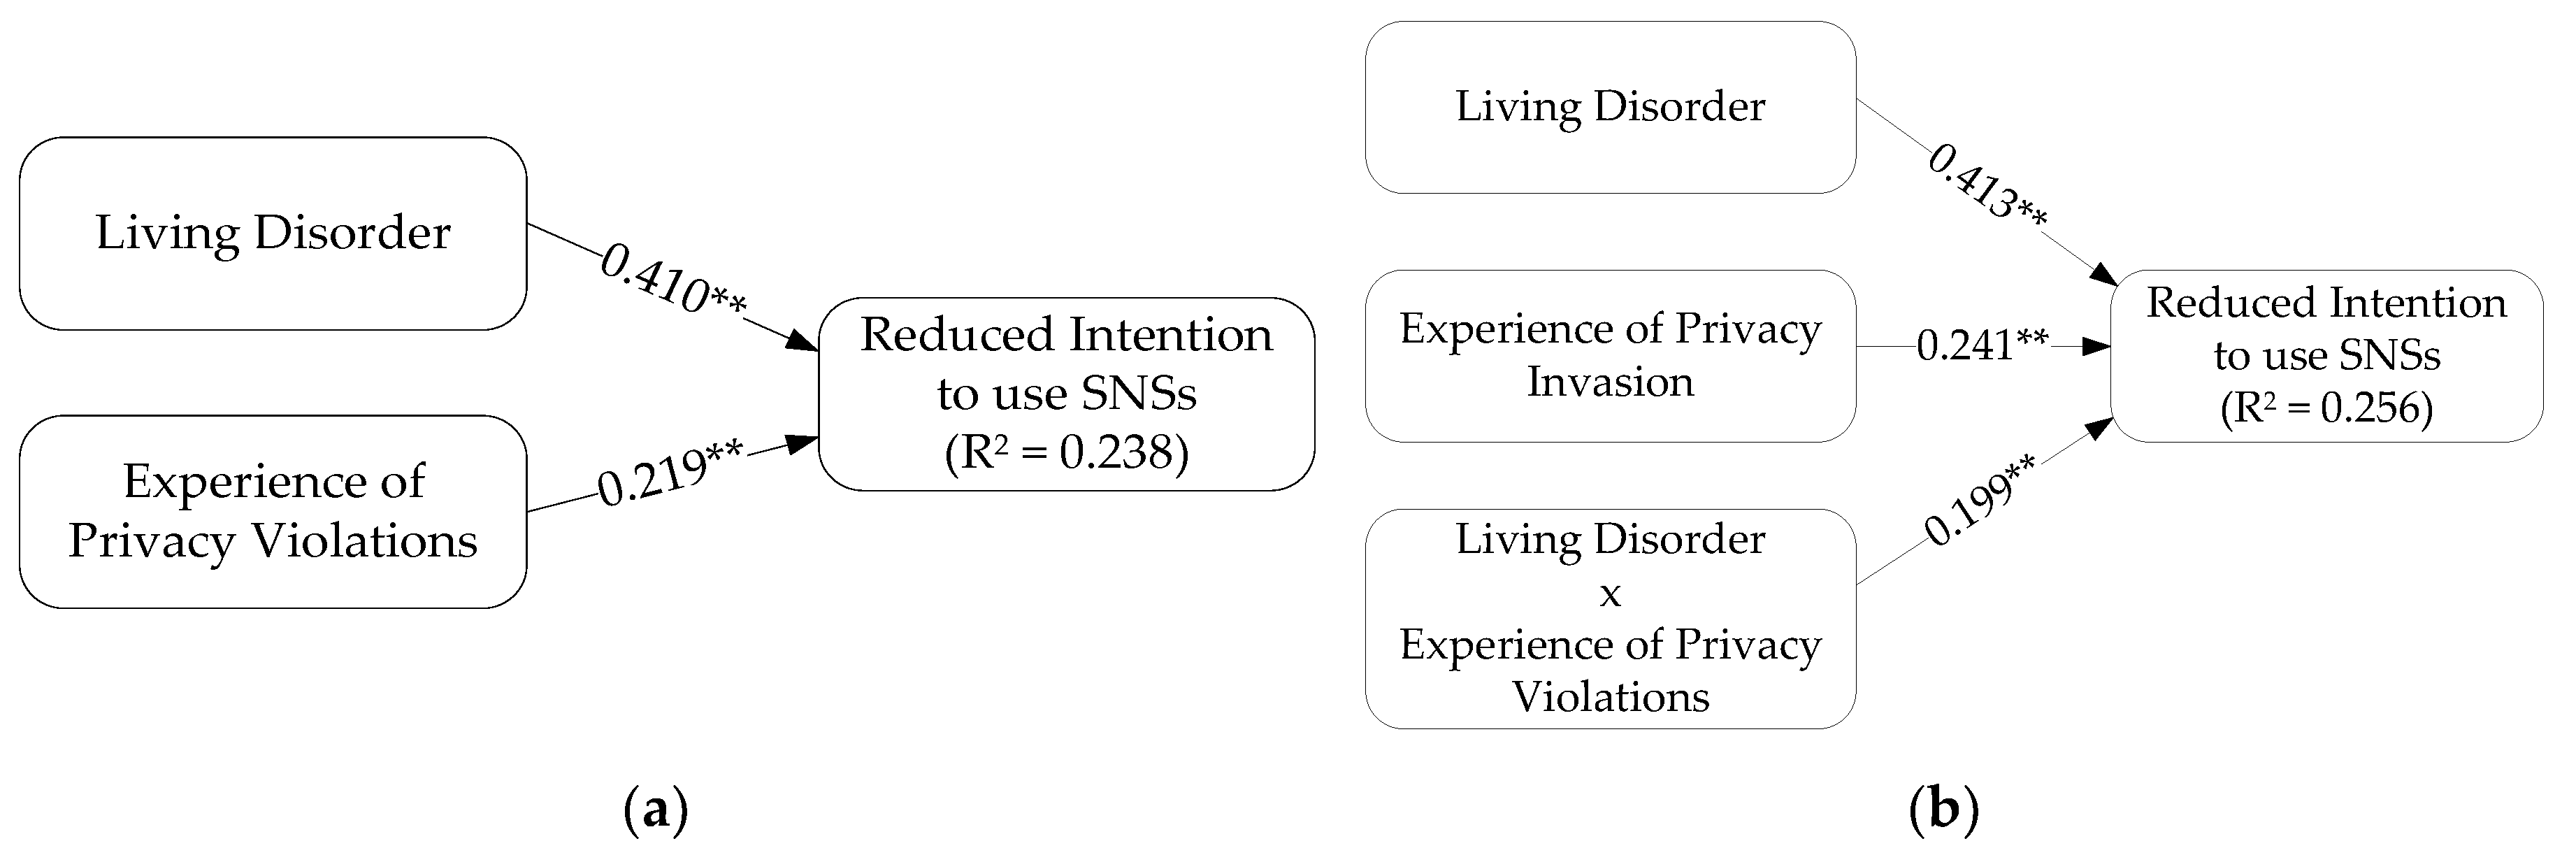
After evaluating the direct effects, we evaluated the moderating effect of the experience of privacy violations using Carte and Russell’s [
55] moderated multiple regression approach, which involves testing two models to identify differences in R
2. First, we analyzed the model with living disorder and experience of privacy violations as predecessor variables to find R
2(
. Next, we analyzed the second model with three variables (living disorder, experience of privacy violations, and the interaction term of these two variables) as predecessor variables to find R
2(
). We then found the F-value by considering ∆
, samples (N), and DF (degrees of freedom). This analysis showed that the moderating effect of the experience of privacy violations was significant within the relationship between living disorder and reduced SNS use intention. This result implies that when individuals experience living disorders because of excessive SNS use, their use reduction intentions increase. In this context, experiencing more privacy intrusions will strengthen individuals’ intentions to reduce SNS use.
Figure 4a,b depict the two models used to test moderators and
Table 9 summarizes the moderating effects results (H7).


