Abstract
This paper presents a novel approach of using machine learning algorithms based on experts’ knowledge to classify web pages into three predefined classes according to the degree of content adjustment to the search engine optimization (SEO) recommendations. In this study, classifiers were built and trained to classify an unknown sample (web page) into one of the three predefined classes and to identify important factors that affect the degree of page adjustment. The data in the training set are manually labeled by domain experts. The experimental results show that machine learning can be used for predicting the degree of adjustment of web pages to the SEO recommendations—classifier accuracy ranges from 54.59% to 69.67%, which is higher than the baseline accuracy of classification of samples in the majority class (48.83%). Practical significance of the proposed approach is in providing the core for building software agents and expert systems to automatically detect web pages, or parts of web pages, that need improvement to comply with the SEO guidelines and, therefore, potentially gain higher rankings by search engines. Also, the results of this study contribute to the field of detecting optimal values of ranking factors that search engines use to rank web pages. Experiments in this paper suggest that important factors to be taken into consideration when preparing a web page are page title, meta description, H1 tag (heading), and body text—which is aligned with the findings of previous research. Another result of this research is a new data set of manually labeled web pages that can be used in further research.
1. Introduction
The functionality and effectiveness of web pages partially also depend on their ranking within the search engine results, which themselves depend on various factors. These factors are known [1,2,3,4,5,6], but their impact on rank has not been fully reported. Webmasters and web authors that are called search engine optimization experts (SEO experts) can, based on their experience and knowledge, easily estimate if a certain web page has been optimized for certain keywords and follows the SEO guidelines published by the popular search engines. SEO guidelines are suggestions on how web pages should be built to ensure that search engine algorithms can better understand and rank them [7,8].
The importance of web page factors that impact the rank in search engines has been extensively investigated in the field of SEO [1,2,3,4,5,6]. The research methods frequently used in the SEO context are based on analyzing high-ranking web pages and their characteristics, as well as experimenting with content changes and how they impact the rank. The approach in this research was different: We used experts’ knowledge to generate a model for automatically classifying new web pages and extracting relevant factors that influence the ranking of web pages in Search Engine Results’ Pages (SERP).
The first goal of our research was to use machine learning techniques for building a classification model that will automatically classify web pages according to the degree of adjustment to SEO optimization guidelines. In building the model, SEO experts’ knowledge was used. The second goal was to determine relevant on-page factors that affect the degree of SEO optimization by using the developed classification models. Such an approach to identification of relevant factors is novel in the field of SEO. On-page SEO factors are various factors that are related to web page content, including the text on a web page, text in meta tags, links, images, and HTML (Hyper Text Markup Language) code.
Our research hypothesis was that by using machine learning algorithms to classify web pages according to their on-page SEO optimization we could achieve better accuracy than the baseline. The hypothesis would be accepted if the built classification models achieved better classification accuracy than that obtained by the baseline classification of samples in the majority class.
Based on research goals and hypothesis this study attempted to answer the following research questions (RQ):
RQ1: What are important on-page ranking factors that can be extracted by using experts’ knowledge and machine learning?
RQ2: Do extracted ranking factors align with previous research?
RQ3: What is the accuracy of models for web page classification based on their utilization of on-page SEO?
The data for this research were extracted from a random sample of web pages from the DMOZ (open directory at https://dmoz-odp.org/) directory. The labels of the directory folders were used as keywords. Figure 1 represents the research workflow.
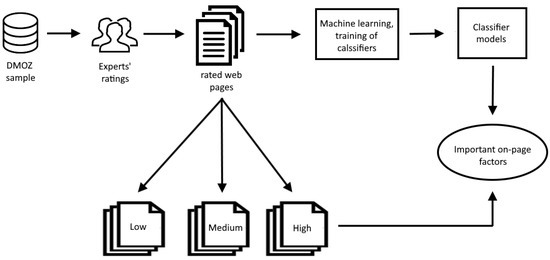
Figure 1.
Research workflow.
The proposed approach consisted of four main phases:
- (1)
- Selection of a random sample of web pages,
- (2)
- Classification of web pages into three predefined categories by SEO experts according to utilization of on-page SEO in respect to a given set of keywords,
- (3)
- Building and evaluation of classification models, and
- (4)
- Extraction of important factors from the classification models.
The first phase included building the data set by randomly sampling 600 web pages from the DMOZ directory and extracting the keywords from category titles that they belong to. In this experiment, 600 web pages were included in the sample. In the second phase, we used three independent SEO experts to label the web pages according to their SEO quality against the given keywords by classifying them into three predefined categories: low, medium, and high—depending on how well they utilize the on-page SEO guidelines. The data set built in this phase represented input for the next phase—building the classification models using several machine learning algorithms. The classification results from this phase were used in the last phase, where relevant factors that affect the classification were extracted and evaluated from the web pages having the highest SEO quality, i.e., those that have been classified into the high class.
The presented research was performed on English web pages, but the proposed approach is general and can be adopted for other languages.
2. Search Engine Optimization
Search engine optimization is often referred to in the literature as one of the Internet marketing techniques. It involves processes by which SEO experts try to gain high rankings in search engine results’ pages on selected keywords. Search engines present their search results in two parts: organic, or natural, results and paid results (advertisements). SEO focuses on organic results, which are generated according to search engine algorithms. Ranking in paid results depends on the price bid for a given keyword and the advertisement quality score [9]. Since ranking in organic results cannot be paid, a high organic search ranking is harder to achieve. Optimizing pages to rank higher in organic results requires deeper knowledge about ranking algorithms of a specific search engine and technical knowledge about web pages (HTML code), which is the domain of webmasters.
While for advertisements in search engines various certifications exist (e.g., Google Ads certification), for SEO no official certification has been devised. Consequently, the term SEO expert used in this paper cannot be exactly defined. However, it can be considered that the term should encompass experts who need to have knowledge about search engines and the web page-building process [10].
Search engines use algorithms for web page rankings that include various factors [6]. Most of these factors are known, but their role and impact on ranking have not been exactly specified by the SEO guidelines. Search engines publish their guidelines on how these factors should be employed [7,8], but do not reveal the golden rule or formula that will get a web page on the top of a search results’ listing. Factors that affect ranking are divided into two groups: on-page and off-page factors.
2.1. On-Page Factors
On-page factors include web page content characteristics that are under the full influence of the webmaster. They include web page text, links, images, tables, navigations, URLs, file names, and HTML code. The following on-page factors are highlighted in guidelines published by search engines [7,8]:
- Text quality (including information quality),
- Clear navigation,
- Page title (HTML “title” tag),
- Meta-description (HTML “meta description” tag),
- Using H tag for marking titles (H1, H2, H3, etc.),
- ALT attribute on images (short image description),
- Anchor text of links,
- URL (address) of the page (including the domain name),
- Web page loading speed, and
- HTML code-to-content ratio (must be in favor of the content).
This list is not exhaustive. A set of on-page factors includes a lot more factors with less impact (like the domain age, for example). All those factors have one thing in common: They can be controlled, unlike off-page factors, where such a high degree of control is not possible.
2.2. Off-Page Factors
Off-page factors, or factors that are not related to the content of a web page and depend on various external impacts, are core factors that affect today’s search engine algorithms. These are the factors that are mainly out of the control of the web page author. Among the most important off-page factors are incoming and outgoing links and their quality and recommendations from social media sites [11]. Some of the first algorithms that used links for ranking web pages were PageRank [12] and HITS [13]. They treated links as votes, assuming that web pages with more links were more important and should therefore be positioned higher in search results.
Off-page factors will not be discussed in detail since they were not the subject of the research in this paper.
2.3. Keywords
The SEO process always begins with keywords, that is, one or more words that Internet users use when searching for information on search engines. They are search queries that can also be formulated as questions that today’s search engines can answer. Nevertheless, using keywords is still a more common method than using questions in searching for information on search engines [14]. In most cases, users use queries containing two to three words, which is considered to be the best approach when searching on search engines [4,5].
For a web page to appear in organic search engine results’ pages, it needs to contain the keywords in both on-page and off-page factors. The basic idea behind SEO is to find keywords that will push the web page high in search engine result pages.
Keywords are important in various fields of study. They are used to find spam web pages [15], malicious content [16], fake news [17], and to trick search engines’ algorithms by employing unethical techniques called “black hat SEO” [18]. To classify web pages based on text topic, or to suggest keywords for SEO process, keyword suggestion systems were developed [19,20]. In this study, keywords were not extracted from page body, but from catalogue category.
3. Related Work
Ranking factors and their impact on web page rankings in search engines are topics of a lot of research work. Search engines usually publish only a short list of ranking factors, without disclosing their overall relevance in the ranking formula. Because of that, a lot of studies have focused on identifying relevant ranking factors and understanding how they impact web page rankings.
In [21] the authors established a mapping between the ranking factors and the web page usability. They concluded that adjusting web pages to the SEO guidelines will, in fact, increase the web page usability and vice versa. In [22] authors researched keyword density and keyword position in the web page content and their impacts on rankings, proposing optimal keyword frequencies. They also built a prediction system for web page ranking. In the study in [3] authors took rank prediction one step further by employing principles of reverse engineering in analyzing highly positioned websites to extract important ranking factors.
Comprehensive research on on-page ranking factors that affect web page visibility in search engine results is presented in [4,5]. The authors explored the impact of keyword frequencies in the page title and body on search results on various search engines. Their experiment showed that having keywords in the page title affects ranking and that the optimal keyword frequency is three. Pages with higher frequencies in the title exhibited the worst results. The analysis of keywords in the web page body (full text) indicated that pages with higher frequencies of keywords ranked higher.
In [5] the authors researched the impact of meta data on page rankings. They selected three factors concerning the meta data: “meta title” (text in the HTML “title” tag), “meta subject” (text in the HTML “meta subject” tag), and “meta description” (text in the HTML “meta description” tag). The results showed that pages containing meta data ranked higher than pages without those data. Various combinations of the meta data on pages were also tested. Pages with all three types of meta data ranked better than pages containing just two or one meta data type.
The study in [22] extended the previous experiments into several directions. The authors proved that based on only a few factors it is possible to predict a correct rank of seven out of 10 pages on search engines Google and Bing. The dominant factor in their model was “PR” (PageRank), which is an off-page factor, the second most important factor was the variable “HOST” (domain name), followed by “TITLE” (title tag in HTML), “M_DES” (meta-description of the HTML document), and “PATH” (URL path with the file name of the document). In the same study the authors investigated the SEO experts’ scoring. In a survey about ranking factors that was conducted among 37 experts, the following factors were obtained (sorted by importance, from the more important toward the less important ones): keywords in the “title” tag, anchor text in inbound links, global popularity of the web page URL, web page age, popularity of internal links, topic relevance of incoming links, popularity of links inside topic groups, keyword in the web page body, global popularity of linked pages, and topic connections of linked pages.
In [3] the authors applied reverse engineering to extract the five most important ranking factors: URL length, keyword in the domain name, keyword frequency in H1 tag, keyword frequency in the page title (“title” tag), and number of layers in the URL. Similar results about ranking factor importance were obtained in [23,24,25,26], which showed that most of the ranking factors had not considerably changed over the last few years.
Author of [27] suggested a metric that combines ranking factors and assesses the page according to the degree of adjustment to the SEO guidelines. The proposed metric is a linear combination of ranking factors that are empirically set (i.e., they are not learned).
In [28] the authors conducted a detailed literature review of SEO factors that affect rankings on SERP. They listed 24 website characteristics that were determined as important factors, including on-page and off-page factors. In the on-page factors’ group, keywords in the title tag and keyword density in various parts of a web page were identified as the most important factors.
Of 14 SEO factors used in [29] only two were off-page (backlinks), while among the on-page factors, eight were exactly the same as the ones used in our research. In general, there is a great deal of agreement between authors in this field regarding the choice of on-page factors used in research on SEO.
In [30] the authors used experts’ evaluation by means of an interview and the survey method to find out significant website SEO factors. The results of their research showed that meta tags are the factor that has the most significant influence on search engine ranking, followed by keywords in content and the website design.
The in-depth analysis of ranking factors is presented in the master thesis [31]. Similar to our research, the author conducted a survey on a large number of digital marketing companies exploring their opinion on ranking factors. Results showed that the page level keyword frequency-related factors occupied the third and fourth places (out of 8) in terms of their importance for web page ranking (with link-related factors in the first place and social metrics in the last place). In our research, we also based extraction of relevant factors on the experts, but instead of surveys we used machine learning classification algorithms on manually labeled web pages.
The PhD thesis [32] also focused on SEO factors for increasing the visibility of websites. The primary method in this thesis was an experimental website case study for the purpose of which an on-page SEO model was built based on the SEO techniques that were successful in the past. The techniques used in this research also included keyword-based methods in various parts of a web page and HTML code.
Article [33] explored web page classification methods and usage scenarios where a machine learning algorithm was employed to classify web pages in predefined categories based on features extracted from text and HTML tags. Results suggested that HTML tags play an important role in methods based on keyword frequencies to identify web page topics, and that they are understudied in classification.
Similar problems were addressed in [34], which explored classification of web pages that is language independent. They proposed a deep learning algorithm that overcomes the language barrier and successfully classifies web pages based on their function.
In [35] the authors used machine learning algorithms to predict web page rank in SERP for pages in the e-commerce gift industry. They researched 30 blogs in the selected industry that occupied first-page Google ranking. They tested two machine learning models (LightGBM and XGBoost) and conducted feature analysis, which showed that the features that had most impact are links, domain security, and H3 headings, while other keyword-related frequencies were not shown as significant in this research. The factors explored are very similar to the ones used in our research: length of text; counts of H1, H2, and H3 tags; their length; and keyword frequencies in tags, URL, and meta tags.
Web page classification for various purposes is an extensive field of study. One of the most popular categorization tasks is web spam classification [15,16,17]. Features’ extraction for this task is also a topic of much research [36]. This study contributes to the field of web page classification by exploring classification based on SEO recommendations—which is understudied.
Unethical, or “black hat”, SEO techniques are outlined in [18]. They include various tricks to fool search engines, like keyword stuffing (to increase keyword density), creation of doorway pages (automatically generated pages to target certain keywords), content copying, hiding text or links, cloaking (creating different page versions for search engines and humans), etc. Today search engines are constantly improving their algorithms to beat “black hat” SEO. Methods used in this research can also contribute to this field.
Recently, SEO was also used in academic databases and search engines. This area is called “Academic SEO” or “ASEO”. Its focus is on academic research articles and their rankings in academic search engines like Google scholar, Microsoft academia, Scopus, and similar. Authors of [37] addressed these topics by calculating correlation between ranking and citations, concluding that citation count is one of the main ranking factors. We can see that ASEO is different than classic SEO. It involves different factors and techniques, which were out of the scope of this paper.
A common practice in the latest SEO research is to evaluate websites using SEO tools and compare the results with external rankings. For example, in [38] the authors compared SEO quality of university websites with rankings on Academic Ranking of World Universities (ARWU) Shanghai list.
Based on our analysis of previous research, we established that the list of on-page ranking factors, which was given in the earlier section of this paper, is relevant for the adjustment of web pages to the SEO guidelines that are published by popular search engines. In most of the studies available, the researchers used search results as the starting point and observed the best ranked web pages to identify the important ranking factors. The approach in our paper was different: To identify the important factors, the knowledge of SEO experts was used and machine learning techniques were applied on the data set manually labeled by the experts in the scoring process. This approach was intended to allow us to identify on-page ranking factors more objectively since their source is not affected by off-page factors or their current rank on a search engine.
4. Machine Learning
Machine learning is a field of artificial intelligence that deals with algorithms whose efficiency is improved based on empirical data. It is an interdisciplinary field that includes statistics, data science, databases, and other related fields from information science. The goal of machine learning is learning from data so that machines can predict variable values, spot interesting structures, or recognize patterns. There are two main types of machine learning: supervised and unsupervised, depending on whether the data used for learning are marked or not [39].
In supervised learning the value of the dependent variable is known, and learning is performed on the data with the goal to predict a future value of the variable based on the data in independent variables. If the dependent variable is continuous (numeric), then it is a regression problem, and if it is categorical (nominal), it is a classification problem. Linear regression can be mathematically written as:
where y is the dependent variable; x1, x2, …, xn are independent variables; and w0, w1, …, wn are weight factors.
In unsupervised learning the dependent variable y is not known in the data. The aim of unsupervised learning is not the prediction of the dependent variable but finding interesting structures in the data. The best examples of this are clustering algorithms that group data based on their characteristics (independent variables).
In the classification problem a dependent variable y is assigned a label of one (single-label classification) or more (multi-label classification) predefined classes based on the values of independent variables. In our research we used a single-label classification whereby the websites were classified into only one of the three predefined classes.
The topic of this paper is on-page adjustments of web pages to the SEO guidelines. We defined three classes of adjustments: low, medium, and high SEO adjustments. The data were marked by SEO experts in accordance with the class that they belong to. Since the dependent variable was nominal in building the models, classification methods were used. The following section provides a short introduction to the most popular classification methods that are used in data science [40] and digital marketing [41] and, therefore, in this research also.
4.1. Classification Methods
4.1.1. Decision Trees
Decision trees are one of the most popular classification methods that give interpretable results. Trees contain decision nodes from which they are branched further down until they reach the leaves, or nodes, at the lowest level, where a class is specified. These kinds of trees are used for classifying a new data sample (instance).
Most popular decision trees algorithms are ID3, C4.5, CART, CHAID, and QUEST [39]. Even though they can be used for regression, their most common use is in classification tasks. The main advantages of decision trees are their interpretability (easy to explain), they do not have any underlying data assumptions, and they are not affected by outliers. Disadvantages are sensitivity to data variety, they can be complex and slow in training, and tend to overfit (if we do not prune it).
4.1.2. Naïve Bayes Classifier
The naïve Bayes classification method uses the Bayes conditional probability theory and starts with the naïve assumption that all attributes (variables) are independent of each other and equally important [42]. It is often used in the domain of information retrieval. The Bayes conditional probability rule is:
where P(A|B) is the conditional probability of event A with known evidence B assuming that .
The same rule can be applied to a classification problem, where A can represent class variable y, while B is the vector of independent variables X.
The goal is to calculate class probability of a sample if the values of independent variables are known. The naïve Bayes classification is an example of a probabilistic classification method, which gives class probability as a result, unlike a “hard” algorithm, which yields a directly predicted class of a sample as a result.
If the assumption of the independence of features is true, naïve Bayes classifier can have good performance and it can learn quickly, especially with categorical variables, which is the main advantage of this algorithm. A disadvantage is the same independence assumption, if not true. Also, the algorithm suffers from “zero frequency” issue—if some categorical variable value was not present in the training set, the model will assign zero probability.
4.1.3. K-Nearest Neighbor Method
The k-nearest neighbor method (KNN method) is a classification method that does not produce a model [43]. This method is also known as a “lazy” algorithm because the class is predicted at the moment of introducing a new sample (instance) by calculating the distance from the new sample and other samples in a data set in n-dimensional space, where n is the number of variables. After calculating all distances, only k-nearest neighbors are considered in deciding which class the new sample belongs to by majority voting. The most frequently used distance metric in this method is Euclidean distance. An advantage of the KNN method is its easy implementation, as there is no training period. A disadvantage is its slow performance with large data sets and data sets with high dimensionality.
4.1.4. Support Vector Machines
The classification problem in an n-dimensional space is actually a problem of finding a decision boundary (linear or non-linear) that best divides samples from the training set into predefined classes. The decision boundary in a two-dimensional space is a line and in a three-dimensional space it is a plane, while in an n-dimensional space it is generally a hyperplane. The support vector machines’ method tries to find an optimal hyperplane that will separate the samples from the training set in the best way so that the distance from the hyperplane and its first contiguous samples is maximal. These closest points are called support vectors because they define the position of the hyperplane. New samples (points) are then classified into a class based on which side of the hyperplane they fall on.
This algorithm works well when there is a clear separating hyperplane and is effective with high dimensional data. Disadvantages are in sensitivity to data noise and size.
4.1.5. Logistic Regression
Logistic regression uses the logistic function for classification. The reason for this lies in its S shape (in a two-dimensional space), which enables generating a classification model that gives the probability of class (from 0 to 1).
By using classical linear regression for binary classification where we encode the first class as “1” and second as “0”, we can get probability values that are outside of [0, 1] range as a result of the regression function. However, since such a solution does not make sense, there is a need for a function that will overcome this problem, one of which is the logistic function [44]:
where w0 and w1 are weight coefficients and x1 is independent variable.
In a linear regression model, weight coefficients w0 and w1 are calculated by the least squares’ method based on the data in the training set. This method is not suitable in a logistic model, so the maximum likelihood method is used instead, which estimates w0 and w1 so that l(x) for positive instances is close to 1 and for negative instances close to 0.
Logistic regression strengths are in its simplicity, probability outputs, and that it is less prone to overfitting in low-dimensional data sets. On the other hand, with high-dimensional datasets overfitting can be an issue.
4.2. Classification Evaluation
Different classification algorithms perform differently on different data sets. There is no “best algorithm”. Its performance depends on domain, data set characteristics, and algorithm assumptions. That is why they need to be evaluated in each use case.
After a classification model is built, evaluation can begin. The model is built on the data from the training set and evaluation needs to be performed on a separate test set. Two techniques are available for that purpose:
- Hold-out method—forming two sets before training, one of which will be used for training and the other for validation.
- Cross validation—where validation is done on the training set by dividing the set into k parts. The model validation is then performed k times, wherein each time k − 1 parts are used for learning and the rest of the data set for validation. In the end, the evaluation metrics’ average is calculated.
Regardless of the method for testing that is used, there are several metrics that are employed in classification evaluation: accuracy, precision, recall, F1 (function of precision and recall), MAE (mean absolute error), and MSE (medium square error) [45].
4.3. Hyperparameter Optimization and Regularization
Most machine learning algorithms have parameters, which have to be determined before the process of learning, that the researcher can tune to enhance the performance of the model. These parameters are called hyperparameters and tuning them is part of the regularization process that deals with the problems of overfitting (good performance on training data) and underfitting (low performance on real data).
There are two hyperparameter optimization methods that are most frequently used [46]—grid search and random search. Grid search works by evaluating all possible values of hyperparameters (and their combinations) in a defined range that is chosen by the researcher. Its main disadvantage is slowness, owing to a lot of combinations that must be evaluated. In the random search method this problem is resolved by evaluating a smaller, randomly chosen set of hyperparameter values. This method is faster but not highly reliable as optimal hyperparameter values can be left out in the process.
In the decision trees ‘method, hyperparameters that are usually tuned are confidence parameter (“cp”), minimal number of samples on a leaf (“minBucket”) and maximal tree depth [47]. In the support vector machines, the most tuned hyperparameters include the C parameter (complexity parameter) and a type of kernel function [48]. The KNN method uses k and its metric distances as the hyperparameter. Logistic regression uses its penalization parameters (Lasso and Ridge regression, or L1 and L2). All of these parameters were tuned in our research.
5. Research Methods
This research was conducted in four phases. In the first phase a random sample of web pages was pulled from the data source. The second phase included the rating of web pages into three predefined classes by three different SEO experts. Next, the classification models were built and their evaluation was performed. In the last phase, the important factors were extracted from the built models.
5.1. Data Set Forming
The data set for this research was formed by random sampling of 600 web pages from the DMOZ directoy (the original DMOZ, http://dmoz.org, has been out of service since March 2017, but there are several websites with saved archives that can be used for data download: https://dmoz-odp.org/, https://github.com/SongweiGe/Dmoz-Dataset). DMOZ is often used in the field of information retrieval and web pages’ classification [49,50,51], summarization of web page text [52,53,54], and keyword extraction [55].
This research focused only on web pages in the English language, but the developed models can be applied to web pages in any language.
The DMOZ directory contains a list of websites in hierarchical categories and subcategories, depending on the website topic. There are 16 categories at the top level: “Arts”, “Business”, “Computers”, “Games”, “Health”, “Home”, “News”, “Recreation”, “Reference”, “Regional”, “Science”, “Shopping”, “Society”, “Sports”, “Kids & Teens Directory”, and “World”. Since, in our research, the category title was used as a keyword, the sample was pulled from the category at a minimum of the third level of hierarchy. This was done to avoid broadening of keywords that could not describe the page at the desired level of detail. Also, since this research targeted pages in the English language, the categories “Regional” and “World” were not included in the sampling. The “News” category was also excluded since the websites it contains are mostly news portals, which would make it difficult to determine keywords from the content. The number of web pages in the sample by DMOZ categories is given in Table 1.

Table 1.
Number of web pages in the sample by DMOZ categories.
Based on the category title (minimally third level), a list of keywords for each web page was formed. In some cases, in which the category title contained a few words, they were split, as in the examples:
Kids_and_Teens/Entertainment/Magazines_and_E-zines/, which were transformed into keywords: Kids, Teens, Entertainment, Magazines, E-zines.
Stop words were excluded from the category titles. If a web page was contained in more than one category, only the first one was used (from the third level or below). The result of this phase was a data set with 600 URLs and keywords for each of them.
5.2. Rating Web Pages
Three independent SEO experts labeled the web pages from the data set into three predefined classes: “low SEO”, “medium SEO”, and “high SEO”, based on the given target keywords and the SEO guidelines and according to their subjective assessment, expertise, and beliefs. Expert 1 is owner of an SEO agency in Croatia, while Experts 2 and 3 are employees of SEO agencies from India. This initial classification performed by the experts was needed for the next phase—training the classifiers.
The result of this phase was a data set that contained three attributes: URL, keywords, and the class label. The class distribution is shown in Table 2.
Table 2.
The number of examples for each of the class values as labelled by three independent experts and the aggregated number of examples (the last column) based on majority voting of the labels from the three experts.
The target class for each web page was set by the majority class of the three experts’ score (“MOD” column in Table 2). All the examples were assigned the majority class label, as there were no cases where a page would be classified into three different classes by experts.
The Kappa statistic was used for the examination of inter-rater reliability.
The obtained Kappa statistic varied between −1 and 1. The value of 1 means a perfect agreement between the experts, value 0 means that the agreement was the same as random agreement, and a value lower than 0 means that the agreement was worse than random.
The results of the Fleiss Kappa with three experts that was calculated on the data set in this research are presented in Table 3.
Table 3.
Fleiss Kappa statistic for three experts on 600 instances of the data set.
The total average Kappa statistic was 0.4445, which can be interpreted as a good result [56].
The weighted Kappa statistic was also calculated, with its results presented in Table 4. From Table 4 it is evident that the agreement among the experts was relatively good. A slightly lower level of agreements was found between Experts 1 and 3.
Table 4.
Weighted Kappa statistic.
For agreement analysis based on ordinal data, the Kendall coefficient of concordance [57] is often used in research. Its value is in range 0–1, where a value closer to 1 indicates better agreement. The value of the Kendall coefficient of concordance for this data set was 0.611, which is considered an indication of a reasonably good concordance.
5.3. Independent Variables’ Selection
Based on the previous research [1,3,4,5,6,23,58,59,60,61], we formed a list of independent on-page variables (Table 5). These variables were later used for the training of classification models.
Table 5.
List of independent variables used in this research.
Class—experts’ rating was defined as the dependent variable. Possible values of the class value are: “1—low SEO”, “2—medium SEO”, and “3—high SEO”. The values of independent variables were extracted automatically by a Python script created for this purpose. In the process of extracting keyword frequencies, a Porter stemmer was used.
The formed data set contained 600 instances described by 21 independent and 1 dependent variable.
A correlation analysis between the variables showed that only a few pairs of variables had a correlation higher than 0.5 (Mkw-Mlen, h1-h1len, h2-h2len, h3-h3len).
5.4. Extraction of On-Page Factors
The analysis of a data set can reveal which particular factors (independent variables) can be more important or less important in class prediction. The simplest way to achieve that is to rank variables according to their correlation with a class variable. Another approach is to utilize decision trees and prediction properties of a particular variable. Measures of variable importance that are used in decision trees can also be used to rank variables—not only those selected for branching in the tree nodes, but all the variables that are included. Information gain is the measure used in decision trees to decide which attribute should be split. It is calculated as a measure of entropy reduction caused by splitting on a particular attribute. By averaging the results of multiple trees that are built on n samples and m predictors (instead of on a full data set) we can reduce variance in tree-based methods and gain better results. This method is called “random forest” and can be used to detect important variables. Another method to detect important variables is “Relief”, which is based on nearest-neighbor algorithm to assign a relevance weight to each feature. Chi square is also a common measure of variable importance in machine learning problems [62]. It tests the relationship between predictors (independent) and target variable (dependent). Variable ranks obtained by these measures are shown in Table 6. The top five values in each test are given in bold.
Table 6.
Variable importance based on various tests.
The variables for which highest values were obtained in most tests (correlation, information gain, chi square, relief, random forest) were: Tkw (keyword frequency in the “title” tag), Mlen (length of the “meta description” tag), Mkw (keyword frequency in the “meta description” tag), h1Kw (keyword frequency in the “H1” tag), and txtKw (keyword frequency in the page body). These variables can be treated as important factors for on-page optimization. They have also been identified in most previous research by other authors [3,4,5,22,24,25,26].
6. Evaluation Results
The model evaluation was conducted by the hold-out method and cross validation. In the hold-out method, two-thirds of the data set were used for training the model and one-third for its validation. For cross validation, a method of 10-fold nested cross validation was used (with 10 iterations in the inner loop and 10 in the outer loop).
For training the classification models, an R tool with the MLR (https://github.com/mlr-org/mlr, accessed October 2018) package was used. The training was performed by means of five classification algorithms: decision trees, SVM (Support Vector Machine), Naïve Bayes, kNN, and logistic regression [40], using the classification accuracy as the evaluation measure. All classifier hyperparameters were tuned with the grid search method. The data were normalized with the min-max method. In cross validation a stratification method was used.
Table 7 summarizes the hyperparameter tuning results and accuracy obtained by two validation methods.
Table 7.
Optimal values of hyperparameters.
To analyze the suitability of the data set size, a learning curve was created and plotted for each of the classifiers, as shown in Figure 2.
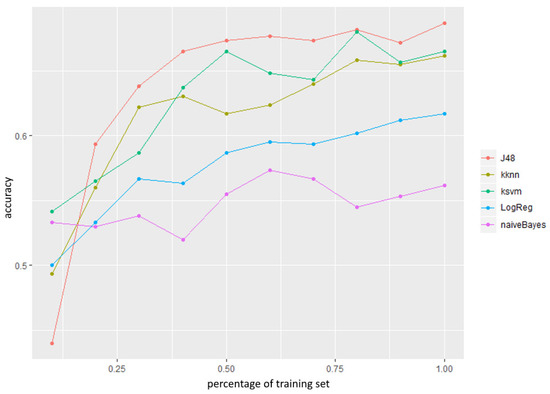
Figure 2.
Learning curve used for classification algorithms.
From Figure 2 one can observe that the accuracy steeply grew, up to about 50% of the training set size, which indicates that the data set size utilized in this research was suitable.
To confirm our research hypothesis, the results of all the five classifiers were compared with the baseline accuracy. In machine learning, the baseline model represents the simplest possible model. In classification tasks this is the proportion of the class with most observations. This algorithm is also commonly known as “ZeroR” or “0-R” algorithm, and its accuracy is used as point of reference when comparing performance of other machine learning algorithms. In regression, this can be one of the central tendency statistics. In our case, the baseline accuracy was the proportion of the major class in a data set, that is, the second class or “medium SEO”. The majority class was observed in 293 out of 600 instances, which accounts for 48.83% of the data set. In 10-folds’ cross validation, the average accuracy of all the five classifiers was above this threshold, which is shown in the box plots in Figure 3. The red line in Figure 3 represents baseline accuracy (48.83%). The central line in the boxes represents the median and the dot represents the average. The median (and average) values for all the classifiers are above the red line, which, according to [63], indicates confirmation of the set hypothesis: The classification models built for classification of web pages according to their SEO optimization level had a greater accuracy than classification in the majority class. Nevertheless, the ultimate testing of this hypothesis needs to be performed by means of statistical tests to provide statistically significant conclusions.
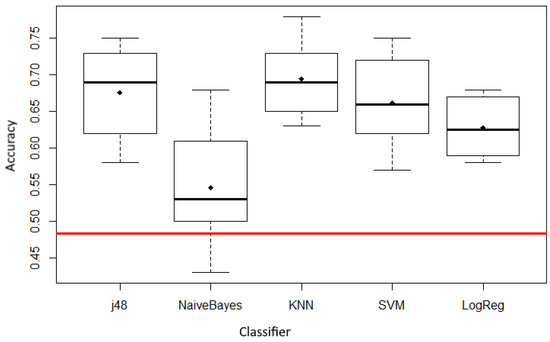
Figure 3.
Comparison of accuracy of classifiers using 10-folds’ cross validation with baseline accuracy (red line).
For comparing more classifiers on one data set, parametric and non-parametric tests [64] for dependent samples can be used. The most common parametric test is t-test, which requires distribution normality. Since, in this research, meeting that requirement was mostly not possible, non-parametric tests—McNemar’s and Wilcoxon were used.
The McNemar test is suitable when there is a separate data set for validation (different than the training set) and is, therefore, not applicable when cross validation is used [65]. As a consequence, in this research we were able to conduct the McNemar’s tests only in the hold-out validation method. This test requires building contingency tables for each pair of classifiers—in our case between classificatory and baseline accuracy. The test results are given in Table 8.
Table 8.
Results of the McNemar test for comparison of used classification algorithms with baseline classification in the majority class.
The McNemar test statistic X2 should be greater than 3.841 (X2 distribution with 1 degree of freedom and α = 0.05) to be able to conclude with a 95% confidence that the accuracy of classification is significantly different than baseline accuracy. The tests showed that this was the case for all the tested classifiers except for Naïve Bayes, which showed worse results.
The Wilcoxon signed-rank test is another non-parametric test that can point out the differences (or similarities) between distributions of two samples from the same population. It is known as an alternative to the parametric t-test because it does not require a condition of normal distribution to be met. It is calculated so that first all the differences between the matching values of the variables are calculated, which are then ranked from the smallest to the largest, ignoring polarity, and summing positive and negative ranks (W+ and W−). Then the minimum W = min (W−, W+) is chosen, which represents the Wilcoxon value.
If the number of observations (n) is smaller or equals 25 [64], then the p-value is searched in the Wilcoxon table of critical values and compared with the value of W to decide whether the null hypothesis is to be rejected. If n is larger than 25, then the normality of distribution can be assumed, and z-statistic can be calculated.
Considering the results of 10-folds’ cross validation of classifiers (n = 10), the W value was calculated for each pair of classificatory baseline accuracy. The obtained p-values are shown in Table 9.
Table 9.
Results of the Wilcox signed-rank test of 10-folds’ cross validation for comparison of used classification algorithms with baseline classification in the majority class.
The p-values in Table 9 show that all the tested classifiers scored significantly better than baseline accuracy. Somewhat worse results were obtained for Naïve Bayes, but still significantly better in comparison to baseline accuracy. This confirmed our hypothesis.
For analyzing the differences between classification accuracy of the built classification models, the Friedman test was used [66]. It is a non-parametric test that is known as an alternative to the parametric ANOVA test. By using the Friedman test, the existence of a significant difference in the accuracy of the built classification models was confirmed at the significance level of 0.05 (p = 0.0051). The additional post hoc Nemenyi test was used to determine between which pairs of classifiers the significant differences existed [67]. The results are shown in Table 10.
Table 10.
Comparison of differences between pairs of classification models by Nemenyi test (p-values).
From these results one can observe that significant differences exist between Naïve Bayes and j48 decision tree algorithm (p < 0.05) and between Naïve Bayes and KNN.
7. Discussion
In previous research by other authors, there have been many attempts to identify relevant factors that affect ranking on search engines. In our research, machine learning classifiers and experts’ knowledge were used to identify these factors and predict the on-page SEO quality of a web page. The built classification models showed accuracy between 54.69% and 69.67% in predicting the on-page SEO quality (degree of adjustments to the SEO guidelines).
Ranking factors identified using experts’ knowledge and machine learning in this study confirmed previous research—having keywords in page title, meta tag, H1 tag, and text body of the web page is important in the SEO process. By further investigating variables of pages in “high SEO” class, we can identify keyword frequencies used by pages in this class: For title, meta tag, and H1 this is 1–3 and for body text it is 2–4 keywords. The average length of page title was eight words, meta description was 10, and H1 was six words. Previous studies report similar results [3,4,5,22]. This shows that by using expert knowledge to classify pages we can also find preferred values of ranking factors.
Following the same principle, by exploring variables of pages in “low SEO” category, we could find patterns that are undesirable in SEO process. However, since our data set is small, and most of the pages in the “low SEO” class had zero values in independent variables, we believe that, for making such research, further variables should be introduced or the size of data set must be increased.
8. Conclusions
Search engine optimization of web pages involves the processes of optimizing page content and getting the most quality backlinks. In this research, a machine learning approach in identifying the degree of a web page adjustment to the SEO guidelines was explored. Classifiers were trained on a data set of 600 pages randomly selected from the DMOZ directory and marked (classified) by three independent SEO experts into three predefined categories: “low SEO”, “medium SEO”, and “high SEO”. By testing five major classifiers (decision trees, Naïve Bayes, logistic regression, KNN, and SVM) the models gained accuracy greater (between 54.69% and 69.67%) than the baseline accuracy (48.83%), which represented the “medium SEO” majority class. In this research, we confirmed that by using machine learning classification algorithms learned on the basis of experts’ knowledge it is possible to predict the adjustment of a web page to the SEO guidelines. Further, a decision tree algorithm was used for extraction of factors relevant for SEO. The data set formed in this research can be used in further SEO research on-page ranking factors.
The methods used in this study were not search engine and language specific. The same methods can be utilized to target a specific search engine if SEO experts are instructed to classify web pages according to that search engine and can be applied to different languages provided that an algorithm for stemming or lemmatization has been developed for that language.
This research shows how machine learning can be used to detect web page SEO quality and bring insights into the important factors. Methods used in this research can help in building automated or semi-automated software for supporting SEO work, like during an SEO audit to detect pages that need work, suggesting optimal factor values, or detecting spammy pages with black-hat tricks. The dataset formed in this study can be used in further research on SEO factors or classification methods of web pages. Future work may include using other machine learning methods or using off-page factors that were not covered in this research. Also, using more SEO experts or more target classes in page labelling process could yield better results. The authors hope that this research will impact SEO agencies and SEO software developers by encouraging them to utilize machine learning models in their work to automate on-page-related tasks.
Author Contributions
Conceptualization, G.M., J.D., and D.M.; methodology, G.M., J.D., and D.M.; software, G.M.; validation, J.D. and D.M.; formal analysis, J.D.; investigation, G.M.; resources, G.M.; data curation, G.M.; writing—original draft preparation, G.M.; writing—review and editing, G.M.; visualization, G.M.; supervision, D.M.; project administration, J.D. All authors have read and agreed to the published version of the manuscript.
Funding
This article is based on research undertaken by the lead author as a doctoral student at University of Zagreb, Croatia, supported by the University of Pula, Croatia. Apart from that scholarship, the authors received no other financial support for the research.
Informed Consent Statement
Not applicable.
Data Availability Statement
The data presented in this study are available on https://doi.org/10.5281/zenodo.4416123.
Conflicts of Interest
The authors declare no conflict of interest.
References
- Gupta, S.; Rakesh, N.; Thakral, A.; Chaudhary, D.K. Search engine optimization: Success factors. In Proceedings of the 2016 Fourth International Conference on Parallel, Distributed and Grid Computing (PDGC), Pradesh, India, 22–24 December 2016; pp. 17–21. [Google Scholar] [CrossRef]
- Luh, C.-J.; Yang, S.-A.; Huang, T.-L.D. Estimating Google’s search engine ranking function from a search engine optimization perspective. Online Inf. Rev. 2016, 40, 239–255. [Google Scholar] [CrossRef]
- Zhu, C.; Wu, G. Research and analysis of search engine optimization factors based on reverse engineering. In Proceedings of the 2011 Third International Conference on Multimedia Information Networking and Security (MINES), Shanghai, China, 4–6 November 2011; pp. 225–228. [Google Scholar] [CrossRef]
- Zhang, J.; Dimitroff, A. The impact of metadata implementation on webpage visibility in search engine results (Part II). Inf. Process. Manag. 2005, 41, 691–715. [Google Scholar] [CrossRef]
- Zhang, J.; Dimitroff, A. The impact of webpage content characteristics on webpage visibility in search engine results (Part I). Inf. Process. Manag. 2005, 41, 665–690. [Google Scholar] [CrossRef]
- Hussien, A.S. Factors Affect Search Engine Optimization. Int. J. Comput. Sci. Netw. Secur. 2014, 14, 28–33. [Google Scholar]
- Google Webmaster Guidelines. Available online: https://support.google.com/webmasters/answer/35769?hl=en (accessed on 10 October 2019).
- Bing Webmaster Guidelines. Available online: https://www.bing.com/webmaster/help/webmaster-guidelines-30fba23a (accessed on 10 October 2019).
- Rutz, O.J.; Bucklin, R.E. Paid search advertising. In Advanced Database Marketing; Routledge: London, UK, 2016; pp. 251–268. [Google Scholar]
- What is an SEO specialist? Available online: https://www.seo.com/blog/what-is-an-seo-specialist/ (accessed on 4 January 2019).
- Zhang, S.; Cabage, N. Search engine optimization: Comparison of link building and social sharing. J. Comput. Inf. Syst. 2017, 57, 148–159. [Google Scholar] [CrossRef]
- Brin, S.; Lawrence, P. The anatomy of a large-scale hypertextual web search engine. Comput. Netw. ISDN Syst. 1998, 30, 107–117. [Google Scholar] [CrossRef]
- Kleinberg, J.M.; Kumar, R.; Raghavan, P.; Rajagopalan, S.; Tomkins, A. The web as a graph: Measurements, models, and methods. In International Computing and Combinatorics Conference; Springer: Berlin, Germany, 1999; Volume 1627, pp. 1–17. [Google Scholar] [CrossRef]
- White, R.W.; Richardson, M.; Yih, W.-T. Questions vs. queries in informational search tasks. In Proceedings of the 24th International Conference on World Wide Web, Florence, Italy, 18 May 2015; pp. 135–136. [Google Scholar] [CrossRef]
- Li, Y.; Nie, X.; Huang, R. Web spam classification method based on deep belief networks. Expert Syst. Appl. 2018, 96, 261–270. [Google Scholar] [CrossRef]
- Adebowale, M.A.; Lwin, K.; Sanchez, E.; Hossain, M.A. Intelligent web-phishing detection and protection scheme using integrated features of Images, frames and text. Expert Syst. Appl. 2019, 115, 300–313. [Google Scholar] [CrossRef]
- Meel, P.; Vishwakarma, D.K. Fake news, rumor, information pollution in social media and web: A contemporary survey of state-of-the-arts, challenges and opportunities. Expert Syst. Appl. 2020, 153, 112986. [Google Scholar] [CrossRef]
- Bello, R.W.; Otobo, F.N. Conversion of Website Users to Customers-The Black Hat SEO Technique. Int. J. Adv. Res. Comput. Sci. Softw. Eng. 2018, 8, 29. [Google Scholar] [CrossRef]
- Duari, S.; Bhatnagar, V. Complex Network based Supervised Keyword Extractor. Expert Syst. Appl. 2020, 140, 112876. [Google Scholar] [CrossRef]
- Özel, S.A. A web page classification system based on a genetic algorithm using tagged-terms as features. Expert Syst Appl. 2011, 38, 3407–3415. [Google Scholar] [CrossRef]
- Moreno, L.; Martinez, P. Overlapping factors in search engine optimization and web accessibility. Online Inf. Rev. 2013, 37, 564–580. [Google Scholar] [CrossRef]
- Su, A.-J.; Hu, Y.C.; Kuzmanovic, A.; Koh, C.-K. How to improve your search engine ranking: Myths and reality. ACM Trans. Web 2014, 8, 1–25. [Google Scholar] [CrossRef]
- Sagot, S.; Ostrosi, E.; Fougères, A.-J. A multi-agent approach for building a fuzzy decision support system to assist the SEO process. In Proceedings of the IEEE International Conference on Systems, Man, and Cybernetics (SMC), Budapest, Hungary, 9–12 October 2016; pp. 4001–4006. [Google Scholar] [CrossRef]
- Giomelakis, D.; Veglis, A. Investigating search engine optimization factors in media websites: The case of Greece. Digit. J. 2016, 4, 379–400. [Google Scholar] [CrossRef]
- Khan, M.N.A.; Mahmood, A. A distinctive approach to obtain higher page rank through search engine optimization. Sādhanā 2018, 43, 43. [Google Scholar] [CrossRef]
- Buddenbrock, F. Search Engine Optimization: Getting to Google’s First Page. In Google It; Lee, N., Ed.; Springer: New York, NY, USA, 2016; pp. 195–204. [Google Scholar] [CrossRef]
- Matošević, G. Measuring the utilization of on-page search engine optimization in selected domain. J. Inf. Organ. Sci. 2015, 39, 199–207. [Google Scholar]
- Ziakis, C.; Vlachopoulou, M.; Kyrkoudis, T.; Karagkiozidou, M. Important Factors for Improving Google Search Rank. Future Internet 2019, 11, 32. [Google Scholar] [CrossRef]
- Cirovic, S. Comparative analysis of SEO factors across and within distinct industries—ecommerce, hospitality, telecommunications. Master’s Thesis, School of Journalism and Mass Communications, Faculty of Economic and Political Sciences, Thessaloniki, Greece, January 2020. [Google Scholar]
- Tsuei, H.-J.; Tsai, W.-H.; Pan, F.-T.; Tzeng, G.-H. Improving search engine optimization (SEO) by using hybrid modified MCDM models. Artif. Intell. Rev. 2020, 53, 1–16. [Google Scholar] [CrossRef]
- Carvalho, L.L. Search Engine Ranking Factors Analysis: Moz Digital Marketing Company Survey Study. Master’s Thesis, Universidade Nova de Lisboa, Lisbon, Portugal, 2018. [Google Scholar]
- Aul, V. Harnessing Search Engine Optimization Experience to Enhance the Visibility of Websites. Ph.D. Thesis, University of West London, London, UK, 2018. [Google Scholar]
- Hashemi, M. Web page classification: A survey of perspectives, gaps, and future directions. Multimed. Tools Appl. 2020, 79, 11921–11945. [Google Scholar] [CrossRef]
- Balim, C.; Özkan, K. Functional Classification of Web Pages with Deep Learning. In Proceedings of the 27th Signal Processing and Communications Applications Conference (SIU), Sivas, Turkey, 24–26 April 2019; pp. 1–4. [Google Scholar] [CrossRef]
- Salminen, J.; Corporan, J.; Marttila, R.; Salenius, T.; Jansen, B.J. Using Machine Learning to Predict Ranking of Webpages in the Gift Industry: Factors for Search-Engine Optimization. In Proceedings of the 9th International Conference on Information Systems and Technologies, Caro, Egypt, 24–26 March 2019; pp. 1–8. [Google Scholar] [CrossRef]
- Chen, C.-M.; Lee, H.-M.; Chang, Y.-J. Two novel feature selection approaches for web page classification. Expert Syst. Appl. 2009, 36, 260–272. [Google Scholar] [CrossRef]
- Rovira, C.; Codina, L.; Guerrero-Sole, F.; Lopezosa, C. Ranking by Relevance and Citation Counts, a Comparative Study: Google Scholar, Microsoft Academic, WoS and Scopus. Future Internet 2019, 11, 202. [Google Scholar] [CrossRef]
- Giannakoulopoulos, A.; Konstantinou, N.; Koutsompolis, D.; Pergantis, M.; Varlamis, I. Academic Excellence, Website Quality, SEO Performance: Is there a Correlation? Future Internet 2019, 11, 242. [Google Scholar] [CrossRef]
- Witten, I.H.; Frank, E.; Hall, A.M.; Pal, C.J. Data Mining: Practical Machine Learning Tools and Techniques; Morgan Kaufmann: Burlington, MA, USA, 2016. [Google Scholar] [CrossRef]
- Wu, X.; Kumar, V.; Quinlan, J.R.; Ghosh, J.; Yang, Q.; Motoda, H.; McLachlan, G.J.; Ng, A.; Liu, B.; Yu, P.S.; et al. Top 10 algorithms in data mining. Knowl. Inf. Syst. 2008, 14, 1–37. [Google Scholar] [CrossRef]
- Saura, J.R. Using Data Sciences in Digital Marketing: Framework, methods, and performance metrics. J. Innov. Knowl. 2020, in press. [Google Scholar] [CrossRef]
- Larose, D.T.; Larose, C.D. Data Mining and Predictive Analytics; John Wiley & Sons, Inc: Hoboken, NJ, USA, 2015. [Google Scholar]
- Cover, T.; Hart, P. Nearest neighbor pattern classification. IEEE Trans. Inf. Theory 1967, 13, 21–27. [Google Scholar] [CrossRef]
- James, G.; Witten, D.; Hastie, T.; Tibshirani, R. An Introduction to Statistical Learning; Springer: New York, NY, USA, 2013. [Google Scholar]
- Gaudette, L.; Japkowicz, N. Evaluation methods for ordinal classification. In Proceedings of the 22nd Canadian Conference on Artificial Intelligence, Canadian AI 2009, Kelowna, BC, Canada, 25–27 May 2009; pp. 207–211. [Google Scholar]
- Bergstra, J.S.; Bardenet, R.; Bengio, Y.; Kégl, B. Algorithms for hyper-parameter optimization. Adv. Neural Inf. Process. Syst. 2011, 24, 2546–2554. [Google Scholar]
- Mantovani, R.G.; Horváth, T.; Cerri, R.; Vanschoren, J.; Carvalho, A. Hyper-parameter tuning of a decision tree induction algorithm. In Proceedings of the 5th Brazilian Conference on Intelligent Systems (BRACIS), Recife, Brazil, 9–12 October 2016; pp. 37–42. [Google Scholar] [CrossRef]
- Ben-Hur, A.; Weston, J. A user’s guide to support vector machines. In Data Mining Techniques for the Life Sciences; Carugo, O., Eisenhaber, F., Eds.; Humana Press: Totowa, NJ, USA, 2010; Volume 609, pp. 223–239. [Google Scholar]
- Aliakbary, S.; Abolhassani, H.; Rahmani, H.; Nobakht, B. Web page classification using social tags. In Proceedings of the International Conference on Computational Science and Engineering, Vancouver, BC, Canada, 29–31 August 2009; pp. 588–593. [Google Scholar] [CrossRef]
- Lee, J.-H.; Yeh, W.-C.; Chuang, M.C. Web page classification based on a simplified swarm optimization. Appl. Math. Comput. 2015, 270, 13–24. [Google Scholar] [CrossRef]
- Marath, S.T.; Shepherd, M.; Milios, E.; Duffy, J. Large-scale web page classification. In Proceedings of the 47th Hawaii International Conference on System Sciences (HICSS), Waikoloa, HI, USA, 6–9 January 2014; pp. 1813–1822. [Google Scholar] [CrossRef]
- Berger, A.L.; Mittal, V.O. OCELOT: A system for summarizing Web pages. In Proceedings of the 23rd Annual International ACM SIGIR Conference on Research and Development in Information Retrieval, Athens, Greece, 24–28 July 2000; pp. 144–151. [Google Scholar] [CrossRef]
- Sun, J.-T.; Shen, D.; Zeng, H.-J.; Yang, Q.; Lu, Y.; Chen, Z. Web-page summarization using clickthrough data. In Proceedings of the 28th Annual International ACM SIGIR Conference on Research and Development in Information Retrieval, Salvador, Brazil, 15–19 August 2005; pp. 194–201. [Google Scholar] [CrossRef]
- Zhang, Y.; Zincir-Heywood, N.; Milios, E. Term-based clustering and summarization of web page collections. In Advances in Artificial Intelligence; Tawfik, A.Y., Goodwin, S.D., Eds.; Springer: Berlin/Heidelberg, Germany, 2004; Volume 3060, pp. 60–74. [Google Scholar] [CrossRef]
- Mostafa, L. Webpage Keyword Extraction Using Term Frequency. Int. J. Comput. Theory Eng. 2013, 5, 174. [Google Scholar] [CrossRef]
- Landis, J.R.; Koch, G.G. The measurement of observer agreement for categorical data. Biometrics 1977, 33, 159–174. [Google Scholar] [CrossRef]
- Kendall, M.G. A New Measure of Rank Correlation. Biometrika 1938, 30, 81–93. [Google Scholar] [CrossRef]
- Abdullah, K.D. Search Engine Optimization Techniques by Google’s Top Ranking Factors: Website Ranking Signals; 2017. Available online: https://dl.acm.org/doi/book/10.5555/3169359 (accessed on 2 January 2021).
- Andersson, V.; Lindgren, D. Ranking Factors to Increase Your Position on the Search Engine Result Page: Theoretical and Practical Examples; Faculty of Computing, Blekinge Institute of Technology: Karlskrona, Sweden, 2017. [Google Scholar]
- Mavridis, T.; Symeonidis, A.L. Identifying valid search engine ranking factors in a Web 2.0 and Web 3.0 context for building efficient SEO mechanisms. Eng. Appl. Artif. Intell. 2015, 41, 75–91. [Google Scholar] [CrossRef]
- Sujata, J.; Noopur, S.; Neethi, N.; Jubin, P.; Udit, P. On-Page Search Engine Optimization: Study of Factors Affecting Online Purchase Decisions of Consumers. Indian J. Sci. Technol. 2016, 9, 1–10. [Google Scholar] [CrossRef]
- Jović, A.; Brkić, K.; Bogunović, N. A review of feature selection methods with applications. In Proceedings of the 38th International Convention on Information and Communication Technology, Electronics and Microelectronics (MIPRO), Opatija, Croatia, 25–29 May 2015; pp. 1200–1205. [Google Scholar]
- McGill, R.; Tukey, J.W.; Larsen, W.A. Variations of box plots. Am. Stat. 1978, 32, 12–16. [Google Scholar] [CrossRef]
- Japkowicz, N.; Shah, M. Statistical Significance Testing. In Evaluating Learning Algorithms: A Classification Perspective; Japkowicz, N., Shah, M., Eds.; Cambridge University Press: Washington, DC, USA, 2011; pp. 206–291. [Google Scholar]
- Dietterich, T.G. Approximate statistical tests for comparing supervised classification learning algorithms. Neural Comput. 1998, 10, 1895–1923. [Google Scholar] [CrossRef]
- Milton, F. A comparison of alternative tests of significance for the problem of m rankings. Ann. Math. Stat. 1940, 11, 86–92. [Google Scholar] [CrossRef]
- Nemenyi, P. Distribution-free multiple comparisons. Biometrics 1962, 18, 263. [Google Scholar]


Publisher’s Note: MDPI stays neutral with regard to jurisdictional claims in published maps and institutional affiliations. |
© 2021 by the authors. Licensee MDPI, Basel, Switzerland. This article is an open access article distributed under the terms and conditions of the Creative Commons Attribution (CC BY) license (http://creativecommons.org/licenses/by/4.0/).