Article

Machine Learning-Based Lie Detector Applied to a Novel Annotated Game Dataset

1
Department of Information and Communication Technology, Universitat Pompeu Fabra, 08026 Barcelona, Spain
2
Institute for Parallel and Distributed Systems, University of Stuttgart, 70569 Stuttgart, Germany
*
Author to whom correspondence should be addressed.
Future Internet 2022, 14(1), 2; https://doi.org/10.3390/fi14010002
Submission received: 25 October 2021 / Revised: 30 November 2021 / Accepted: 9 December 2021 / Published: 21 December 2021
(This article belongs to the Section Big Data and Augmented Intelligence)

Abstract

:
Lie detection is considered a concern for everyone in their day-to-day life, given its impact on human interactions. Thus, people normally pay attention to both what their interlocutors are saying and to their visual appearance, including the face, to find any signs that indicate whether or not the person is telling the truth. While automatic lie detection may help us to understand these lying characteristics, current systems are still fairly limited, partly due to lack of adequate datasets to evaluate their performance in realistic scenarios. In this work, we collect an annotated dataset of facial images, comprising both 2D and 3D information of several participants during a card game that encourages players to lie. Using our collected dataset, we evaluate several types of machine learning-based lie detectors in terms of their generalization, in person-specific and cross-application experiments. We first extract both handcrafted and deep learning-based features as relevant visual inputs, then pass them into multiple types of classifier to predict respective lie/non-lie labels. Subsequently, we use several metrics to judge the models’ accuracy based on the models predictions and ground truth. In our experiment, we show that models based on deep learning achieve the highest accuracy, reaching up to 57% for the generalization task and 63% when applied to detect the lie to a single participant. We further highlight the limitation of the deep learning-based lie detector when dealing with cross-application lie detection tasks. Finally, this analysis along the proposed datasets would potentially be useful not only from the perspective of computational systems perspective (e.g., improving current automatic lie prediction accuracy), but also for other relevant application fields, such as health practitioners in general medical counselings, education in academic settings or finance in the banking sector, where close inspections and understandings of the actual intentions of individuals can be very important.

1. Introduction

It is considered hard for humans to detect when someone is lying. Ekman [1] highlights five reasons to explain why it is so difficult for us: (1) during most of human history, there were smaller societies in which liars would have had more chances of being caught with worse consequences than nowadays; (2) children are not taught how to detect lies since even their parents want to hide some things from them; (3) people prefer to trust in what they are told; (4) people prefer not to know the real truth; and (5) people are taught to be polite and not steal information that is not given. However, it has been argued that it is possible for someone to learn how to detect lies in another person given sufficient feedback (e.g., that 50% of the time, that person is lying) and focusing on micro-expressions [1,2].
Building from the above, the detection of deceptive behavior using facial analysis has been proved feasible using macro- and, especially, micro-expressions [3,4,5]. However, micro-expressions are difficult to capture at standard frame rates and, given that humans can learn how to spot them to perform lie detection, the same training might be used by liars to learn how to hide them. Thus, there has been interest in detecting facial patterns of deceptive behavior that might not be visible to the naked eye, such as the heat signature of the periorbital [6] or perinasal region [7] in thermal imagery, which cannot be perceived by human vision.
One of the crucial aspects to appropriately address lie-detection research is the availability of adequate datasets, which is one fundamental element of open innovation in accelerating current research, as opposed to closed or private datasets, which characterizes the opposite counterpart (closed innovation) [8]. Regardless of current progress, however, the acquisition of training and, especially, evaluation material for lie detection is still rather a challenging task, particularly regarding the necessity to gather ground truth, namely, to know whether a person is lying or not. The main difficulty arises because such knowledge is not useful if the scenario is naively simulated (e.g., it is not sufficient to instruct a person to simply tell a lie). Research on high-stakes lies suggests that deceptive behavior can depend heavily on the potential consequences for the liar [9]. Thus, researchers have attempted to create artificial setups that can convincingly reproduce situations where two factors converge: (1) there is a potential for truthful deceptive behavior; (2) we know when a lie takes place and when the recorded subjects are telling the truth. Most attempts so far have focused on interview scenarios in which the participants are instructed to lie [6,7,10], although it is hard to simulate a realistic setting for genuine deceptive behavior. Alternatively, some researchers have worked in collaboration with police departments, with the benefit of a scenario that, in many cases, is 100% realistic, as it is based on interviews of criminal suspects. However, the problem in this setting is the ground truth: it is not possible to rely on legal decision making [11], and even the validity of confessions has been questioned [12].
In contrast, in this paper, we explore an alternative scenario where participants are recorded while playing a competitive game in which convincingly lying to the opponent(s) produces an advantage. On one hand, participants are intrinsically motivated to lie convincingly. Importantly, given the knowledge of the game rules, we can accurately determine whether a given behavior is honest or deceptive. The use of card games can also benefit from the occurrence of unexpected events that produce genuine surprise situations for the potential liar, which has been highlighted as beneficial for lie detection scenarios [9].
Thus, the goals of this paper are twofold. Firstly, we present an annotated dataset, the Game Lie Dataset (GLD), based on frontal facial recordings of 19 participants who try their best to fool their opponents in the liar card game. Secondly, we depart from the dominating trend of lie detection based on micro-expressions and investigate whether a lie can be detected by analyzing solely the facial patterns contained on single images as input to cutting-edge machine learning [13,14,15] and deep learning [16,17,18,19] facial analysis algorithms.
Using our collected dataset and several automatic lie detection models, we perform lie detection experiments under three different settings: (1) generalization test to evaluate the performance on unseen subjects; (2) person-specific test to evaluate the possibility to learn how a given participant would lie; and (3) cross-application test to evaluate how the models generalize to a different acquisition setup. Thus, the overall contributions of this work can be summarized as follows:
  • We present the GLD dataset, a novel dataset which contains colored facial data as well as ground truth (lie/true) annotations, captured during a competitive card game in which participants are rewarded for their ability to lie convincingly.
  • We also present quantitative comparisons results of several machine learning (ML) and deep learning (DL) models tested on the newly captured dataset.
  • We provide several experiments that outline the current limitations of facial-based lie detection when dealing with several different lie tasks.
The combination of our novel lie-detection dataset with the respective evaluations of current ML and DL methods are expected to benefit research in automatic lie detection systems, and can also be relevant for several targeted real-life tasks, where the understanding of generalized (in daily settings) lie intentions is important, such as the following:
  • Health practitioners/psychiatrists for general counseling: understanding whether people lie or not is important to improve their conditions, e.g., drug addictions.
  • Educator: to know whether students might be lying or not during a test or experiment.
  • Credit in the finance sector: to know if the prospective client is lying about their background and the past.
The rest of this paper is organized as follows: in Section 2, we provide an overview of the related work, both regarding previous lie-detection methods and current lie detection task datasets. In Section 3, we explain the characteristics of our collected dataset alongside the recording pipeline. In Section 4, we describe several ML- and DL-based techniques used to evaluate our dataset along with the associated evaluation metrics. In Section 5, we present our experimental results divided into generalized, person-specific and cross-task lie detection settings. Finally, in Section 6, we provide our conclusions.

2. Related Work

Different approaches and techniques have been applied for the lie detection task, with physiological cues being widely and commonly used. The most popular one is the polygraph, commonly known as a lie detection machine. Other approaches have used brain activity in order to detect deception by utilizing different neuro-imaging methods, such as fMRI [10,20,21,22]. For example, Markowitsch [22] compared brain scans from volunteers in a lie-detection experiment in which some participants were asked to lie and others had to tell the truth. It was found that when people were telling the truth, the brain region associated with sureness was activated, while in the case of lies, the area associated with mental imagination was activated. Similarly, the brain’s hemoglobin signals (fNIRS) or electrical activity (EEG) can be measured to define physiological features for lie detection [23,24,25,26].
The main drawback of the above techniques, however, is their invasive and expensive nature, due to the need for special instruments to allow data collections. This has led to the emergence of less obtrusive approaches involving verbal and non-verbal cues. Several studies focused on utilizing thermal imaging to perform the deception detection task since skin temperature has been shown to significantly rise when subjects are lying [7,27]. Furthermore, speech was also explored [28,29], e.g., by extracting features based on transcripts, part of speech (PoS) tags, or acoustic analysis (Mel-frequency cepstral coefficients).
The use of several modalities for lie detection was also investigated to see its impact in improving detection algorithms. In [30,31,32], both verbal and non-verbal features were utilized. The verbal features were extracted from linguistic features in transcriptions, while non-verbal ones consisted of binary features containing information about facial and hands gestures. In addition, Soldner et al. [32] introduced dialogue features, consisting of interaction cues. Other multi-modal approaches combined the previously mention verbal and non-verbal features together with micro-expressions [3,4,5], thermal imaging [33], or spatio-temporal features extracted from 3D CNNs [34,35].
In the last decade, there has been a growing interest in the use of facial images to perform lie detection, often based on micro-expressions [3,4,5,13,15] or facial action units [14], achieving the current state-of-the-art accuracy. Table 1 below shows an overview of the major related works outlined in this section.

Existing Lie Detection Datasets

The availability of public datasets to address a certain task (i.e., in this case, lie detection) is important to stimulate and accelerate the progress of solving the respective problem. In a way, this approach is an instance of open innovation, while it has been shown to benefit wider correspondence (including universities and companies) and as such, improve its direct impact [8] in comparison to privately developed and kept datasets (i.e., to be characterized as closed innovation). Despite there existing several works performing lie detection tasks, just a few datasets are published. In the literature, there are only two existing multi-modal, audio-visual datasets that are specifically constructed for the purpose of lie detection tasks: a multi-modal dataset based on the Box-of-Lies® TV game [32] and a multi-modal dataset using real-life Trial-Data [31].
Both the Box-of-Lies and Trial-Data include 40 labels for each gesture that a participant shows and the whole transcripts for all videos. The difference between them lies in the interactions: in the Trial data, there is only a single speaker per video, and lies are judged from the information of this single speaker. In contrast, in the Box-of-Lies® data, the lies are identified from the interaction between two people while playing a game, with emphasis on their dialogue context. Thus, the Box-of-Lies® dataset also contains annotations on participants feedback, in addition to veracity tags for each statement made. Further details of these two datasets can be seen in Table 2.
Even though previous datasets provided a way to analyze the respective lying characteristics, there still exist some limitations: the first one is that the interactions between participants are fairly limited, which are usually constrained to one-to-one lying settings. Furthermore, the facial areas are usually taken in extremely different settings and poses, which may hinder the model learning [36,37]. In this work, we present a novel dataset that involves more interactions between participants during lying, along with multiple different tasks altogether. We also record our data in a controlled environment to reduce the variability of irrelevant image characteristics, such as lighting and extreme poses, thus allowing for more precise machine learning-based modeling, capitalizing on extracted features that are inherently more relevant to achieve high level of predictions (i.e., in this case, lie detection) [38,39].

3. Game Lie Dataset

In order to establish an appropriate scenario to perform the lie actions, we opt to use a card game called "The Liar" due to the unique characteristics of this game that incentivize the participants to lie well in order to win the game. Furthermore, its simplicity and easy-to-learn aspect allow for more efficient data collection. The winner of this game is the first participant to run out of cards.
Specifically, the game consists of dealing all cards among three or more players. In theory, players must throw as many cards as they want as long as all of them have the same number. However, cards are turned face down, and thus, players can lie on the number in the cards. The game round starts when a player throws some cards and then the player on the right decides whether to believe the previous player or not. If the next player believes the previous player, he/she has to throw some cards, stating that they have the same number as the ones already thrown. If, on the contrary, the next player does not believe the previous player, the thrown cards are checked. Finally, if the previous player was telling the truth, the current player has to take the cards; otherwise, the previous player takes the cards back. Thus, all players are encouraged to perform the lies well in order to quickly reduce as many cards as possible.
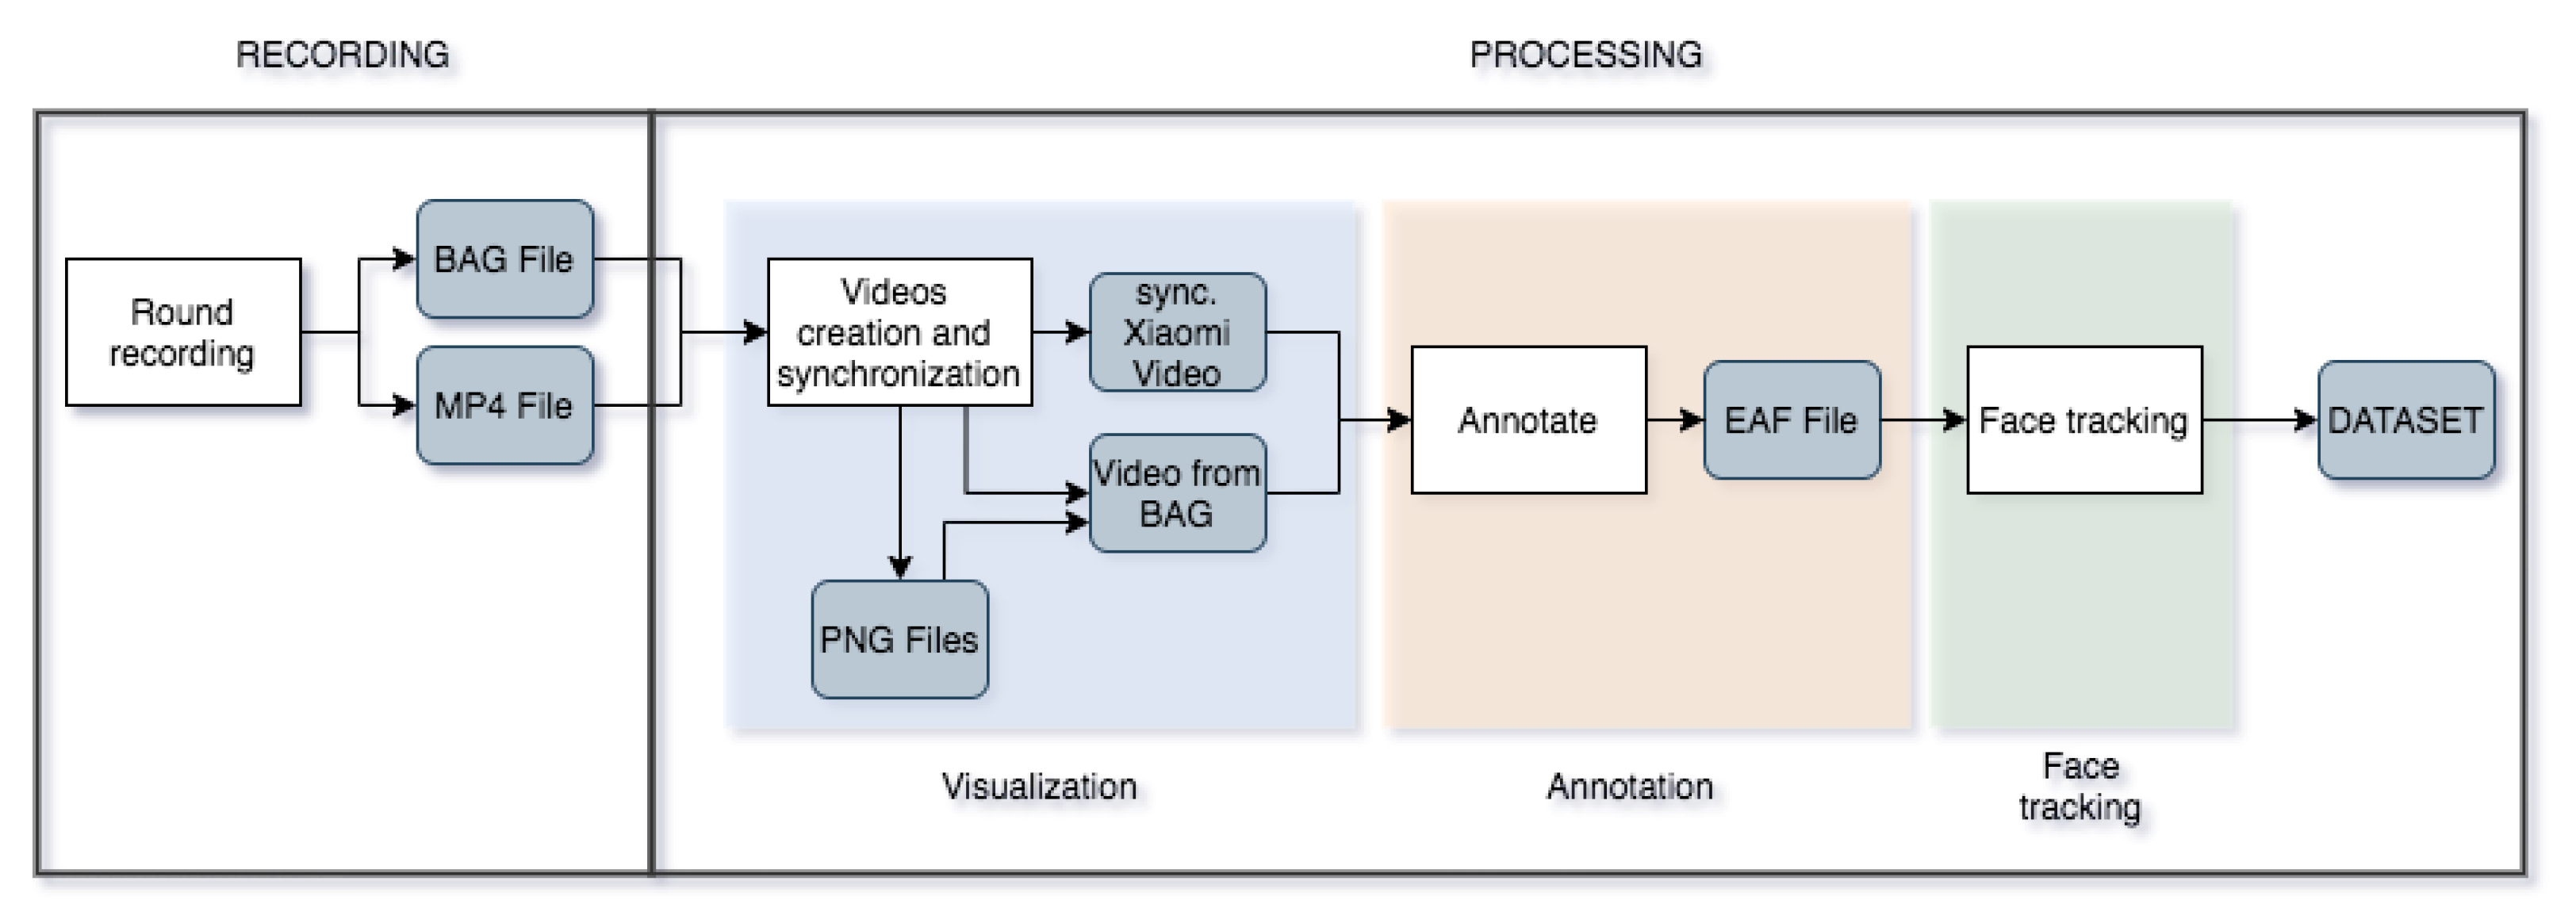
These interactions between several players, along with the incentive to lie, enable us to observe the certain gestures that people exhibit in performing the lies. Furthermore, the interactions between players also allow us to include the dynamic as time progress. The general workflow used to record this game is shown in Figure 1 which we explain in the following sections.

3.1. Materials

We used the following materials to perform the data collection: a deck of cards for the game scenario, an RGB color camera for face recording, a video camera for card recording and a pair of lamps to improve the light conditions. Specifically, we operated two Intel RealSense Cameras D415 For faces recording with a frame rate of 30 fps for the RGB images. For game cards recording, two video cameras Mi Action Camera 4K by Xiaomi were used. The overall table setup for the data recording can be seen in Figure 2.

3.2. Participants

We recorded a total of 19 participants: 8 male and 11 female. The participants were mixed graduates and undergraduates from different universities and from diverse study areas (background). The age range of the participants was between 21 years and 26 years old, and they expressed themselves in Spanish and Catalan throughout the data collections and interactions. Lastly, we gained explicit consent from all participants to use and analyze the recorded facial images for research purposes.

3.3. Data Collection

We performed the data collection in a total of eight sessions, including the number of participants assigned to the different groups. These groups varied between 3 and 6 participants and several rounds of game playing were performed in every session. Furthermore, two participants were recorded at a time in each round. The scenario was set such that each camera was able to record a single face from the front and the other video cameras were located next to the recorded players’ hands in order to record their cards. This allowed us to listen to the players’ statements and determine whether they were lying, according to the cards in the recording, which was crucial during the annotation process.

3.4. Data Annotation and Pre-Processing

We began our data annotation and pre-processing task by synchronizing our recorded videos of face and corresponding cards. This was done in order to determine if the corresponding player was lying. These synchronized videos were subsequently annotated with ELAN software to create comment stamps in a selected space of time. Together with these annotations, we were able to find the statements corresponding to the proper frames. Finally, we extracted the facial area using [40], using relevant RGB frames, and cropped them to be saved as an image in the final collected dataset, as well as a point-cloud file.

3.5. Dataset Contents

We created a structured folder (the exact structure can be seen in Figure A1 in the Appendix A) to ease future data loading and understanding during dissemination, with all recorded data stored to a root folder named Game Lies Dataset. Both images and 3D objects were named, following a convention, as follows: 1_2.PNG or 3_4.PLY. The first number (1 and 3 in the example) corresponds to the number of the statement, and the second number (2 and 4) is the corresponding statement frame. In this instance, the PNG example corresponds to the second frame of the first statement made by the participant in the recording.
In the end, our collected Game Lies Dataset or GLD contains data from 26 recordings with 18 different faces and a total number of frames of 15,566 of which 6476 correspond to lies (41.6%) and 9090 to true (58.4%). These frames correspond to a total of 417 statements, 170 of which are lies (40.8%) and 247 are true (59.2%). Hence on average, each lie statement has 38 frames, and true statements consist of about 37 frames.
The examples of the recorded participants can be seen in Figure 3. Notice that in several examples, the overall facial expressions are relatively similar, so it could be a challenging task for any visual-based lie detection algorithm. Thus, using these data, we can expect to perform an appropriate test for the effectiveness of the current machine learning-based lie detection approaches, which we detail in the next sections.

4. Methodology

We use our recorded GLD datasets to evaluate both classical machine learning approaches and deep learning techniques for this specific lie detection task. In this context, we use the facial area as main modality, with the lie labels obtained following our protocol explained on our dataset collections.

4.1. Classical Machine Learning

We use three different handcrafted features that are extracted from RGB facial images: local binary patterns (LBP), histogram of oriented gradients (HOG) and scale-invariant feature transform (SIFT).
  • We follow the approach of [41] to use LBP to model the facial area. Specifically, each image is divided into blocks, where LBP is independently computed and results in a LBP histogram. The histograms from all images’ blocks are then concatenated to form the final descriptor. We also vary the number of (P) used to compute the final descriptor along with the number of blocks to see their impacts. We use the parameter values of P of 8, 12 and 16, with the number of blocks of 1 × 1, 2 × 2, 4 × 4 and 8 × 8. For technical implementation, we use Scikit-image library [42] to extract LBP descriptors given the image input.
  • Given the overall facial area, we calculate the HOG histogram, using fixed number of 8 bins, with different number of cells and blocks to test how their impact affects classification performance. We use 1 × 1 and 2 × 2 HOG cell sizes, and partition the images into 8 × 8 and 16 × 16 pixel sizes. We also use Scikit-image ([42]) for technical implementation.
  • We calculated the SIFT features by performing the centroids k-clustering that involves the computation of K-means for all SIFT keypoints. Specifically, the K-means algorithm is performed by splitting a set of N samples of X onto K separated clusters of C whereby each of instance is explained by the mean μ j of the samples in the cluster. This is done by minimizing the inertia criterion of i = 0 n min μ j C x i μ j 2 , with n as the total input samples. In this case, we create histograms with different K bins values (100, 300, 500 and 800) for each key point in an image [43] to further evaluate how the histogram length and BoW size impact the classification. We use [44,45] for the technical implementation.
Using these handcrafted features, we then employ three classifiers to predict the lie label (all implementations are based on Scikit-learn library [45]): support vector machine (SVM), AdaBoost, and linear discriminant analysis (LDA). Specifically, given the input features x i R , i = 1 , , n and a vector y containing the binary label of −1 (non lie) and 1 (lie) thus y { 1 , 1 } n , the SVM is optimized by finding the normal vector w R , the kernel ϕ (which can be linear or non-linear), and the bias b R that results in the prediction of sign w T ϕ ( x ) + b to be correct throughout the majority of samples. This process is formulated in Equation (1) below:
min w , b , ζ 1 2 w T w + C i = 1 n ζ i subject to y i w T ϕ x i + b 1 ζ i ζ i 0 , i = 1 , , n
where ζ i is the distance from the evaluated features to the decision hyperplane and C is a penalty term that controls the amount of samples allowed to cross the learned boundary (to the region that corresponds to the opposite class). These operations maximize the margin by minimizing w 2 = w T w , while including a penalty when a sample is misclassified or within the margin from the boundary.
As for the AdaBoost method, we first form the decision tree that recursively splits the feature space such that samples with the targeted labels are grouped together. Thus letting the input at node m be defined as Q m with N m samples, then each candidate split θ =   j , t m containing the feature j and threshold t m partitions the data into Q m left ( θ ) and Q m right ( θ ) subsets as shown in Equation (2):
Q m l e f t ( θ ) = ( x , y ) x j < = t m Q m r i g h t ( θ ) = Q m Q m l e f t ( θ )
subsequently, multiple instances of this decision tree are fit into selected subsets of the training data (where incorrect grouping tends to occur), thus adjusting to more difficult cases [46].
The last classifier of LDA is constructed by deriving the generic probabilistic model that defines conditional distribution of the data P ( x | y ^ = y ) for both of class y. Bayes’ rule then is used to obtain the prediction of each sample x with multi-variate Gaussian distribution. These processes are described on the formula in Equation (3):
P ( x y ^ = y ) = 1 ( 2 π ) d / 2 Σ y 1 / 2 exp 1 2 x μ y t Σ y 1 x μ y
where we assume that each class has a similar covariance matrix Σ y = Σ for all y, and x μ y t Σ 1 x μ y corresponds to the Mahalanobis distance between the sample x and the mean μ y . Given this probability density, we evaluate all posterior probability and selecting the class k which yields the maximum value. Finally, the overall pipelines of the classical ML-based models outlined in this section are summarized in Figure 4.

4.2. Deep Learning

For the deep learning-based approach, we perform transfer learning by means of the embedded features from VGG-Very-Deep-16 CNN [47]. Specifically, we feed the cropped facial to the pre-trained VGG model, and store the embedded features. Using these embedded features, we then train the similar classifiers as explained in previous sections to obtain the baseline results.
To enable a fully trained deep learning model, we then use the CNN features as an input to the fully connected neural networks consisting of two hidden layers with 256 and 128 units, respectively, and an output layer. Both hidden layers use the rectified linear unit (ReLU) as the activation function, whereas the output unit uses the sigmoid activation function that classifies True (lies) and False (not lies) samples. The model is compiled with the Adam optimizer with a learning rate of 0.001 and uses the binary cross-entropy loss. We utilize Keras library [48] for concrete implementation. Finally, Figure 5 shows the overview of these processes.

4.3. Comparison Metrics

We use both the Accuracy (ACC) and F1-score to judge the quality of the lie estimations of all evaluated approaches. To calculate these metrics, we need to first produce the TP (True Positive), FP (False Positive), TN (True Negative), and FN (False Negative) by comparing the predictions with ground truth. Then, we calculate the accuracy as shown in Equation (4) below:
Accuracy = TP + TF TP + TF + FP + FN
Whereas to calculate F1 score, we additionally need to compute the precision and recall as shown in Equations (5) and (6), respectively:
Precision = TP TP + FP
Recall = TP TP + FN
Finally, the F1-score is calculated using the formula as shown in Equation (7):
F 1 = 2 Precision Recall Precision + Recall = 2 TP 2 TP + FP + FN

5. Experiments

We perform three different experiments for the lie detection tasks: generalization test, person-specific test, and cross lie detection test. The first experiment evaluates the generalization capacity of the trained lie detector (cf. Section 4) to predict the lie status of the never-seen-before participant (i.e., not used for training).
The second test assesses the full potential of the lie detector when dealing with a unique participant (i.e., customized to a person). This is motivated by the recent report from [49] suggesting that the personal lying expressions may not be universal. Furthermore, the feel and willingness to perform the lying action itself may also differ per person; while someone can feel displeased when lying, other people could enjoy it [50]. Thus, by building and testing a specialized model for each participant, we can see the theoretical limit of our proposed lie detector.
Finally, the real-life test demonstrates the potential real-life use of the lie detector to deal with different kinds of lying conditions and with limited data. This test consists of taking the model with the best performance for both of the previous experiments, and assessing their performance with real-time lie detection (from different tasks).

5.1. Generalized Models

This section evaluates several ML and DL models on the general lie task setting using several metrics defined on the methodology section.

5.1.1. Experiment Settings

We used our recorded GLD dataset to perform the experiments by splitting the available recording following five-fold cross validations schemes. We extracted relevant features from both handcrafted and VGG features, using the corresponding split. Then, we used them to train all classifiers (SVM, LDA and FC). Finally, we tested it using the associated test split, and measured the performance using the defined metrics (cf. Section 4.3).

5.1.2. Experiment Results of Classical Machine Learning

Table 3 shows the five-fold cross validations accuracy and F1-score from LBP descriptors combined with several classifiers (SVM, AdaBoost and LDA). We can see that the best results were obtained with the use of Adaboost, reaching 52.6% accuracy and a 52 F1-score (indicated with bold face in respective table), which is better than those of using other classifiers, such as SVM and LDA. Furthermore, in general, we notice that the use of 12 points of neighboring (i.e., P = 12), and dividing the image with 2 × 2 grid values produce the best results. This suggests that modest values of parameters are advantageous to improve the lie estimates.
We can see the results of HOG descriptor on the Table 4, that is obtained using similar five-cross validation settings. We can see a similar pattern with the results from LBP, where using the 8 × 8 grid size with the modest value of 2 × 2 block cells to compute the histogram produces better results. Furthermore, we note that the best accuracy is achieved by AdaBoost, achieving the accuracy 53% and 52.8 F1-score, respectively.
Finally, the results obtained for SIFT descriptors can be seen in Table 5 with the varying number of the bag of words (BoW∼K). Here, we found that in general, the use of a K value of 800 is beneficial. Furthermore, using AdaBoost classifier achieves the maximum results with an accuracy of 53% and a F1 value of 52.2.
Figure 6 shows the examples of TP, FP, TN and FN of each best performer of the classical machine learning models. Notice that the facial expressions are quite similar across the examples, with slight changes happening in the mouth area in the case of both being correctly classified as lies (TP and FN). However, on the failed recognition (FP and FN), the facial area is mostly neutral, which may thus confuse the proposed methods in their predictions.

5.1.3. Experiment Results of Deep Learning

We present the results of the use of CNN features with both classical classifiers (LDA, Adaboost, SVM) and neural network based classifier of FC on the Table 6. We can see that results from the use of classical classifiers are quite similar to the results from previous sections, which are modest, suggesting its limitations. Furthermore, we found that using SVM leads to erroneous values (e.g., the lie values are predicted as one class, i.e., no change), thus producing the Na value. However, upon the use of the FC-based classifier, the results are improved, reaching 57.4% accuracy and a 58.3 F1 value, respectively. We need to also note that in one fold, the VGG + FC models were able to reach 62.76% accuracy and 64.34 F1 value, separately, as shown in Table 7. This indicates the compatibility and superiority of the deep learning based model for these lie detection tasks.
We show in Figure 7 the visual examples of the TP, FP, TN and FN cases of the deep feature-based lie detector. We can observe that in general, there is more variety in the facial expressions compared to the examples from the classical machine learning-based detector across examples. We also see that in the case of failure (FP and FN), the expressions are also more visible compared to neutral. However, there also seems to be similarity in that in the case of the correctly classified label (TP and TN), the visual changes happen in the mouth area in this example. This variety of expressions suggests the expressiveness of the VGG features, which may be helpful to more accurately classify the lie compared to the hand-crafted based descriptor.

5.1.4. Overall Comparisons

We can see the overall comparisons of the best performers for all evaluated models in Table 8. Overall, we can see that the classical machine learning technique for lie detection yields quite modest results (close to 50% accuracy). In other hand, the deep learning based model produces more accurate estimates, achieving the best accuracy so far in this dataset of 57.4% and 58.3 F1 accuracy. Indeed our produced results are quite comparable with the other relevant works for lie detection. Such as the reports from [32], where the classical machine learning-based approach was used (i.e., random forest) and [31] where real humans are employed. Given the current results, we can concur that the general lie-detection task is quite challenging (even also in comparison with real human ability) and the use of the various ML/DL based models provides further insights on how much the current automatic lie detection approach can handle. In the next section, we show how our predictions can be improved by targeting each specific individual separately to learn his/her personal unique characteristics when attempting to lie.

5.2. Person Specific Models

This section evaluates the highest accuracy limit achieved by the best performing models from the previous section when dealing with specific lying characteristics of each participant.

5.2.1. Experiment Settings

In this experiment, we use the best performer model from previous comparisons (i.e., VGG + FC) for individual-based lie detection. We do this by training the model on an equal number of frames for each participant, and testing it on the other frames’ counterparts.

5.2.2. Experiment Results

Table 9 summarizes the obtained test accuracy for all participants, with column “ALL” containing the mean of the achieved results. Here, we can observe that the overall prediction accuracy is higher, with an average accuracy of 65% and F1 score of 63.12, and a maximum accuracy of 97.8% and F1 score of 65.7 in the case of participant 11. This higher accuracy may indicate the ease of the tasks that the proposed model handles given the narrow examples and specialized facial expressions that the person projects during lying. Thus, it further confirms the previously mentioned hypothesis of the unique characteristics of each person in performing the lying. Therefore, the formation of personal, specialized models tailored to each individual could be used as an additional step to improve lie detection in the application domain.

5.3. Cross Lie Detection Tasks

In this section, the best-performing models from the two previous sections are integrated into a single real-time detection algorithm and exposed to a different lie task.

5.3.1. Experiment Settings

We perform two major cross lie tasks in this experiment that consist of card number uttering and sentence filling. The first test is the simulation of the cards game, where the subject holding a deck of cards has to take one card and either utter the real number or to produce a fake number. The second one in the other hand involves the reading of some sentences with blank spaces that have to be filled by the subject with either real or fake information at the time of reading each sentence (the example sentences can be found in the Appendix B). We perform both tests by involving a training participant and two test subjects. That is, we first train the model using the data from the training participant when performing both tasks (thus, they are quite comparable to the person-specific task in Section 5.2, though now in a different task). Subsequently, we use the pre-trained model to detect the lies from the two test subjects when conducting similar tasks.
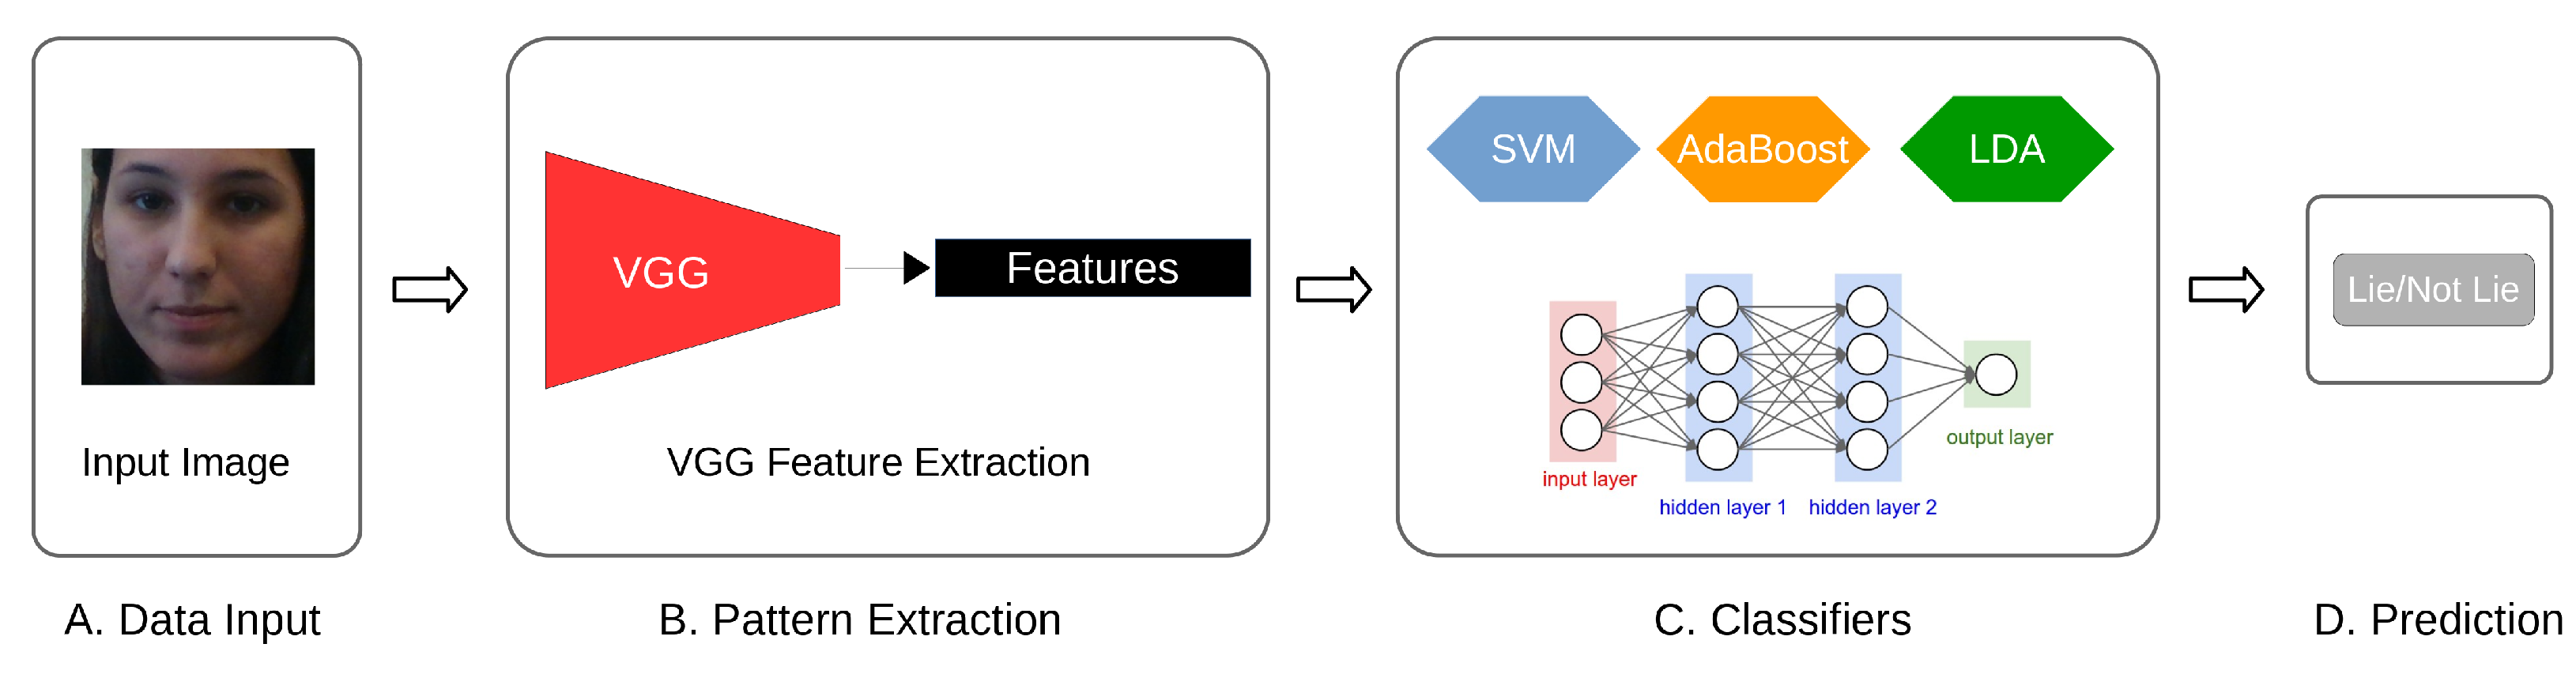
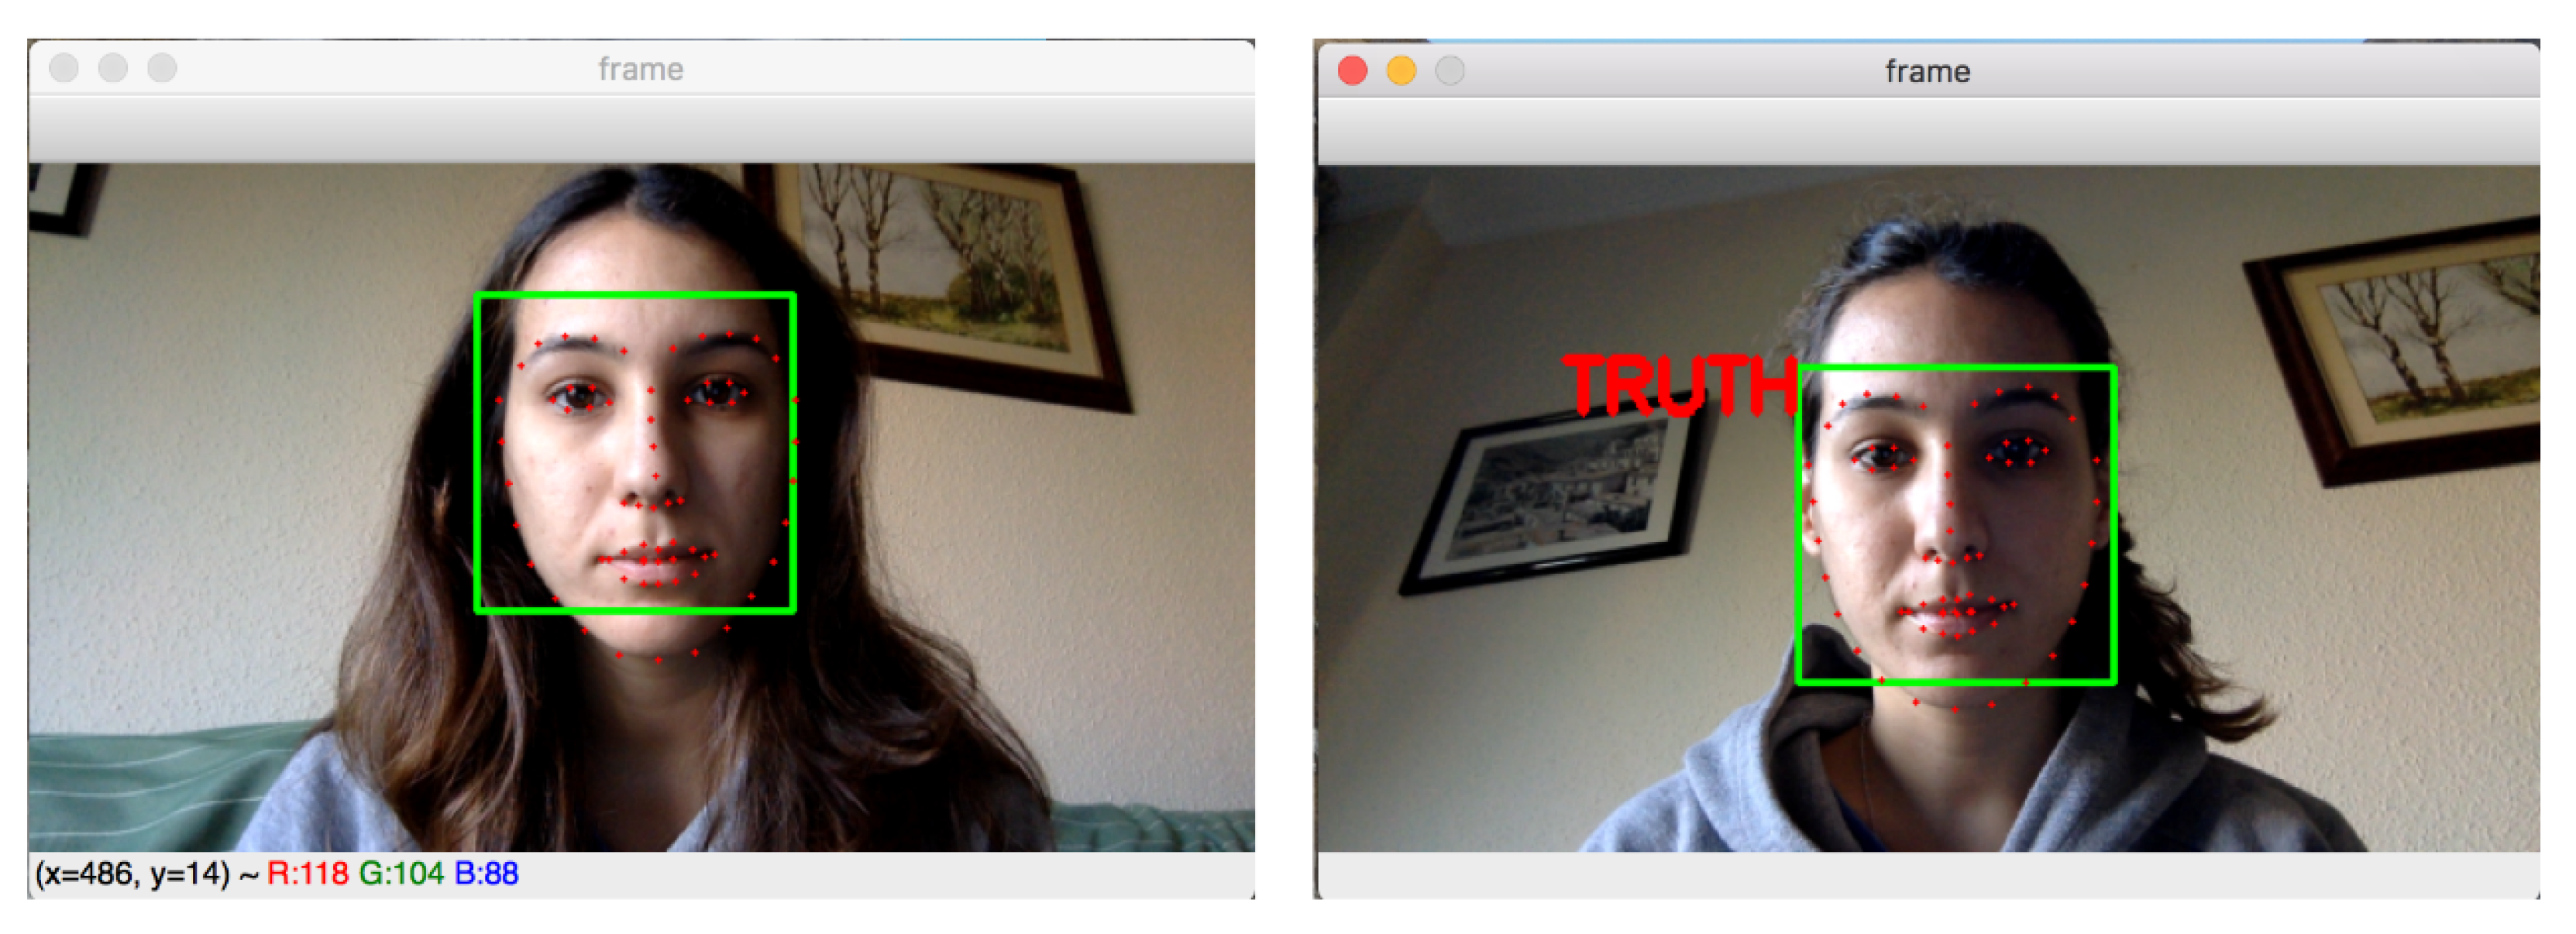
To collect the samples, we implement a simple application that integrates different modules: face tracking and cropping [51], VGG-face 512-dimensional feature prediction [52] and prediction samples as True (not lie) or False (lie). The example of the proposed program can be seen in Figure 8. Using this program on the fly, then we can predict a statement made by the participants. That is, the statement is considered a lie if more than 30% of the frames are predicted as “lie” by the proposed program.

5.3.2. Experiment Results

Table 10 presents the results obtained from the evaluation for both tasks. As expected, we can see that the proposed model struggles to correctly predict the true lie label, both on the training and test sets judged by their low accuracy. Specifically, the best training accuracy of 52% and F1 score of 54.9 are far lower than those of the person-specific test (cf. Section 5.2) of 65% and 63.12, respectively. Furthermore, the results of the test predictions are also considerably low, only reaching 43.59 and a F1 score of 38.1. This indicates the difficulty of this prediction task, considering the different characteristics of the lying condition itself in combinations with the personalized ways of people during lying. These findings would be relevant during applications, especially as a note that differently trained lie detector models may inherently be better if tailored to the specific cases to which they are exclusively trained/designed (i.e., to train the model to each specific lying task).

6. Conclusions

In this paper, we presented a comparison of several machine learning-based lie detection models applied to our newly collected Game Lie Dataset (GLD). We did so by first collecting the new dataset using several instrumentations and involving 19 participants during the customized card game to incite the lying conditions. Secondly, we pre-processed the data in a structured way to allow for easier loading and future dissemination. Lastly, we cropped the facial area and performed the annotation to complete the dataset productions.
Using our collected dataset, we built classical machine learning models by adopting three handcrafted based features of LBP, HOG and SIFT that were later used for lie classification using classical classifier of SVM, Adaboost and LDA. Furthermore, we included the deep learning-based feature of VGG to build a fully end-to-end system, involving fully connected layers to be compared with its semi-classical counterparts by using aforementioned classical classifiers for predictions.
To evaluate the proposed models for lie detection tasks, we performed three main experiments: generalized tests, person-specific tests, and cross lie detection tests. On the generalized tests, we found the limitation of classical methods compared to deep learning-based models based on the higher accuracy reached by the latter. Visual inspections further revealed more diverse expressions captured by deep learning-based model compared to the classical approach, suggesting its effectiveness. On the second task, we showed that a generally higher accuracy was achieved by our model, given its simpler tasks in dealing only with a specific individual, allowing for more effective learning. This also confirms the hypothesis of unique facial expressions made by each individual during lying. Then on the last task, we noticed the difficulty of the models in properly predicting the lie labels, given the inherent characteristics of the new tasks associated with unique ways of lying.
In the future, we plan to record additional physiological signals to improve the model estimations and to open more diverse analyses. Lastly, the findings of our work could be utilized for several potential applications, where the knowledge of one’s true intentions (lie detection) on a daily basis are of paramount importance, such as for health counseling, academic examinations or banking credit scenarios.

Author Contributions

N.R.-D., data curation, formal analysis, investigation, methodology, software, visualization, writing—original draft, and resources; D.A., formal analysis, visualization, validation, writing—review and editing, project administration, and supervision; F.M.S., formal analysis, validation, and writing—review and editing; X.B., project administration, funding acquisition, writing—review and editing, supervision, and resources. All authors have read and agreed to the published version of the manuscript.

Funding

This work is partly supported by the Spanish Ministry of Economy and Competitiveness under project grant TIN2017-90124-P, the Maria de Maeztu Units of Excellence Programme (MDM-2015-0502), the donation bahi2018-19 to the CMTech at UPF, and UDeco project by Germany BMBF-KMU Innovativ.

Institutional Review Board Statement

The study was conducted according to the guidelines approved by the Institutional Committee for Ethical Review of Projects (CIREP-UPF) with reference number: 2017/7496/I, 27-06-2017.

Informed Consent Statement

Informed consent was obtained from all subjects involved in the study.

Data Availability Statement

The dataset can be requested via formal communication through authors email.

Conflicts of Interest

The authors declare no conflict of interest.

Appendix A. The Structure of Recorded Dataset

Figure A1 below shows an overview of the structured folders of our recorded dataset.
Figure A1. The structured folder of our collected dataset.
Futureinternet 14 00002 g0a1

Appendix B. Example of the Sentences

1. My name is _______.
2. I was born on _____(month), _____(day), _____(year).
3. I live in _____________.
4. I have _____________siblings.
5. Right now, I am at _____________.
6. It is _____________(time).
7. My telephone number is _____________.
8. On holidays I am going to _____________.
9. Today I had _____________ for lunch.
10. Today I woke up at _____________.

References

  1. Ekman, P. Lie Catching and Microexpressions. Philos. Decept. 2009, 1, 118–138. [Google Scholar]
  2. Haggard, E.A.; Isaacs, K.S. Micromomentary facial expressions as indicators of ego mechanisms in psychotherapy. In Methods of Research in Psychotherapy; Springer: Boston, MA, USA, 1966; pp. 154–165. [Google Scholar] [CrossRef]
  3. Wu, Z.; Singh, B.; Davis, L.; Subrahmanian, V. Deception detection in videos. In Proceedings of the AAAI Conference on Artificial Intelligence, New Orleans, LA, USA, 2–7 February 2018. [Google Scholar]
  4. Pérez-Rosas, V.; Mihalcea, R.; Narvaez, A.; Burzo, M. A Multimodal Dataset for Deception Detection. In Proceedings of the Ninth International Conference on Language Resources and Evaluation, LREC, Reykjavik, Iceland, 26–31 May 2014; pp. 3118–3122. [Google Scholar]
  5. Ding, M.; Zhao, A.; Lu, Z.; Xiang, T.; Wen, J.R. Face-Focused Cross-Stream Network for Deception Detection in Videos. In Proceedings of the IEEE/CVF Conference on Computer Vision and Pattern Recognition, Long Beach, CA, USA, 15–20 June 2019. [Google Scholar] [CrossRef] [Green Version]
  6. Tsiamyrtzis, P.; Dowdall, J.; Shastri, D.; Pavlidis, I.T.; Frank, M.; Ekman, P. Imaging facial physiology for the detection of deceit. Int. J. Comput. Vis. 2007, 71, 197–214. [Google Scholar] [CrossRef]
  7. Dcosta, M.; Shastri, D.; Vilalta, R.; Burgoon, J.K.; Pavlidis, I. Perinasal indicators of deceptive behavior. In Proceedings of the 2015 11th IEEE International Conference and Workshops on Automatic Face and Gesture Recognition (FG), Ljubljana, Slovenia, 4–8 May 2015; Volume 1, pp. 1–8. [Google Scholar]
  8. Baierle, I.; Benitez, G.; Nara, E.; Schaefer, J.; Sellitto, M. Influence of open innovation variables on the competitive edge of small and medium enterprises. J. Open Innov. Technol. Mark. Complex. 2020, 6, 179. [Google Scholar] [CrossRef]
  9. Porter, S.; ten Brinke, L. The truth about lies: What works in detecting high-stakes deception? Leg. Criminol. Psychol. 2010, 15, 57–75. [Google Scholar] [CrossRef] [Green Version]
  10. Mohamed, F.B.; Faro, S.H.; Gordon, N.J.; Platek, S.M.; Ahmad, H.; Williams, J.M. Brain mapping of deception and truth telling about an ecologically valid situation: Functional MR imaging and polygraph investigation—Initial experience. Radiology 2006, 238, 679–688. [Google Scholar] [CrossRef] [PubMed] [Green Version]
  11. Vrij, A. Detecting Lies and Deceit: Pitfalls and Opportunities; John Wiley & Sons: Hoboken, NJ, USA, 2008. [Google Scholar]
  12. Frank, M.G.; Menasco, M.A.; O’Sullivan, M. Human behavior and deception detection. In Wiley Handbook of Science and Technology for Homeland Security; John Wiley & Sons, Inc.: Hoboken, NJ, USA, 2008; pp. 1–12. [Google Scholar]
  13. Owayjan, M.; Kashour, A.; Haddad, A.; Fadel, M.; Souki, A. The Design and Development of a Lie Detection System using Facial Micro-Expressions. In Proceedings of the 2012 2nd International Conference on Advances in Computational Tools for Engineering Applications (ACTEA), Beirut, Lebanon, 12–15 December 2012; pp. 33–38. [Google Scholar] [CrossRef]
  14. Avola, D.; Cinque, L.; Foresti, G.L.; Pannone, D. Automatic deception detection in rgb videos using facial action units. In Proceedings of the 13th International Conference on Distributed Smart Cameras, Trento, Italy, 9–11 September 2019; pp. 1–6. [Google Scholar]
  15. Littlewort, G.; Frank, M.; Lee, K. Automatic Decoding of Facial Movements Reveals Deceptive Pain Expressions. Curr. Biol. 2014, 24, 738–743. [Google Scholar] [CrossRef] [Green Version]
  16. Aspandi, D.; Sukno, F.; Schuller, B.; Schuller, B.; Binefa, X. An Enhanced Adversarial Network with Combined Latent Features for Spatio-temporal Facial Affect Estimation in the Wild. In Proceedings of the 16th International Joint Conference on Computer Vision, Imaging and Computer Graphics Theory and Applications ( VISAPP 2021)—Volume 4; SciTePress: Setúbal, Portugal, 2021; pp. 172–181. [Google Scholar] [CrossRef]
  17. Comas, J.; Aspandi, D.; Binefa, X. End-to-end Facial and Physiological Model for Affective Computing and Applications. In Proceedings of the 2020 15th IEEE International Conference on Automatic Face and Gesture Recognition (FG 2020) (FG), Buenos Aires, Argentina, 16–20 November 2020; IEEE Computer Society: Buenos Aires, Argentina, 2020; pp. 1–8. [Google Scholar] [CrossRef]
  18. Aspandi, D.; Mallol-Ragolta, A.; Schuller, B.; Binefa, X. Latent-Based Adversarial Neural Networks for Facial Affect Estimations. In Proceedings of the 2020 15th IEEE International Conference on Automatic Face and Gesture Recognition (FG 2020) (FG), Buenos Aires, Argentina, 16–20 November 2020; pp. 348–352. [Google Scholar]
  19. Aspandi, D.; Martinez, O.; Sukno, F.; Binefa, X. Fully end-to-end composite recurrent convolution network for deformable facial tracking in the wild. In Proceedings of the 2019 14th IEEE International Conference on Automatic Face & Gesture Recognition (FG 2019), Lille, France, 14–18 May 2019; pp. 1–8. [Google Scholar]
  20. Kozel, F.; Johnson, K.; Mu, Q.; Grenesko, E.; Laken, S.; George, M. Detecting Deception Using Functional Magnetic Resonance Imaging. Biol. Psychiatry 2005, 58, 605–613. [Google Scholar] [CrossRef]
  21. Simpson, J.R. Functional MRI Lie Detection: Too Good to be True? J. Am. Acad. Psychiatry Law Online 2008, 36, 491–498. [Google Scholar]
  22. Markowitsch, H. Memory and Self–Neuroscientific Landscapes. ISRN Neurosci. 2013, 2013, 176027. [Google Scholar] [CrossRef]
  23. Bhutta, R.; Hong, K.S.; Naseer, N.; Khan, M. Spontaneous lie detection using functional near-infrared spectroscopy in an interactive game. In Proceedings of the 2015 10th Asian Control Conference (ASCC), Kota Kinabalu, Malaysia, 31 May–3 June 2015; pp. 1–5. [Google Scholar] [CrossRef]
  24. Bhutta, M.R.; Hong, M.J.; Kim, Y.H.; Hong, K.S. Single-trial lie detection using a combined fNIRS-polygraph system. Front. Hum. Neurosci. 2015, 6, 709. [Google Scholar] [CrossRef] [Green Version]
  25. Li, F.; Zhu, H.; Xu, J.; Gao, Q.; Guo, H.; Wu, S.; Li, X.; He, S. Lie Detection Using fNIRS Monitoring of Inhibition-Related Brain Regions Discriminates Infrequent but not Frequent Liars. Front. Hum. Neurosci. 2018, 12, 71. [Google Scholar] [CrossRef]
  26. Lai, Y.F.; Chen, M.Y.; Chiang, H.S. Constructing the lie detection system with fuzzy reasoning approach. Granular Comput. 2018, 3, 169–176. [Google Scholar] [CrossRef]
  27. Warmelink, L.; Vrij, A.; Mann, S.; Leal, S.; Forrester, D.; Fisher, R. Thermal Imaging as a Lie Detection Tool at Airports. Law Hum. Behav. 2010, 35, 40–48. [Google Scholar] [CrossRef] [PubMed]
  28. Hershkovitch Neiterman, E.; Bitan, M.; Azaria, A. Multilingual Deception Detection by Autonomous Agents. In Companion Proceedings of the Web Conference 2020; ACM/IW3C2: Taipei, Taiwan, 2020; pp. 480–484. [Google Scholar]
  29. Jaiswal, M.; Tabibu, S.; Bajpai, R. The Truth and Nothing But the Truth: Multimodal Analysis for Deception Detection. In Proceedings of the 2016 IEEE 16th International Conference on Data Mining Workshops (ICDMW), Barcelona, Spain, 12–15 December 2016; pp. 938–943. [Google Scholar] [CrossRef] [Green Version]
  30. Pérez-Rosas, V.; Abouelenien, M.; Mihalcea, R.; Xiao, Y.; Linton, C.; Burzo, M. Verbal and Nonverbal Clues for Real-life Deception Detection. In Proceedings of the 2015 Conference on Empirical Methods in Natural Language Processing, Lisbon, Portugal, 17–21 September 2015; pp. 2336–2346. [Google Scholar] [CrossRef]
  31. Pérez-Rosas, V.; Abouelenien, M.; Mihalcea, R.; Burzo, M. Deception Detection using Real-life Trial Data. In Proceedings of the 2015 ACM on International Conference on Multimodal Interaction, Seattle, WA, USA, 9–13 November 2015; pp. 59–66. [Google Scholar] [CrossRef]
  32. Soldner, F.; Pérez-Rosas, V.; Mihalcea, R. Box of Lies: Multimodal Deception Detection in Dialogues. In Proceedings of the 2019 Conference of the North American Chapter of the Association for Computational Linguistics: Human Language Technologies, Minneapolis, MN, USA, 2–7 June 2019; Volume 1 (Long and Short Papers). pp. 1768–1777. [Google Scholar] [CrossRef]
  33. Abouelenien, M.; Pérez-Rosas, V.; Mihalcea, R.; Burzo, M. Deception detection using a multimodal approach. In Proceedings of the 16th International Conference on Multimodal Interaction, Istanbul, Turkey, 12–16 November 2014; pp. 58–65. [Google Scholar] [CrossRef]
  34. Krishnamurthy, G.; Majumder, N.; Poria, S.; Cambria, E. A Deep Learning Approach for Multimodal Deception Detection. arXiv 2018, arXiv:1803.00344. [Google Scholar]
  35. Gogate, M.; Adeel, A.; Hussain, A. Deep learning driven multimodal fusion for automated deception detection. In Proceedings of the 2017 IEEE Symposium Series on Computational Intelligence (SSCI 2017), Honolulu, HI, USA, 27 November–1 December 2017; pp. 1–6. [Google Scholar] [CrossRef]
  36. Aspandi, D.; Martinez, O.; Sukno, F.; Binefa, X. Robust facial alignment with internal denoising auto-encoder. In Proceedings of the 2019 16th Conference on Computer and Robot Vision (CRV), Kingston, QC, Canada, 29–31 May 2019; pp. 143–150. [Google Scholar]
  37. Zhang, H.; Li, Q.; Sun, Z.; Liu, Y. Combining data-driven and model-driven methods for robust facial landmark detection. IEEE Trans. Inf. Forensics Secur. 2018, 13, 2409–2422. [Google Scholar] [CrossRef] [Green Version]
  38. Aspandi, D.; Martinez, O.; Sukno, F.; Binefa, X. Composite recurrent network with internal denoising for facial alignment in still and video images in the wild. Image Vis. Comput. 2021, 111, 104189. [Google Scholar] [CrossRef]
  39. Dong, X.; Yan, Y.; Ouyang, W.; Yang, Y. Style aggregated network for facial landmark detection. In Proceedings of the IEEE Conference on Computer Vision and Pattern Recognition, Salt Lake City, UT, USA, 18–23 June 2018; pp. 379–388. [Google Scholar]
  40. Kazemi, V.; Sullivan, J. One millisecond face alignment with an ensemble of regression trees. In Proceedings of the IEEE Conference on Computer Vision and Pattern Recognition, Columbus, OH, USA, 24–27 June 2014; pp. 1867–1874. [Google Scholar]
  41. Ahonen, T.; Hadid, A.; Pietikainen, M. Face Description with Local Binary Patterns: Application to Face Recognition. IEEE Trans. Pattern Anal. Mach. Intell. 2006, 28, 2037–2041. [Google Scholar] [CrossRef]
  42. van der Walt, S.; Schönberger, J.L.; Nunez-Iglesias, J.; Boulogne, F.; Warner, J.D.; Yager, N.; Gouillart, E.; Yu, T.; the scikit-image contributors. scikit-image: Image processing in Python. PeerJ 2014, 2, e453. [Google Scholar] [CrossRef]
  43. Singh, S.K. Classifying Facial Emotions via Machine Learning. 2019. Available online: https://sks147.medium.com/classifying-facial-emotions-via-machine-learning-5aac111932d3 (accessed on 6 May 2019).
  44. Bradski, G. The openCV library. Dr. Dobb’s J.: Softw. Tools Prof. Program. 2000, 25, 120–123. [Google Scholar]
  45. Pedregosa, F.; Varoquaux, G.; Gramfort, A.; Michel, V.; Thirion, B.; Grisel, O.; Blondel, M.; Prettenhofer, P.; Weiss, R.; Dubourg, V.; et al. Scikit-learn: Machine Learning in Python. J. Mach. Learn. Res. 2011, 12, 2825–2830. [Google Scholar]
  46. Freund, Y.; Schapire, R. A decision-theoretic generalization of on-line learning and an application to boosting. J. Comput. Syst. Sci. 1997, 55, 119–139. [Google Scholar] [CrossRef] [Green Version]
  47. Parkhi, O.M.; Vedaldi, A.; Zisserman, A. Deep Face Recognition. In Proceedings of the British Machine Vision Conference (BMVC), Swansea, UK, 7–10 September 2015; Xie, X., Jones, M.W., Tam, G.K.L., Eds.; BMVA Press: Swansea, UK, 2015; pp. 41.1–41.12. [Google Scholar]
  48. Chollet, F. Keras. 2015. Available online: https://github.com/fchollet/keras (accessed on 1 May 2021).
  49. Burgoon, J.K. Microexpressions Are Not the Best Way to Catch a Liar. Front. Psychol. 2018, 9, 1672. [Google Scholar] [CrossRef] [PubMed]
  50. Porter, S.; Brinke, L.T.; Baker, A.; Wallace, B. Would I lie to you? “leakage” in deceptive facial expressions relates to psychopathy and emotional intelligence. Personal. Individ. Differ. 2011, 51, 133–137. [Google Scholar] [CrossRef]
  51. Shravankumar. Facial Landmark Detection. 2017. Available online: https://github.com/shravankumar147/Facial-Landmark-Detection (accessed on 1 May 2021).
  52. Malli, R.C. Keras-Vggface. 2017. Available online: https://github.com/rcmalli/keras-vggface (accessed on 1 May 2021).
Figure 1. Data processing workflow diagram.
Futureinternet 14 00002 g001
Figure 2. The example of the place setup for data acquisition.
Futureinternet 14 00002 g002
Figure 3. The example of pairs of recording facial area of several participants when telling the truth (top) or lies (bottom).
Futureinternet 14 00002 g003
Figure 4. The examples of the pipeline of the classical machine learning for lie detection task. It starts with the input image (A), then the LBP, HOG and SIFT pattern are calculated (B). Subsequently, the histograms of associated pattern are calculated (C) to be used for several classifiers (D) for lie detection (E).
Futureinternet 14 00002 g004
Figure 5. The examples of the deep learning-based lie detection model. It commences with an input image (A) that is used to calculate the VGG features (B). The VGG features are then used by both classical classifiers and fully connected layers (C) for lie detection (D).
Futureinternet 14 00002 g005
Figure 6. Images examples of correctly and incorrectly classified samples for using handcrafted based features.
Futureinternet 14 00002 g006
Figure 7. Images examples of correctly and incorrectly classified samples with deep learning based features.
Futureinternet 14 00002 g007
Figure 8. The examples of our proposed program for real-time lie detection.
Futureinternet 14 00002 g008
Table 1. Overviews of major related works for lie detection tasks.
NoTask/ObjectiveModality(ies)
1.Lie detection using comparative imaging [22]Neuroimaging
2.Brain region-based frequency analysis for lie detection [23,24,25]Brain’s hemoglobin signals
3.Fuzzy-based reasoning framework for lie detection [26]Brains electrical activity (EEG)
4.Deceptive classifications for specific topic descriptions [33]Thermal imaging, sounds and physiology data
5.Lie detection at airport settings [27]Skin conductivity
6.Multilingual deception detection [28]Speech (acoustics)
7.Real-life and trial data deception detection [30,31]Transcriptions and gestures
8.Multi-modal, ML and human-based lie detection on video [32]Interaction cues
9.Automatic deception detection frameworks [3,4](Non-)Verbal and micro-expression
10.Multi-modal deep learning-based lie detector [34,35]Spatio-temporal features
Table 2. Existing lie detection dataset.
DatasetSubjectsVideosYear
TotalMFAge RangeTotalUtterancesDeceptiveTruthfulDuration
Box-of-Lies [32]26620No Information251049862187144 min.2019
Trial-Data [31]56352116–601211216160None2016
Table 3. Accuracy and F1-score for SVM, AdaBoost and LDA for LBP descriptors depending on the number of points (P) and grid size. Note that the bold face numbers indicate the optimum values on respective metric.
LBPSVMAdaBoostLDA
ACCF1ACCF1ACCF1
1 × 1 Grid − P = 848.846.448.848.647.845.2
2 × 2 Grid − P = 8504650.249.650.247.4
4 × 4 Grid − P = 849.24749.848.849.447.4
8 × 8 Grid − P = 848.447.250.650.448.647.4
1 × 1 Grid − P = 12494749.248.850.449.6
2 × 2 Grid − P = 1250.447.452.65251.649.8
4 × 4 Grid − P = 1250.44949.448.850.449.6
8 × 8 Grid − P = 1250.449.449.849.450.249.6
1 × 1 Grid − P = 1649.447.450.249.649.248.2
2 × 2 Grid − P = 1650.648.251.250.850.849.2
4 × 4 Grid − P = 1650.246.84847.449.648.4
8 × 8 Grid − P = 1649.448.25049.44948.4
AVG49.747.549.949.549.748.3
Table 4. Accuracy and F1 for SVM, AdaBoost and LDA for HOG descriptors depending on cells’ size (8 × 8, and 16 × 16) and the blocks’ size (1 × 1, and 2 × 2). Note that the bold face numbers indicate the optimum values on respective metric.
HOGSVMAdaBoostLDA
ACCF1ACCF1ACCF1
8 × 8 Grid − 1 × 1 Cells50.450.250.25049.649.4
8 × 8 Grid − 2×2 Cells51.2515352.85151
16 × 16 Grid − 1 × 1 Cells5250.4494948.848.8
16 × 16 Grid − 2 × 2 Cells5149.851.451.248.648.6
AVG51.1550.3551.451.248.648.6
Table 5. Accuracy and F1 for SVM, AdaBoost and LDA for SIFT descriptors depending on the bag of words size (K). Note that the bold face numbers indicate the optimum values on respective metric.
SIFTSVMAdaBoostLDA
ACCF1ACCF1ACCF1
K = 1005049.650.249.850.249.6
K = 30049.6495049.64948.4
K = 50051.8515352.25049.6
K = 80052.251.652.651.451.649.4
AVG51.150.351.350.849.8349.35
Table 6. Accuracy and F1 achieved using VGG features. Note that the bold face numbers indicate the optimum values on respective metric.
ModelsACCF1
VGG + SVMNaNa
VGG + LDA5250.2
VGG + AdaBoost52.651.6
VGG + FC57.458.3
Table 7. Accuracy and F1 achieved with VGG + FC on all five folds. Note that the bold face numbers indicate the optimum values on respective metric.
FoldACCF1
15856.74
256.4648.72
354.5258.33
462.7663.79
555.4964.34
AVG57.4458.38
Table 8. Highest accuracy and F1 obtained for each descriptor. Note that the bold face numbers indicate the optimum values on respective metric.
MethodsConfigurationsACCF1
LBPP = 12, 2 × 2 grid52.652
HOG8 × 8 cells, 2 × 2 blocks5352.8
SIFT + AdaBoostK = 5005352.2
VGG + FC256, 128 and 1 Neuron(s)57.4458.38
Table 9. Train and test sizes, accuracy and F1 for all participants.
Metricp1p2p3p4p5p6p7p8p9
ACC46.777545.7579.8887.9756.2562.2574.3824.63
F129.7953.1230.4845.65509.0138.7251.926.44
Metricp10p11p12p13p14p15p16p17ALL
ACC45.3897.8893.2562.8846.2551.389246.6765
F113.0165.7563.3351.94.384.4459.4720.8963.12
Table 10. Metric values obtained in real-time evaluation.
MetricTrainingTest Subject 1Test Subject 2
ACC5243.5943.33
Precision5626.6750
Recall53.8566.6741.18
F154.938.145.16
Publisher’s Note: MDPI stays neutral with regard to jurisdictional claims in published maps and institutional affiliations.

