1. Introduction
According to statistics reported by
Direção-Geral de Estatística da Educação e Ciência (DGEEC) [
1] the dropout rate in Portuguese universities is around 29%, and 14% of the remaining students do not complete the course in the stipulated time. These high rates are a matter of immense concern for educational institutions, not only in Portugal, but worldwide. In the case of university education, different traditional actions can be taken by educational institutions to reduce academic dropout rates. These include personalized monitoring of students at risk, requiring an enormous designation of human resources and time, or restructuring the course syllabus. Nonetheless, early identification of and understanding the reasons for university dropout become essential for any methodology used to decrease failure rates. Therefore, the correct prediction of school dropout has become a priority [
2].
Recent policies in Portugal towards improving academic success conduct educational institutions to monitor students’ progress and prevent students from dropping out of university. In this sense, educational institutions have been developing efforts to analyze and predict these situations to deploy preventive actions. For many years, institutions collected only the data necessary for the registration and functioning of the student’s academic data. Thus, the lack of socioeconomic data creates constraints for institutions to carry out reliable studies on this matter. In this sense, some institutions are limited to make this type of analysis.
The advent of artificial intelligence (AI), new areas such as data science, combined with the current deluge of data, tools for its fast analysis, and the ability to store them in large quantities, has allowed an accurate prediction of academic success to become increasingly feasible.
In this work, several machine learning models were studied and applied to a dataset containing students’ information provided by UTAD university. This study considers only academic data due to the lack of students’ social-economic data. Therefore, the papers’ goal is to build analytical models that can accurately predict school dropouts using only academic marks and the age of students. Some of the models will integrate UTAD’s educational support infrastructure.
The rest of this paper is organized as follows: background theory and literature review (
Section 2); data and methods (
Section 3); results and discussion (
Section 4); conclusion and future work (
Section 5).
2. Background Theory and Literature Review
Some publications regarding data mining (DM) on predicting academic success focus on distance learning platforms and tutoring systems driven by AI [
3,
4,
5]. Queiroga et al. [
3] developed a solution using only students’ interactions with the virtual learning environment and its derivative features for early prediction of at-risk students in a Brazilian distance technical high school course. They use an elitist genetic algorithm (GA) for tuning the hyperparameters of machine learning algorithms. The population is formed by several classifiers: decision tree (DT), random forest (RF), multilayer perceptron (MLP), logistic regression (LG), and the meta-algorithm AdaBoost (ADA) with different hyperparameters. The approach obtains an AUC medium value of 0.845. Other work, proposed by Mubarak et al. [
4] used a Convolutional Neural Networks (CNN) and Long Short-Term Memory (LSTM), called CONV-LSTM, to automatically extract features from Massive Open Online Courses raw data and predict whether students will drop out. They used a cost-sensitive technique in the loss function, which considers the various misclassification costs for false negatives and false positives. They claim that the proposed model is better when compared to baseline methods. The dataset stores activity students’ records about which course they are enrolled in. Dass et al. [
5] presented a model to predict the student dropout in online courses considering features of daily learning progress. They used a Random Forest Model, obtaining 87.5% as the F1-score.
In the traditional educational system, several approaches were found using many classifier systems. The use of Artificial Neural Networks (ANNs) was demonstrated and considered promising by Alban and Mauricio [
6]. Their study was carried out with data obtained from 2670 students, from the Public University of Ecuador, over three years (2014–2017). Two types of algorithms were used: multilayer neural networks and radial basis function network (ANN that uses radial basis functions as activation functions, RNN), with both presenting very high dropout forecast rates of 96.3% and 96.8%, respectively. In another study, Plagge [
7] concluded that, with the use of ANNs, the forecast rate was relatively high when using two semesters of data, decreasing dramatically when using only one.
Chung and Lee [
8] used an RF to predict students at risk of dropping out. They used 165,715 high school students’ data from Korea’s National Education Information System of the year 2014. They obtained an accuracy of 95% binary classification.
Pereira and Zambrano [
9] used decision trees (DT) to identify patterns of student dropout from socioeconomic, academic, disciplinary, and institutional data of students from undergraduate programs at the University of Nariño. They used three datasets and obtained a confidence threshold greater than 80%.
Fernádez-García et al. [
10] defined several models from enrollment up to the fourth semester using mainly academic data. The approach considered the output of previous stages, i.e., each step assumed the prior knowledge generated. The model goal consisted of identifying engineering students with a high probability of dropping out to design and apply dropout prevention policies effectively. The predictive model could identify 72% of the students that will dropout. At the end of the fourth semester, the results could reach 91.5%.
Hutagaol et al. [
11] considered three singles classifiers: K-Nearest Neighbor (KNN), Naïve Bayes (NB), and Decision Tree (DT), to identify the best in predicting students’ dropout at a private university in Jakarta. They use demographic indicators and academic performance to predict student dropout. Their model reached 79.12% of accuracy.
Kiss et al. [
12] identified students at risk of dropping out at a large Hungarian technical university using predictive analytical tools. They use data of 10,196 students who finished their undergraduate studies (either by graduation or dropping out) between 2013 and 2018. They modeled the problem using 3 ML methods: Gradient Boosted Tree (GB), XGB, and ANN, obtaining accuracy in the range 68.0% to 85.8%.
Studies using “external” features could also be found. Dharmawan et al. [
13] used a model with non-academic features. They concluded that the number of family members, interest in further studies, and the relationship with lectures are features that influenced the dropout. Hasbun et al. [
14] studied the importance of extracurricular activities to predict dropout in students from two Bachelor of Science degrees (Engineering and Business), showing that extracurricular activities are excellent dropout predictors.
The following works revisions the students’ dropout prediction. Mduma et al. [
15] revised machine learning algorithms to predict academic dropout in developing countries. They conclude that many researchers ignore data that is unbalanced, leading to improper results. On the other hand, their main focus is providing early prediction instead, including ranking and forecasting mechanisms on addressing the dropout student’s problem. De Oliveira et al. [
16] searched scientific indexed publications in higher education to analyze the retention and dropout of higher education students. They identified the data and techniques used and proposed a classifier using several categories considering several student and external features.
Table 1 sums up the models, features, metrics used, and the results obtained. Column 1 identifies the work, and column 2 indicates the features used. The “Marks” feature means that the work uses the curricular units marks. The academic feature indicates the use of academic data like attendance, GPA, and marks. The “socioeconomic” feature indicates the use of social and economic data, the “Institutional” refers to data related to the study plan and the university, “Personal” refers to personal data like address, age, and gender, “Demography” indicates the inhabitant number of a residential area and other demographic data, “Motivation” refers to the driving force behind students actions and other psychological phenomena. “Sports” indicates that students practice sports activities. “High School” comprises data related to the student’s high school and their marks obtained. “Activity” is the data obtained through interaction with computer learning systems, e.g., time spent by a student for a day. “Attendance” is the school attendance. “Knowledge” is the knowledge degree that the students have. Finally, “Volunteer” indicates if the students practice volunteering. The column methods enumerate the methods used in the works. The “Result” column indicates the respective metric value (e.g., ACC: accuracy, AUC: area under the curve).
4. Results and Discussion
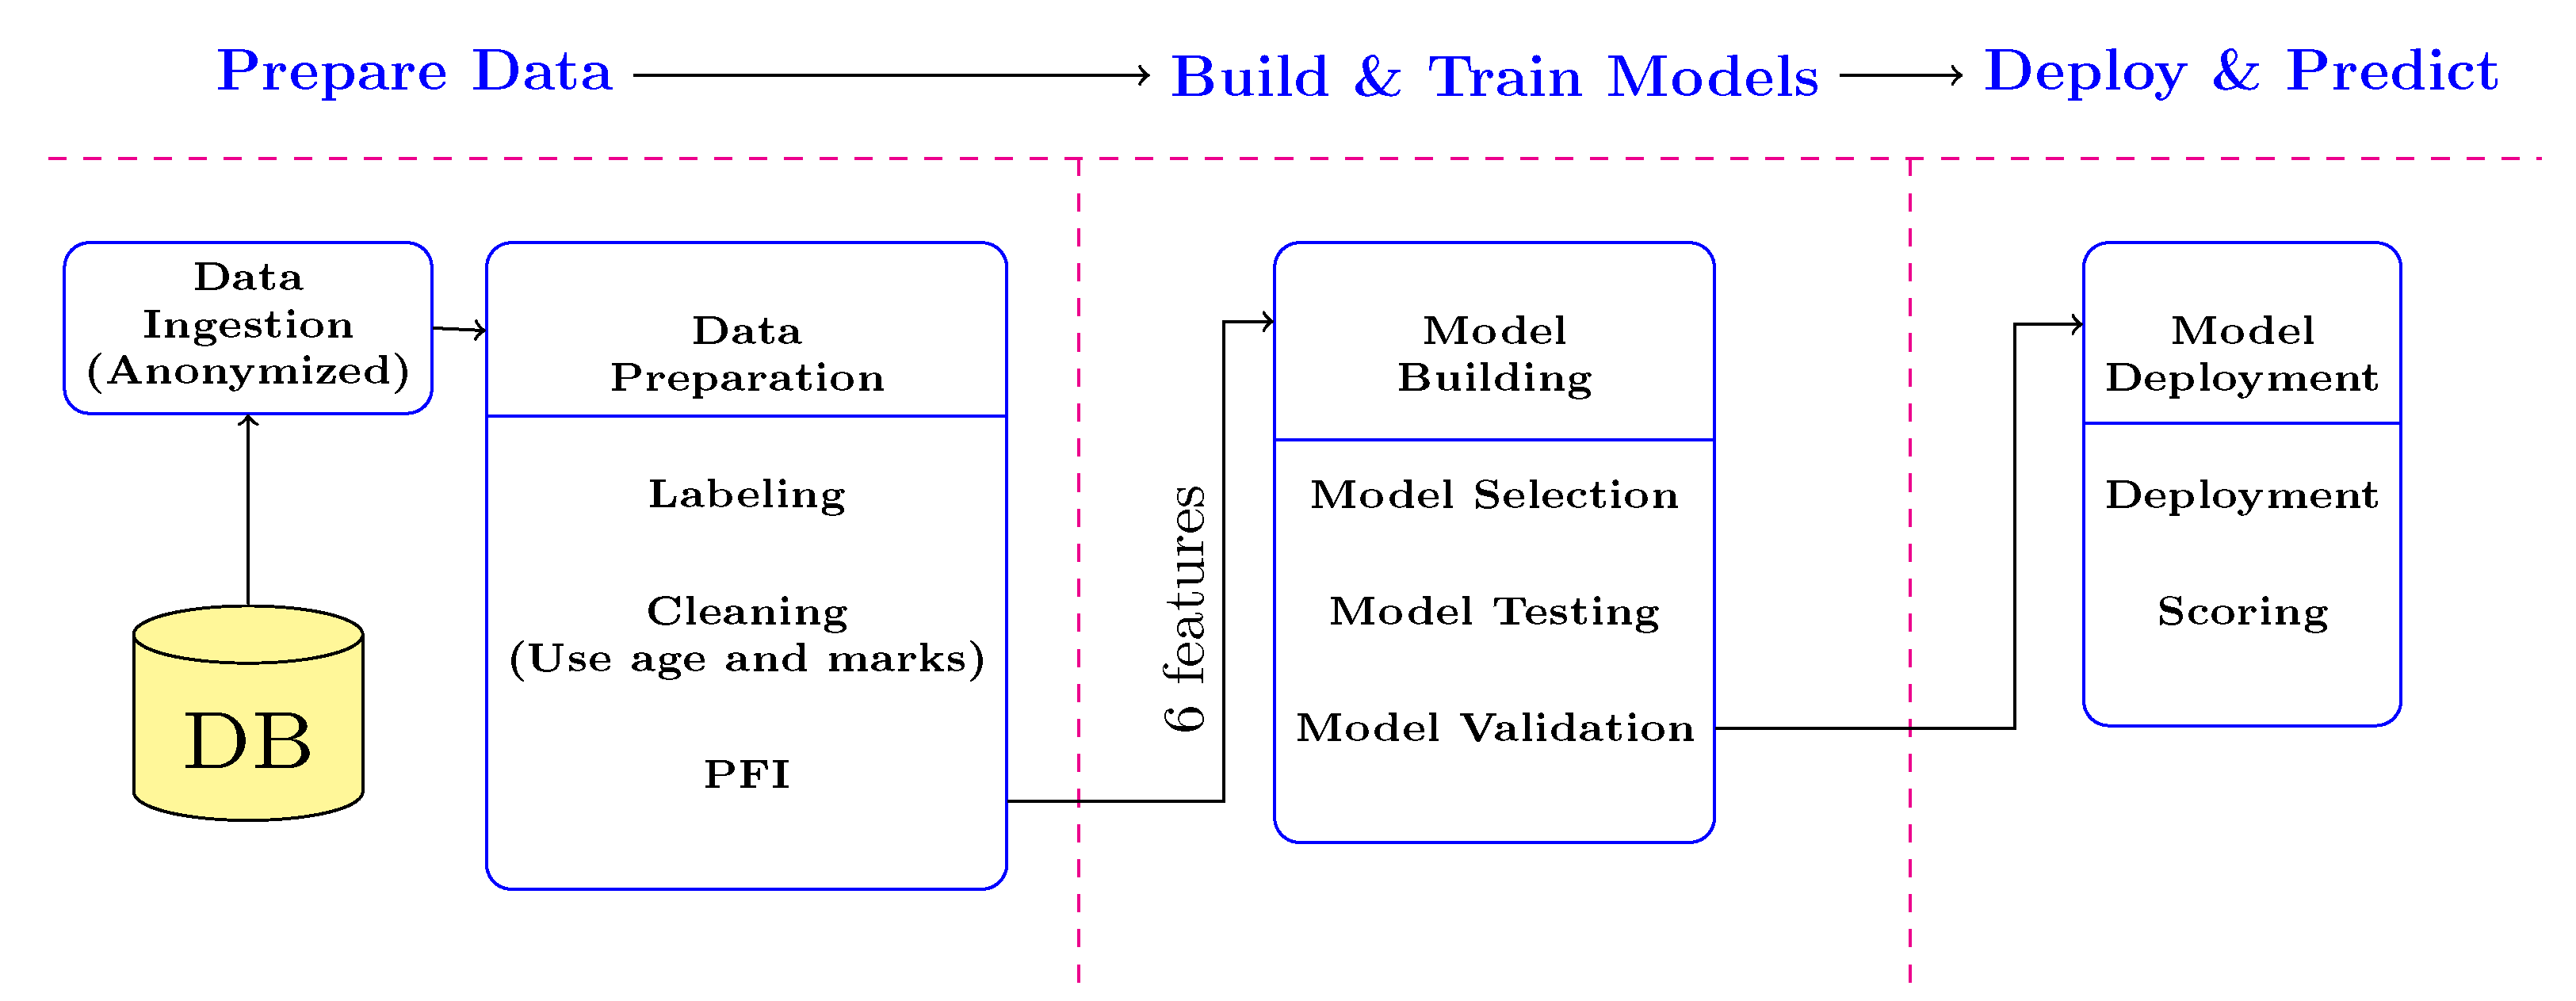
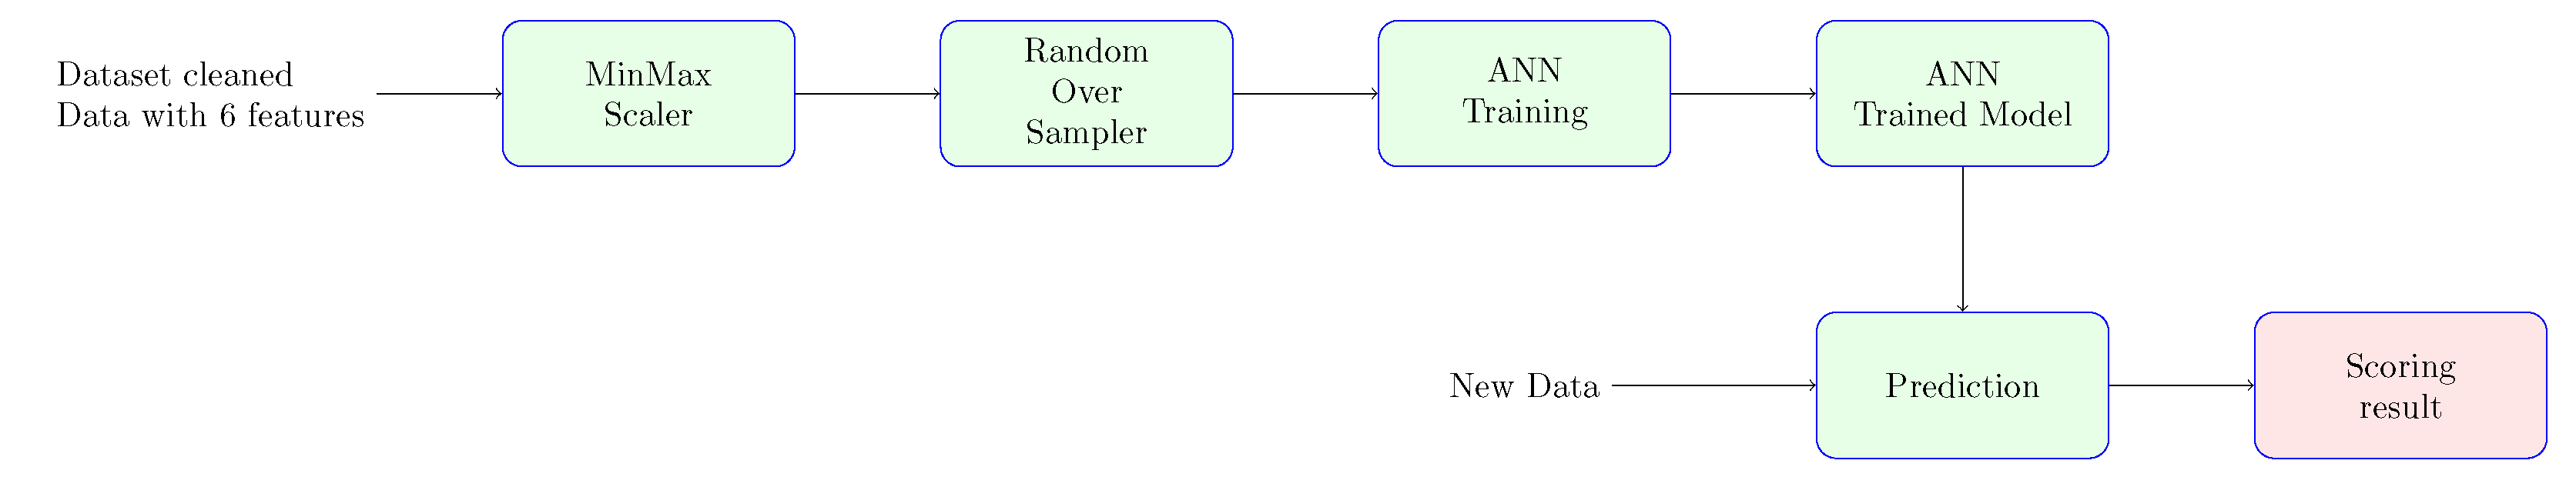
Four different models (CatBoost; Random Forest; XGBoost; ANN) were built. Since all models, except ANN, are tree-based, they do not benefit from feature scaling. Therefore, the ANN model was implemented into a pipeline (
Figure 7), which applies additional data pre-processing before it gets fitted into the model. First, the features were scaled between zero and one. The data was then balanced using the ROS technique (
Section 3.5), as it provided more reliable results then unbalanced data.
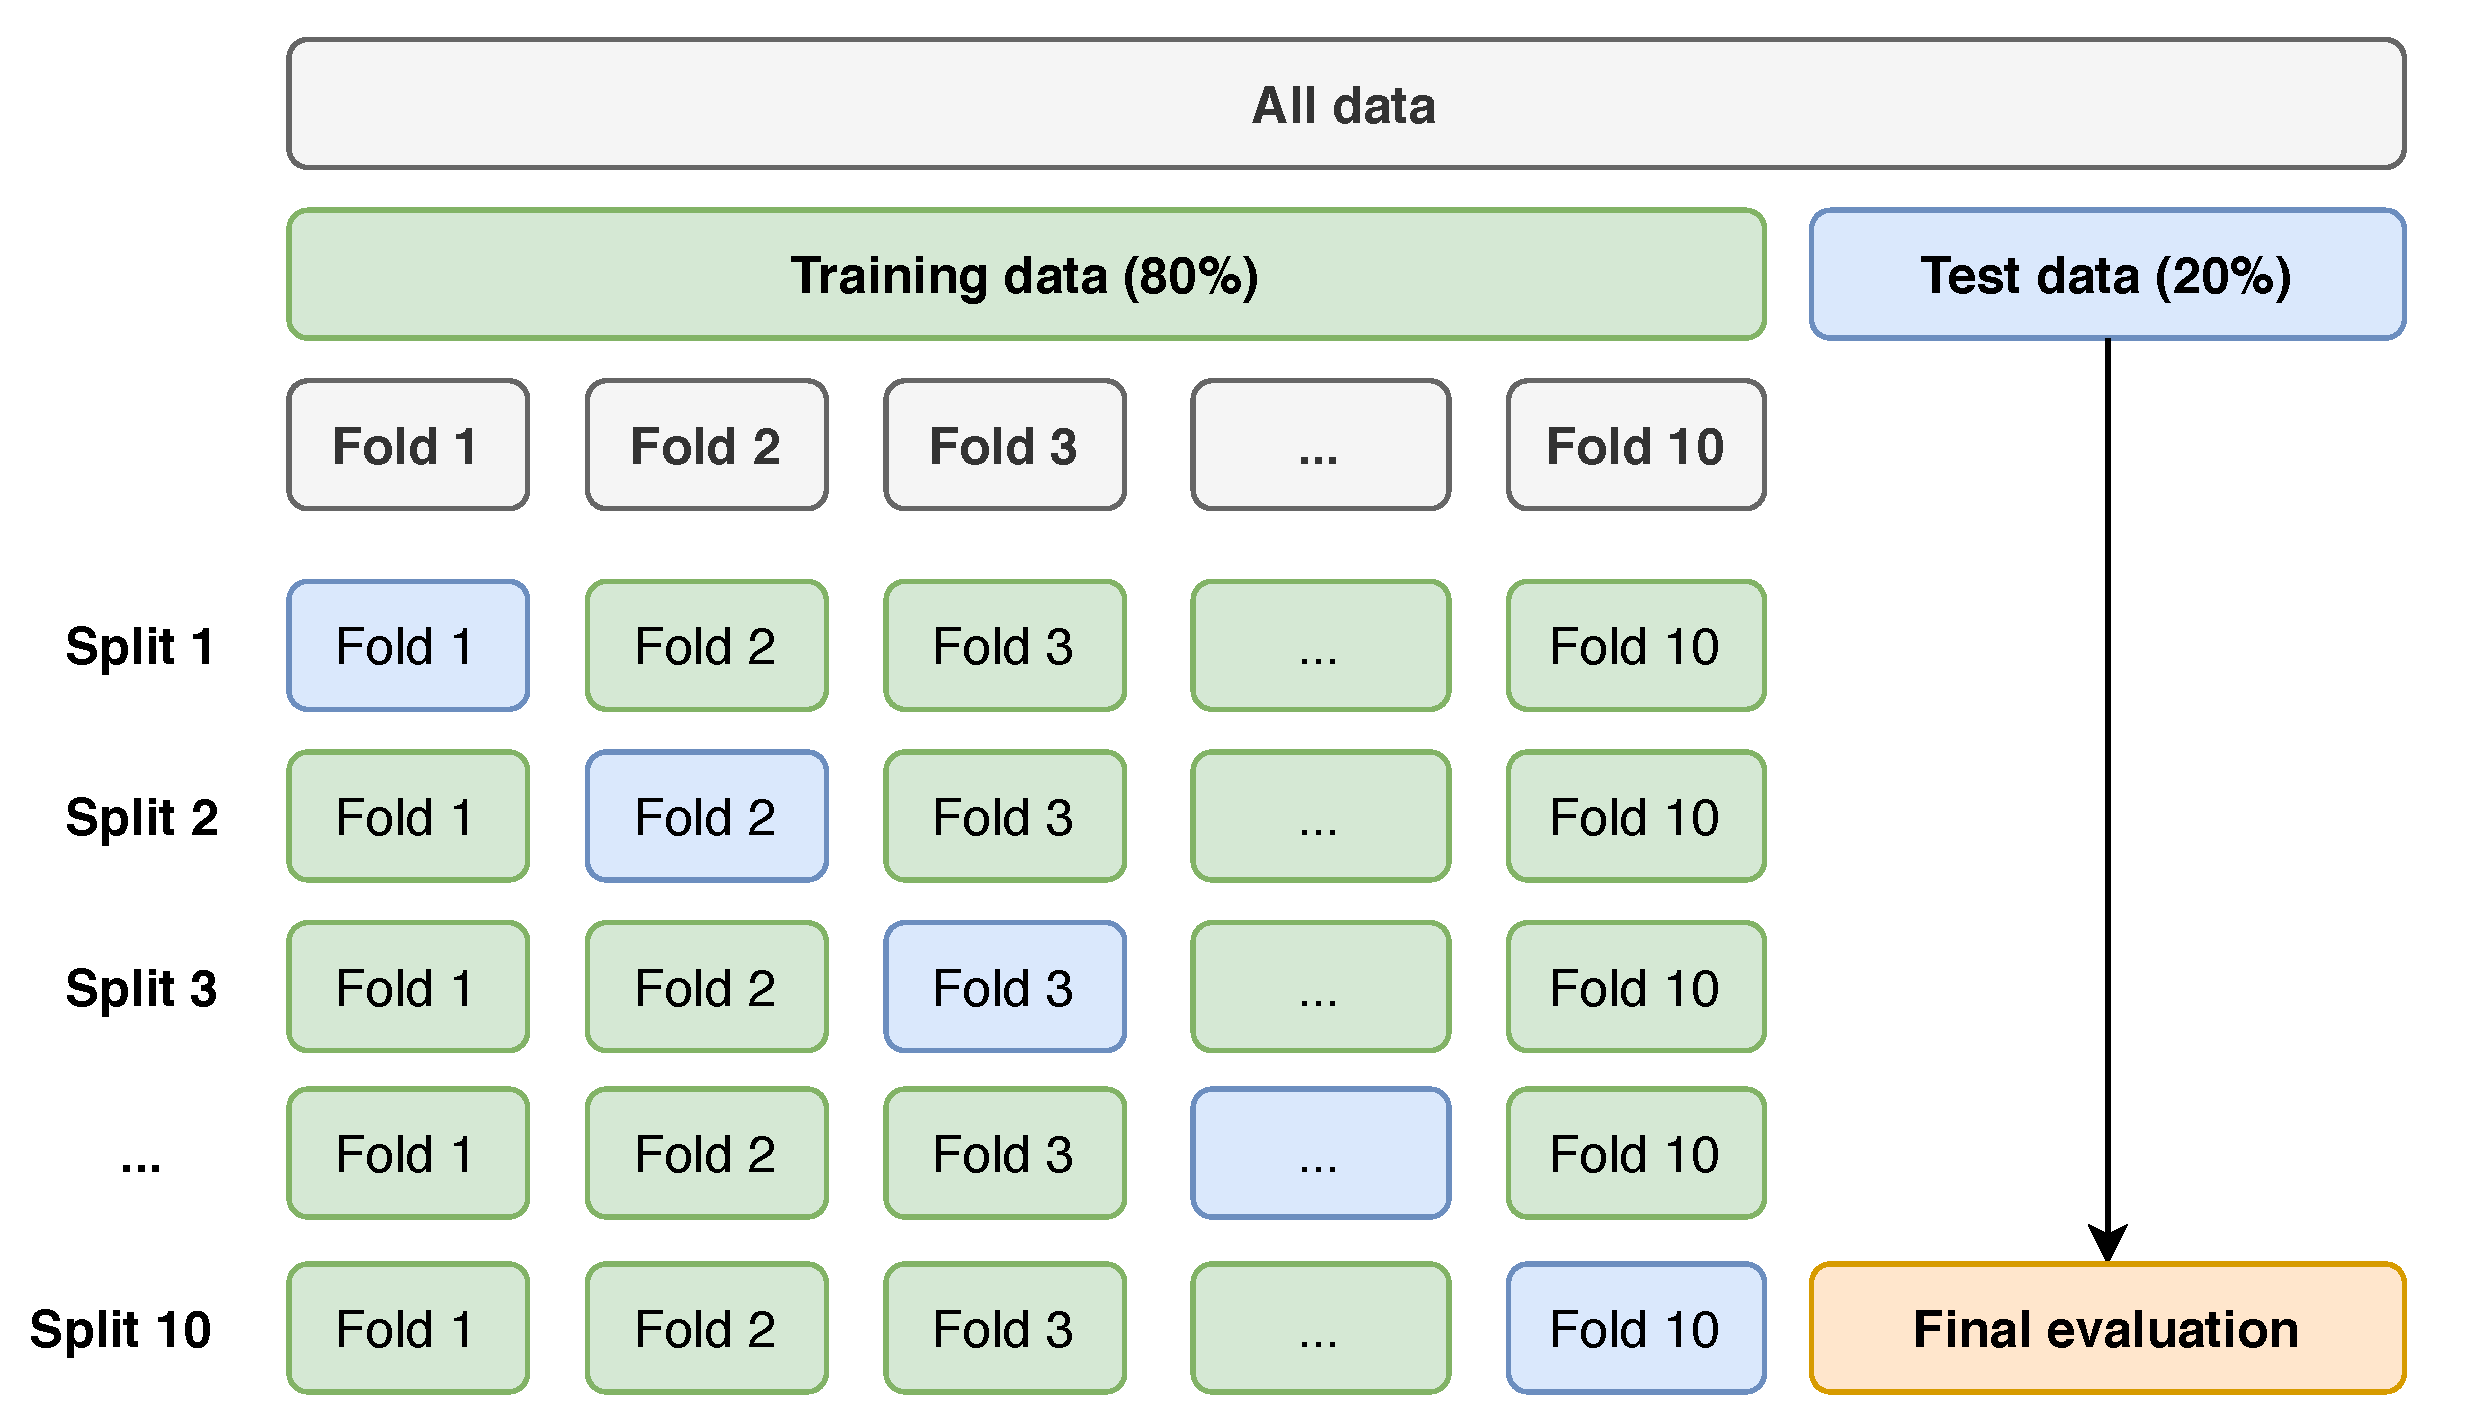
Every model was then submitted to the stratified 10-fold cross-validation test, described before. During this test, the tuning of each model’s hyperparameters was executed, as these have a significant impact on the model’s prediction performance. The hyperparameters used for each model are illustrated in
Table 3.
Every model was then submitted to the stratified 10-fold cross-validation test. This technique allowed to estimate the performance of each model on unseen data. The results are displayed in
Table 4. As noticeable, RF provided the best overall metrics [
27], only losing in recall to XGBoost.
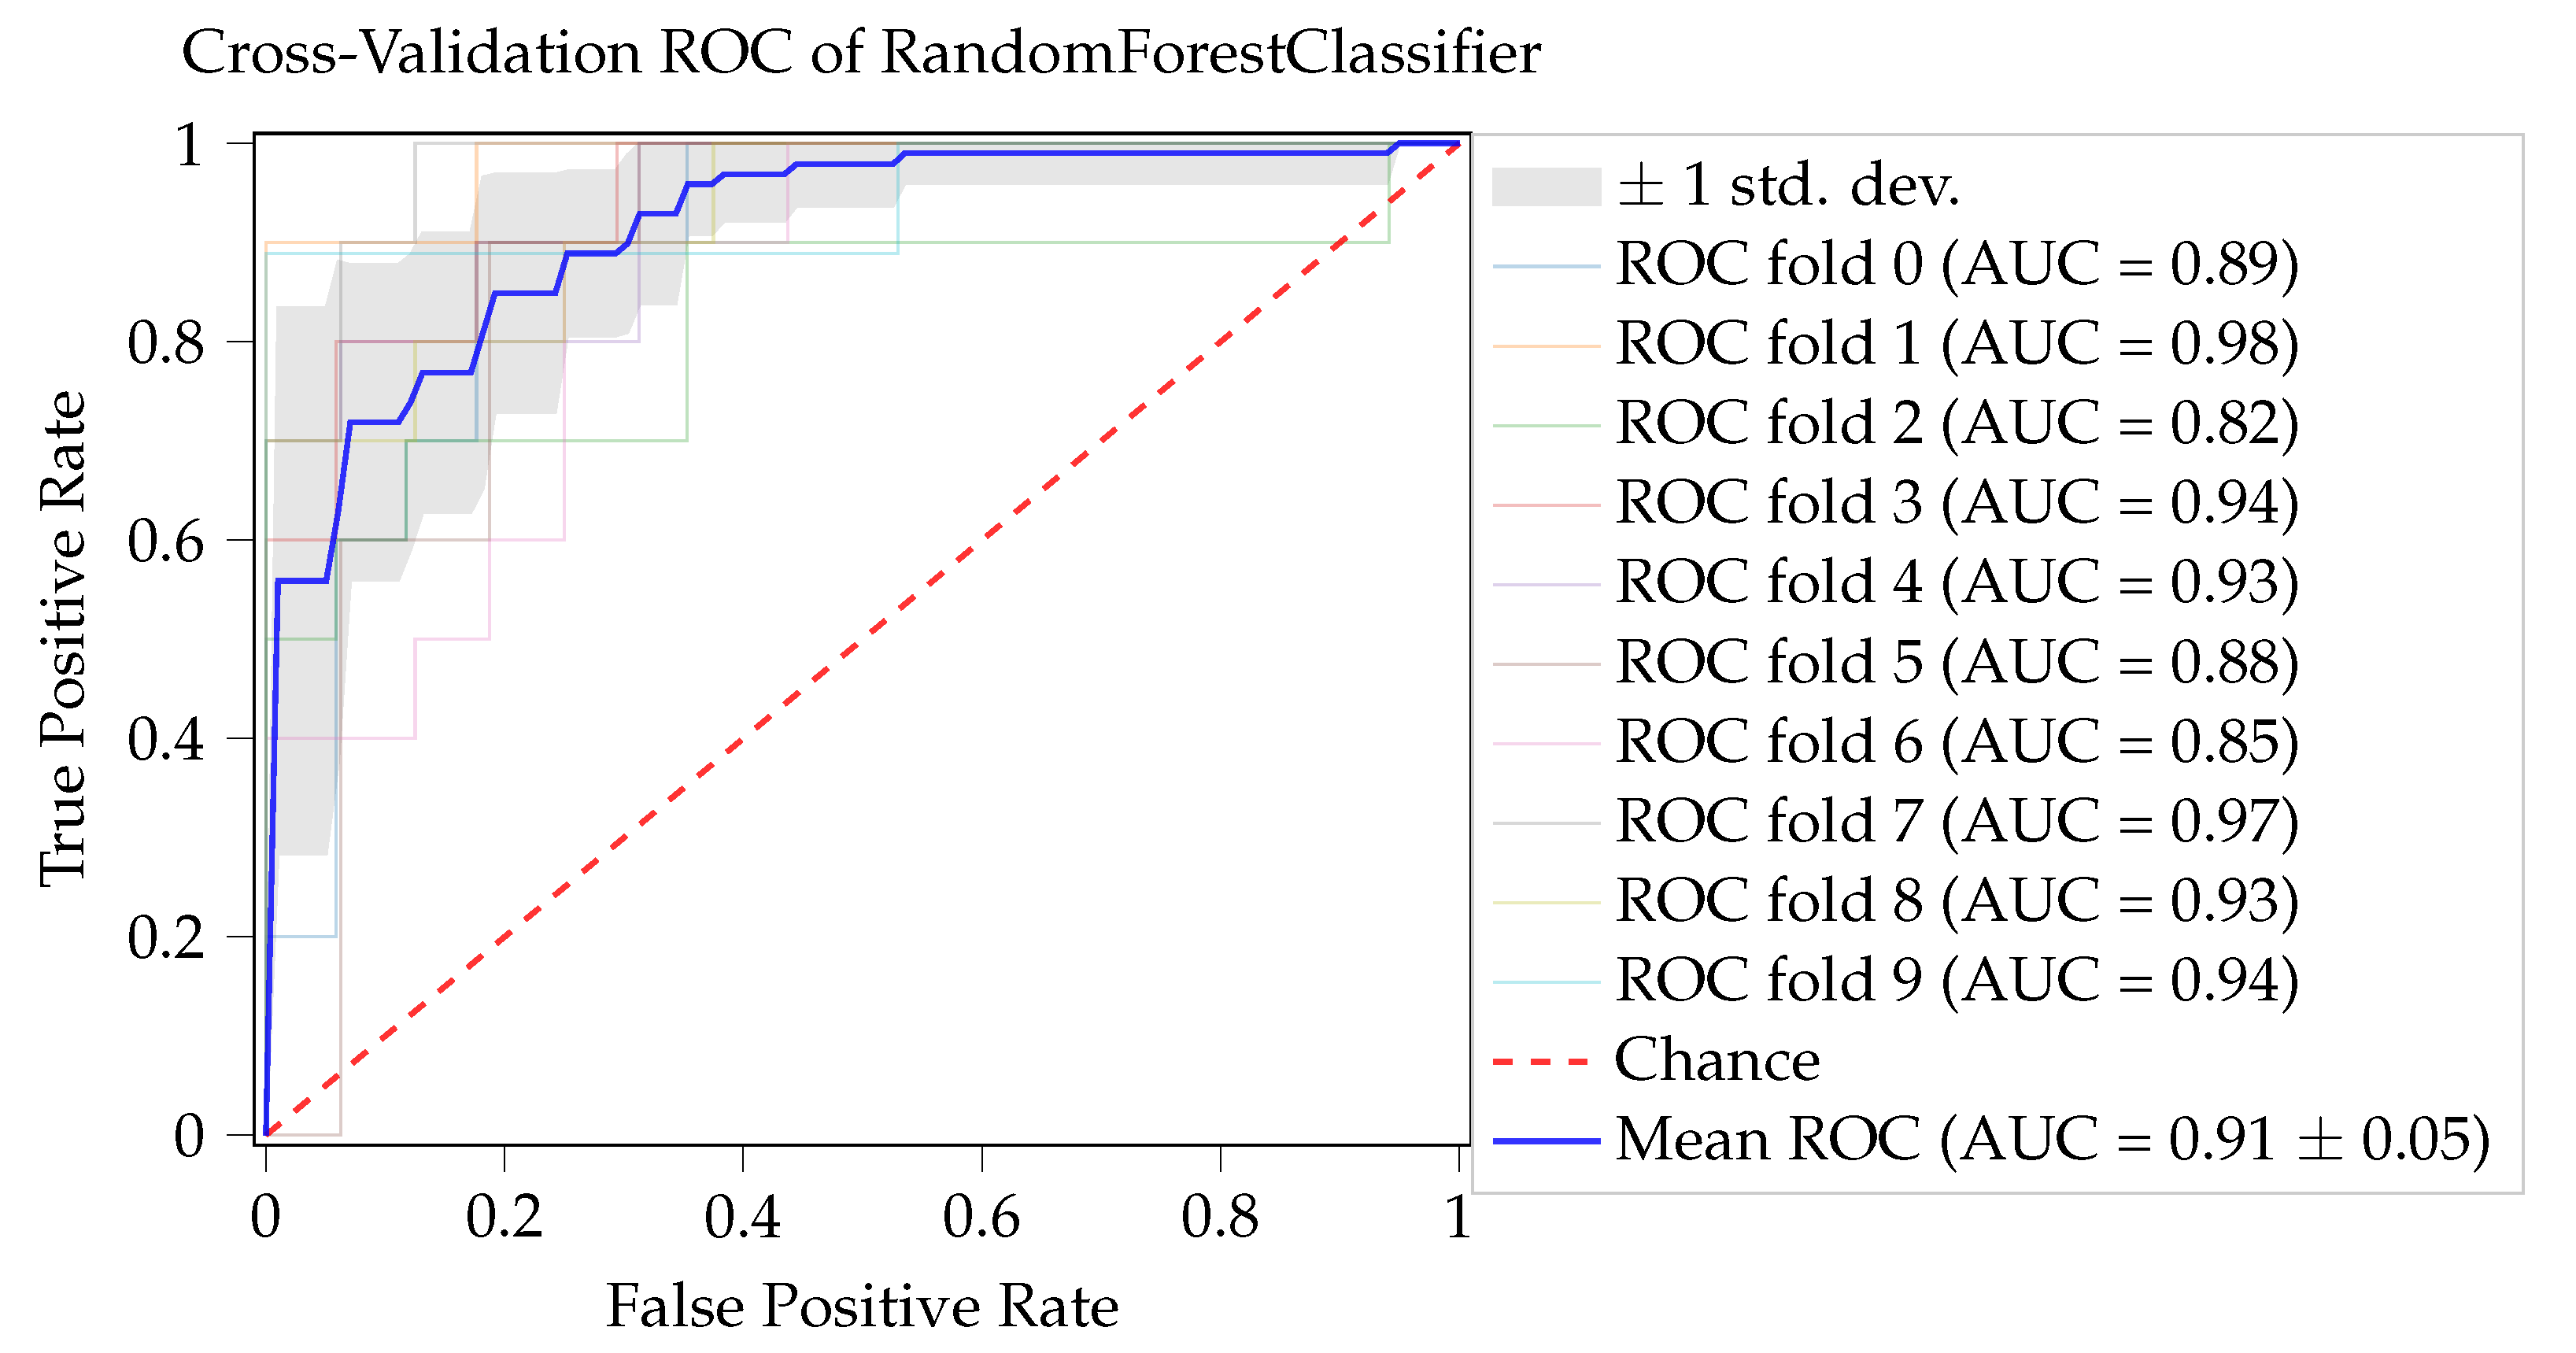
One important metric is AUROC, which defines how accurately each model discriminates between classes. It is one of the most commonly adopted metrics to measure the model’s performance in classification problems. The obtained ROC curves, for RF, on the previous test, are displayed in
Figure 8. With a mean value of 0.91 and a standard deviation of 0.05, this model can very precisely and consistently distinguish a dropout student from a non-dropout.
RF also presented an F1-Score of 0.81 with a standard deviation of 0.22, being the best across all models. This metric represents the harmonic mean between recall and precision, being a good measure of the model’s performance. The final validation data (unseen data) was then fitted into each model, as a last sanity test for their generalization capability. The results are displayed in
Table 5. In this test, XGBoost showed the best results. However, it is expected that the RF will present a more stable performance, due to the slightly more reliable results obtained in the cross-validation.
Most of the articles reviewed make the prediction considering several characteristics external to the academic context. These models are good when there is data to feed them. At UTAD, the recorded features were scarce, and it was necessary to use models with existing data. In this context, models considering only academic marks and the age of students were used to predict school dropout, achieving good results (F1-score of 0.87). Some of the papers reviewed showed that non-academic data, in particular socioeconomic data, also influence the academic results. As the proposed model presents promising results, it can be concluded that the grades obtained by the students somehow also incorporate their social extract and way of life.
5. Conclusions and Future Work
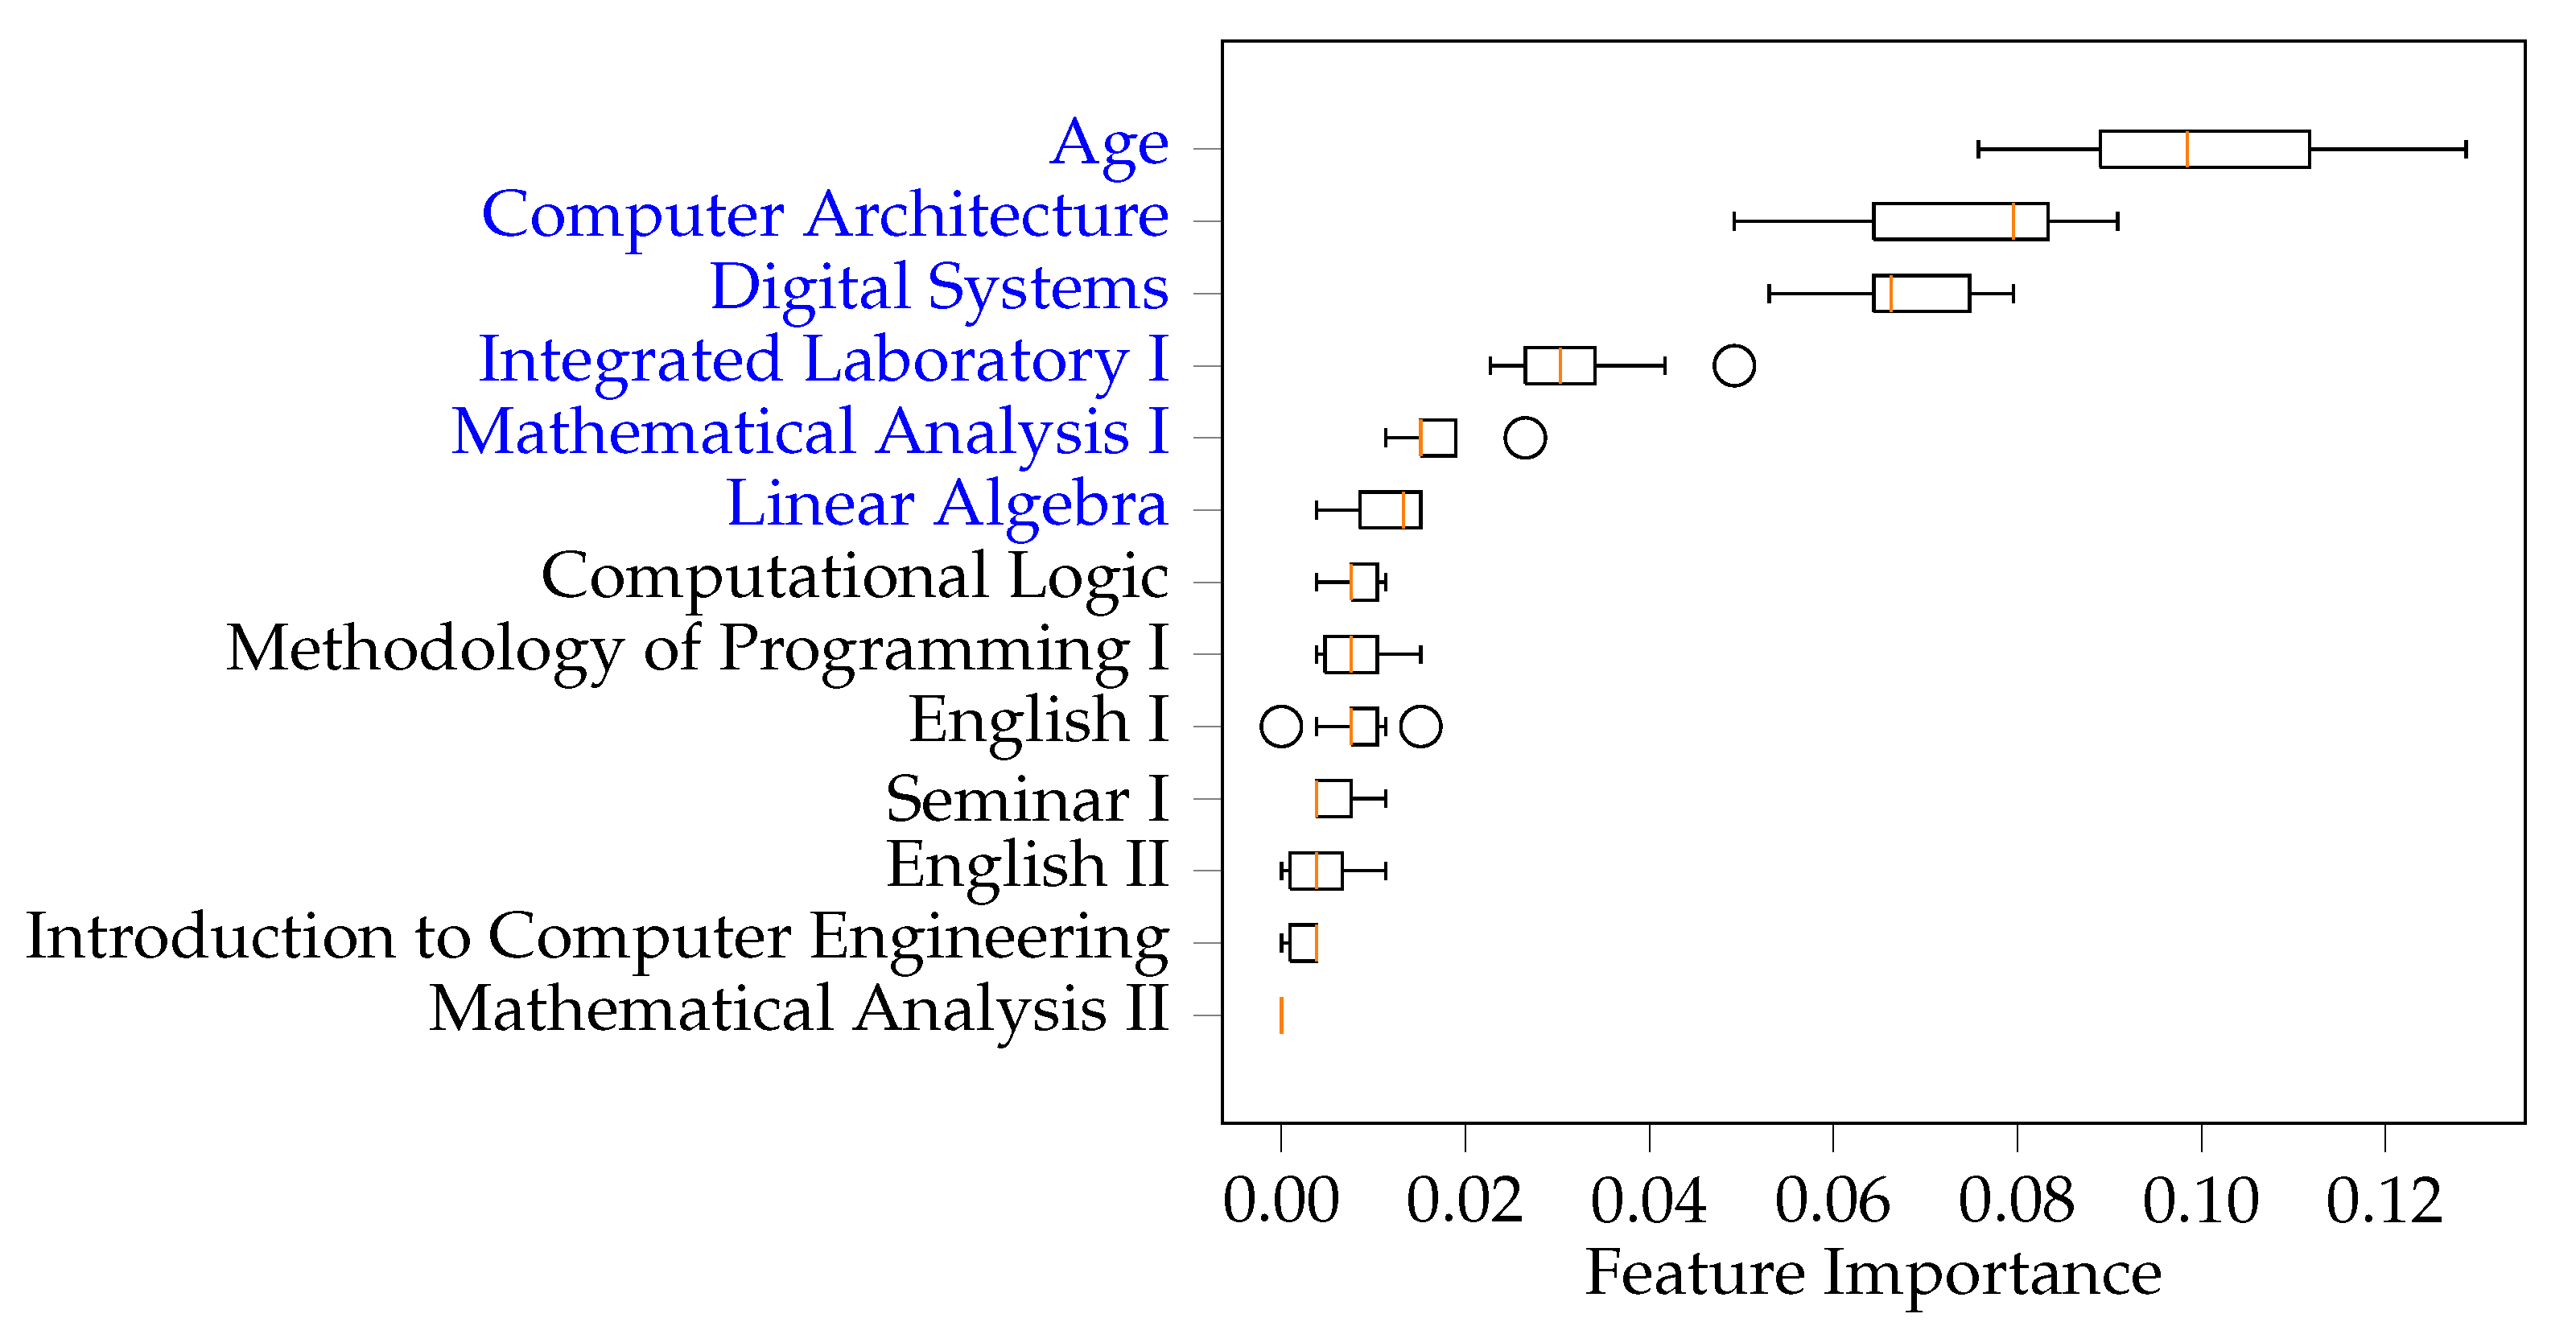
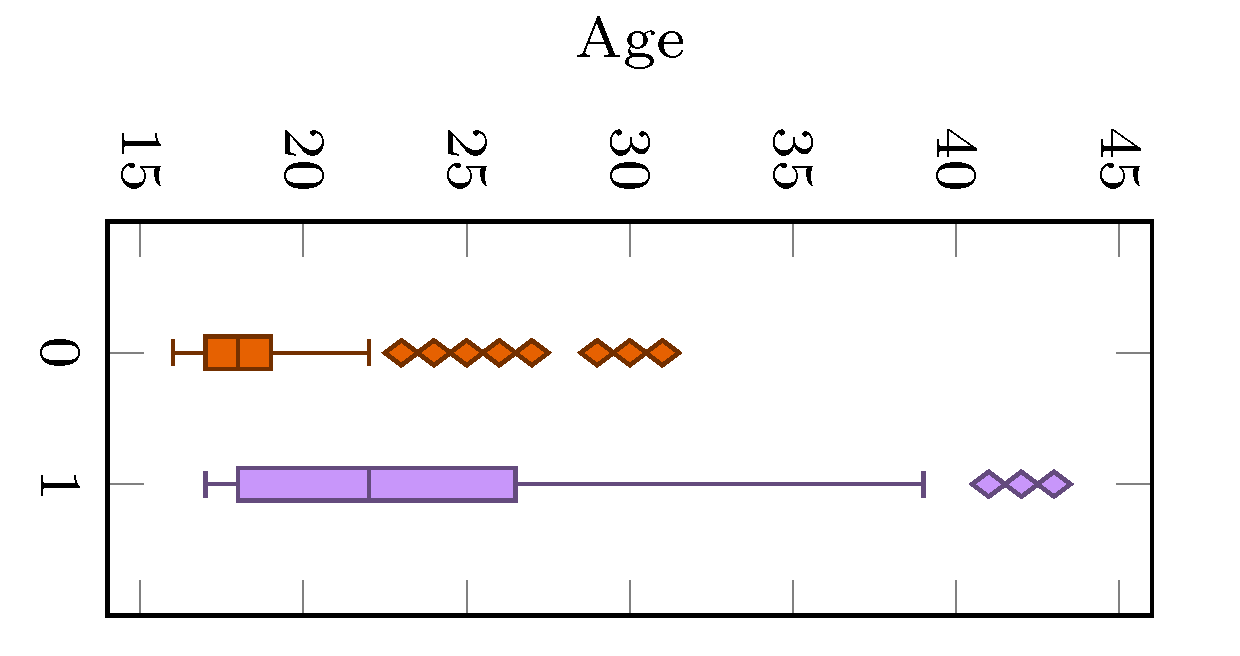
In the present study, the prediction of academic dropout was considered. Although school dropout depends on several factors, like economic, social, parental training, and institutional conditions, this study was conducted with data referring to the success of the curricular units as a source. With the results achieved, it is concluded that this analysis is possible even when the students’ data are scarce. In fact, all the methods considered in this paper show promising results in predicting academic dropout, emphasizing RF and XGBoost, which demonstrated an accuracy of 88% and 90% in the final test set, respectively. This prediction is possible because students’ grades somehow already incorporate their living conditions. On the other hand, the study of the importance of the characteristics revealed that the successful completion of the course depends on the maturity of the students (age) and the success in more demanding curricular units.
As a future study, these new data mining techniques will be applied to other study plans, which would allow for the deployment of the most suitable models. Therefore, one classifier will be incorporated in the UTAD’s information system to support academic staff in predicting students dropout. On the other hand, students’ personal information, like economic and personal data, will be considered when UTAD collects a significant amount of data.


 ,
, 


