Abstract
This research aims to highlight the importance and notoriety that an application based on heuristic algorithms can have in the field of e-commerce in the construction niche, guiding us on participatory economy principles. The expansion of e-commerce has shaped a new directive and increased the complexity of logistics, being a topical and critical issue. Users want the goods to be delivered in a timely manner to the specified address and to benefit from the fastest services. These aspects are challenging to achieve given that most operations fall within the remit of specialized staff within an e-commerce company. In this context, a service-type software application dedicated to the construction field was created to increase productivity, applying the principles of the sharing economy and developing intelligent algorithms. Coestim is a cloud-based SaaS solution for construction work estimations and a marketplace for construction-market-related products. Equipment rental, specialists, tracking the traceability process, generating a quote, and increasing productivity are essential components of the developed application.
1. Introduction
The development and popularity of e-commerce have led to uniform and rapid growth, along with the emergence of hybrid solutions and services in the e-commerce markets in the relationship between the merchant and the buyer, turning everything into a hybrid platform.
We can say that in the retail market, companies such as Alibaba, Amazon, eBay, JD.com, and eMAG are companies that are trying to use hybrid modules in order to capture the current market. Therefore, mobile applications, which we find in companies such as Apple, Microsoft, Google, and more recently, Sony, manage to change the way of trading or the ability to automate. Scientific circles consider it necessary to aspire to a software solution that addresses all areas, but with implementations in the area of dedicated solutions, not just direct interaction between users and markets [1].
The need for highly dynamic online businesses that have standalone modules implemented is becoming a trend and users are migrating to these types of businesses for the versatility of the services they offer. This trend comes from the desire to standardize quality products with services to match, and companies wanting to maintain a monopoly on the quality they rely on. In these approaches, there is a disadvantage to covering a wide range of products and services in terms of production cost. A company can produce a limited number of products or components; the same applies to the services offered. Therefore, in this case, new models of the interconnection of e-commerce platforms can be implemented. We can say that this approach causes the disadvantage of unification, which creates a deficiency in analyzing the quality of other products or services offered by other users. For this problem, the departments dedicated to quality control implemented solutions for reviewing or evaluating products and services. All these developments outline a new trend where different types of users meet and interact differently, and their behaviors create new user profiles. We can say that such a market outlines a new trend in terms of bilateral markets; thus, the outsourcing of markets has been achieved [2].
According to studies, the continuous development in the fields of technology, IoT, or artificial intelligence creates the right environment for the development of e-commerce and its outsourcing [3]. The high volume of orders, convenience of buyers, simplicity, and attractive prices practiced by the online environment, leading to a new revolution in the field of e-commerce, cause these aspects. An important aspect is that, during the period when the whole planet was terrified by the pandemic generated by Sars-Cov-2, buyers migrated online. Reports and studies show that, in 2020, e-commerce had grown by more than 50%, and at that time, most companies had demonstrated that there were shortcomings in their platforms and they needed new approaches to support the wave of new users [4]. The biggest problems generated by their platforms were related to the real-time inventory update process, invoice generation, or AWB tracking process, along with delivery issues. In addition to these internal issues, the platforms have shown their limitations in terms of response times and ability to process customer requests. We can say that the need to implement some intelligent algorithms to coagulate the entire structure on which an online trading platform is based is imperative. Therefore, the implementation of collaborative filtering algorithms or imports from different databases through a single API, along with the synchronous popularity of all e-commerce platforms, interconnected with the central platform, are highly necessary to achieve hybrid platforms that provide the user experience of physical shopping in the online environment [5]. These facilities lead to the adjustment of the prices and high quality of the services offered, recommendations, and the correlation of all the characteristics in a divided, but at the same time uniform, form. The pandemic period marked a new trend, one where more than 75% of builders noticed that the demand for building materials had increased considerably and was not ready to take a step online. The need for security and the limitations imposed by the authorities forced the population to migrate to rural areas and reconsolidate their homes [6]. Creating an environment conducive to the development of the construction field aims at aspects related to the verticality of services in the market, but also highlighting the best products for the client’s budget or need. Until now, these aspects were extremely difficult to achieve, especially under the same roof within an e-commerce platform.
We can say that GlocalSoft approaches problems from the perspective of research and product development to help academia inclusively. The implementation of ERP (enterprise resource planning) or SaaS (software as a service) solutions and applications was aimed at the construction field, with the role of increasing productivity. These aspects are based on intensive studies and the application of the principles of the participatory economy, with the help of intelligent algorithms dedicated to optimizing the evolution of costs, achieving a positive impact in reducing risks, a characteristic affected by the activity planning process. Therefore, the utility of the application is more than necessary, and it can be used by anyone, from individuals to construction companies, manufacturers of construction materials, or warehouses. They can optimize costs, estimate and generate a project execution time, and most importantly, generate a work estimate. A large part of the facilities offered by Coestim is based on the identification of teams and builders based on the stages generated within the estimate and the way in which each component of the construction advances, following the entire process from the rental of the machines to the finishing stages. Therefore, the main purpose of the approach presented in the manuscript comes from the desire to use the principles of the participatory sharing economy in the field of construction. These elements are validated by intelligent algorithms capable of presenting work estimates and budgets that facilitate a continuous flow of work and increased productivity in the field of construction and materials [7,8].
We can say that the relatively small number of specialists, specialized craftsmen, with not only work standards, but also competitive, well-defined prices are extremely few. Most have no professional training or are not part of a service company, which creates a volatile market without ethical principles to drive its efficiency. Most tradesmen or teams that provide quality service are not promoted or recommended. A negative aspect is the lack of traceability, quality planning, and transparency regarding a work; in addition to these, the lack of advanced knowledge through which construction budget calculations are generated forms a new problem. We can say that the incorrect estimation of the final costs or the omission of the fluctuation of the price of the materials or their unavailability produce aspects that distort the smooth running of things, weakening the credibility in relation to the client. Thus, having all this information, the development of a web solution is imperative, because it improves the quality of the workforce, increases the standards imposed, and generates new opportunities, and at the same time, the end customer benefits from fair prices, quality, seriousness, and efficiency in relation to requested services. We can say that the Coestim application forces the market to align with European standards, and the workforce in the field benefits from quality services through which they can increase their level of knowledge, promoting their own portfolio at the same time. The exchange of information and the implementation of evaluation systems or feedback based on the impact on customers can shape new features that will be the basis of other work budgets and also maintain a viable process between suppliers and builders. These aspects are extremely important and can play an important role in the stages of the project. All companies in the field can list their products and services, staff, or knowledge to create an active environment and sharing economy. We can say that new standards are created through this application, and machine learning algorithms are subsequently applied, generating construction estimates based on the internal nomenclature, all based on local resources. According to previous presentations, Coestim is unique through the facilities it offers in the field of construction materials and interior design. This application pursues its goals progressively, and the main goal is related to the expansion and productivity of the construction industry, generating new opportunities, increasing work standards, and estimating and generating work quotes as accurately as possible to obtain the most realistic design costs [9].
Regarding the structure of this manuscript, it is organized as follows: in Section 1, elements have been introduced that focus on the motivation of the approach of this direction, and also highlight solid literature in the field of the problem addressed, presenting solutions and approaches achieved within the conducted study. Section 2 contains a comparative study and analysis of other approaches, along with the methodological aspects used in the article, algorithms, implementation methods, testing, and validation. In addition, extensive description of the concepts behind the developments and the facilities they provide in the field of e-commerce is provided. Section 3 is dedicated to the practical implementation, the results obtained, the API implementation, and the impact that the developed solution has on the field of construction estimates. In Section 4, comparative elements such as the case study and the approach made with the results obtained about the proposal based on the participatory economy and heuristic algorithms are presented. Section 5 concludes all the information presented and concludes the importance of the Coestim application, along with other future directions.
2. Literature Review and Cost Estimation Methods
We can say that, in the construction industry, there is a perspective whereby the accuracy of cost estimation is fundamental in terms of the success of all groups involved in a project according to [10]. Therefore, the competitive bidding and listing process, where the costs are estimated, has become an extremely critical element, is the most convenient, and determines the procurement method. The bidding process continues within a platform, becoming a practice in the fields dedicated to construction, which are extremely competitive at the moment. Thus, the implementation of competitive tenders based on a sharing economy dedicated to the construction field has not been realized so far in the form of a platform dedicated to this sector. The existence of platforms such as those for contracting suppliers annihilates some activities. Contractors bid for projects and subsequently do not deal with the processing and estimation of building execution costs and eventually leave the business area [11]. From a cost estimation perspective, other technical procedures, analytical functions, cost prediction processes, and construction estimates can be much better articulated. Using all the information entered in the design, budget, areas, and quantity loading, estimated costs are generated, including a margin of increase or fluctuation in price for the quotation of certain materials. There are studies of cost estimation practices [12] that theoretically succeed in identifying a standard estimation procedure based on UK data and contractors. Thus, the study was based on a standard estimation procedure, defining the construction costs, as they are presented on an estimate, the price differences, and the profit for the contractors. This study focused more on types of entrepreneurs, such as extremely small local entrepreneurs, small local or regional sales markets, medium-sized entrepreneurs with country-level offices and services, and also large entrepreneurs with international outsourcing of products and services. This classification was made after long studies through the technical procedures of grouping the dimensions. To be able to present some conclusive offers, the cost estimates must take into account certain recipes that are made with the help of the nomenclature dedicated to the construction field. These nomenclatures have not been built to date so that they can adapt to the rigorous requirements of the building materials market. For this reason, cost estimates are the central and extremely vital element in project management. The authors analyze the financial flow and budgets, accounting, and project traceability [13]. We consider that the study [14] is extremely important because the estimation of a project can be an important means of financial control. Studies also highlight the aspect of the faulty estimation process that can cause losses, which is caused by underestimation.
2.1. Cost Estimation Techniques
We can say that, in the field of cost estimation, many methods and techniques are used, including artificial neural networks (ANNs). These hybrid models use secondary artificial intelligence or meta-heuristic methods, radial functional neural networks (RBFNN), case-based reasoning (CBR), regression analysis (RA), particle swarm optimization (PSO), decision trees, or expert systems. All these are practices dedicated to the operation and implementation of cost estimation systems. Thus, artificial neural networks are part of those numerous algorithms that model all computer learning processes. They manage to create classifiers called machine learning. Specifically, machine learning is a process of computer programming to optimize data processing performance and experiences [15]. McCulloch and Pitts studied the first mathematical models based on an artificial neural network in 1943 [16]. Artificial neural networks are also called non-parametric processing systems that are based on analogy, being inspired by the principles of functionality and structure in the biological neural networks of the human brain. We can say that there is also a problem with the use of neural networks, such as pattern recognition, clustering, forecasting, and the predictability of certain categories [17]. When we talk about forecasting, neural networks are based on training models with past databases, and depending on their capabilities they can make generalizations and further predictions or estimates. According to studies, ANN is data-driven and has lower performance in prediction and estimation, fueling suspicions of over-specification. The application of heuristic methods and rules prevents the model from continuing its training process with observed aspects and in a mixed-use way with the MSE network. Thus, the use of hybrid ANN models with secondary intelligent algorithms or meta-heuristic methods, such as genetic algorithms and bee or ant colony algorithms, has been proposed in many articles to compensate for the disadvantages of ANNs, facilitating the application in practical aspects [18].
Genetic algorithms (GAs) are part of those meta-heuristic methods, but they are also based on some assimilated models from evolutionary computation, which was first invented in 1959 by John Holland [19]. The emergence of problems is found in dynamic environments; they need a response from the environment, which addresses the failure or success of the strategy applied by exploiting all the assimilated data. All this is achieved through recombination strategies, and also the current methods of reproducing the models that are the basis of the calculation [20]. When we talk about CBR, it is more of an ideal data mining technique for retaining information and implementing it in cases of similarity filtering and solving new problems. The RA technique is based on classifiers and is identified as a method oriented to the raw data and less to the features behind the data, being structured on linear and non-linear problems [21]. We can say that a large part of the analysis shows that decision trees are the most used in solving classification problems. The construction is continuously based on features that satisfy the branching rule, a process performed iteratively for each branch. Therefore, decision tree and classification or regression mainly deals with the prediction of a dependent variable based on another predictor variable. This process is based on a response variable and includes a set of values, which in turn contains a continuous or discrete set of variables [22]. These regression trees are a good substitute for basic regression methods. In the field of construction cost estimation, the decision tree is built mainly based on those attributes in the data set that are relevant for the classification process, being the selection of some features [23]. Therefore, to solve some of these problems, expert systems are much better developed by their wide applicability, and also by the methods obtained over time by other experts, declaring them effective in solving cases in similar fields [24]. The most intensively studied areas where relevant studies have been made are closely related to the built environment, the design of highways and public buildings, and the construction of water and sewage networks, railways, or power plants. The cost estimation methods dedicated to these works were based on several applied techniques. These estimation methods are classified into two main categories: qualitative and quantitative methods. Coestim targets both categories by combining the experience of users with the experience of suppliers, forming a mix between quality and quantity based on which work estimates and the final price of materials will be generated. A representative diagram for all cost estimation modeling techniques is shown in Figure 1.
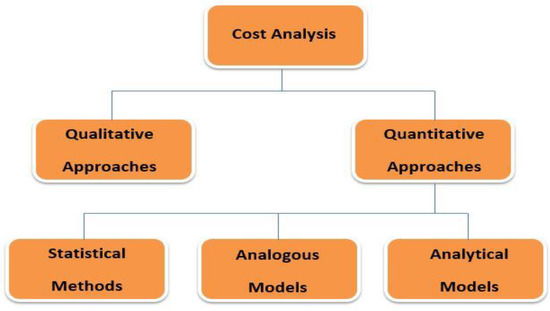
Figure 1.
Representative diagram of modeling techniques dedicated to cost estimation.
2.1.1. Qualitative Approaches
We can say that qualitative approaches are based on the knowledge of the estimator about the requested project, the field of activity, and the basis of the influencing factors, these being divided into two classes: expert judgment and heuristic rules. When applying expert judgment, everything depends on the good or poor results of previous knowledge-based judgments. According to an article [25], the expert judgment technique relies on the advice of experts and experienced peers to validate the estimation result. Therefore, in the case of the Coestim solution, we consider the implementation of distinct packages between suppliers, sellers, and manufacturers, and these packages will generate a response comparable to the service estimates designed by specialists, which are basic models in the estimate trial. This technique relies more on intuition, along with extrapolation techniques, and problems are solved later with the help of experts who ensure the reliability of the whole process. However, these heuristic rules in the cost estimation process are due to intuitive judgments, and the estimation process is optimized based on data extracted from similar projects that have identical characteristics in some places. We can say that quantitative approaches are defined as methods that are based on the process of collecting and analyzing historical data. Data analysis and the application of quantitative models, techniques, or estimation tools lead to a design cost estimate. Thus, the approaches dedicated to cost estimates and known to date are classified into three broad categories: statistical, analog, and analytical.
2.1.2. Statistical Methods in Cost Estimation
In a broader analysis, statistical methods can also rely on alternative formulas or approaches to establish causal relationships in the correlation between final costs and their characteristics [26]. Parametric cost estimation models are characterized by the cost evolution of parameters, which include volume and mass along with gross cost without adding other details [27]. Mathematically, the cost of the project is an estimate of its causal links with the presented parameters, and the result will be a function of the corresponding variables. Such approaches can streamline the early stages of projects, where information is very limited or unavailable, with subsequent adjustments starting from the minimum necessary cost [28]. We can say that there are three types of parametric cost estimation methods [29].
The scale method is applicable in the prevailing technologies, where different dimensions characterize the products. These evaluations of the technical parameters are the basis of the precondition of the method. The evaluation is compared with that of other completed projects, making this method a combination of analog and parametric approaches, benefiting from cost assumptions based on parameters considered interactive through a linear function [30]. The statistical method has wide applicability; in this case, the activities are divided into different areas through which the final mathematical formulas are subsequently constructed. The model is composed of data on technical specifications, the relationship between data and final variables, constants, and cost estimation formulas. Thus, mathematical calculation refers to the relationship between the final cost and a limited set of technical parameters. We can say that some of the parameters are physical and dimensional values, and at the level of parametric methods, the most predominant are analysis, regression, and optimization techniques. Even parametric cost estimation methods have technical problems in that they benefit from all parameters in the early stages, leading to uncertainty in the results. To obtain viable results, at least five or six similar regression cases should be considered to arrive at the closest estimated cost. However, the methods are considered extremely useful in cost estimation due to how the required tasks are performed [31].
2.2. Study of the Construction of the BP (Back-Propagation) Neural Network Model
The widespread use of the BP neural network as an application model is based on a neural network propagation network with multilayer feedforward. It is characterized by the fact that it manages to propagate errors in the direction of return. The BP neural network has three layers, and these include the input layer, the hidden layer, and an output layer as shown in Figure 2. Perhaps the most important perspective in this field comes from the area of gray system theory, which is used in applied determinations and optimizations of estimates within BP neural networks. We can say that it collects costs in the field of construction engineering and then forms data sets and training samples in order to establish the most reliable cost estimation models. Subsequently, the analysis is exemplified by gray system prediction fences, comparing aspects related to accuracy and prediction testing [32].
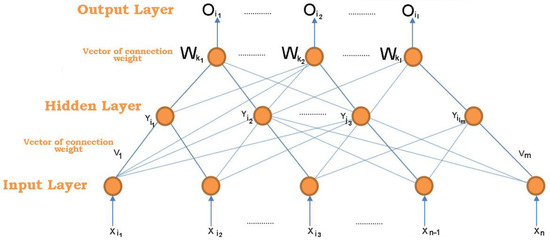
Figure 2.
Illustration of the back-propagation neural network model in estimation process.
According to the illustration above, within the three-layer perceptron, the input vector is defined as follows:
Thus, the variable of the hidden layer is noted as follows:
Therefore, the variable of the output layer is noted as follows:
We can say that, in a last process, the waiting vector of the output layer is noted as follows:
In order to take into account all aspects and characteristics in the cost estimation process, the weight matrix must be defined. This responds to the aspects regarding the weight between the training sample from the input layer to the hidden layer, this being represented by Vj.
where Vj can represent the vector that identifies the weight of the column corresponding to the neuron with the property j in the hidden layer, the matrix weight between the sample in the hidden layer and the output layer is represented by the characteristic W,
Thus, the column vector can represent the weight vector that accurately indicates the neuron k in the output layer.
2.3. Analysis of Gray Theory in Cost Estimation
This theory dates back over 30 years from the first test, being structural and stable in terms of mathematical principles. Used in the case of gray equations, gray algebra, matrices, vectors, and other axioms, it generates gray sequences within some systems and gives life to some sub-systems. Therefore, it performs correlations and analyses in models with small samples and poor information, only by processing legible data. This model can be a significant predictor in the field of constructions, at the base being a first-order equation that contains a variable. We can say that the main idea of prediction takes into account the sequence of initial numbers, iterated several times in order to generate a sequence of numbers, which has a linear character of the first order. Therefore, the generated equation is differential and shows an aspect related to regularity.
The equation expresses the set of accumulated original data that can later generate a new cumulative sequence and is also characterized as an AGO-type operator. The process of selecting the characteristic factors is conducted depending on the analysis of the estimated cost of the real one, and information comes from other projects. When analyzing the composition of the costs of a project and the changes that will be made later, the type of foundation, the kind of structure, the number of layers of the project, the interior and exterior decoration, and the location of the project must be taken into account. Following the process of quantifying these factors, the use of this system is used as a variable of the cost control model within the neural network, and an output variable defines the final unit cost. We can say that the quantitative processing of eigenvectors can affect the cost of the project. The definition and representation of the eight factors used are thus made U1 ≈ U8, being significant input vectors of the network model in the final representation of the project as output vectors. The first result of the quantifications performed is presented in Table 1.

Table 1.
Exposure of the vector quantization index of the technical type characteristics.
Cleve Moler and other collaborators have treated the problem of cost estimation since the 1970s with developments in the MATLAB application [33]. They designed an interface-type program with EISPACK and LINKPACK using the combination of matrices to analyze values using advanced programming. These methods proved at that time extremely convenient to use in terms of training data and the set of tools provided. The most important aspect was that it could be used in different fields such as economics, mathematics, and even engineering. Another important aspect was that the MATLAB tool reduced the complexity of programming and improvement; only the use of a single template and the introduction of real data and parameters managed to provide the data they needed at that time.
2.4. Coestim—Design Simulator for Creating Construction Projects
According to studies, the degree of complexity offered by the Coestim application is extremely high, trying to combine all the features and parameters that a person who wants to build or renovate a home needs. The research focused on defining the clear requirements of a system dedicated to the design and simulation of construction estimates, respectively, and the simulation of defined projects. We can say that we have arrived at a basic application architecture that highlights the most important performance characteristics using software tools. The proposal of the Coestim simulator is based on extremely complex elements in terms of properties and characteristics, increased flexibility with external data, and extremely short times in processing the request. Hierarchy and traceability within the Coestim solution were and are necessary to define the extended viability of the solution. For each hierarchical level, new services are defined and gradually published, outlining a list of resources and one of the services, considering their concatenation at the request of the user. All these features of the Coestim application are based on the intensive study of the current market, and also on the lack of applications dedicated to construction estimates that combine e-commerce with construction engineering and the sharing economy. The Coestim application meets all the necessary conditions to become a practical solution in today’s society through the modularity and accumulation of functions it offers. The architecture regarding the hierarchical structure of a construction project can be seen in Figure 3.
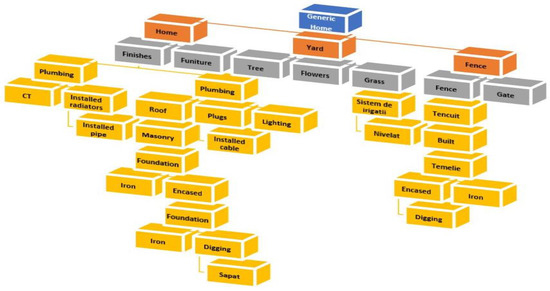
Figure 3.
Conceptual diagram of the database dedicated to the Coestim planner, adapted from [34].
We can say that the optimization of the architecture dedicated to an application starts from the principles of simulating its performance characteristics, becoming a simulator from a software tool. This simulator is essential in research because the advantages it produces support flexibility in designing and creating new architectural elements for the market demand. Another important aspect is related to the costs of development and fixing some errors. We can say that the Coestim project is based on intensive studies of more than five years and is based on several models with the help of which hierarchical structures can be built at the level of cost simulation processes. Simulation algorithms were also implemented to create estimated designs. This simulation algorithm is based on several stages that evaluate the feasibility against the rigor imposed by the market. In the case of SuperServices, they are identified for each parent separately, and each parent SuperService has the role of retrieving the lists from the children. Thus, a random number is generated for each parent–child structure, they have a predefined number of estimates, increasing at each iteration a value related to the services, and the initial data are multiplied by the iteration number. To add value to the project, super-service sequences are recursively traversed and estimates of the parent–child structure are created. Thus, generating a quote takes into account the details that have the greatest impact on the final component, namely price and quantity. We can say that each estimate needs all the necessary resources, these being called from the Coestim nomenclature, the application of calculation algorithms, and the creation of probabilities for project execution, which are presented in Algorithm 1, and the architecture is made in the NET framework.
| Algorithm 1: Pseudocode example dedicated to the implementation of SuperServices. |
|
3. Prototyping and Implementation of the Proposed Algorithm—Coestim
Following the analysis of the technical specifications, changes were made to the database of entities in the planning and execution phases. These changes involved both the addition of new entities and the adaptation of existing ones to the new requirements.
At the base of the changes is a concept of the hierarchical structuring of a process in sub-assemblies, which, together, determine the sequence of steps necessary to follow in the realization of a project. Two new entities have been created in the planning phase that simplify the logic previously defined in the Process and ProcessDetail entities. By defining these two new entities, SuperService and SuperServiceDetail, the way of organizing the processes that were previously defined for each service is simplified, which implies the following benefits:
- − The SuperService entity can be viewed as a process to which a service can be added, which allows for the defining of specific services not only at an abstract level but also at the level of the process itself;
- − The possibility to create a SuperService entity without attaching a service, an abstract level resulting from its sub-assemblies;
- − The possibility of defining necessary items and resources in sub-assemblies at the intermediate or final finished product level;
- − The possibility of copying a section and reusing it.
In addition, changes were made in the execution phase of a project that required the addition of two new entities, ProjectExecution and ProjectExecutionItem, which, for an estimate created within a project, attach the approximate data for its execution:
- − Scheduled start date;
- − The nearest possible start dates;
- − The furthest end date.
An estimate programmed for execution also has attached the list of items needed for the estimated quantity, as seen in the following EstimateBase.cs:
| EstimateBase.cs—Estimated changes structure |
|
For the logic defined in the previously described models, another change that was required is the use of the SuperService entity for calculating the estimates. Then, the implementation of the changes made to the database following the analysis of the system requirements was followed (see Algorithms 2 and 3).
| Algorithm 2: Database modification process in relation to the described models. Expansion of the database depends on the need to use the SuperService entity in order to calculate the estimates. |
| // 1. START TRANSACTION; ALTER TABLE “SupplierItem” ADD “Url” text NULL; INSERT INTO “__EFMigrationsHistory” (“MigrationId”, “ProductVersion”) VALUES (‘20220307155744_SupplierItemUrl’, ‘5.0.9′); COMMIT; //2. START TRANSACTION; ALTER TABLE “SupplierFeedOutModule” DROP COLUMN “CustomItemBaseMapping”; INSERT INTO “__EFMigrationsHistory” (“MigrationId”, “ProductVersion”) VALUES (‘20220308140322_FeedOutFix’, ‘5.0.9′); COMMIT; |
| Algorithm 3: Solving problems at the database level and incomplete iterations through Entity Framework mappings. |
| START TRANSACTION; ALTER TABLE “EstimateSuperServiceResource” ADD “EstimateId” integer NOT NULL DEFAULT 0; ALTER TABLE “EstimateServiceResource” ADD “EstimateId” integer NOT NULL DEFAULT 0; CREATE INDEX “IX_EstimateSuperServiceResource_EstimateId” ON “EstimateSuperServiceResource” (“EstimateId”); CREATE INDEX “IX_EstimateServiceResource_EstimateId” ON “EstimateServiceResource” (“EstimateId”);ALTER TABLE “EstimateServiceResource” ADD CONSTRAINT “FK_EstimateServiceResource_Estimate_EstimateId” FOREIGN KEY (“EstimateId”) REFERENCES “Estimate” (“Id”) ON DELETE CASCADE; ALTER TABLE “EstimateSuperServiceResource” ADD CONSTRAINT “FK_EstimateSuperServiceResource_Estimate_EstimateId” FOREIGN KEY (“EstimateId”) REFERENCES “Estimate” (“Id”) ON DELETE CASCADE; INSERT INTO “__EFMigrationsHistory” (“MigrationId”, “ProductVersion”) VALUES (‘20220324115416_Estimate’, ‘5.0.9’); COMMIT; |
3.1. Designing Project Creation and Optimization RESTful API
Based on the analysis of the technical specifications related to the implementation of GraphQL, in this stage, the necessary steps for its implementation were followed. To facilitate the implementation of GraphQL in the application, the Entity Framework was used to interface with the database.
GraphQL proposes three notions for implementation:
- − Query: defining the data retrieval methods where we will be able to page, filter, or sort the data;
- − Mutation: defining the methods of creating, modifying, or deleting data;
- − Subscription: defining events from which the user can retrieve data in real-time from the server.
Considering that in the previous stages of development API methods were created to allow CRUD (create, read, modify, and delete) operations on the entities defined in the application, the way to test them both is through GraphiQL, specifically GraphQL integrated into the application as well as through Postman, which is a simple and intuitive API testing tool. Tests of the same method using the paging, filtering, and ordering parameters were conducted in both test environments. The testing of the methods with GraphiQL using paging, ordering, and filtering parameters was conducted in different test environments. The process required for the development of CRUD operations can be observed in the GraphQL structure:
| Query—Body and GraphQL Variables | Pretty Body—Items |
|
|
In addition, the technical specifications that describe the changes to be made to the planning and execution phases were taken into account, so that the new models needed in the API were defined, the required changes were made to the already existing models, and the methods were created by API connection. For the planning phase, the new SuperService and SuperServiceDetail models were defined and the relationship diagram of these two classes and the others needed for service planning was created and presented in SuperServiceService.cs. Having the image of the relations between the classes, the necessary methods for them were defined:
- − Entity fetch method with paging parameters;
- − Entity retrieval method by a unique identifier;
- − Entity creation method;
- − Entity modification method;
- − Entity deletion method.
In addition to the CRUD methods, specific methods have also been added:
- − Create SuperService hierarchy (parent–child tree);
- − Copy the tree sequence to another tree.
| SuperServiceService.cs—examples of SuperService specific methods |
|
For the execution phase, changes were made to the existing models:
- − Estimates to be made based on a SuperService entity;
- − Possibility to create hierarchical structure on estimates;
- − Estimates will also take into account the required resources, not just items. Resources will be pooled from the attached service along with those from the SuperService, if any;
- − Estimates have a cumulative list of calculated items, from the attached service and from the SuperService, if any.
After the changes to the existing classes, two new classes were added, which was necessary for the execution of estimates within projects: ProjectExecution and ProjectExecutionItem. A module has been developed to download records from the database into files with a user-defined structure and predefined format (see the SupplierFeed structure below).
| SupplierFeed—design of quotation execution classes and registration in the database defined by the user |
|
In the context of future definitions and settings regarding the method, and also the format of the exported data, method of communication, and security elements, five types of extensions were created for the data extracted from the platform: .json, .xml, .csv, .xls, and .xlsx. They can be accessed via a previously preset protocol, direct download, ftp, https, or API, with the possibility to set a user with a password, without authentication or a token. For each previously presented setting, the way to customize the user interface is highlighted, and the order number based on which the setting will be displayed in the interface. Given the fact that the data download module works with files with the same extensions as when uploading and the same communication protocols, a number of common methods have been created between the modules, as presented in SupplierHelper.cs.
| SupplierHelper.cs—customer support model, the general structure, and the common methods of con-catenating databases. |
|
3.2. Designing Intelligent Algorithms for Cost Efficiency
We can say that, in accordance with the previous stages of application design, this time the requirements that an algorithm must meet have been defined, in particular the processes related to the development of quotations and the way in which they are generated according to nomenclature and recipes. The objective of the Coestim application was channeled around the improvement and development of intelligent algorithms capable of finding the resources, services, and necessary human resources in real-time, concatenating several databases, and analyzing different suppliers and service providers. All this takes into account the risks to which such a procedure can be subjected. Based on the history and reviews provided by other customers, the products and services of the suppliers are sorted distinctly, and the algorithm is based on the principles of the sharing economy in the field of construction. The intensive studies of over 5 years and the accumulated experience in this field facilitate the development of the application on a solid basis both theoretically and practically. The analyses carried out and the problems identified in the work sites highlighted that the problems are caused by a limited allocation of resources and the faulty planning of construction materials, all of which showed that there is a solution through the implementation of traceability applications.
We can say that ACO (ant colony optimization) plays an important role in the development of algorithms of this kind. This type of algorithm aims to minimize the total time and risks in the design, analysis, or planning process of all resources, along with the previous relations about the constraints. Therefore, after analyzing and performing the calculations in the presented concept, dead times were highlighted in the resource optimization process, and planning with the help of intelligent algorithms dedicated to optimization is imperatively necessary (see Algorithm 4, in which the pseudocode is highlighted). Therefore, the developed algorithm is based on several assumptions, but also aspects that gravitate around all exhaustible resources that facilitate a certain activity, and the architecture is made in the NET framework (see Algorithm 4). Therefore, for an activity, a supplier assigns certain tasks and the resources necessary for its development, and the algorithm will allocate the most suitable characteristics for generating the final estimate. Resources are limited from the point of view of the volume or the number of hours allocated daily, but, with the help of the participatory economy and heuristic algorithms, the allocation of resources for an activity will remain constant for the entire duration of the project.
| Algorithm 4: Pseudocode for designing intelligent algorithms for cost efficiency. |
| 0 references private async Task FindPossibleSmallerPrice (List<Estimate> estimates) { foreach (var estimate in estimates) { } var projectExecutionItems = await project ExecutionService. Project ExecutionItems By EstimateId(estimate. Id); if (project ExecutionItems.Any()) { foreach (var project ExecutionItem in projectExecutionItems) { var itemOffers = await _supplier ItemRepository, GetWhereIncludeAsync (x => x.ItemId == project ExecutionItem. SupplierItem.ItemId, x => x. Include(sip => sip, Prices)); var prices = PreparePrices (ItemOffers, project ExecutionItem.Quantity); var minPriceItem = prices. OrderBy(x => x.Value. Item1). FirestorDefalut(); f (minPriceItem.Key != [projectExecutionItem. Supplier ItemId && minPriceItem.Value. Item1 < project ExecutionItem.Sale PricePer Item) project ExecutionItem. Supplier ItemId = minPriceItem.Key; projectExecutionItem. SalePricePerItem = minPriceItem.Value. Item1; projectExecutionItem. Recomended PricePerItem = minPriceItem.Value. Item2; } 1 reference private Dictionary<int, Tuple<decimal?, decimal?>> PreparePrices (List<Supplier Item> supplier Items, double itemQty) { Dictionary<int, Tuple<decimal>, decimal?>> prices = new Dictionary<int, Tuple<decimal?, decimal?>>(); foreach (var supplierItem in supplier Items) { var supplierItemPrices = supplierItem.Prices; if (supplier ItemPrices.Count >0){ var orderByQuantityPrices = supplier ItemPrices. OrderBy(x => x. Quantity).ToList(); var index = intemQty >= orderByQuantity Prices.Max(x => x.Quantity) > orderByQuantityPrices.Count 1: orderByQuantityPrices. IndexOf(orderByQuantityPrices. LastOrDefalut (f => itemQty >= f.Quantity) >> orderByQuantity Prices [0]; if (index != −1) { } } return prices; prices [supplier Item. Id] = new Tuple<decimal?, decimal?>(supplier ItemPrice [index].Sale Price, supplier ItemPrice[index]. RecomendedPrice); } |
The system requirements for making mappings between the items in the providers’ platforms and the base object of our system were defined. The mappings necessary to collect data through our basic model were also implemented following the finalization of the specifications necessary for this process. The aim was to identify the platforms on which the stores of potential suppliers are built and the ERP systems from which data can be imported. Considering the multitude of existing systems, a sorting of them was carried out, according to their position at the top of the most used platforms.
From the multitude of elements of a platform of this type, the one of interest is the management of articles and their categories, from where the collection of data necessary for good testing of the algorithms will be carried out.
The steps required to implement such a solution are as follows:
- Adding the library to the solution;
- The creation of configuration profiles;
- The creation of object–object mappings.
As reported in our article, the mapping of products from different systems was conducted in the Coestim system and we were able to connect and import data. Connecting to ERP systems is important because these systems are becoming indispensable to any company, knowing that such a system is defined as a unique IT platform, useful for the integrated monitoring, control, and management of all activities, processes, and operations carried out by a company. The ERP component of interest is the inventory, which allows accurate, real-time management and monitoring of all product stocks and stock movements, regardless of whether it is for one or more locations. Based on the analysis of the needs of such a dynamic system, it was decided to use AutoMapper as support for mapping between objects. Starting from the fact that previously the mappings for ERP systems and e-commerce platforms were created, in this stage of the Coestim research project mappings were added for importing items from different files. These files have different formats, so methods have been defined to interpret data from those formats. Given that a method of encrypting critical and personal information is required, system requirements have been defined to secure data at the API level. Based on the specifications defined for the encryption process, the methods were implemented using the algorithms established for the needs of the project. Of interest to the data collection process is the processing of items from files that have subsequently been mapped through the base element and imported into the system. Supported file types are defined in system settings, so methods can be created to dynamically interpret data based on any of these types.
In addition, dynamically, based on the settings defined in the authentication protocol, a connection to the provider was created to download the file. If you choose to load a file, it will be read using methods specific to the type of data it contains. The encryption algorithm will need to have as its main functionality the ability to decrypt the data to its original value so that it can be sent to the providers’ systems to establish a connection with them. Given that when connecting to a certain provider the settings must be decrypted to the initial value, the AES encryption algorithm was chosen, which uses a key at the time of encryption, and the same key is required for decryption. Following specification analysis, encryption methods have been implemented that are capable of the following:
- 4.
- Partially decrypting the information based on the keys set in the API, in case the information is sent to the UI;
- 5.
- Totally decrypting the information based on the API keys in the first step, and in the second step by using the key received from the user, in case it is desired to connect to a system from the provider.
3.3. User Interface Design and Optimization through Lazy Loading Concepts
In this stage, the data transmission process between the server and the user interface was analyzed and the implementation of a solution described in more detail was proposed to optimize this process, by implementing a generic component. This component implements a smart dropdown control that replaces the classic control of the same type. This control must be primarily generic, meaning that it can be used anywhere it is needed in the interface. The component that develops this control automatically connects to the server to retrieve the data it needs. The improvement that this control brings is that the data retrieved from the server is paged and not all at once. This aspect improves the response time between the interface and the server. The control is smart because it manages to fetch the data from the next page when the user reaches a certain percentage of the scroll of the already loaded list. So, every time the user will reach a certain scroll percentage of the newly loaded list, the control will try to automatically load the data for the next page without affecting the waiting time but also improving the data loading time. The control also allows data filtering so that you do not need to run the control until all the data in the system are loaded.
It is important that the data transmission process between the server and the user interface is as correct and optimized as possible. To improve this process, the most important concepts that can improve waiting times and data transmission from the server to the interface were taken into account: the concept of lazy loading and the concept of paging in the case of retrieving data lists. The concept of lazy loading helps to load the necessary sections and postpone the remaining ones until the user needs them. The opposite of this concept is eager loading, which means that all code will load at once (for example, when the entire web page is loaded for the first time). The eager loading technique has the advantage that all content is available immediately when needed, which is great, but the big disadvantage is that a lot of data are retrieved when a page loads, even data that will never be required (for example, an image that is rendered in a part of the page that will never be visited by the user), which increases the load time of the resources. Since the user interface also uses the Angular language for development, this framework helps to implement this concept quite easily. The framework helps Angular developers decide which modules to use for load initialization or when a function is called. Below is an example of lazy loading used in Angular (see Algorithm 5).
| Algorithm 5: NgModule—Outline the decision mode in Angular for lazy loading in the database |
|
The concept of lazy loading is recommended and will only apply to resources that are not needed all the time. In this way, lazy loading can provide a benefit and speed up page load time. The implementation of new interfaces for the newly created models from the project was pursued. The SuperService model has been implemented, which offers the possibility of arranging super-services in the form of a tree; so, through the SuperService model, a hierarchy of services can be defined according to the necessary order within a project. To improve the code and modules that the application uses, the webpack-bundle-analyzer package has been implemented, which tells us in detail what dependencies a given file may contain after the build process. An image parsed by this package of the vendor.js file can be seen in Figure 4.

Figure 4.
Image parsed by vendor.js file package.
3.4. Testing and Highlighting the Performance of the GUI Designed
It can be said that application testing is extremely important, and aspects such as the software GUI, displaying messages that appear when a new entity is added, and storing data in volatile memory for calling them within the same instance are all part of a whole ensemble. The probability that such an operation will cause a malfunction that is not highlighted in the main interface of the application is relatively small. Therefore, in the case of such a scenario, the differences between the basic state and the exposed data are subject to filtering operations and the analysis of potentially generated anomalies.
To optimize the data filtering and searching logic, it was proposed to implement a component that will handle this. The component is a generic one, so it will be able to set filters for each entity based on the properties available in the entity for filtering. The component contains two sections, a section for a quick search and a section for an advanced search.
The quality of the code written in the interface was optimized, avoiding repetitive and difficult-to-maintain portions of code. Considering that web application architecture is a structure that defines how an application is organized on different levels, the quality of web application architecture is given by the following parameters:
- Whether users can correctly solve the tasks within the application;
- Whether developers can modify and maintain this application easily.
Therefore, the most common way to create a client-server application is to build three-tier web application architecture. By using three tiers, it is possible to distribute the application load between the client, server, and database in the most convenient way and ensure high speed and smooth performance. Writing clean code is also important because it will be easily understood by another teammate. Being able to go back to previously written code and understand what it does is essential. To be able to analyze the performance and structure of the bundle files, it was decided to use the webpack-bundle-analyzer package, which helps to identify the modules that are used in our project and provides insight into the modules that can be removed. The benefits of this package are as follows:
- Ability to realize what is really in the bundle;
- Finds out which modules are loaded and in which sizes;
- Finds out which modules were loaded by mistake or which useless modules remain imported;
- Helps to optimize the application.
It was also aimed at identifying ways in which the user interface can be optimized, as well as running specific tests.
Benefits of testing:
- 6.
- Using simulations is generally cheaper, safer, and sometimes more ethical than conducting experiments in the real world. For example, supercomputers are sometimes used to simulate the detonation of nuclear devices and their effects to support better preparedness in the event of a nuclear explosion. Similar efforts are undertaken to simulate hurricanes and other natural disasters.
- 7.
- Simulations can often be even more realistic than traditional experiments because they allow the free configuration of environmental parameters found within the operational scope of the final product. Examples are supporting the US Navy’s deep-water operations or simulating the surface of neighboring planets in preparation for NASA missions.
- 8.
- Simulations can often be performed faster than in real-time. This allows their use for efficient analyses, especially when the data needed to initialize the simulation can be easily obtained from operational data. The simulations allow the creation of a coherent synthetic environment that allows the integration of simulated systems in the early analysis phase, through mixed virtual systems, with prototypic components in a virtual test environment for the final system. If managed correctly, the environment can be migrated from development and testing to training and education in later life cycle phases for systems (including the option to train and optimize a virtual twin of the real system, even under realistic constraints) before the first components are built.
The use of M&S in engineering is well recognized. Simulation technology belongs to the toolkit of engineers in all application domains and has been included in the engineering management body of knowledge. M&S helps to reduce costs, increase the quality of products and systems, and enable their documentation. To ensure that simulation results are applicable in the real world, one must understand the assumptions, conceptualizations, and constraints of its implementation. In addition, the models can be updated and improved using the results of real experiments. Based on this information, the ways in which the user interface can be optimized were analyzed and simulations were carried out at a standard speed without any limitation, a FAST 3G speed, and a SLOW 3G speed. The testing of the interfaces was followed from the point of view of the resources used and the loading and response times. The simulations are presented in Figure 5, Figure 6 and Figure 7, the waiting times being distinctly marked with the green color, the download times for downloading the content are marked with the blue color, the requests and jumps with the gray color.
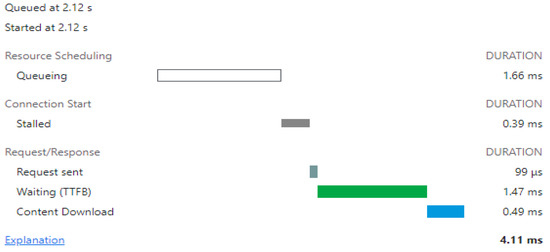
Figure 5.
Simulation without any loading—first page.
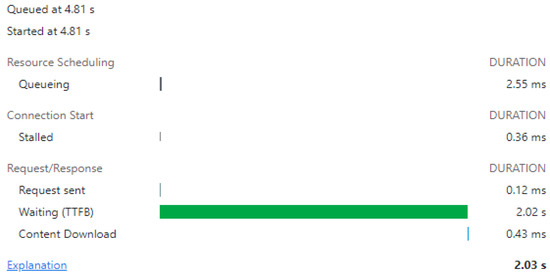
Figure 6.
FAST 3G limited simulation—first page load.
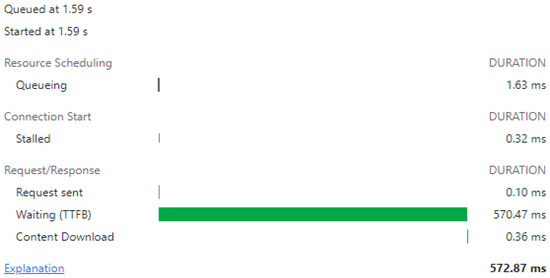
Figure 7.
Simulation with SLOW 3G limitation—loading the first page.
Perhaps one of the most important factors regarding the improvement process of loading an application made at the infrastructure level is the total size of each file in a package. When third-party modules are added to the projects, each of those dependencies in turn has other sub-dimensions that generate bottlenecks. Following the reeds, it was observed that for each entity that was operated roughly, a larger number of components were generated, which then made the listing layout more difficult. Therefore, for each entity, those components must list each item on a gradual scale, and the layout implements a new generic logic that efficiently manages each raw operation.
Thus, the new layout contains n number of components, but all the entities that lead to the generation of that layout have a single purpose, that of generating a defined ideal component. Within the new layout, generic modules are created that reload whenever a new intermediate module is needed through which a dynamic dialogue is managed, facilitating the listing or processing of data from any area of the Coestim application.
3.5. Testing and Validating the Designed Application by Overloading the Databases
In this direction, the problem of database testing was addressed, by overloading the database in relation to the estimated traffic in the conditions where the designed application will have the role of e-commerce platform, service reservation platform, and construction design generation. Under these conditions, many more categories of users are targeted than on a standard building materials platform. “Functional database testing” refers to the method of testing a database that aims to validate the functional requirements at the data infrastructure level from the end user’s point of view. We can say that the main purpose is to test and validate the transactions or operations performed by an end user who accesses the database, the result being boolean in terms of compliance. “Non-functional testing” in the context of database testing can be classified into different categories depending on the application requirements. Things such as response time under stressful conditions are considered in this step (see Table 2) along with transaction exposure per second (Tps).
Table 2.
Results regarding the testing of the database and the use of its performance standards regarding the number of connections.
The usefulness of such a module can be tested especially in the case of data entered by loading them from files when later the data can be downloaded in a file with the same format and structure as the one from where they were taken, in which case the verification of data can be performed by comparing the original file with the downloaded one. Tests were also performed for the creating, modifying, deleting, list fetch, and fetch methods uniquely on an entity using 1000 to 10,000 clients executing 10 queries each to the server. We can say that database performance can be tested using Pgbench, the simple way to test PostgreSQL databases. It runs the same sequence of SQL commands repetitively, opening multiple sessions to the current databases, then calculates an average rate in the weight of transactions identified as transactions per second. In this case, test scenarios were outlined, taking into account cases where several more than 10, 100, 1000, or 10,000 clients were distributed over two execution threads, executing a different number of transactions for each client. These aspects are exposed in Figure 8 and presented in detail in Table 1.
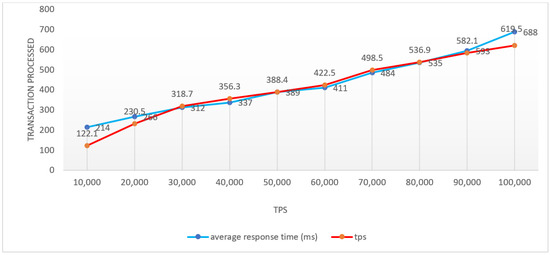
Figure 8.
Graphical representation of the simulation order processing process (TPS).
When we design a suite of testing and analysis tools to measure the performance of applications, along with that of software architectures, we must analyze how the database is populated with data, services, users, suppliers, materials, and their variations. Therefore, to more easily identify the information from the supplier, text-type columns are added for the “SupplierItem” entity, and this contains a link to the item from the supplier. In the case of the “SupplierFeedOutModule” entity, the “CustomItemBaseMapping” column is deleted because during implementation the “ItemBaseMapping” column proved to be sufficient for saving an item’s mapping. Later, columns containing iterations for services and their identifying resources are added, asynchronously renaming price and quantity columns in real-time to generate quotes based on user queries. Renamed price and quantity columns changed date type to “EstimateItem” and “ProjectExecutionItem” to match their name and type from “SupplierItemPrice”. The “SuperServiceResource” entity with the necessary columns was added to specify the number of hours required for a resource and to indicate whether it is on the entire super-service. Changes were also made to the data type for the amount column in the “ServiceResource” and “EstimateServiceResource” entities to accept actual values. What we can highlight, according to the scenarios tested in the case of Table 3, are aspects related to the number of clients that the Coestim platform can manage without compromising the integrity of the platform, and the graphic display in Figure 9. User sets exceeding 100,000 users executing over 1000,000 processed transactions are established. The flexibility of the platform and its adaptability were some of the main goals on which the entire architecture was coagulated. The development team’s experience has been gained over the years from aspects regarding the reliability process of the existing platforms, especially during the autumn campaigns, when the e-commerce platforms are extremely overloaded and the waiting time increases. We can say that at this moment the application for e-commerce and generating quotations for construction, related services, and construction materials meets all the conditions to be one of the most accurate and stable applications dedicated to the field of construction. The algorithm designed and being released has many strengths compared to what currently exists in the e-commerce market. The main goal of the Coestim application is to include as many e-commerce platforms as possible dedicated to the construction and service market segment, and also to facilitate quality construction, reducing design errors.
Table 3.
Intensive testing of the database depends on the processes initiated by the users in relation to the connections.
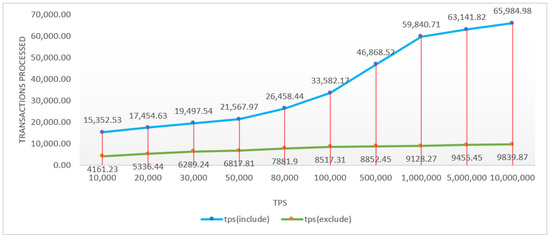
Figure 9.
Graphical representation of the endurance of the database in relation to the processes initiated by the users.
4. Discussion
We can say that planning tools are used with the aim of predicting when an order will be completed; more precisely, planning refers directly to the way to estimate the delivery time within a production system. All these aspects are based on some unknowns that the Coestim application managed to identify and transform from time-influencing factors into key elements and indicators for decision-making evaluation through the principle of the participatory economy. These are made with the help of construction specialists, including depot printers, construction companies, craftsmen, and engineers. Regarding the occupancy rate, it was highlighted that while some activities were in the query process, others gained time, and the weight of the degree of use of time generated 80% time dedicated to the workflow, and for the difference of 20 % of the time, orders and quotations are generated. Therefore, a higher degree of occupation in the task execution process applies limitations even in the case of delivery time, aspects that lead to fewer estimation errors. Neglecting these leads to a margin of error of approximately 10% cumulatively; therefore, the initial prediction of delivery time becomes difficult to predict. If there is a second effect, it complicates the entire process of planning and generating an order in the allotted time, especially through variability. Therefore, two types of variability in the same process can negatively influence the entire planning process. Therefore, we consider extremely important and useful the development of a solution like Coestim, which aims to dynamize and automate the processes dedicated to the generation of construction estimates in relation to the client’s demand and needs. The Coestim solution incorporates several principles of the participative economy, along with intelligent algorithms for the optimization and processing of nomenclature, and at their base is a convolutional API dedicated to the recipes of work quotes. It has highly dynamic elements and combines important implementation practices based on communication and data processing, with no limitation on the size of data packets. The modularity of the projects or APIs with which the Coestim application is integrated does not depend on third parties, as it is able to adapt to absolutely all invoicing programs, e-commerce platforms or existing databases, courier or accounting companies, and management. Continuous implementations led to the creation of new entities, which were followed by CRUD operations generating new components. Therefore, Coestim can advance technologically by using a layout that is able to implement a new type of generic logic, this being ideal in the process of managing CRUD operations.
5. Conclusions
We can say that the Coestim application is based on the most advanced analysis procedures and advanced calculations. In addition to these aspects, the heuristic algorithms that facilitate imports from several databases and e-commerce platforms support all the new elements necessary for a study dedicated to the e-commerce market. To these essential conditions are added elements regarding invoicing methods, ERP integration, download as a plug-in, and integration with all types of existing online platforms. The construction field can be revitalized and propelled by incorporating such a highly feasible solution that has channeled all its attention onto the generation of funds dedicated to the construction field, at the same time operating as an e-commerce platform for construction materials, along with craftsmen or specialized companies, 3D design, or the generation of projects based on which there will be specialized recipes, and errors in the process of purchasing construction materials will no longer exist. We considered necessary future implementations based on dynamic lean or QRM principles in the final Coestim solution, to improve the designed algorithms. We can say that the Coestim application includes e-commerce dedicated to the field of construction, but with an extremely interesting approach, that at every step the algorithm corrects errors in the generation of an estimate based on the data from the construction nomenclature developed by engineers and designers. When you complete an order and need services, Coestim delivers alternatives to choosing a team or a specialist within the platform. In a word, in addition to having the possibility to purchase products at the most advantageous prices, you can also have a team of professionals to complete your work. In conclusion, the Coestim application generates work estimates that are later assigned to several work teams, distributors, markets in the field, services, prescriptions, and price quotes of warehouses. These features of the application led to a database populated with over 220,000 articles shortly after its launch. We want to introduce new standards that will guide the construction industry and that will subsequently increase the level of quality and the persuasion of related services. The direct involvement of clients, suppliers, builders, engineers, and architects stimulates electronic commerce and develops a new trend in the field of construction.
Author Contributions
Conceptualization, A.S. and N.S.; methodology, A.S., M.M. and M.B.; software, A.S.; validation, A.S. and N.S.; formal analysis, A.S.; investigation, A.S.; resources, M.B.; data curation, A.S. and E.Z.; writing—original draft preparation, A.S., N.S. and E.Z.; writing—review and editing, A.S.; visualization, E.Z.; supervision, A.S.; project administration, A.S.; funding acquisition, A.S. All authors have read and agreed to the published version of the manuscript.
Funding
This research received no external funding.
Data Availability Statement
Not Applicable, the study does not report any data.
Acknowledgments
Project co-financed by the European Regional Development Fund through the Operational Program Competitiveness 2014–2020 “Center for the transfer of knowledge to enterprises in the field of ICT—CENTRIC”.
Conflicts of Interest
The authors declare no conflict of interest.
References
- Lai, G.; Liu, H.; Xiao, W.; Zhao, X. “Fulfilled by Amazon”: A Strategic Perspective of Competition at the e-Commerce Platform. MSOM 2022, 68. [Google Scholar] [CrossRef]
- Li, Z.; Agarwal, A. Platform Integration and Demand Spillovers in Complementary Markets: Evidence from Facebook’s Integration of Instagram. Manag. Sci. 2017, 63, 3438–3458. [Google Scholar] [CrossRef]
- Li, P.; Wei, H.; Wang, Y.; Tan, D. Research on Retailer’s Business Model Based on Product Quality and Service Level. J. Ind. Eng./Eng. Manag. 2020, 34, 164–177. [Google Scholar]
- Nistor, A.; Zadobrischi, E. The Influence of Fake News on Social Media: Analysis and Verification of Web Content during the COVID-19 Pandemic by Advanced Machine Learning Methods and Natural Language Processing. Sustainability 2022, 14, 10466. [Google Scholar] [CrossRef]
- Di Nardo, M.; Yu, H. Special Issue “Industry 5.0: The Prelude to the Sixth Industrial Revolution”. Appl. Syst. Innov. 2021, 4, 45. [Google Scholar] [CrossRef]
- Wang, G.; Ai, X.; Zhong, L. The Choice of a E-Retailer’s Operation Modes under Network Platform Service Environment. Oper. Res. Manag. Sci. 2021, 30, 226–233. [Google Scholar]
- Zhou, C.; Yu, J.; Li, H. Single or Hybrid: Selling Mode Choices of Self-Run Platform Under Dual Competition Environment. J. Northeast. Univ. (Nat. Sci.) 2021, 42, 1349–1359. [Google Scholar]
- Domagała, A.; Grobler-Dębska, K.; Wąs, J.; Kucharska, E. Post-Implementation ERP Software Development: Upgrade or Reimplementation. Appl. Sci. 2021, 11, 4937. [Google Scholar] [CrossRef]
- Liu, C.; Dan, Y.; Dan, B.; Xu, G. Cooperative strategy for a dual-channel supply chain with the influence of free-riding customers. Electron. Commer. Res. Appl. 2020, 43, 101001. [Google Scholar] [CrossRef]
- Akintoye, A. Analysis of factors influencing project cost estimating practice. Constr. Manag. Econ. 2000, 18, 77–89. [Google Scholar] [CrossRef]
- Fu, W.K.; Drew, D.S.; Lo, H.P. The effect of experience on contractors’ competitiveness in recurrent bidding. Constr. Manag. Econ. 2002, 20, 655–666. [Google Scholar] [CrossRef]
- Black, C.; Akintoye, A.; Fitzgerald, E. An analysis of success factors and benefits of partnering in construction. Int. J. Proj. Manag. 2000, 18, 423–434. [Google Scholar] [CrossRef]
- Wang, X.J.; Huang, J. The Relationships between Key Stakeholders’ Project Performance and Project Success: Perceptions of Chinese Supervising Engineers. Int. J. Proj. Manag. 2006, 24, 253–260. [Google Scholar] [CrossRef]
- Al-Jibouri, S.H.S. Monitoring systems and their effectiveness for project cost control in construction. International journal of project management 2003, 21, 145–154. [Google Scholar] [CrossRef]
- Matthess, M.; Kunkel, S. Structural change and digitalization in developing countries: Conceptually linking the two transformations. Technol. Soc. 2020, 63, 101428. [Google Scholar] [CrossRef]
- Moeuf, A.; Pellerin, R.; Lamouri, S.; Tamayo-Giraldo, S.; Barbaray, R. The Industrial Management of SMEs in the Era of Industry 4.0. Int. J. Prod. Res. 2018, 56, 1118–1136. [Google Scholar] [CrossRef]
- Nistor, A.; Zadobrischi, E. The Consumption Analysis of Economic Media at the Regional Level in a Developing Country. Sustainability 2022, 14, 16140. [Google Scholar] [CrossRef]
- Lin, C.-L.; Fan, C.-L.; Chen, B.-K. Hybrid Analytic Hierarchy Process–Artificial Neural Network Model for Predicting the Major Risks and Quality of Taiwanese Construction Projects. Appl. Sci. 2022, 12, 7790. [Google Scholar] [CrossRef]
- Holland, J.L. A theory of vocational choice. J. Couns. Psychol. 1959, 6, 35–45. [Google Scholar] [CrossRef]
- Wudhikarn, R.; Pongpatcharatorntep, D. An improved intellectual capital management method for selecting and prioritizing intangible-related aspects: A case study of small enterprise in Thailand. Mathematics 2022, 10, 626. [Google Scholar] [CrossRef]
- Géron, A. hands-on machine learning with scikit-learn and tensorflow. In Concepts, Tools, and Techniques to Build Intelligent Systems; O’Reilly Media: Sebastopol, CA, USA, 2017. [Google Scholar]
- Yuwono, M.; Guo, Y.; Wall, J.; Li, J.; West, S.; Platt, G.; Su, S.W. Unsupervised feature selection using swarm intelligence and consensus clustering for automatic fault detection and diagnosis in heating ventilation and air conditioning systems. Appl. Soft. Comput. 2015, 34, 402–425. [Google Scholar] [CrossRef]
- Chattapadhyay, D.B.; Putta, J. Risk identification, assessments, and prediction for mega construction projects: A risk prediction paradigm based on cross analytical-machine learning model. Buildings 2021, 11, 172. [Google Scholar] [CrossRef]
- Fan, C.L. Defect risk assessment using a hybrid machine learning method. J. Constr. Eng. Manag. 2020, 146, 04020102. [Google Scholar] [CrossRef]
- Kifokeris, D.; Xenidis, Y. Risk source-based constructability appraisal using supervised machine learning. Autom. Constr. 2019, 104, 341–359. [Google Scholar] [CrossRef]
- Pereira, E.; Ali, M.; Wu, L.; Abourizk, S. Distributed Simulation–Based Analytics Approach for Enhancing Safety Management Systems in Industrial Construction. J. Constr. Eng. Manag. 2020, 146, 04019091. [Google Scholar] [CrossRef]
- Yan, F.; Lin, Z.B.; Azarmi, F.; Sobolev, K. Evaluation and prediction of bond strength of GFRP-bar reinforced concrete using artificial neural network optimized with genetic algorithm. Compos. Struct. 2017, 161, 441–452. [Google Scholar] [CrossRef]
- Ehsani, E.; Kazemi, N.; Olugu, E.U.; Grosse, E.H.; Schwindl, K. Applying fuzzy multi-objective linear programming to a project management decision with nonlinear fuzzy membership functions. Neural. Comput. Appl. 2017, 28, 2193–2206. [Google Scholar] [CrossRef]
- Jin, J.; Li, Z.; Zhu, L.; Tong, X.H.; Yang, C.W. Application of BP neural network in risk evaluation of railway construction. J. Railw. Eng. Soc. 2019, 3, 103–109. [Google Scholar]
- Krizhevsky, A.; Sutskever, I.; Hinton, G.E. Imagenet classification with deep convolutional neural networks. In Advances in Neural Information Processing Systems 25; Pereira, F., Burges, C.J., Bottou, L., Weinberger, K.Q., Eds.; Curran Associates, Inc.: Red Hook, NY, USA, 2012; pp. 1097–1105. [Google Scholar]
- Marsh, H.W.; Hau, K.T. Confirmatory factor analysis: Strategies for small sample sizes. In Statistical Strategies for Small Sample Research; Hoyle, R.H., Ed.; SAGE Publishing: London, UK, 1999; pp. 252–284. [Google Scholar]
- Arabyat, Y.A.; AlZubi, A.A.; Aldebei, D.M.; Al-oqaily, S.Z. An Efficient Method for Pricing Analysis Based on Neural Networks. Risks 2022, 10, 151. [Google Scholar] [CrossRef]
- Haigh, T. Cleve Moler: Mathematical Software Pioneer and Creator of Matlab. IEEE Ann. Hist. Comput. 2008, 30, 87–91. [Google Scholar] [CrossRef]
- Sfichi, A.; Sfichi, N.; Bădeliță, M.; Medrihan, M.; Zadobrischi, E. Utility of Designing Intelligent Algorithms to Streamline E-Commerce Operations and Construction Costs Estimates by Applying Principles of Sharing Economy: Coestim. Telecom 2022, 3, 484–503. [Google Scholar] [CrossRef]


Disclaimer/Publisher’s Note: The statements, opinions and data contained in all publications are solely those of the individual author(s) and contributor(s) and not of MDPI and/or the editor(s). MDPI and/or the editor(s) disclaim responsibility for any injury to people or property resulting from any ideas, methods, instructions or products referred to in the content. |
© 2022 by the authors. Licensee MDPI, Basel, Switzerland. This article is an open access article distributed under the terms and conditions of the Creative Commons Attribution (CC BY) license (https://creativecommons.org/licenses/by/4.0/).