Abstract
Long-Range Wide-Area Network (LoRaWAN) technology offers efficient connectivity for numerous end devices over a wide coverage area in the Internet of Things (IoT) network, enabling the exchange of data over the Internet between even the most minor Internet-connected devices and systems. One of LoRaWAN’s hallmark features is the Adaptive Data Rate (ADR) algorithm. ADR is a resource allocation function which dynamically adjusts the network’s data rate, airtime, and energy dissipation to optimise its performance. The allocation of spreading factors plays a critical function in defining the throughput of the end device and its robustness to interference. However, in practical deployments, LoRaWAN networks experience considerable interference, severely affecting the packet delivery ratio, energy utilisation, and general network performance. To address this, we present a novel ADR framework, SSFIR-ADR, which utilises randomised spreading factor allocation to minimise energy consumption and packet collisions while maintaining optimal network performance. We implement a LoRa network composed of a single gateway that connects loads of end nodes to a network server. In terms of energy use, packet delivery rate, and interference rate (IR), our simulation implementation does better than LoRaWAN’s legacy ADR scheme for a range of application data intervals.
Keywords:
adaptive data rate; collision; interference; Internet of Things; LoRa; LoRaWAN; spreading factor 1. Introduction
The Internet of Things (IoT) has transformed wireless networks worldwide, where large-scale end devices are supported while maintaining low communication rates and high energy efficiency. IoT technologies improve our quality of life, automate a huge number of operations and reduce energy, which diminishes greenhouse gas emissions. One of them, the Low-Power Wide-Area Network (LPWAN), is massively adopted on the strength of its low-cost, battery-operated end-devices, wide area coverage and low bit rates. The Long-Range Wide-Area Network is an LPWAN technology that is skyrocketing in popularity thanks to its easy and versatile deployment and its use of the sub-GHz unlicensed industrial, scientific, and medical (ISM) frequency bands. LoRaWAN is responsible for a variety of IoT applications that can enhance the standard of living, including smart homes [1], smart healthcare [2], smart agriculture [3], and smart cities [4]. A comparison of LoRaWAN with other competing LPWAN technologies, including Sigfox and NBIoT, is provided in [5,6].
The LoRa physical layer utilises the chirp spread spectrum (CSS) modulation strategy as a method of signal transmission modulation. CSS enables the possible adjustment of the data transmission rate based on various transmission parameter settings, each of which comprises the bandwidth (BW), coding rate (CR), transmission power (TP), and spreading factor (SF) [7]. These settings are essential for evaluating the interference and noise robustness of the devices’ transmission range, data rate, and energy utilisation. As a result, LoRaWAN is an important LPWAN technology that can meet the Quality of Service (QoS) requirements of diverse IoT operations [8].
The primary focus of this research is to address the issue of interference in LoRaWAN networks. This challenge arises due to an increase in simultaneous transmissions or channel conditions, leading to packet collisions. Interference has an adverse impact on the network’s performance by causing increased packet error rates, increased latency, and decreased signal quality, ultimately leading to lower reliability and reduced communication range. Studies have been undertaken which focus on the capabilities and constraints of LoRaWAN [9,10]. As more devices continue being added to the IoT network, the probability of interference and collision of data packets increases [11,12]. It has been estimated that the amount of interconnected IoT end nodes will surpass 55 billion by 2025 [13]. Most of these devices are deployed in specified and sometimes hard-to-reach locations, necessitating that they operate for extended periods on battery power. Hence, decreasing power utilisation is crucial for the Internet of Things. To mitigate these effects, LoRaWAN networks typically use frequency hopping and adaptive data rate schemes, which dynamically adjust the transmission settings to minimise the effect of interference [14].
The Adaptive Data Rate (ADR) is a protocol specified by LoRaWAN that enables the allocation of spreading factors [15,16]. The ADR protocol controls transmission parameters such as the data rate, transmission range, reliability, and energy expenditure by dynamically adjusting the spreading factor in relation to the link budget for each end device within the LoRaWAN network. The CSS modulation technology has pseudo-orthogonal properties with different spreading factor signals that can support multiple end devices in one channel. However, this quasi-orthogonality also results in interference and noise between spreading factors that can significantly affect the link performance [17,18,19,20]. While ADR improves the transmission efficiency of end devices in LoRaWAN, increasing the network size leads to packet collisions, which, in turn, increase interference, decrease range, and reduce data rates [21,22,23,24]. This leads to increased interference, decreased range, and decreased data rates.
Energy efficiency is a chief consideration in the design of ADR schemes for LoRaWAN networks, as the battery life of end nodes can be a limiting factor in network operation. It is thus desirable to find additional mechanisms that deal with this phenomenon. Existing research predominantly emphasises metrics such as energy utilisation and link-level throughput, often at the expense of packet success probability within LoRaWAN networks. In this study, we advance SSFIR-ADR, an adaptive data rate mechanism that optimally allocates spreading factors, reducing packet collision to enhance the packet delivery ratio in the LoRaWAN network without compromising energy efficiency. Our proposed ADR scheme is designed to optimise packet delivery while taking into account energy efficiency for LoRa using confirmed traffic. To the best of our knowledge, such a framework has not previously been developed in the literature. The principal contributions of this work are outlined as follows:
- The analysis of the impact of improving the standard LoRaWAN ADR by minimising interference and avoiding collisions.
- The design of an ADR model with collision avoidance and minimised interference.
- The proposal of a stochastic probability model to restrict packet retransmission that demonstrates an optimisation of the packet delivery ratio and energy saving.
The remainder of the article is organised in the following manner: Section 2 discusses the technological background while Section 3 presents the related literature. Section 4 describes the system model and Section 5 presents the proposed scheme. Section 6 presents and discusses the simulation results. Section 7 concludes the paper.
2. Technological Background
The LoRaWAN network infrastructure consists of three major elements, namely, end nodes, gateways (GW), and a central network server connected in a star-of-star topology. EDs are battery-powered endpoints such as sensors or actuators that transmit to and receive data from the network using the LoRa PHY layer technology. LoRaWAN is classified as the media access control (MAC) layer. The EDs transmit data packets via the GW for onward transmission to the network server (uplink packets) and the NS transmits data through the GW to the EDs (downlink packets). There is no peer-to-peer communication between the EDs. The GW is an intermediary between the EDs and the NS connected through an IP-based backhaul connection. The network server provides for the network management and controlling access permissions to it. The NS handles the authentication of EDs, manages the scheduling of transmissions, and coordinates the distribution of network transmission parameters. The NS then connects to numerous application servers to be accessed by users. LoRaWAN provides the Internet of Things with three distinct Classes A, B, and C to accommodate various application protocols. The downlink latency varies according to the device class and, therefore, there is a trade-off between latency and energy utilisation in LoRaWAN [15]. There are two reasons why a sent packet is not correctly received in LoRaWAN: (i) in cases where the signal falls below the required SNR threshold and (ii) in situations where a collision occurs and the signal strength is insufficient in comparison to the noise. Table 1 presents the sensitivity and signal-to-noise ratio (SNR) thresholds linked with various spreading factors within the 868 MHz band.

Table 1.
SNR and sensitivity thresholds per spreading factor.
2.1. LoRa Modulation
The four key LoRa transmission parameters include the transmission power, bandwidth, coding rate, and spreading factor. BW is the frequency range, error correction is provided by CR, and SF represents the data spreading across time. The transmission factors influence the radio range, time-on-air, noise robustness, data rate (DR), and receiver decoding [25]. LoRa modulation utilises spreading factors between 7 and 12 to find a balance between the coverage range and DR. LoRa symbols are made up of chirps, distributed across the whole frequency domain. Depending on the regional parameters, LoRaWAN operates at 125 kHz, 250 kHz, or 500 kHz bandwidth [26]. LoRa uses a frequency shift CSS technology that outputs possible signal waveforms within a given bandwidth BW where the symbol duration is given by [27]. The LoRa modem employs a coding rate, providing improved enhanced interference and decoding error protection. The LoRa specification prescribes CR values of 4/5, 4/6, 4/7, or 4/8. A high CR value indicates more error-correcting bits and, therefore, more robust protection for the data transmitted. The disadvantage is an increase in the time-on-air (ToA) which drains the battery power. The transmission power is a parameter that could also be adjusted to enhance communication performance. The LoRa modulation bit rate would be outlined as shown in (1).
where = Spreading Factor; = Bandwidth; and = Coding Rate.
2.2. Interference Susceptibility of LoRaWAN
Asymmetric interference occurs between wireless sensor networks, including LoRaWAN networks and other wireless protocols. LoRaWAN networks, in particular, may encounter different kinds of interference that could drastically affect network performance. Wideband interference can be caused by other wireless devices operating on similar frequencies, such as microwave ovens, cordless phones, electrical noise from power lines, and even natural sources such as lightning strikes. Narrowband interference is generally the result of the presence of signals that occupy a small frequency band, typically a few kilohertz or less, within the frequency band like Bluetooth.
Within the LoRaWAN network itself, there exist forms of interference known as co-spreading factor (co-SF) as well as inter-spreading factor (inter-SF) interference [19,24]. Co-SF interference develops when two LoRaWAN end nodes use identical spreading factors and transmission occurs concurrently and on the same frequency. This can result in collisions and lost packets, leading to reduced network performance unless one of the signals is 6 dB stronger than the other, called the capture effect expressed in (2). Given two colliding EDs, and , using the same SF, with average received power and , respectively,
Inter-SF interference, on the other hand, occurs when two LoRaWAN devices transmit simultaneously using different SFs on the same frequency. This can result in the deterioration of the signal-to-noise ratio (SNR) and a rise in the bit error rate (BER) of the received signal, resulting in increased energy consumption. Demodulation of the transmitted packets occurs if the received power differential exceeds their signal-to-interference-plus-noise ratio (SINR). According to the findings outlined in [28], the demodulation of signals characterised by co-SF interference presents a greater challenge compared to inter-SF interference. Due to the rapid growth in the IoTs, especially in urban areas, interference becomes a major concern that requires immediate solutions as the sensors are battery operated and their lifetime is limited and, therefore, needs to be extended. The quasi-orthogonality of the spreading factors means that they have minimal interference with each other. This is because LoRaWAN operates in unlicensed frequency bands, where multiple devices can transmit data simultaneously, and interference can occur between devices using the same or different spreading factors. Table 2 shows the interference thresholds per spreading factor. Req is the required SF and Int is the interfering SF. These SIR thresholds are empirical values.
Table 2.
Interference thresholds per spreading factor [29].
2.3. LoRa Adaptive Data Rate
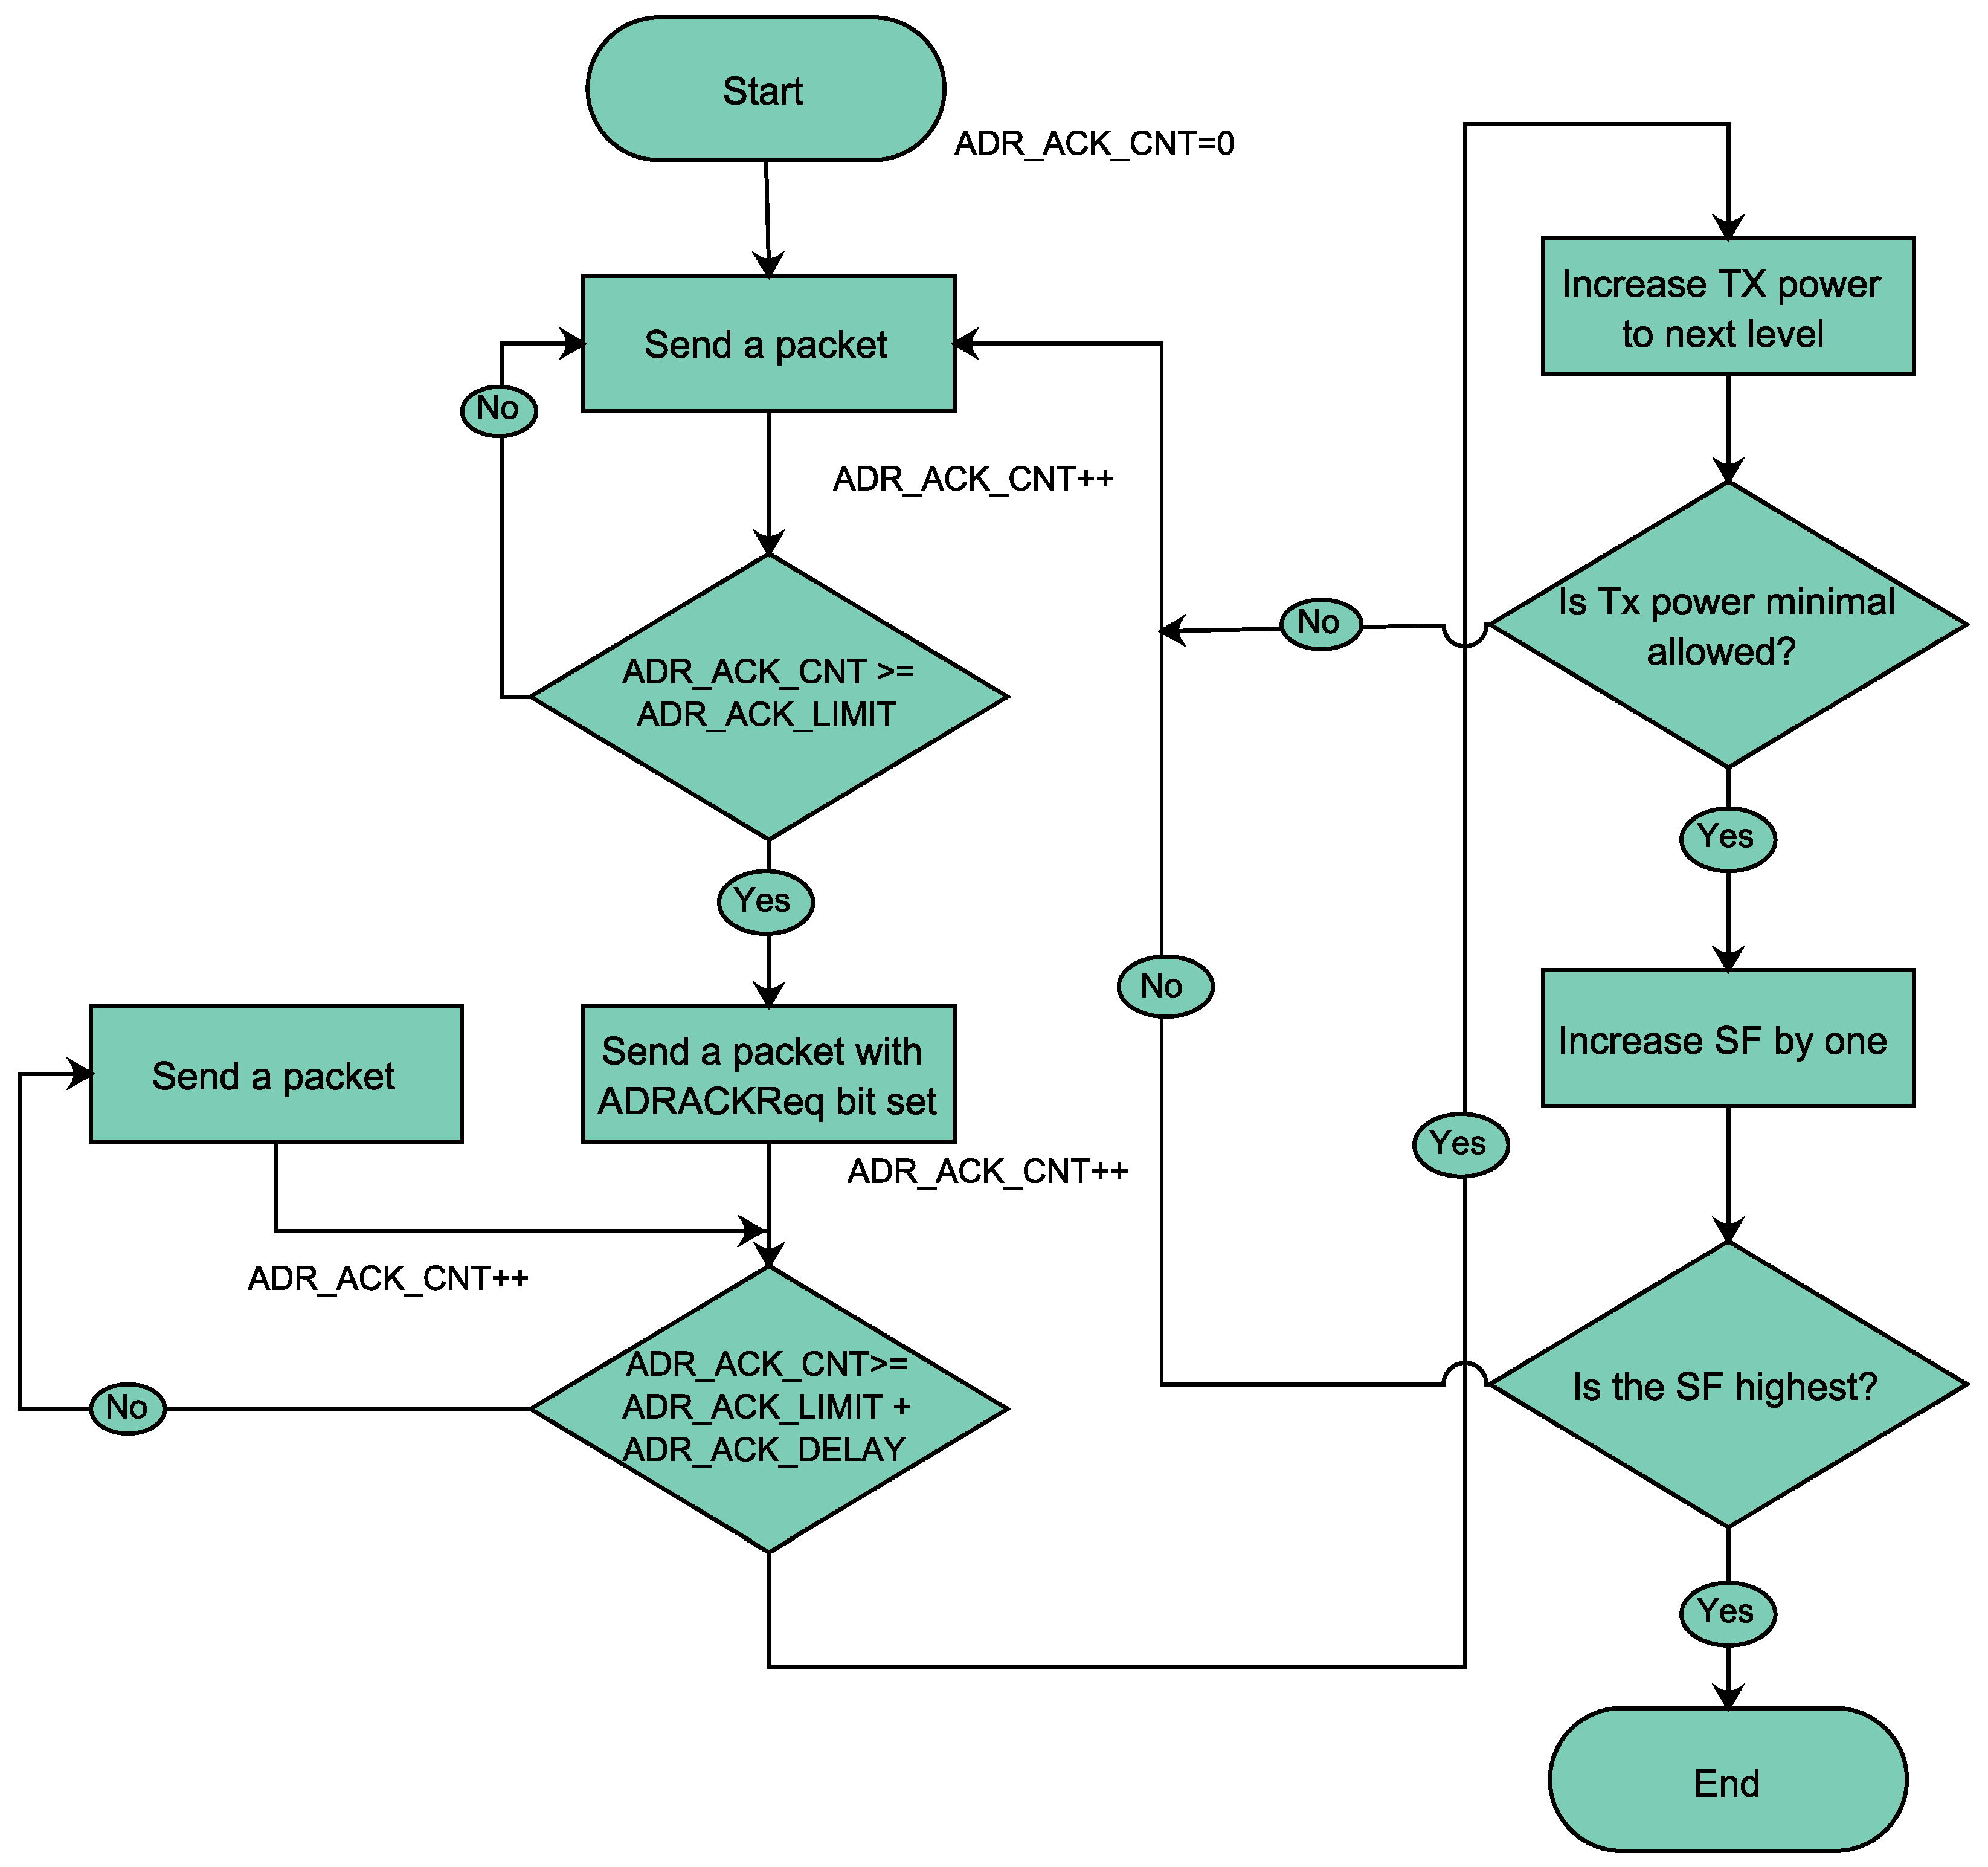
The LoRaWAN standard employs an integral feature known as the Adaptive Data Rate, which serves multiple essential purposes. The ADR is designed to prolong the battery life of EDs, optimise quality of service requirements, enhance overall network capacity, and maximise data throughput. The achievement of these objectives relies on the dynamic management of the spreading factor and transmission power. The study [30] presents a synopsis of the LoRaWAN ADR framework. The ADR algorithm operates at both the end node and network server sides. EDs play a role in determining whether ADR should be activated by setting a specific bit. Once this bit is set, the NS takes charge of regulating the transmission settings and issuing the necessary ADR commands to the ED. Periodically, the ED verifies whether the network server is successfully receiving uplink packets, which is confirmed through SNR link margin feedback sent by the NS. In cases where uplink transmissions fail to reach the gateway, the primary objective of the ED is to improve the status quo by incrementing the spreading factor, hence decreasing the data rate. Additionally, if a downlink packet is not confirmed within a programmable measurement of packets, the ED takes proactive action by increasing the SF for the ensuing uplink packet [15]. This results in an improvement in the transmission range and the possibility of communicating with the GW. The specified procedure followed to adjust to optimal SF is shown in Figure 1. By dynamically adjusting these transmission parameters, LoRaWAN’s ADR effectively adapts to varying environmental conditions, ensuring optimised performance and efficient resource utilisation in the network.
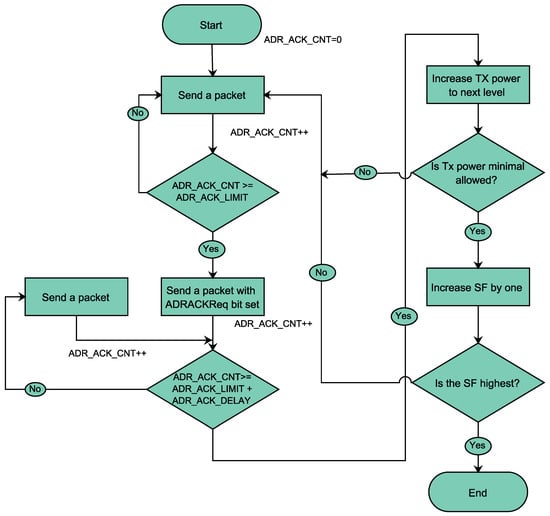
Figure 1.
Standard ADR model ED side.
3. Related Literature
Adaptive data rate schemes have been proposed for LoRaWAN networks to address the issue of interference and packet collisions, which can severely impact the network’s performance. In this section, we survey some of the related research on ADR schemes for LoRaWAN. Optimal resource allocation in ADR implementation still requires further research as transmission delays, interference, and energy efficiency remain topical issues. Some research has been undertaken addressing interference and packet collision issues in LoRa networks [18,20,31] but is not exhaustive. ED mobility is a phenomenon that is gaining ground [32,33,34] and poses its own challenges of frequently varying network conditions. One of the earliest ADR schemes proposed in the literature is a fair adaptive rate algorithm developed by [35], wherein the authors propose a solution to adjust ADR due to network congestion using supervised learning. This technique improves the standard ADR by reducing the probability of ineffective SF adjustments. However, due to the learning process and the feedback required for every transmission, there is an increase in the transmission latency.
EXPLoRa is an algorithm proposed in [36] that considers dense networks to decrease the collision rate and improve throughput. The algorithm distributes equally the number of end nodes utilising different spreading factors (EXPLoRa-AT and another that allocates the SFs by equalising the ToA between different nodes). This method ensures channel usage fairness, although gateway distances are ignored. This approach involves periodically monitoring and managing network behaviour from a centralised entity. The work reported in [37] introduces CA-ADR, a collision-aware algorithm which determines optimal data rates using the average SNR of the most recent packets as a benchmark and the orthogonality of distinct spreading factors to decrease the possibility of collision. This algorithm performs better in comparison to state-of-the-art ADR protocols, albeit in a limited network radius where there are no connectivity constraints, but does not take into consideration the energy efficiency of the network. Collision Avoidance Resource Allocation (CARA) is proffered in [38] wherein the ADR algorithm increases network capacity while decreasing the number of collisions. CARA partitions the available bandwidth of the wireless channel into resource sections corresponding to each channel and SF. This algorithm increases throughput but increases transmission time and energy consumption.
A link margin parameter was used in the ADR algorithm in [39] to account for inaccurate link quality estimates. The algorithm resulted in improved SF allocation and a decrease in energy utilisation on individual nodes. A game theory-based strategy was used in [40] to manage the assignment of SFs to different EDs using the same spreading factor. The authors used varying periods for these EDs to share the spreading factor, preventing interference amongst EDs transmitting concurrently. An ADR algorithm that exploits the quasi-orthogonality of spreading factors to create new channels was developed in [41]. The authors delivered higher throughput compared to legacy ADR algorithms but only used SF7-SF9 to evaluate their proposed scheme. The proposed scheme resulted in a lower packet success probability. In our previous work [42], we used fuzzy logic to develop an energy-efficient ADR algorithm FL-ADR. Although this proposed scheme was more energy-efficient compared to legacy schemes, there was a decrease in the packet delivery ratio. In [43], the authors proposed an ADR protocol that assigns SFs by balancing the time-on-air of packets transmitted by every ED. In contrast, in [44], an optimum section of the spreading factors is determined to allocate spreading factors and transmission power to minimise the chance of packet collision within each SF cluster. The algorithms mentioned above focus on the protocol strategy and depend on basic contention frameworks. Zorbas et al. [45] used the average packet success probability of every spreading factor to determine the spreading factor boundaries in a LoRaWAN cell but limited the radius to 500 m. In our work, we extend our optimal SF allocation to a 5 km radius.
Overall, these studies establish the importance of ADR schemes in LoRaWAN networks and highlight the need for adaptive and intelligent approaches to address the challenges of interference and packet collisions. Realisation remains a long way off and remains an open research area despite solutions being proposed. In this work, we develop an ADR algorithm with collision avoidance and interference management that improves energy efficiency without compromising the packet delivery ratio.
4. System Model
We consider a LoRaWAN network using European regional parameters with confirmed traffic transmissions for Class A end devices. The network uses modulation with a fixed bandwidth of 125 kHz and consists of one GW positioned in the centre of the coverage region. We assume that the GW can emulate eight receivers operating in parallel on the channel line-up given in [15]. EDs are static and homogenous and located randomly with uniform distribution in the coverage area. The network covers a topographical area of 10 km by 10 km. EDs generate packets of fixed payload for a given SF at the same application data interval regardless of the proximity to the GW. The transmission start time for each ED is chosen randomly. In our algorithm, the NS uses the average SNR values [46,47] of the previous four packets sent by the ED to approximate the link quality, in comparison with the standard ADR protocol that uses the maximum SNR value of twenty packets, saving on computational costs [42]. In this context, the traffic model for every ED is considered to be periodic and uniformly distributed. This means that the data transmission from each ED occurs at regular intervals and is spread evenly across the network. We use the Log Distance Propagation path loss model [48]. This model provides a way to estimate how the signal strength decreases as it travels over a distance, taking into account factors like attenuation and interference. The system model incorporates the interference arising from simultaneous uplink transmissions on a specific appropriate uplink transmission. A transmitted packet will be received or dropped according to the sensitivity values given in Table 1. Therefore, SF should be allocated to an ED, guaranteeing that the received signal strength is higher than the receiver sensitivity, as shown in (3) below.
where denotes the average SNR of the packets in the ReceivedPacketList, is the minimum SNR threshold, and is the device margin. The received signal power at the GW in dB is given in (4):
where is the transmit power at the ED, is the antenna gain, and is the path loss.
The path loss propagation is given by:
where is the distance between the ED and the gateway, is the pathloss exponent (3.76), and is the carrier frequency (868.1 MHz).
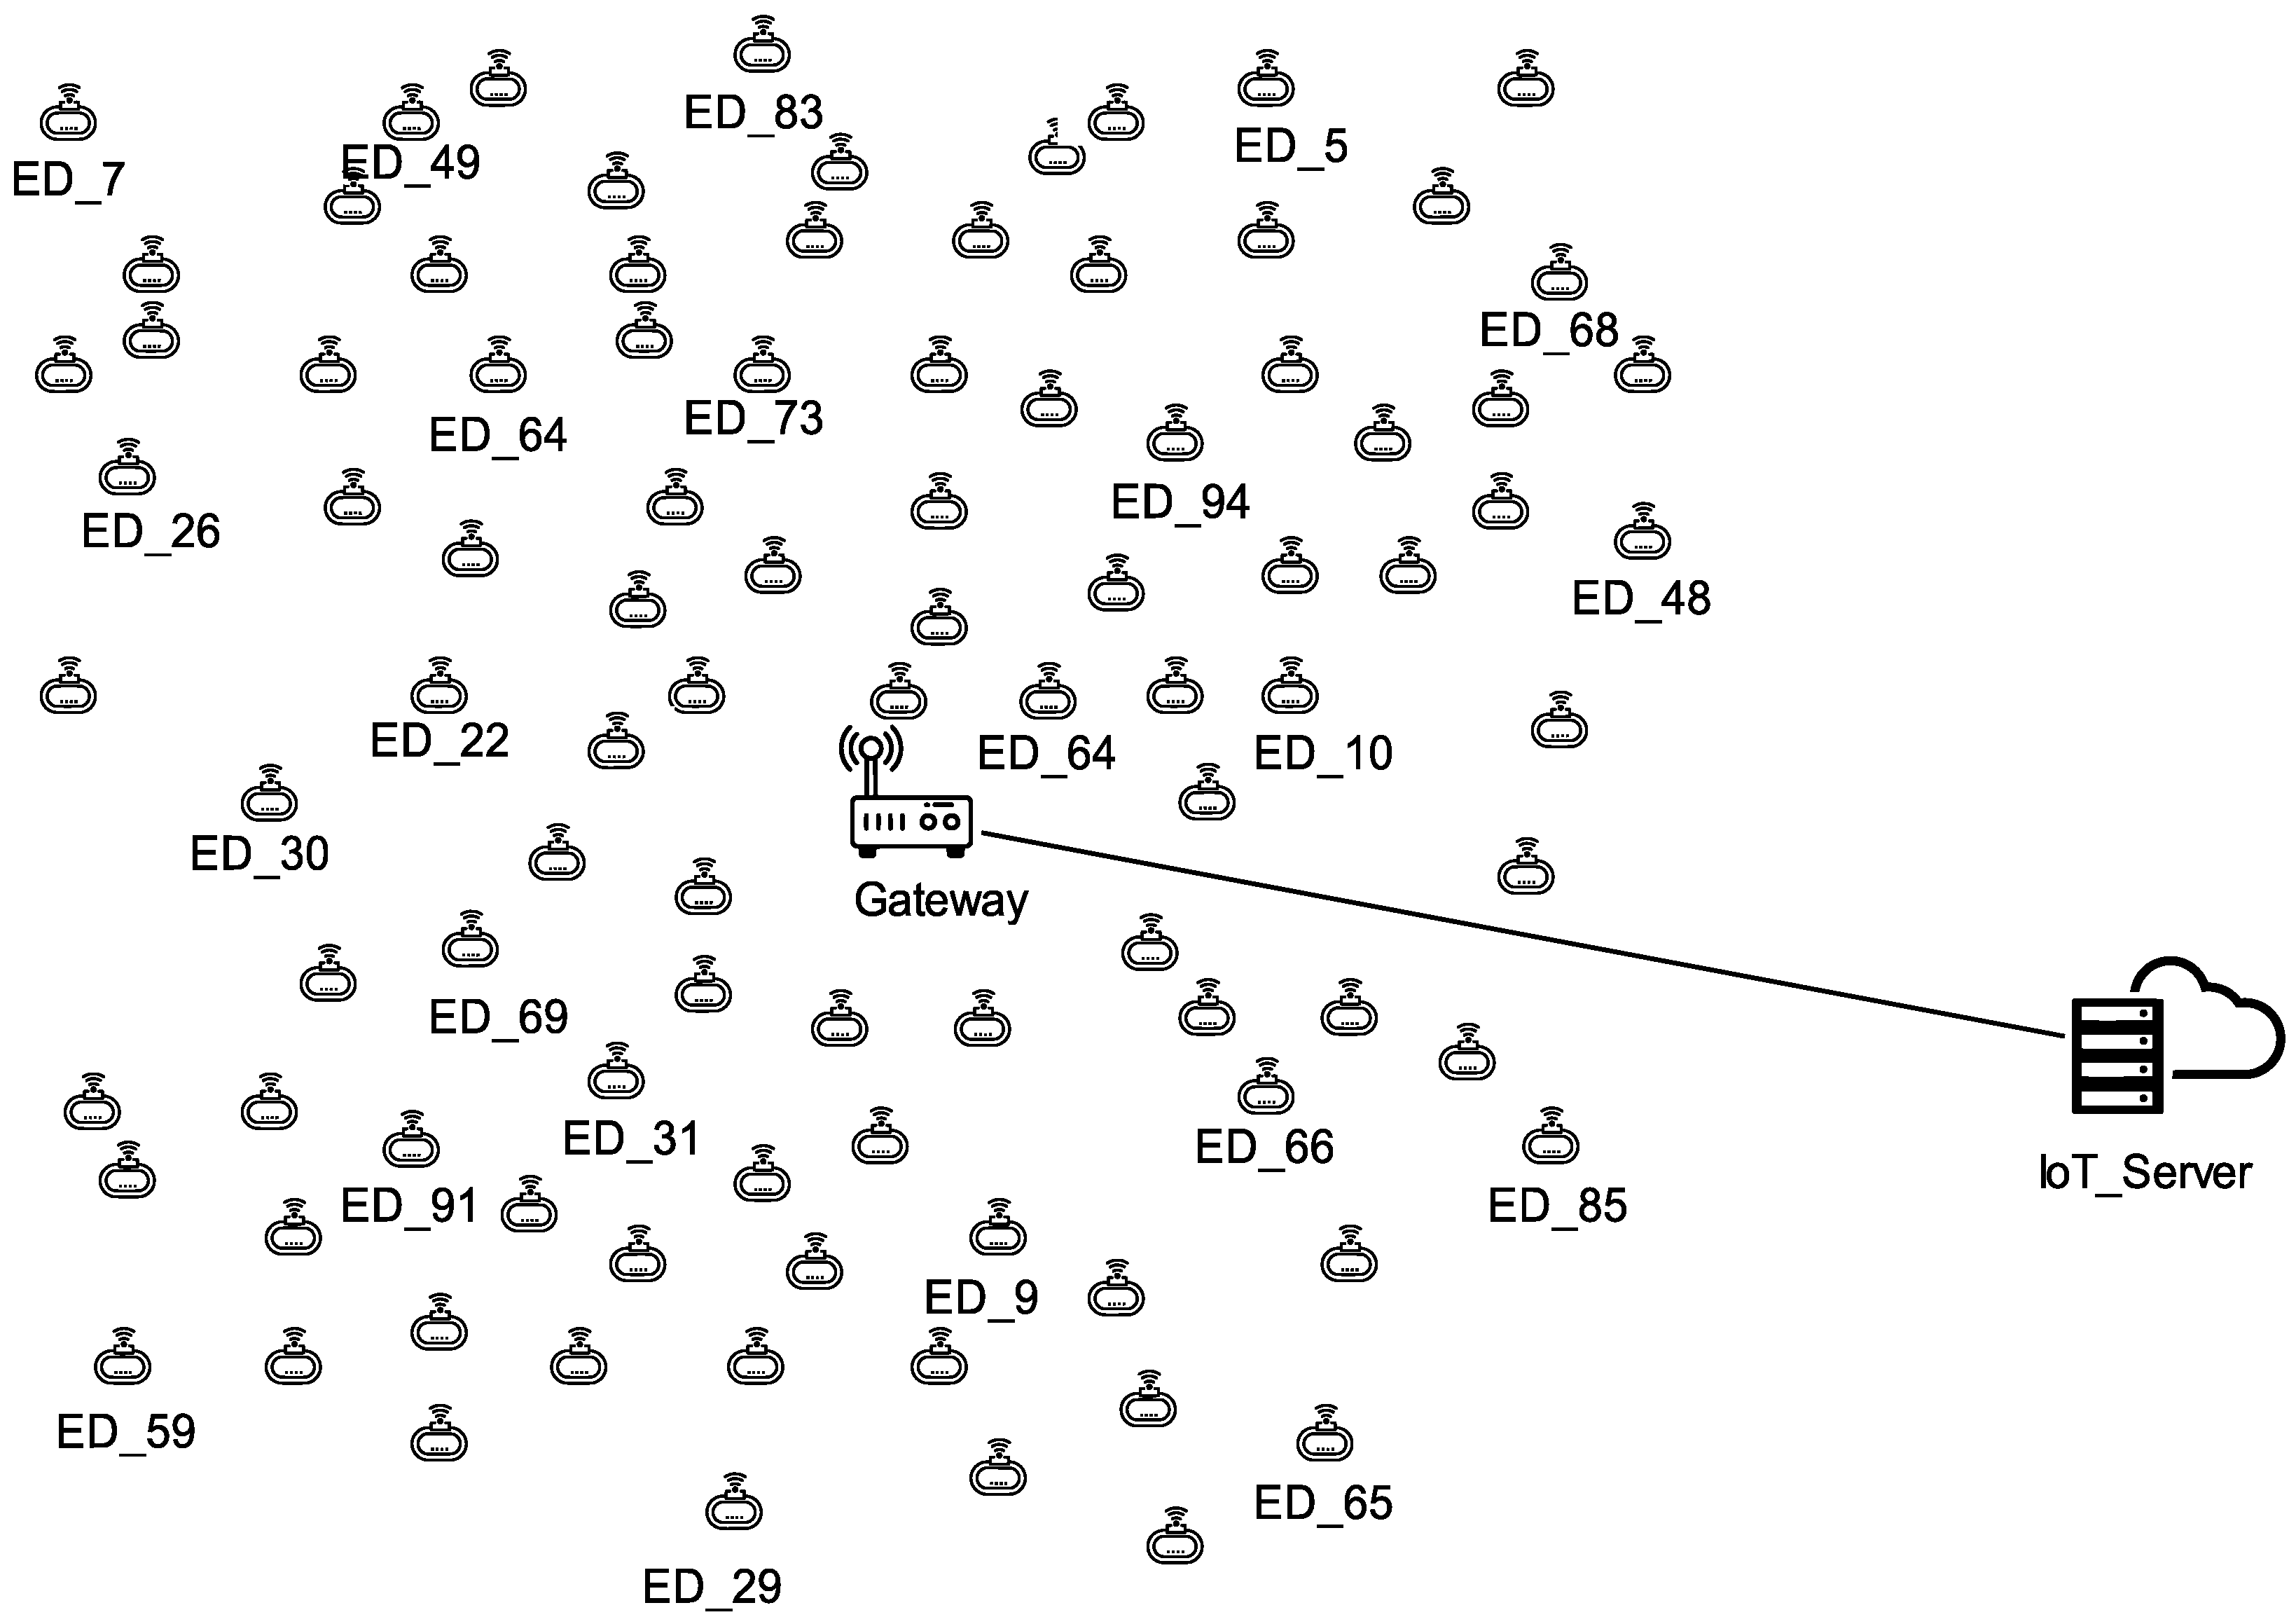
The network is partitioned into K regions wherein K represents the number of available spreading factors. The simulations are conducted using an ns-3 simulator [49] using a LoRaWAN module developed by [50]. The simulation is carried out with a fixed number of EDs and it is assumed that their number does not change during the simulation. Figure 2 shows a NetAnim output of the LoRaWAN network scenario implementing 100 EDs. The simulation settings are presented in Table 3. A four-state energy consumption model is assumed, comprising the transmit, idle, receive, and sleep states. Table 4 shows how the energy model links the voltage and current usage to each state. To compute network energy usage, we track each node’s energy usage during simulation. Semtech produced these parameters for the SX1272 LoRa transceiver used in this work for transmit power 10 dBm [51]. These parameters are employed in conjunction with Table 1. The model estimates ED battery life and energy consumption. Total energy consumption for each ED is given by:
where is the energy consumed when the ED is transmitting a packet, is the energy consumed when the ED is receiving an incoming packet, is the energy consumed when listening for incoming packets, and is the energy consumed when the ED is in sleep mode.
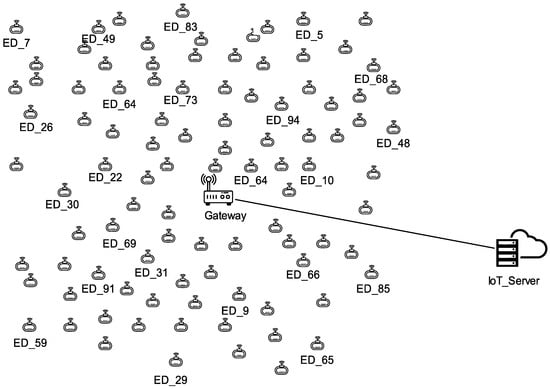
Figure 2.
The LoRaWAN network scenario.
Table 3.
Simulation parameters.
Table 4.
Energy model parameters.
5. The Proposed Adaptive Data Rate Model
In this section, we propose an adaptive data rate algorithm named the SNR-based Spreading Factor Interference Rate-controlled Adaptive Data Rate Algorithm (SSFIR-ADR). The proposed algorithm aims to decrease energy utilisation whilst preserving a high packet delivery ratio by mitigating interference. This algorithm achieves this by dynamically controlling the allocation of spreading factors to minimise the prospect of simultaneous transmissions with the same spreading factor in a particular annulus region within the network. To facilitate this, the network is divided into K radial regions according to the available SF regions, . By varying the SF values based on the defined framework, the data rate is optimised.
SSFIR-ADR is divided into two variants, SSFIR-ADR1 and SSFIR-ADR2. The key goal of the proposed algorithm is to utilise two spreading factors in a specific annulus region centred on the historical signal-to-noise ratio of the individual end nodes, thereby reducing interference within that region. The SSFIR-ADR algorithm uses several global variables in determining the optimal SF allocation as defined in Algorithm 1.
- The SNR values of the four most recently received data packets are stored in the ReceivedPacketList.
- The average SNR values for each ED are computed and stored in a list, , updated every time an ED transmits a packet to the network server.
- The required SNR threshold values are stored in a list called , as presented in Table 1.
- An SF list that correlates to the values stored in the list is stored in SFvalue.
- The Usageindex keeps track of the list of EDs within each SF region K which the algorithm uses to determine which EDs should have their SFs optimised.
- Dmargin stores the value of the device margin. is the probability that will control the decrease in SF at region K and will provide a number from 0 to 1.
- SF represents a vector with the probability of EDs the algorithm randomly selects for optimisation for each K region.
- The optimised spreading factor is labelled . Once sufficient data are collected, this variable will store the new SF value computed by the algorithm.
The algorithm operates as follows: Considering each SF region K, except , a subset of nodes within the same radial ring region K (i.e., EDs utilising the same spreading factor) is selected for transitioning to the adjacent lower SF region. Each ED is assigned the lowest SF possible such that the power received from the ED is higher than the required sensitivity threshold. SSFIR-ADR1 selects EDs that are in K with the minimum value of and reduces the spreading factor by one. On the other hand, SSFIR-ADR2 employs a stochastic approach to randomly select a subset of end devices from the Usageindex, with a specific probability assigned for optimising their spreading factor. This subset of EDs then transitions to a new SF denoted . In our implementation for this work, we utilised a constant value of SF across all spreading factor regions. However, it is possible to set individual probability values for each of the SF levels based on the network size and node deployment considering the application needs.
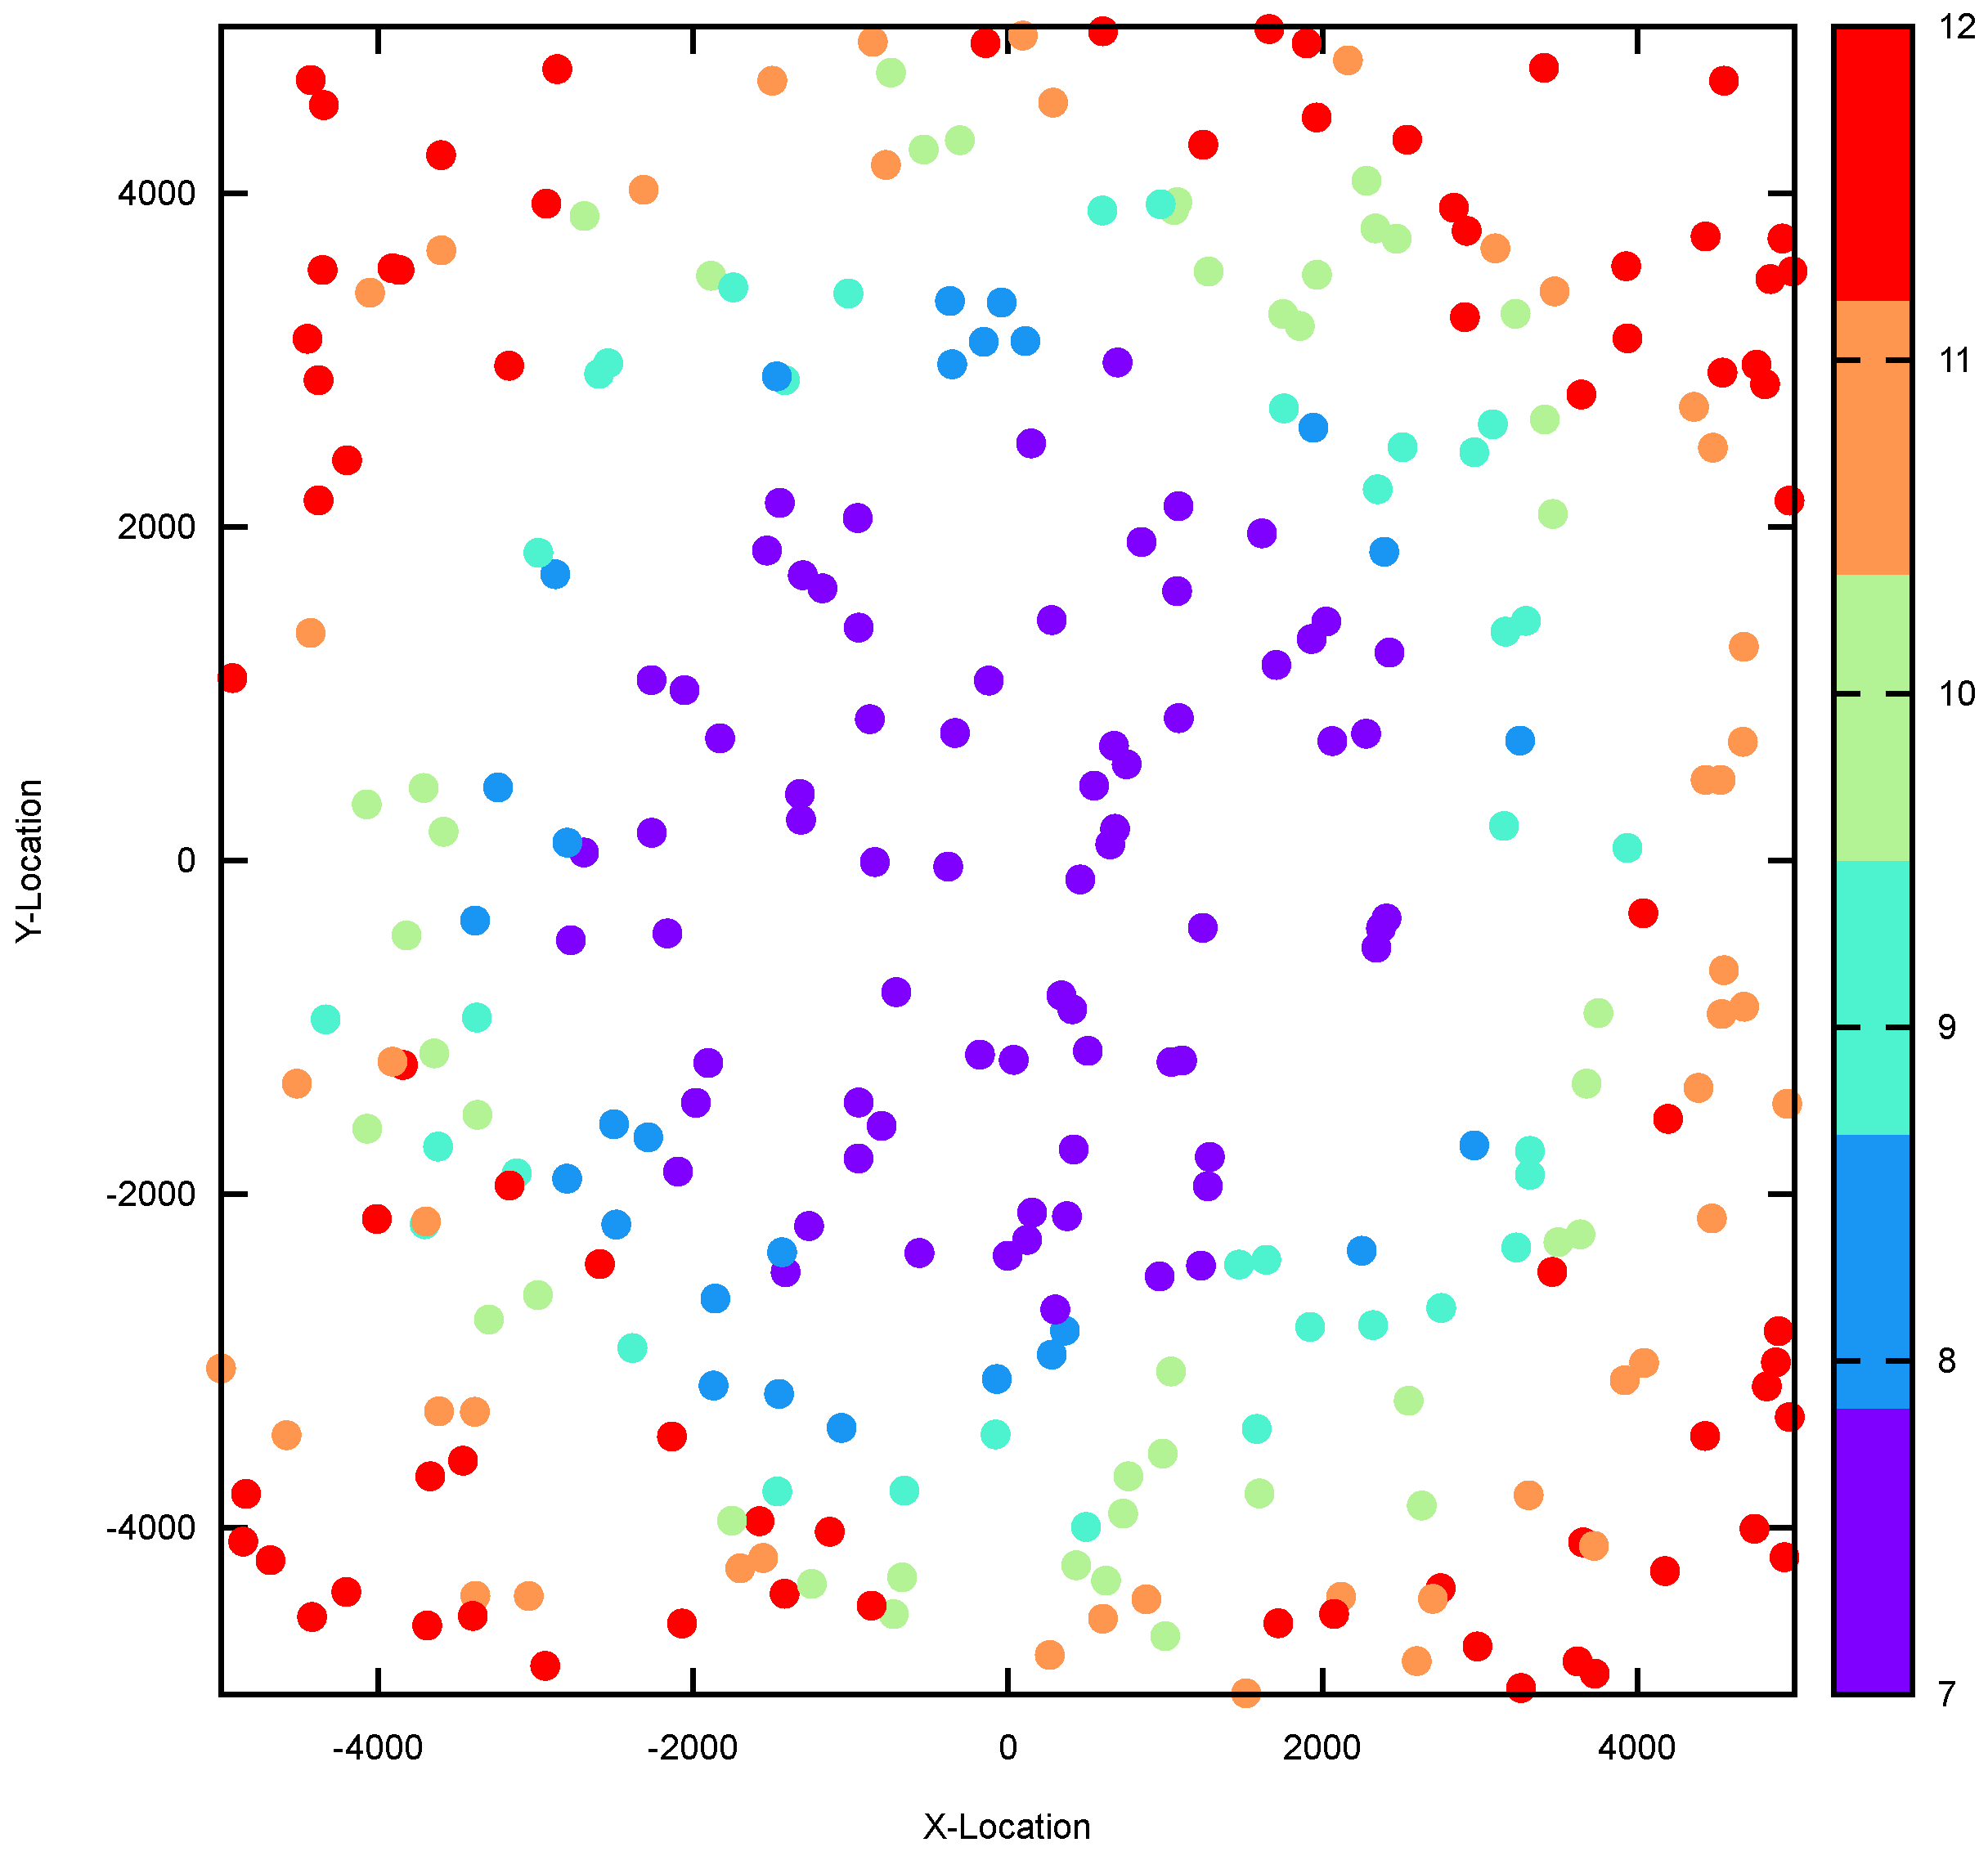
The network topology with 300 EDs and its corresponding SF distribution is visualised in Figure 3, showcasing the differentiated SF allocations achieved by Algorithm 1. By incorporating these techniques, the proposed SSFIR-ADR algorithm demonstrates its ability to effectively reduce energy consumption and mitigate interference while maintaining satisfactory packet delivery performance in LoRaWAN networks.

Figure 3.
The SF Map−Algorithm SSFIR-ADR2.
| Algorithm 1 The Proposed SNR-based SF Collision and Interference Reduced ADR Model |
|
6. Results and Discussion
An evaluation of the proposed algorithm is presented in this section based on the results derived from the simulations. The performance analysis of the LoRaWAN network primarily focuses on four key metrics: confirmed packet success rate (CPSR), uplink packet delivery ratio (UL-PDR), total energy consumption (ET), and interference ratio (IR). To benchmark our proposed ADR implementation, we differentiate it against the standard ADR protocol, the ns3-ADR protocol implemented in the ns-3 LoRaWAN module, and the fuzzy logic-based ADR scheme known as FL-ADR [42]. In the first evaluation scenario, we vary the application data packet rate while keeping the number of end devices constant at 100. In the second evaluation scenario, we vary the number of EDs while maintaining a constant application data packet rate of 600 s. The main findings of our study indicate that our proposed ADR model surpasses the standard ADR and ns3-ADR algorithms in relation to the packet delivery ratio, while also demonstrating a reduced interference rate and energy consumption. However, it is essential to note that the FL-ADR scheme surpasses our developed framework in relation to energy utilisation and interference rate reduction, although it lags behind in achieving higher PDR.
6.1. Total Energy Consumption
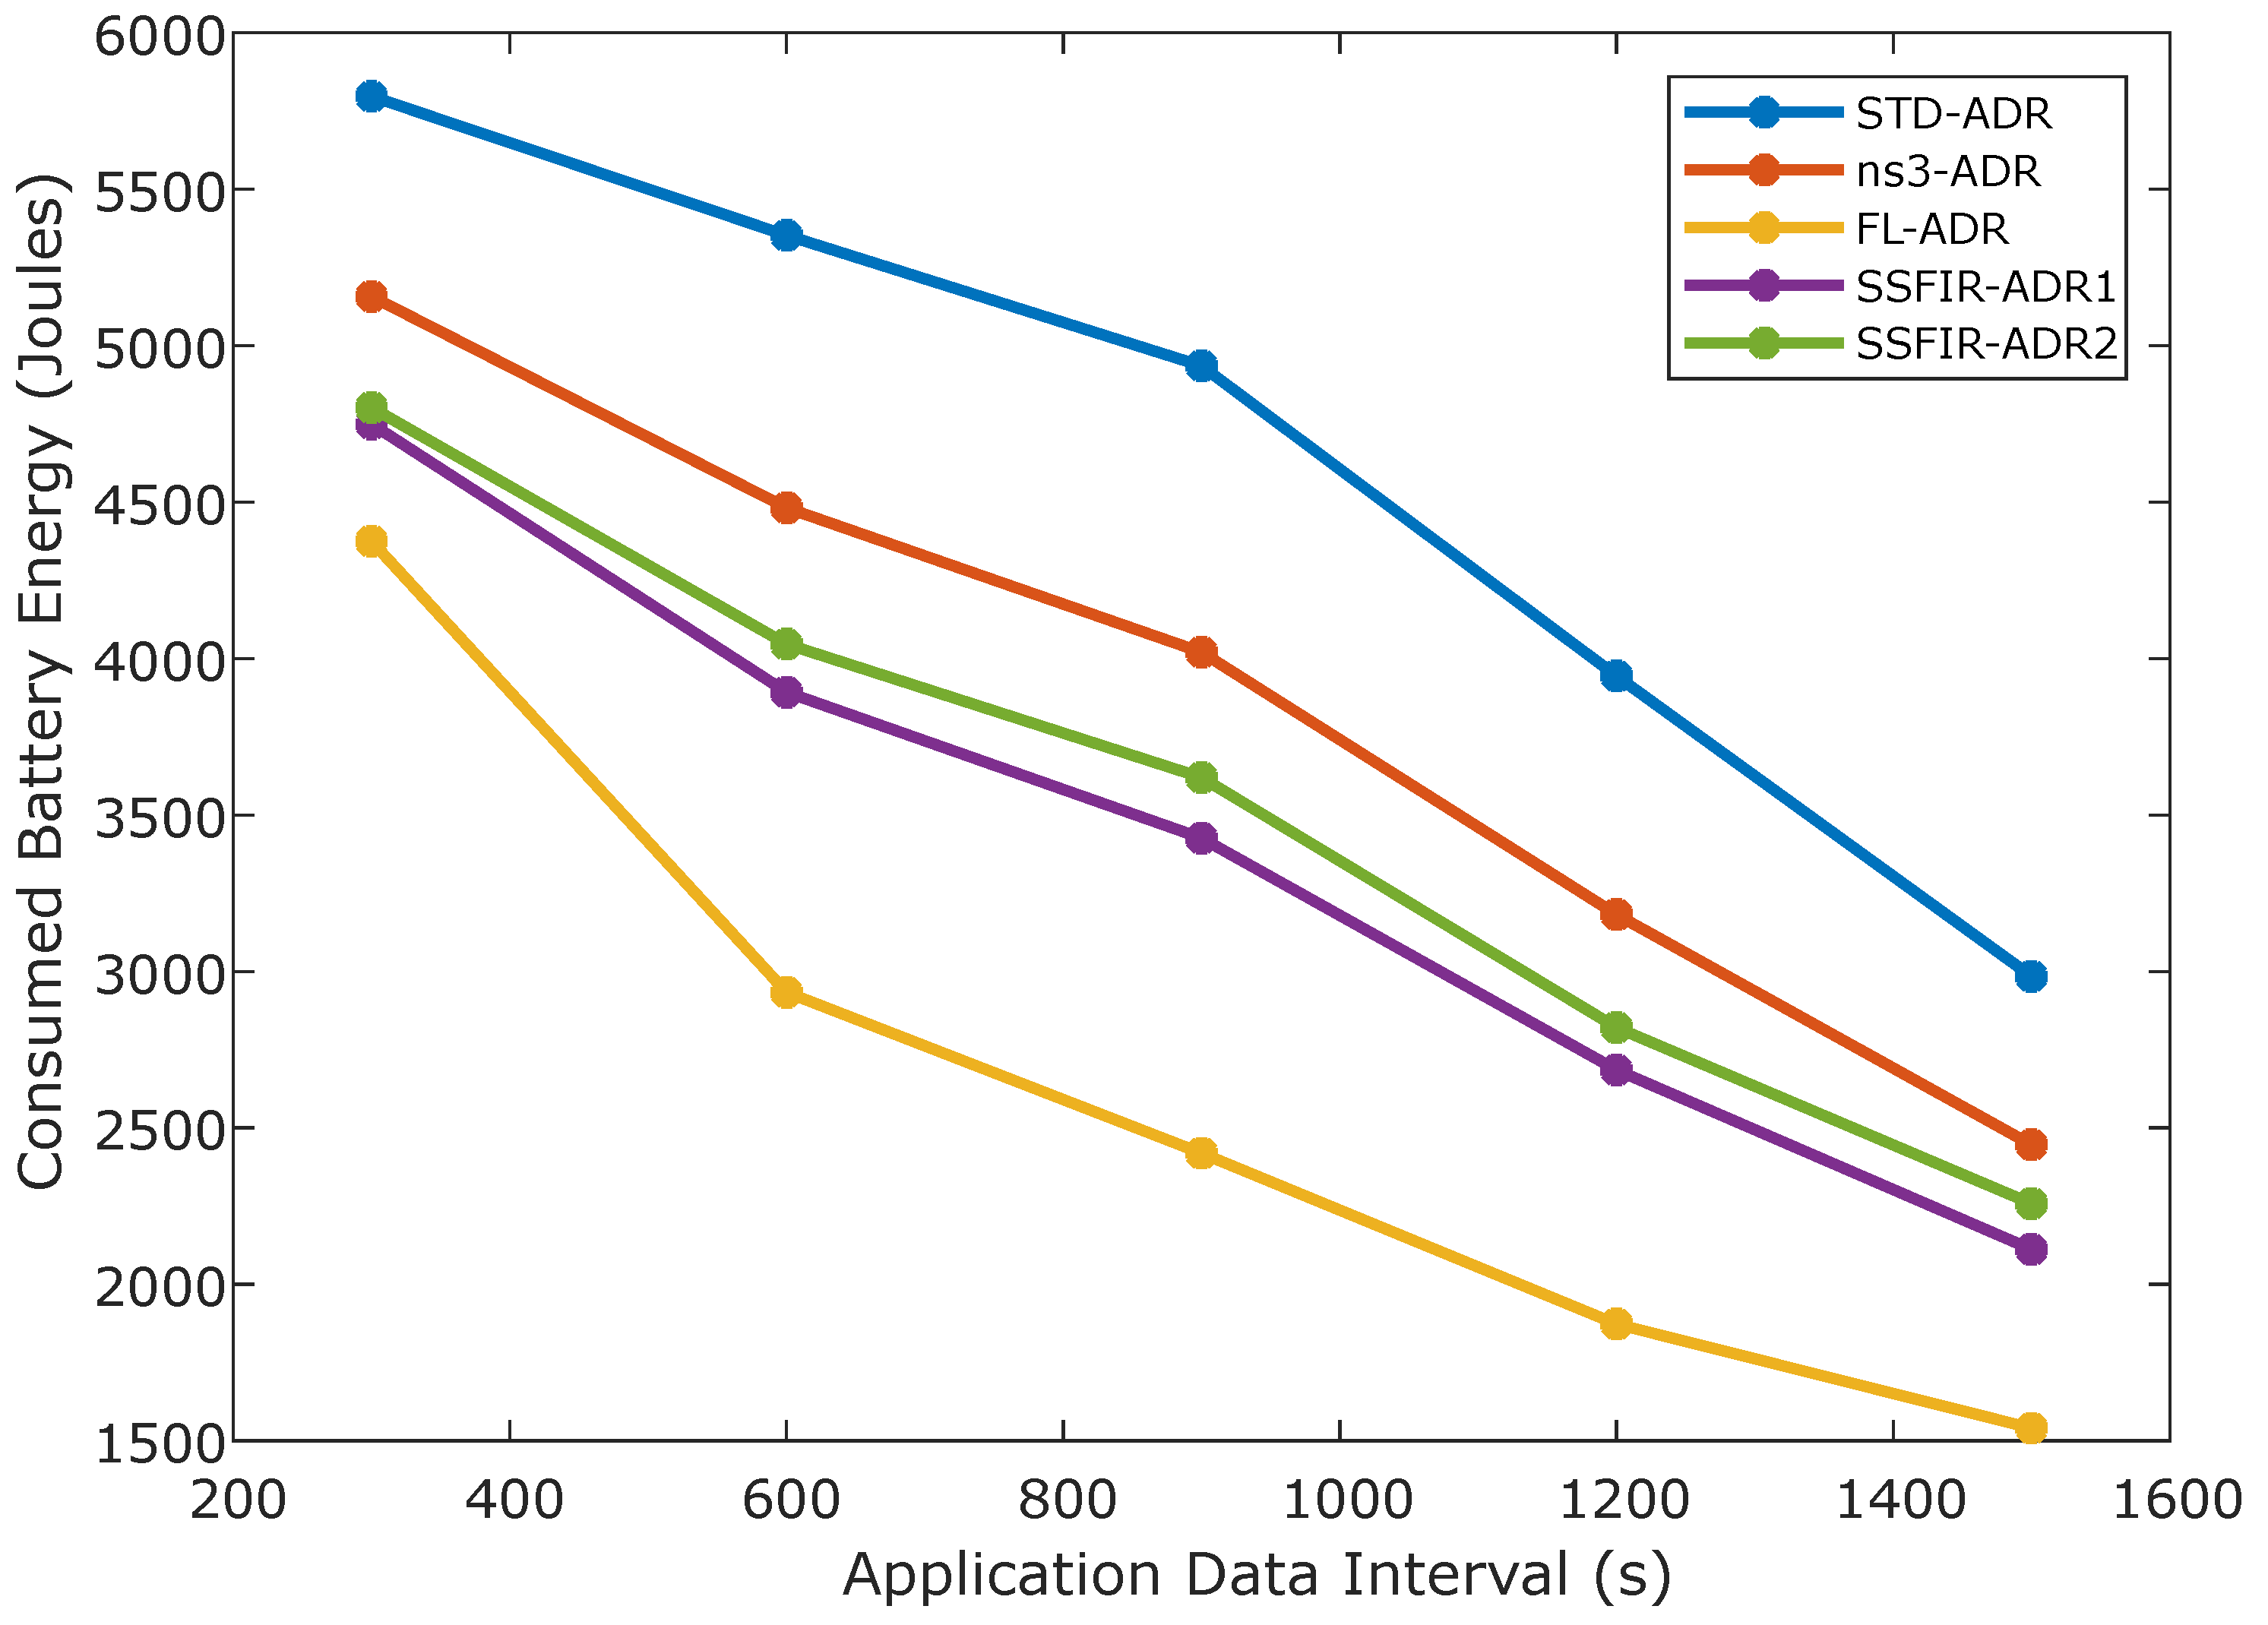
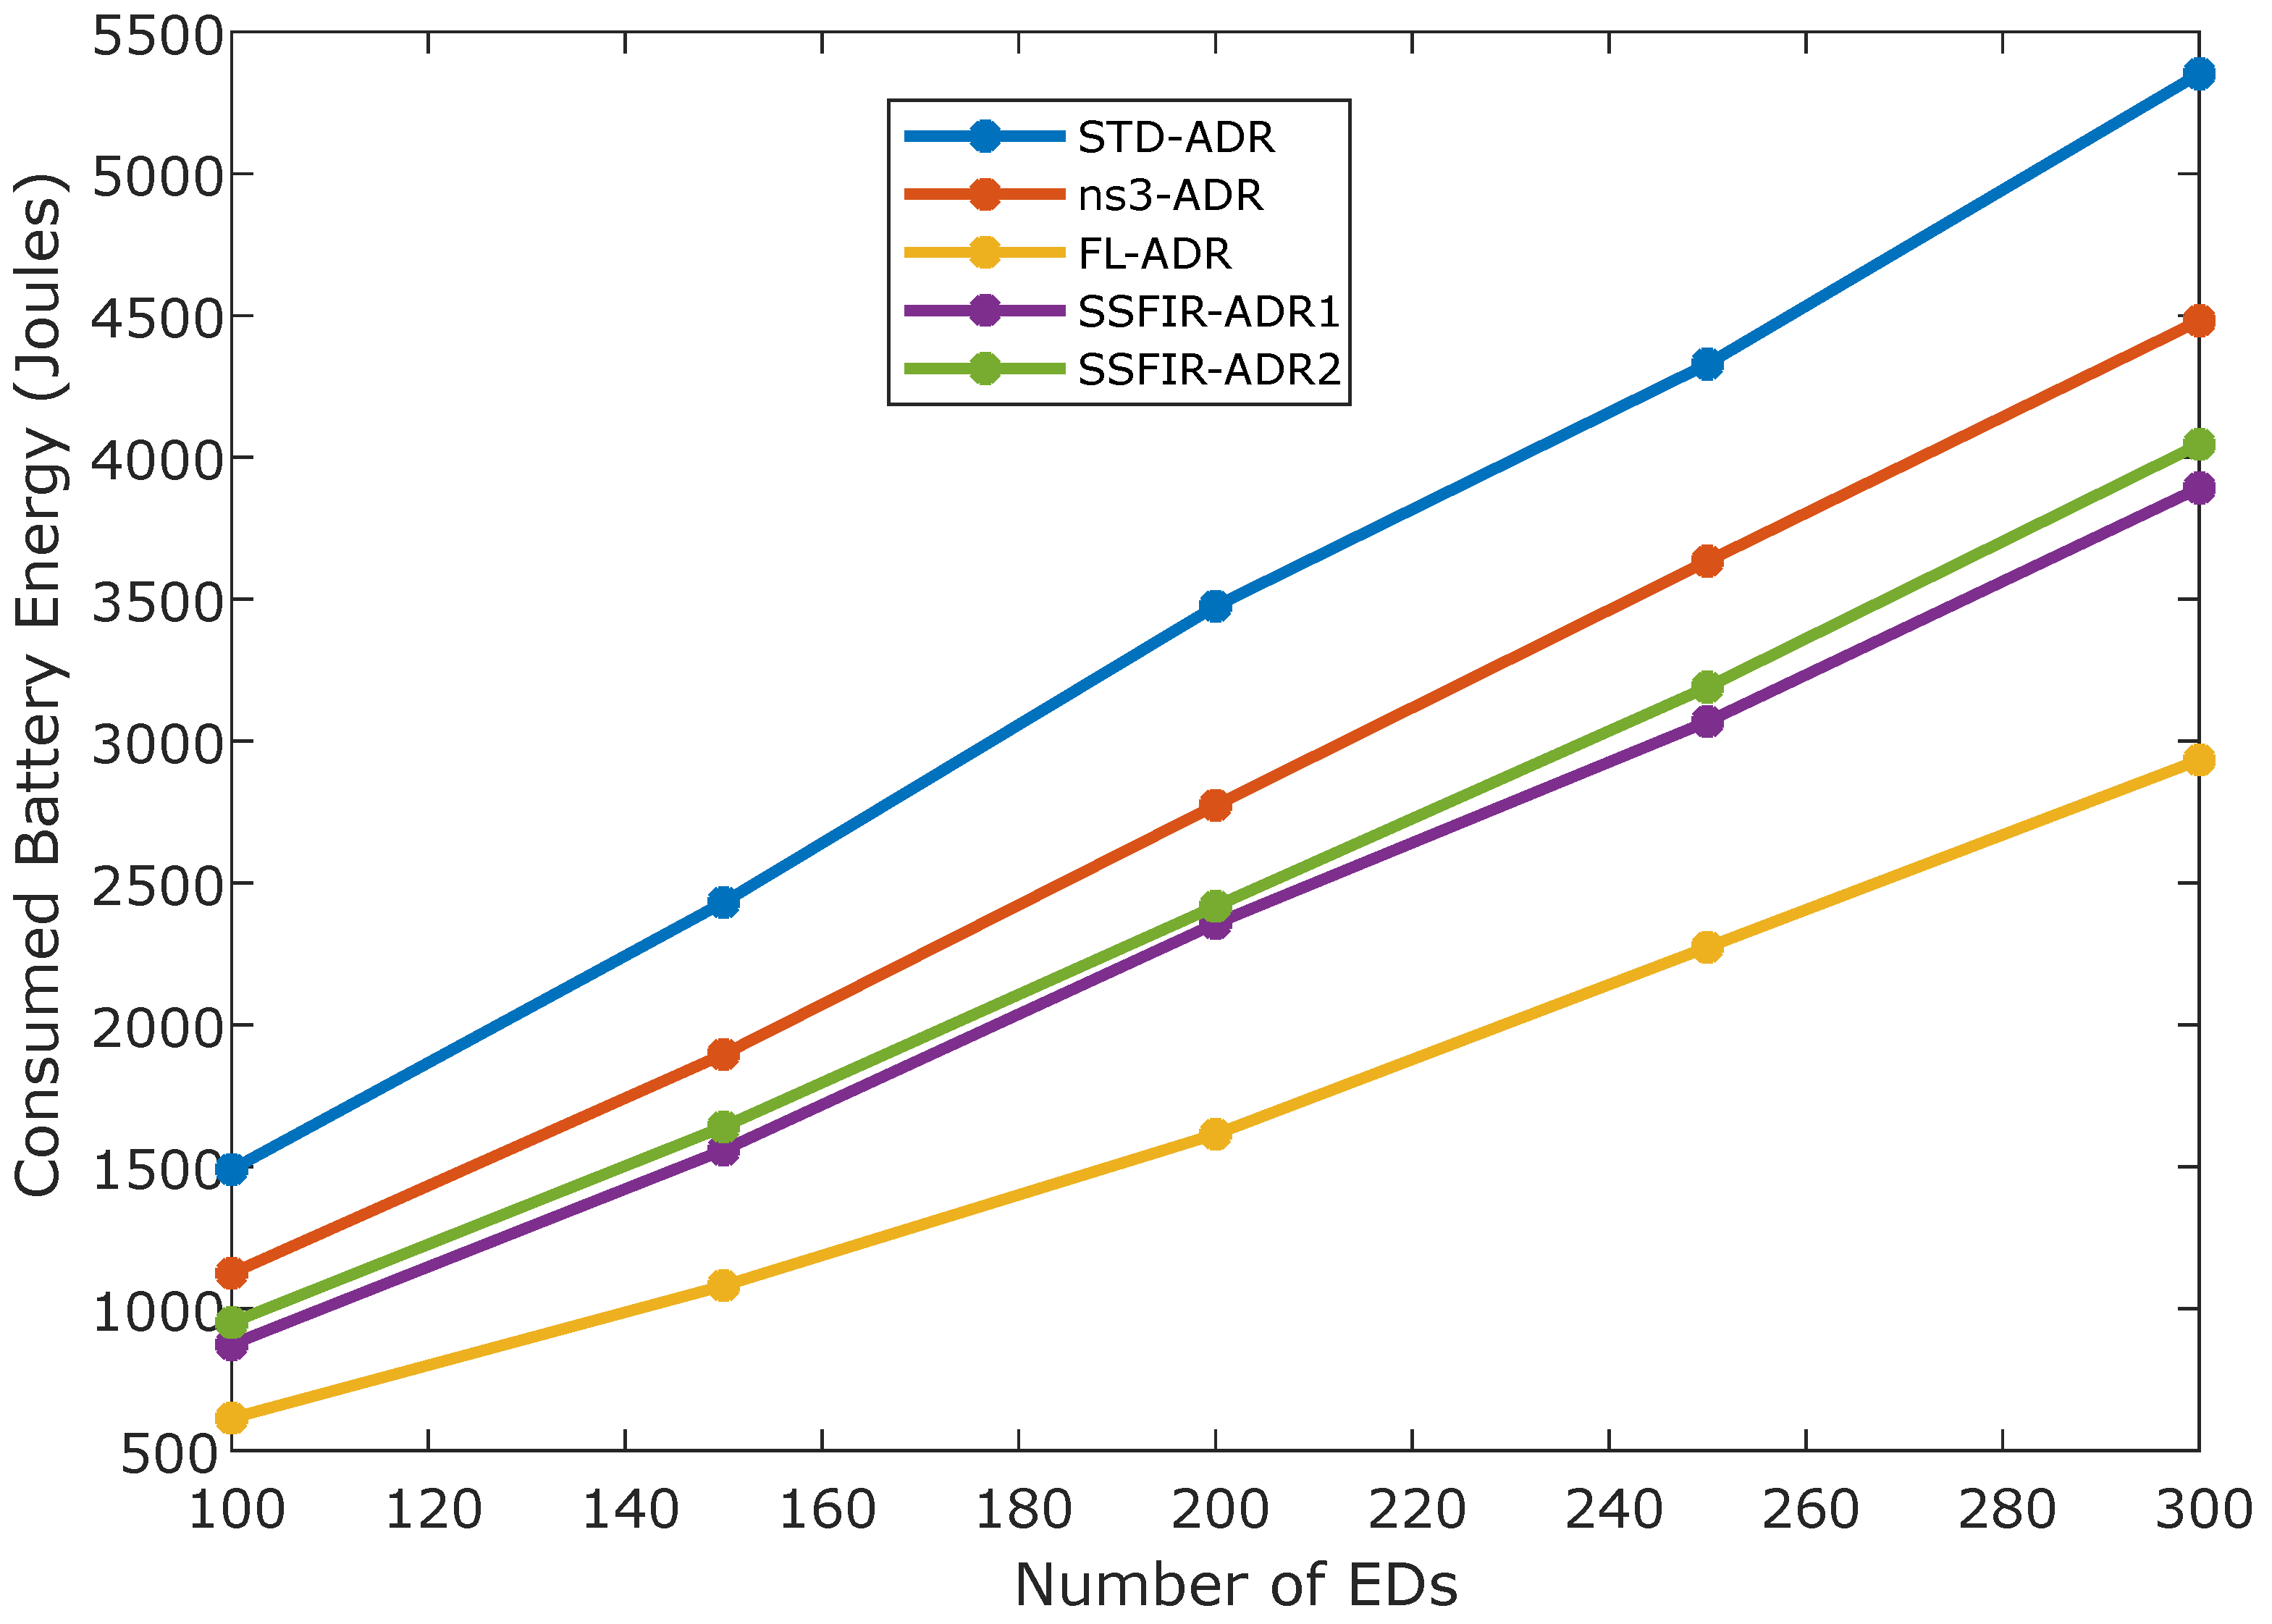
The proposed SSFIR-ADR model exhibits a notable decrease in the global energy utilisation of the network, as illustrated in Figure 4 when considering different application data intervals, and Figure 5 when examining various node densities. When comparing SSFIR-ADR1 and SSFIR-ADR2 against the standard ADR algorithm, both variants demonstrate average energy savings of 27% and 24%, respectively. It is vital to take note that the energy consumption of the ADR algorithm directly correlates with the network size, as depicted in Figure 5. Consequently, as the application data interval increases, the energy consumption decreases for a fixed number of end devices within the network. This improvement in energy efficiency can be attributed to the reduction in interference, leading to fewer collisions and subsequently fewer retransmissions. By minimising these disruptions, the proposed algorithm effectively conserves energy resources. As a result, the proposed SSFIR-ADR algorithm presents superior performance in comparison with the ns3-ADR protocol, although it is outperformed by the FL-ADR scheme in terms of saving energy.
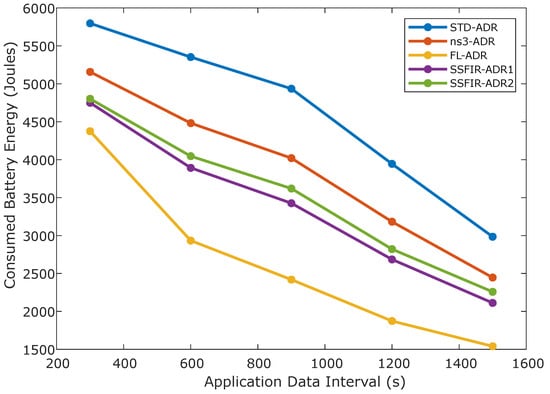
Figure 4.
Data interval vs. Total consumed energy.
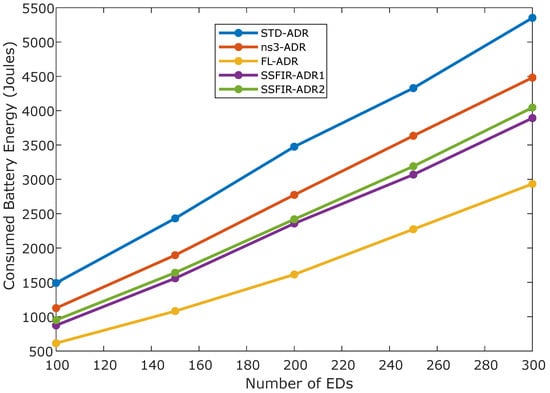
Figure 5.
Number of EDs vs. Total consumed energy.
6.2. Uplink Packet Delivery Ratio
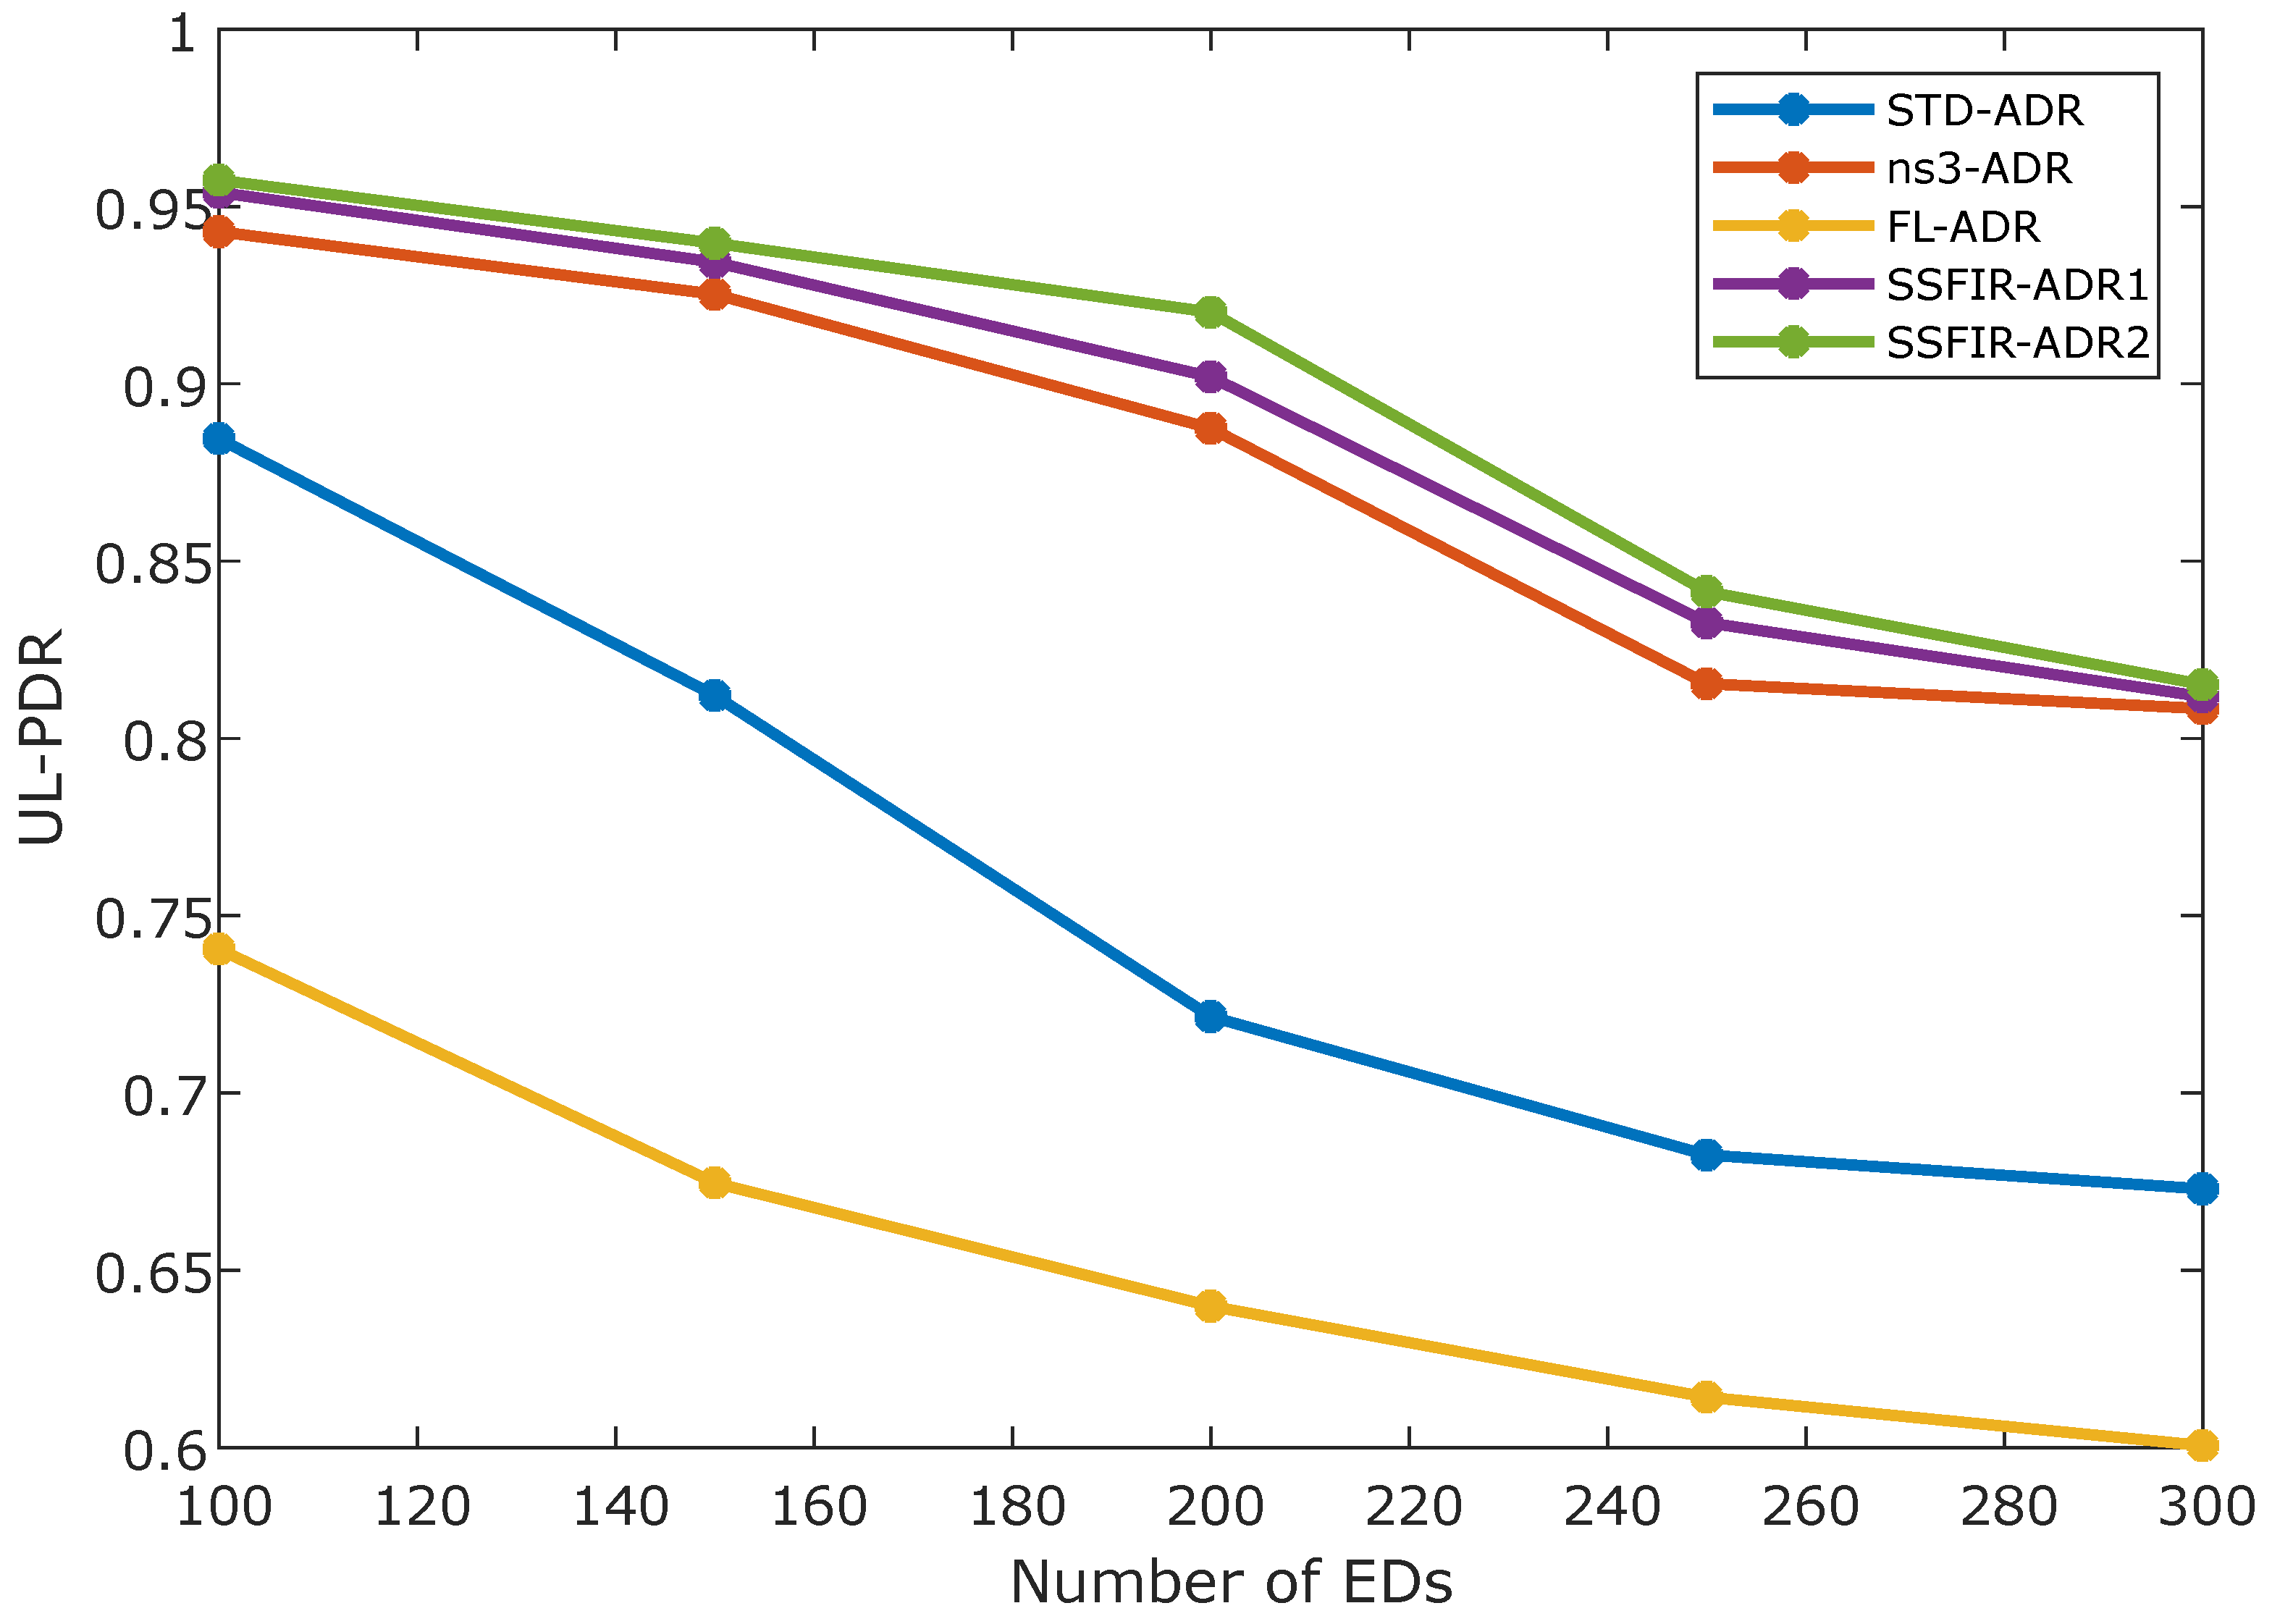
Figure 6 and Figure 7 illustrate how the proposed SSFIR-ADR1 and SSFIR-ADR2 algorithms perform in terms of the uplink packet delivery ratio. Both variants of SSFIR-ADR exhibit improved UL-PDR compared to other algorithms. The primary objective of the proposed ADR algorithm is to reduce energy utilisation while preserving a high packet delivery ratio by mitigating interference and optimising data rates for end devices. However, due to the limited transmission parameters that can be adjusted by ADR in LoRaWAN, complete elimination of collisions is not feasible. As network density increases, the potential number of interferers during each transmission also rises. In this scenario, the proposed ADR algorithm surpasses all the algorithms used for comparison, highlighting its effectiveness in reducing collisions. For instance, at a network density of 200 EDs and an application data interval of 600 s, the standard ADR algorithm achieves a PDR of 0.72, the ns3-ADR algorithm achieves 0.88, the FL-ADR scheme achieves 0.64, SSFIR-ADR1 achieves 0.90, and SSFIR-ADR2 achieves 0.92. These results indicate an approximate improvement of 18% and 20% in UL-PDR compared to the standard ADR algorithm for SSFIR-ADR1 and SSFIR-ADR2, respectively. While FL-ADR outperforms SSFIR-ADR with reference to energy consumption, it falls short in achieving a comparable packet delivery ratio. This result showcases the balance between energy consumption optimisation and PDR performance.
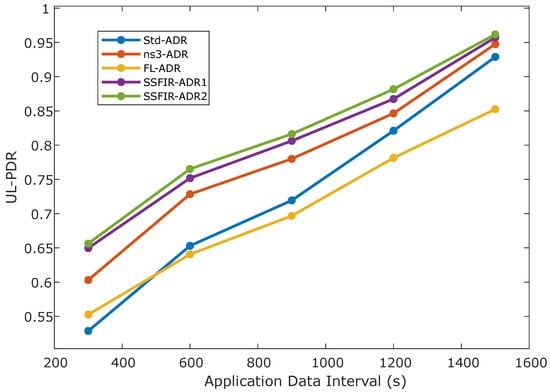
Figure 6.
Data interval vs. UL-PDR.
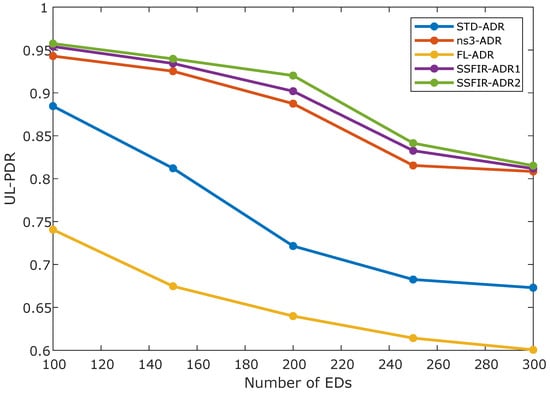
Figure 7.
Number of EDs vs. UL-PDR.
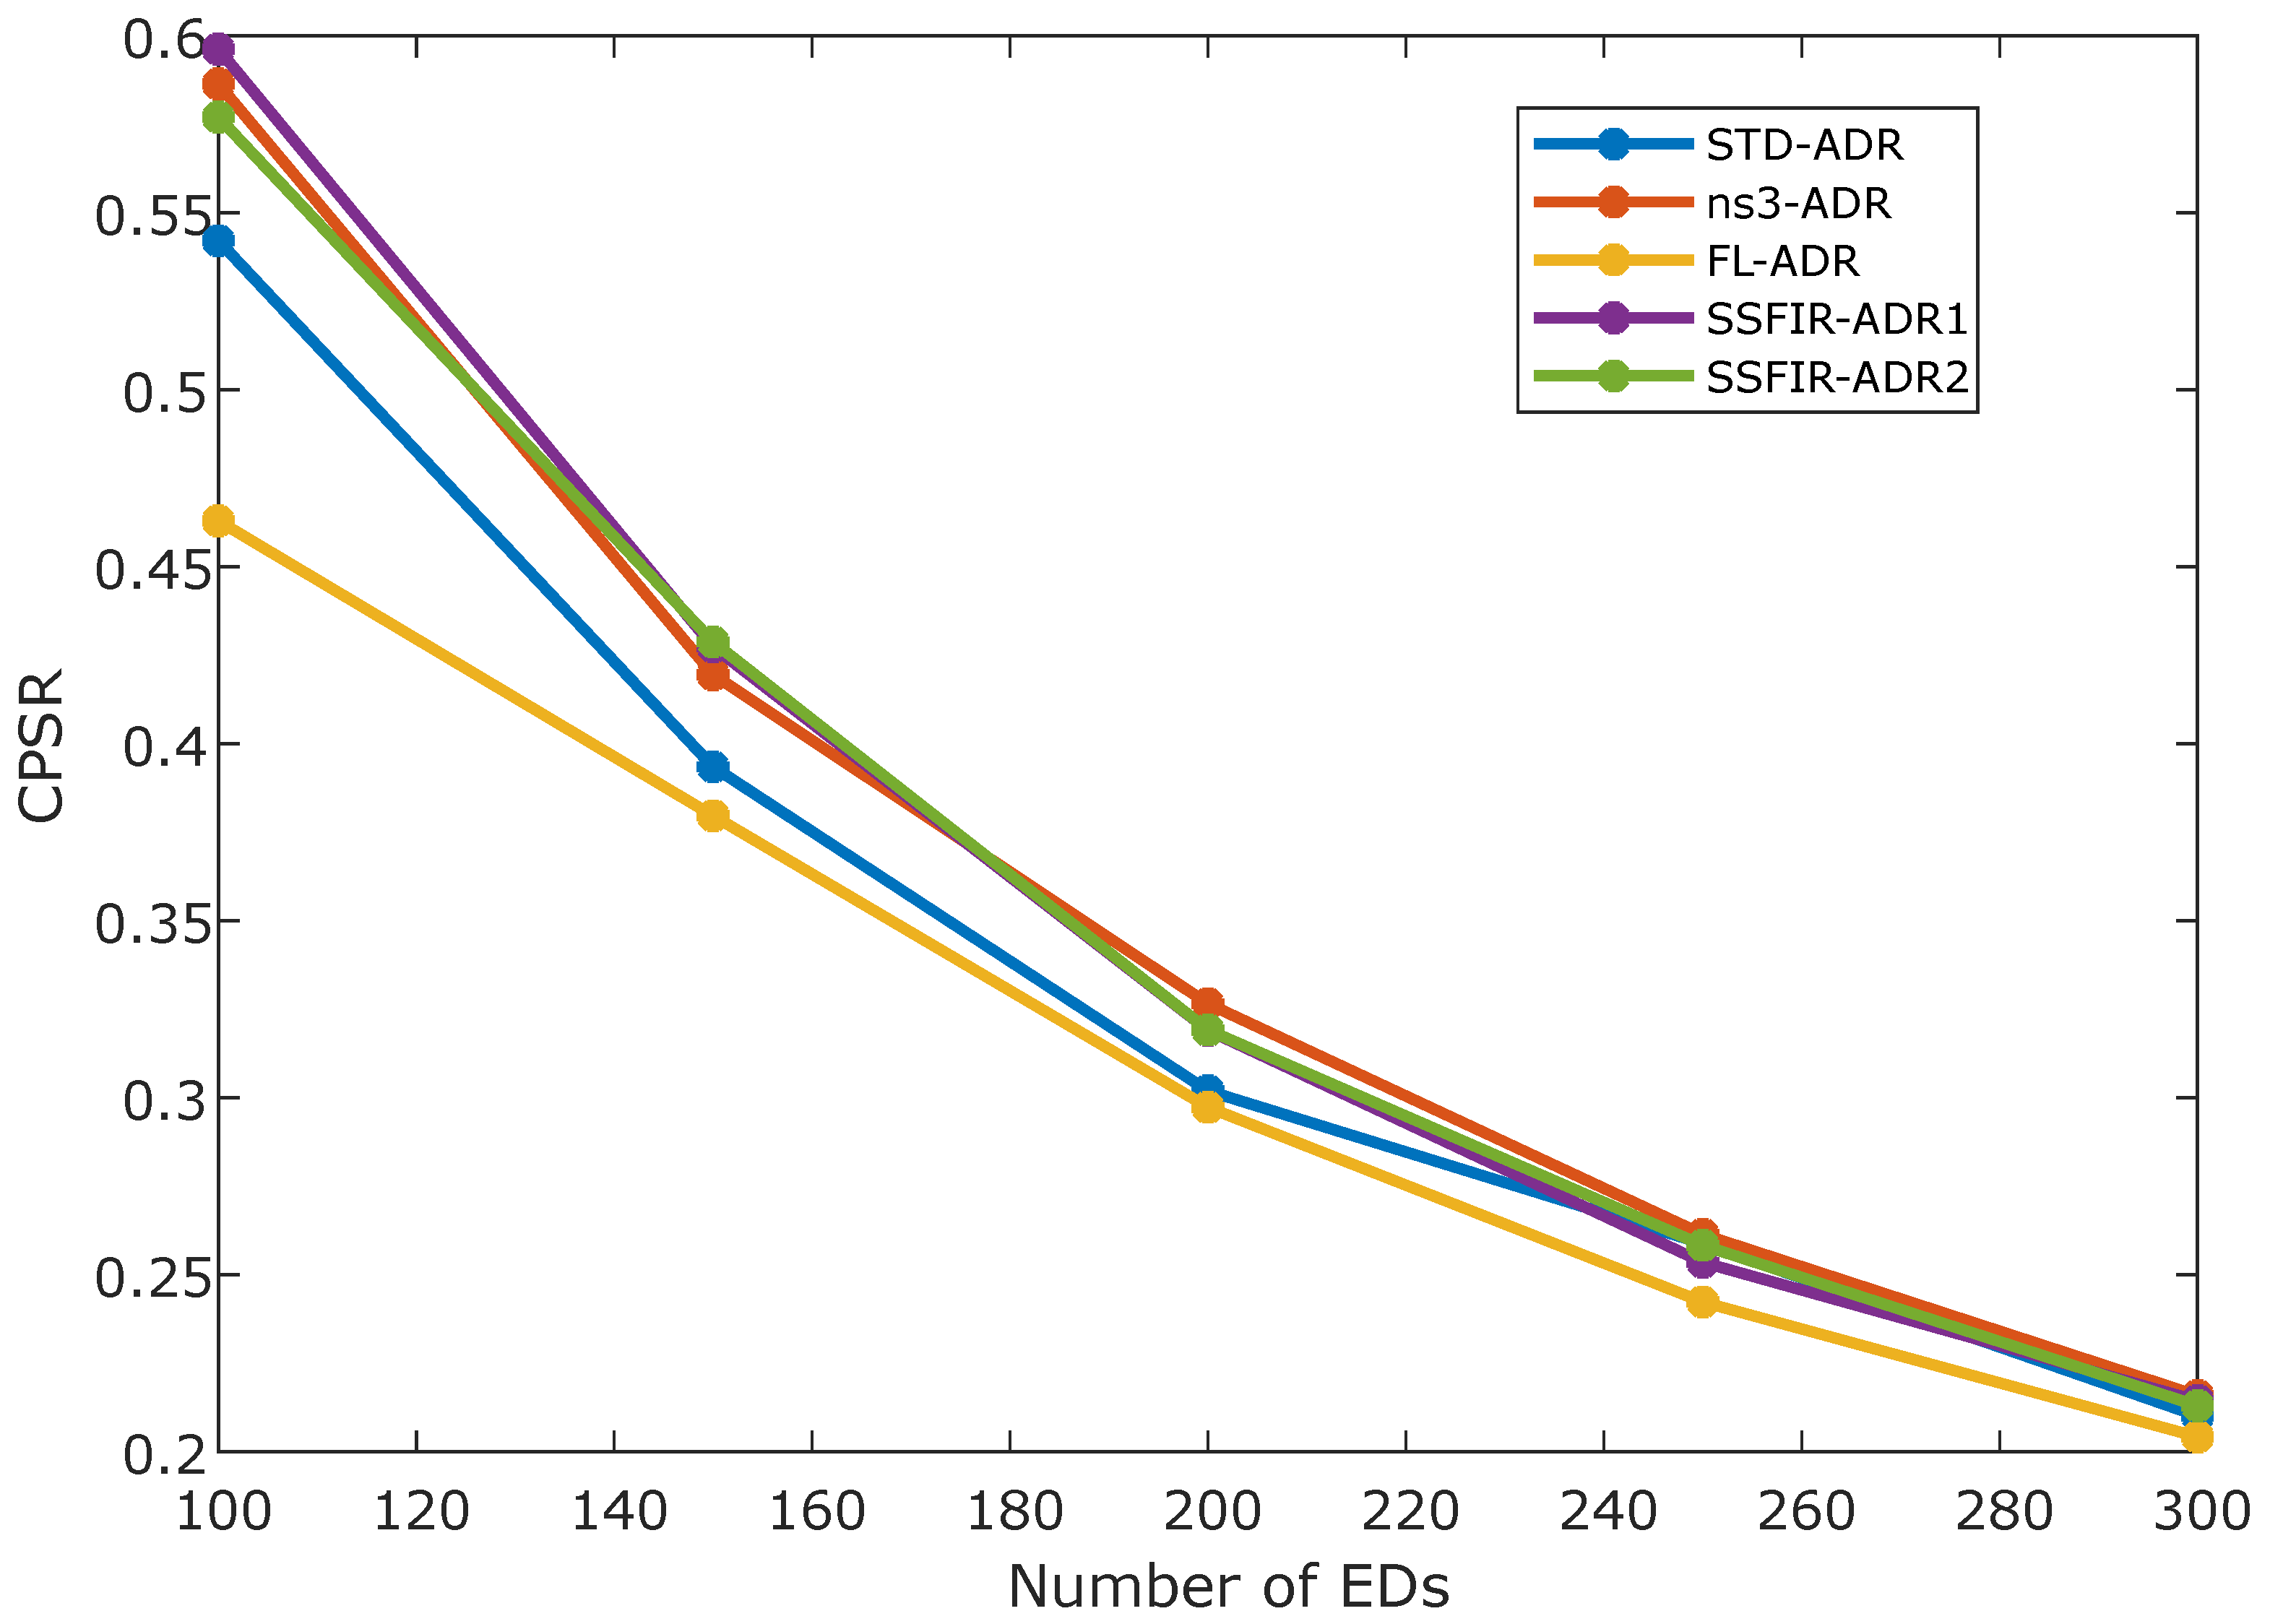
6.3. Confirmed Packet Success Rate
The confirmed packet success rate (CPSR) refers to the probability of successfully receiving both the uplink and downlink packets within the available transmission attempts. Figure 8 and Figure 9 depict the performance of the proposed SSFIR-ADR protocol in respect of CPSR. The SSFIR-ADR algorithm demonstrates lower energy consumption in relation to the standard ADR algorithm while maintaining comparable or slightly improved CPSR. This is evidenced by the results presented in Figure 8 and Figure 9. The reduction in interference achieved by SSFIR-ADR contributes to energy savings without compromising CPSR. It should be noted that as the node density increases, CPSR tends to decrease. Conversely, CPSR increases with longer application data intervals. These trends are observed due to the higher likelihood of interference and collisions in denser networks, as well as the potential for more retransmissions with shorter data intervals. While using confirmed traffic ensures a higher level of QoS by guaranteeing accurate data reception and processing, it comes with the drawback of consuming additional airtime, limiting the number of downlinks that can be transmitted. This limitation is especially relevant when utilising a single gateway in the network. In cases where the application can accommodate unconfirmed traffic, it is advisable to opt for that approach to maximise network capacity.
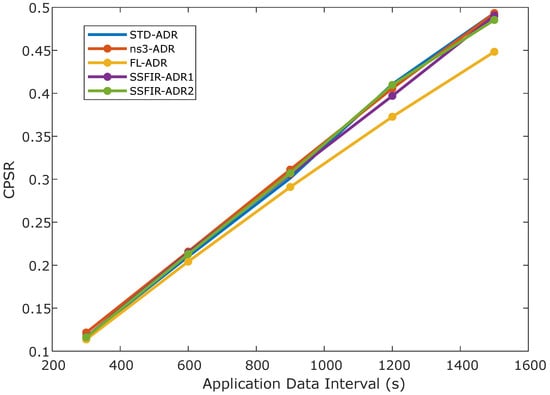
Figure 8.
Data interval vs. CPSR.
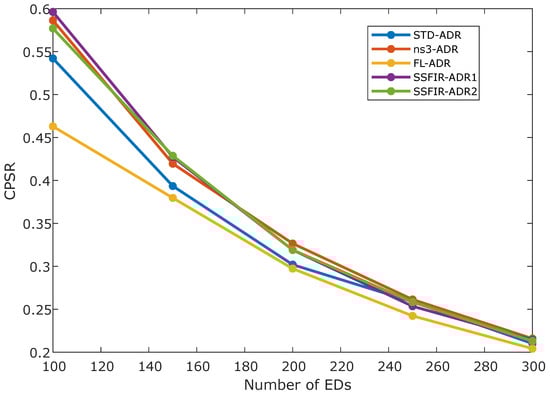
Figure 9.
Number of EDs vs. CPSR.
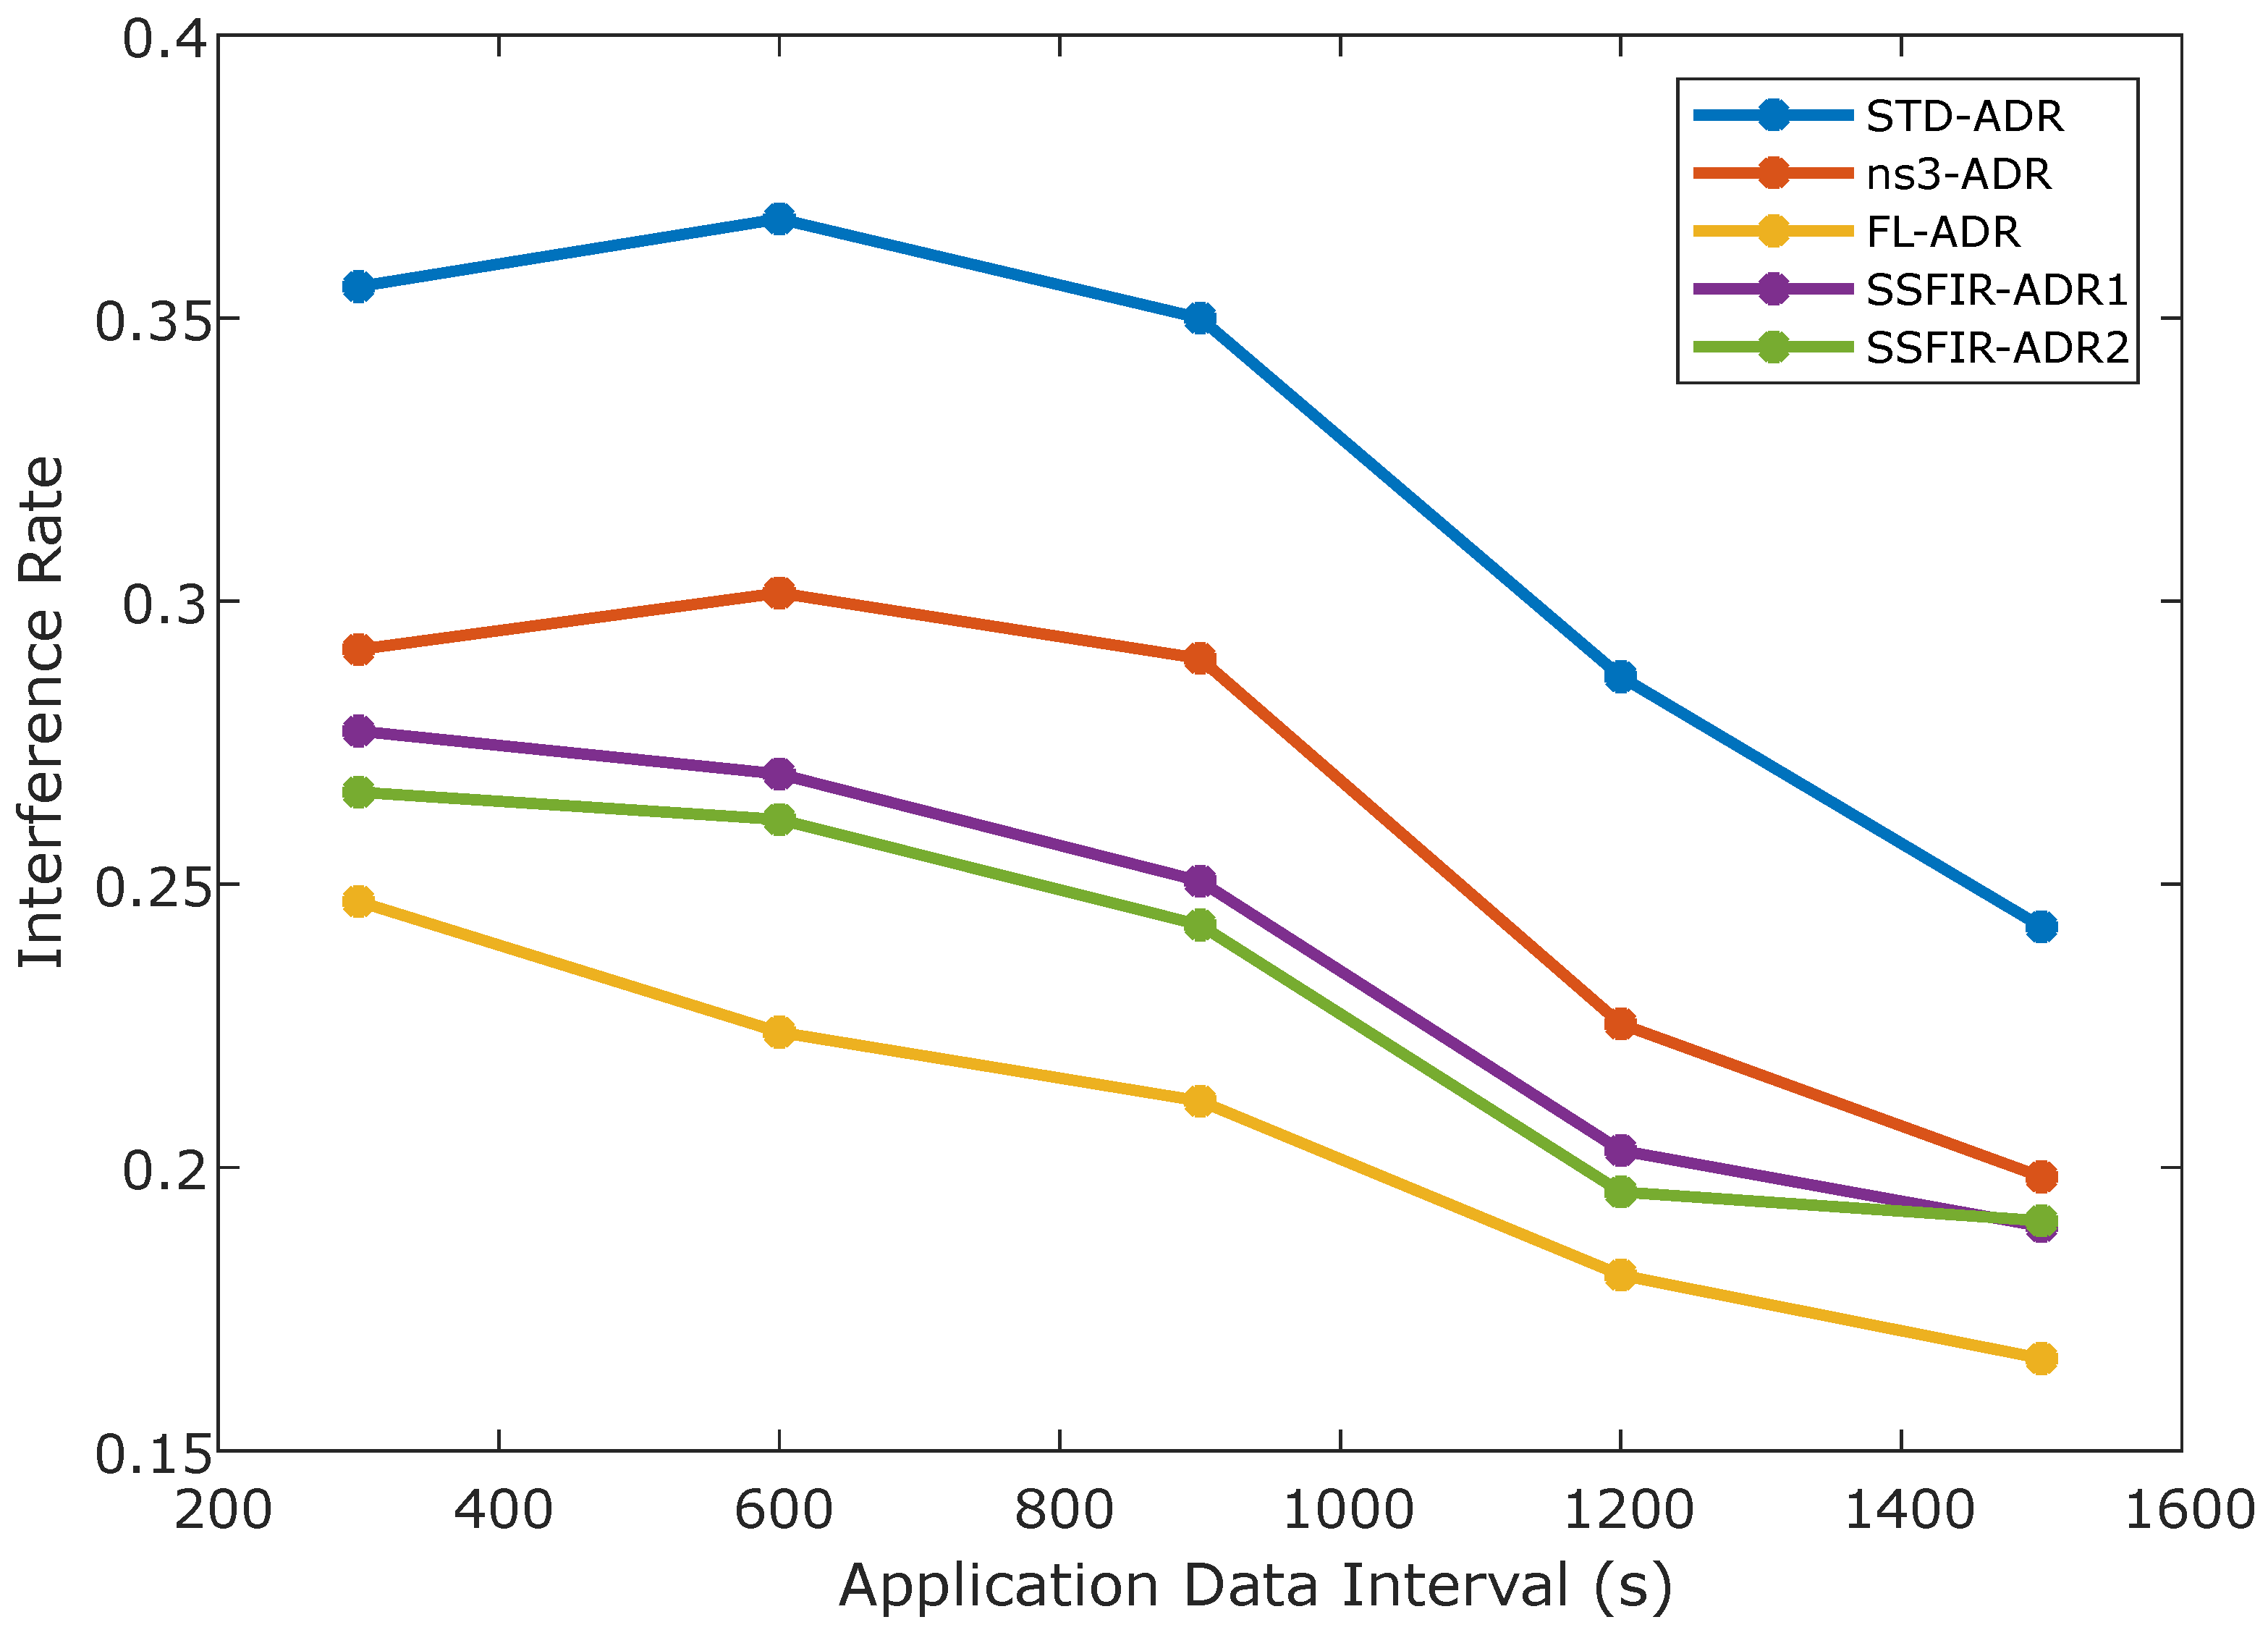
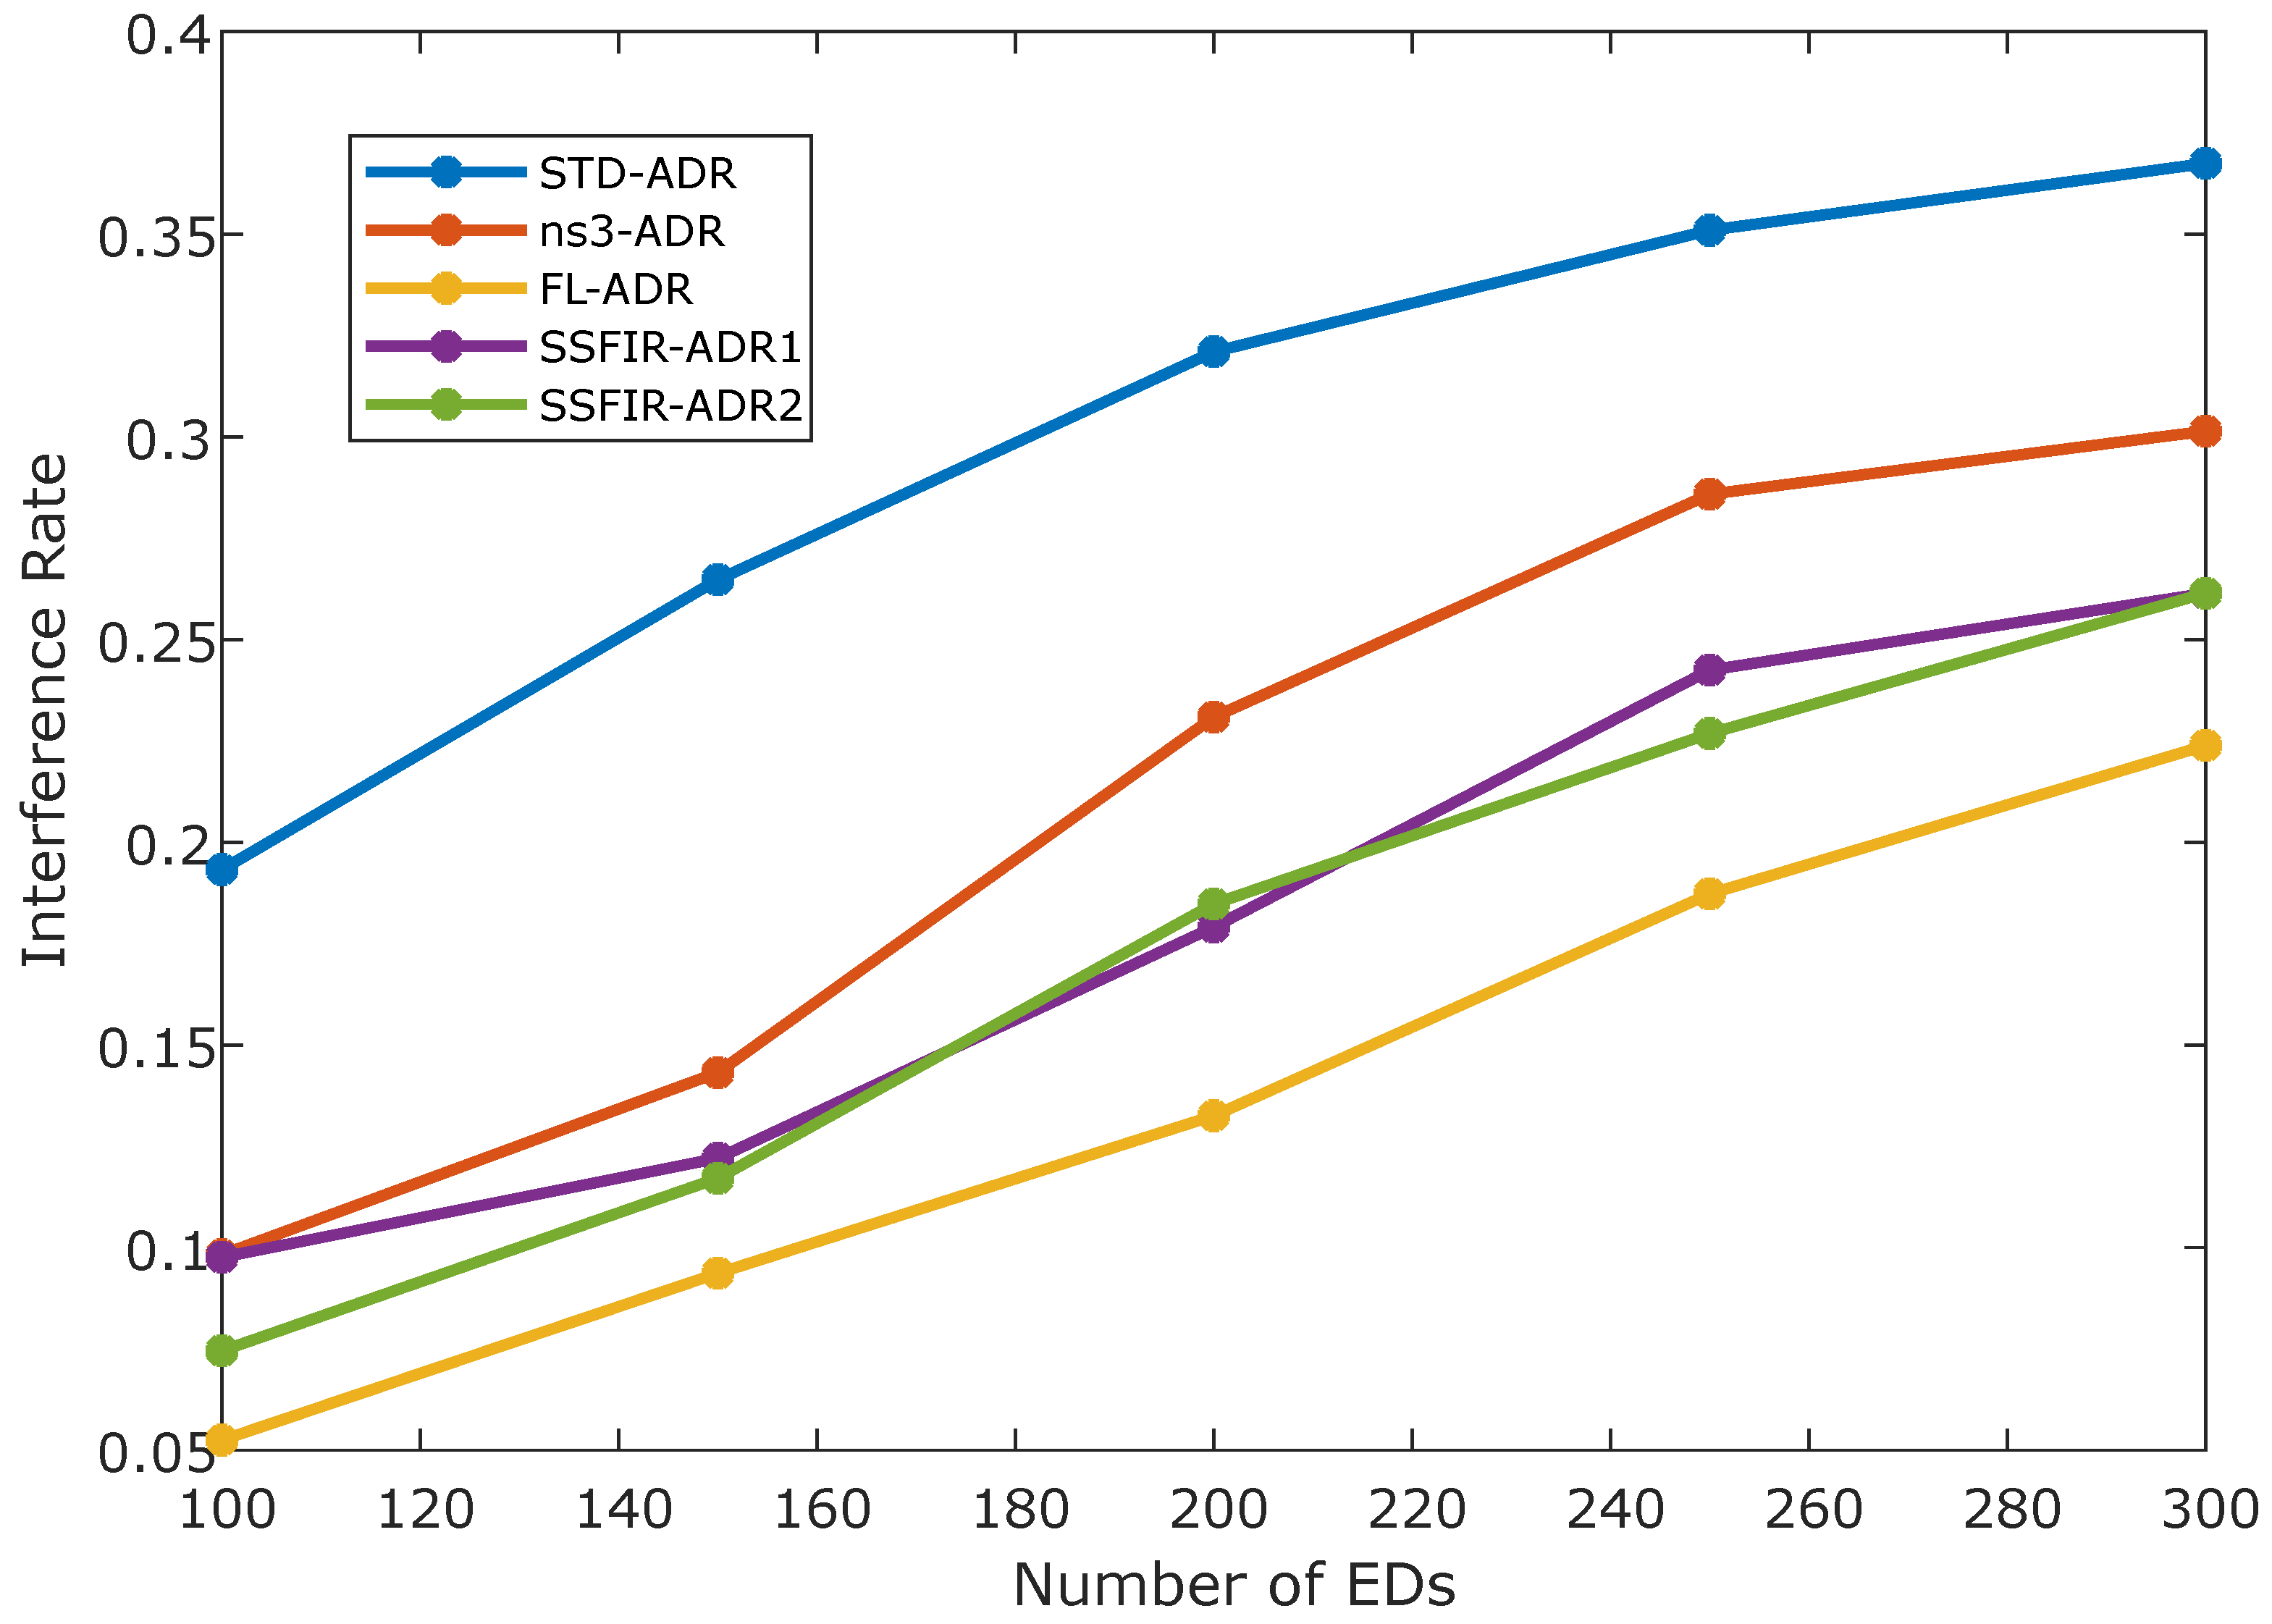
6.4. Interference/Collision Rate
The interference or collision rate, which represents the ratio of total received packets to packets lost due to interference, serves as a measure of network performance. In Figure 10 and Figure 11, we examine the performance of several LoRaWAN ADR implementations relating to the interference ratio. The proposed SSFIR-ADR algorithm consistently demonstrates a lower interference ratio across different application data intervals and node densities except for FL-ADR. It is worth noting that longer application data intervals generally exhibit lower interference ratios compared to faster data intervals. Both graphs in Figure 10 and Figure 11 illustrate the effectiveness of the proposed SSFIR-ADR models in reducing interference ratios across all scenarios. For instance, in Figure 11, the standard ADR algorithm shows an interference rate ranging from 0.19 to 0.36 for this network with up to 300 EDs. In contrast, SSFIR-ADR2 exhibits an interference rate between 0.07 and 0.26, while SSFIR-ADR1 ranges from 0.09 to 0.26. The stochastic approach employed in our proposed model for optimising spreading factor allocation contributes to a reduction of over 20% in the interference rate in comparison with the standard ADR algorithm and 14% improvement in comparison with the ns3-ADR algorithm. However, the FL-ADR algorithm outperforms the SSFIR-ADR models by approximately 12% in terms of interference reduction. Overall, the results establish the efficacy of the proposed SSFIR-ADR models in mitigating interference and improving network performance.
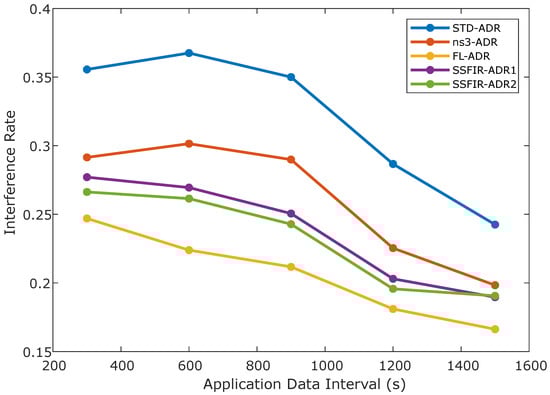
Figure 10.
Data interval vs. Interference/collision rate.
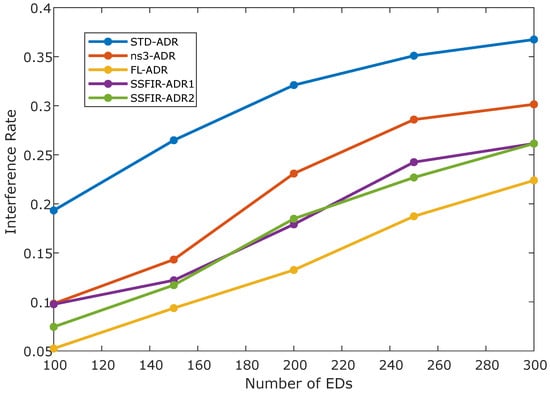
Figure 11.
Number of EDs vs. Interference/collision rate.
7. Conclusions
In this work, we introduced a novel adaptive data rate algorithm termed SSFIR-ADR for LoRaWAN networks, designed to improve the packet delivery ratio and reduce energy utilisation in LoRaWAN networks. The study addresses the detrimental effects of interference, which is increasingly prominent in rapidly growing IoT technologies and leads to higher packet collision rates within the LoRaWAN network. Through extensive simulations and analysis, we have evaluated the SSFIR-ADR algorithm in comparison to other ADR implementations, including the standard ADR algorithm, ns3-ADR algorithm, and FL-ADR scheme. Our findings indicate that the SSFIR-ADR algorithm achieves significant improvements in key performance metrics The obtained results highlight the superiority of our proposed solution over the standard ADR and ns3-ADR algorithms pertaining to energy consumption, packet delivery ratio, and interference rate. While the FL-ADR algorithm demonstrates superior energy consumption optimisation and interference reduction, it falls short of achieving a comparable packet delivery rate. In contrast, the SSFIR-ADR algorithm strikes a balance by achieving significant energy savings without compromising the uplink packet delivery ratio and confirmed packet success rate. The SSFIR-ADR performance is attributed to the algorithm’s ability to mitigate the adverse effect of interference, resulting in fewer collisions and retransmissions. This was achieved without compromising the UL-PDR and CPSR. Our approach presents a promising option for practical LoRaWAN implementations.
Author Contributions
R.K.: Conceptualisation, methodology, writing—original draft. G.P.H.: Conceptualisation, writing—review and editing. A.M.A.-M.: Conceptualisation, writing—review and editing. All authors have read and agreed to the published version of the manuscript.
Funding
This research received no external funding.
Data Availability Statement
The original contributions presented in the study are included in the article, further inquiries can be directed to the corresponding author.
Acknowledgments
This work is based on the research supported in part by our industry partner Telkom. The grant holder acknowledges that the opinions, findings, and conclusions or recommendations expressed in any publication generated by this research are those of the authors, and that our industry partners accept no liability in this regard.
Conflicts of Interest
The authors declare no conflicts of interest.
References
- Naoui, S.; Elhdhili, M.E.; Azouz Saidane, L. Novel Enhanced LoRaWAN Framework for Smart Home Remote Control Security. Wirel. Pers. Commun. 2020, 110, 2109–2130. [Google Scholar] [CrossRef]
- Taleb, H.; Nasser, A.; Andrieux, G.; Charara, N.; Cruz, E.M. Energy Consumption Improvement of a Healthcare Monitoring System: Application to LoRaWAN. IEEE Sens. J. 2022, 22, 7288–7299. [Google Scholar] [CrossRef]
- Valente, A.; Costa, C.; Pereira, L.; Soares, B.; Lima, J.; Soares, S. A LoRaWAN IoT System for Smart Agriculture for Vine Water Status Determination. Agriculture 2022, 12, 1695. [Google Scholar] [CrossRef]
- Ferrari, P.; Sisinni, E.; Carvalho, D.F.; Depari, A.; Signoretti, G.; Silva, M.; Silva, I.; Silva, D. On the Use of LoRaWAN for the Internet of Intelligent Vehicles in Smart City Scenarios. In Proceedings of the 2020 IEEE Sensors Applications Symposium (SAS), Kuala Lumpur, Malaysia, 9–11 March 2020; IEEE: Piscataway, NJ, USA, 2020; pp. 1–6. [Google Scholar]
- Mekki, K.; Bajic, E.; Chaxel, F.; Meyer, F. A Comparative Study of LPWAN Technologies for Large-Scale IoT Deployment. ICT Express 2019, 5, 1–7. [Google Scholar] [CrossRef]
- Raza, U.; Kulkarni, P.; Sooriyabandara, M. Low Power Wide Area Networks: An Overview. IEEE Commun. Surv. Tutor. 2017, 19, 855–873. [Google Scholar] [CrossRef]
- LoRa and LoRaWAN-A Technical Overview; Technology Report; LoRa Alliance: Boston, MA, USA, 2019.
- Sun, Z.; Yang, H.; Liu, K.; Yin, Z.; Li, Z.; Xu, W. Recent Advances in LoRa: A Comprehensive Survey. ACM Trans. Sens. Netw. 2022, 18, 1–44. [Google Scholar] [CrossRef]
- Adelantado, F.; Vilajosana, X.; Tuset-Peiro, P.; Martinez, B.; Melia-Segui, J.; Watteyne, T. Understanding the Limits of LoRaWAN. IEEE Commun. Mag. 2017, 55, 34–40. [Google Scholar] [CrossRef]
- Reynders, B.; Meert, W.; Pollin, S. Range and Coexistence Analysis of Long Range Unlicensed ommunication. In Proceedings of the 2016 23rd International Conference on Telecommunications (ICT), Thessaloniki, Greece, 16–18 May 2016; IEEE: Piscataway, NJ, USA, 2016; pp. 1–6. [Google Scholar]
- Van den Abeele, F.; Haxhibeqiri, J.; Moerman, I.; Hoebeke, J. Scalability Analysis of Large-Scale LoRaWAN Networks in ns-3. IEEE Internet Things J. 2017, 4, 2186–2198. [Google Scholar] [CrossRef]
- Li, S.; Raza, U.; Khan, A. How Agile is the Adaptive Data Rate Mechanism of LoRaWAN? In Proceedings of the 2018 IEEE Global Communications Conference (GLOBECOM), Abu Dhabi, United Arab Emirates, 9–13 December 2018; IEEE: Piscataway, NJ, USA, 2018; pp. 206–212. [Google Scholar]
- Jeffrey, H. Future of Industry Ecosystems: Shared Data and Insights. Available online: https://blogs.idc.com/2021/01/06/future-of-industry-ecosystems-shared-data-and-insights/ (accessed on 25 March 2021).
- Gkotsiopoulos, P.; Zorbas, D.; Douligeris, C. Performance Determinants in LoRa Networks: A Literature Review. IEEE Commun. Surv. Tutor. 2021, 23, 1721–1758. [Google Scholar] [CrossRef]
- LoRa Alliance Inc. LoRaWAN 1.0.3 Specification. 2018, pp. 1–72. Available online: https://resources.lora-alliance.org/document/lorawan-specification-v1-0-3 (accessed on 25 October 2022).
- Kufakunesu, R.; Hancke, G.P.; Abu-Mahfouz, A.M. Towards Achieving an Efficient ADR Scheme for LoRaWAN: A Review of the Constrained Optimisation Approach. In Proceedings of the Southern Africa Telecommunication Networks and Applications (SATNAC), Skukuza, South Africa, 21–24 November 2021; Champagne Sports Resort, Drakensberg. Telkom: Pretoria, South Africa, 2021; pp. 2–7. [Google Scholar]
- Croce, D.; Gucciardo, M.; Tinnirello, I.; Garlisi, D.; Mangione, S. Impact of Spreading Factor Imperfect Orthogonality in LoRa Communications. In Proceedings of the 28th International Tyrrhenian Workshop, TIWDC 2017, Palermo, Italy, 18–20 September 2017; Springer: Berlin/Heidelberg, Germany, 2017; Volume 766, pp. 165–179. [Google Scholar]
- Zhu, G.; Liao, C.H.; Sakdejayont, T.; Lai, I.W.; Narusue, Y.; Morikawa, H. Improving the Capacity of a Mesh LoRa Network by Spreading-Factor-Based Network Clustering. IEEE Access 2019, 7, 21584–21596. [Google Scholar] [CrossRef]
- Croce, D.; Gucciardo, M.; Mangione, S.; Santaromita, G.; Tinnirello, I. Impact of LoRa Imperfect Orthogonality: Analysis of Link-Level Performance. IEEE Commun. Lett. 2018, 22, 796–799. [Google Scholar] [CrossRef]
- Mikhaylov, K.; Petäjäjärvi, J.; Janhunen, J. On LoRaWAN Scalability: Empirical Evaluation of Susceptibility to Inter-Network Interference. In Proceedings of the 2017 European Conference on Networks and Communications (EuCNC), Oulu, Finland, 11–15 June 2017; IEEE: Piscataway, NJ, USA, 2017; pp. 1–6. [Google Scholar]
- Georgiou, O.; Raza, U. Low Power Wide Area Network Analysis: Can LoRa Scale? IEEE Wirel. Commun. Lett. 2017, 6, 162–165. [Google Scholar] [CrossRef]
- Ferré, G. Collision and Packet Loss Analysis in a LoRaWAN Network. In Proceedings of the 2017 25th European Signal Processing Conference (EUSIPCO), Kos, Greece, 28 August–2 September 2017; IEEE: Piscataway, NJ, USA, 2017; pp. 2586–2590. [Google Scholar]
- Liu, Q.; Mu, Y.; Zhao, J.; Feng, J.; Wang, B. Characterizing Packet Loss in City-Scale LoRaWAN Deployment: Analysis and Implications. In Proceedings of the 2020 IFIP Networking Conference (Networking), Paris, France, 22–25 June 2020; IEEE: Piscataway, NJ, USA, 2020; pp. 704–712. [Google Scholar]
- Waret, A.; Kaneko, M.; Guitton, A.; El Rachkidy, N. LoRa Throughput Analysis With Imperfect Spreading Factor Orthogonality. IEEE Wirel. Commun. Lett. 2018, 8, 408–411. [Google Scholar] [CrossRef]
- Bor, M.C.; Roedig, U.; Voigt, T.; Alonso, J.M. Do LoRa Low-Power Wide-Area Networks Scale? In Proceedings of the 19th ACM International Conference on Modeling, Analysis and Simulation of Wireless and Mobile Systems, Miami, FL, USA, 13–17 November 2016; ACM: New York, NY, USA, 2016; pp. 59–67. [Google Scholar]
- LoRa Alliance Inc. LoRaWAN 1.1 Regional Parameters. 2017, pp. 1–56. Available online: https://lora-alliance.org/resource_hub/rp2-1-0-3-lorawan-regional-parameters/ (accessed on 25 October 2022).
- Chiani, M.; Elzanaty, A. On the LoRa Modulation for IoT: Waveform Properties and Spectral Analysis. IEEE Internet Things J. 2019, 6, 8463–8470. [Google Scholar] [CrossRef]
- Mahmood, A.; Sisinni, E.; Guntupalli, L.; Rondón, R.; Hassan, S.A.; Gidlund, M. Scalability Analysis of a LoRa Network under Imperfect Orthogonality. IEEE Trans. Ind. Inform. 2018, 15, 1425–1436. [Google Scholar] [CrossRef]
- Goursaud, C.; Gorce, J.M. Dedicated Networks for IoT: PHY/MAC State of the Art and Challenges. EAI Endorsed Trans. Internet Things 2015, 1, 1–12. [Google Scholar] [CrossRef]
- Kufakunesu, R.; Hancke, G.P.; Abu-Mahfouz, A.M. A Survey on Adaptive Data Rate Optimization in LoRaWAN: Recent Solutions and Major Challenges. Sensors 2020, 20, 5044. [Google Scholar] [CrossRef]
- Voigt, T.; Bor, M.; Roedig, U.; Alonso, J. Mitigating Inter-Network Interference in LoRa Networks. In Proceedings of the 2017 International Conference on Embedded Wireless Systems and Networks, Uppsala, Sweden, 20–22 February 2017; pp. 323–328. [Google Scholar]
- Anwar, K.; Rahman, T.; Zeb, A.; Saeed, Y.; Khan, M.A.; Khan, I.; Ahmad, S.; Abdelgawad, A.E.; Abdollahian, M. Improving the Convergence Period of Adaptive Data Rate in a Long Range Wide Area Network for the Internet of Things Devices. Energies 2021, 14, 5614. [Google Scholar] [CrossRef]
- Farhad, A.; Kim, D.H.; Subedi, S.; Pyun, J.Y. Enhanced LoRaWAN Adaptive Data Rate for Mobile Internet of Things Devices. Sensors 2020, 20, 6466. [Google Scholar] [CrossRef]
- Farhad, A.; Pyun, J.Y. HADR: A Hybrid Adaptive Data Rate in LoRaWAN for Internet of Things. ICT Express 2022, 8, 283–289. [Google Scholar] [CrossRef]
- Abdelfadeel, K.Q.; Cionca, V.; Pesch, D. Fair Adaptive Data Rate Allocation and Power Control in LoRaWAN. In Proceedings of the 2018 IEEE 19th International Symposium on “A World of Wireless, Mobile and Multimedia Networks” (WoWMoM), Chania, Greece, 12–15 June 2018; IEEE: Piscataway, NJ, USA, 2018; pp. 14–15. [Google Scholar]
- Cuomo, F.; Campo, M.; Caponi, A.; Bianchi, G.; Rossini, G.; Pisani, P. EXPLoRa: Extending the Performance of LoRa by Suitable Spreading Factor Allocations. In Proceedings of the 2017 IEEE 13th International Conference on Wireless and Mobile Computing, Networking and Communications (WiMob), Rome, Italy, 9–11 October 2017; IEEE: Piscataway, NJ, USA, 2017; pp. 1–8. [Google Scholar]
- Marini, R.; Cerroni, W.; Buratti, C. A Novel Collision-Aware Adaptive Data Rate Algorithm for LoRaWAN Networks. IEEE Internet Things J. 2020, 8, 2670–2680. [Google Scholar] [CrossRef]
- Chinchilla-Romero, N.; Navarro-Ortiz, J.; Muñoz, P.; Ameigeiras, P. Collision avoidance resource allocation for LoRaWAN. Sensors 2021, 21, 1218. [Google Scholar] [CrossRef] [PubMed]
- de Jesus, G.G.M.; Souza, R.D.; Montez, C.; Hoeller, A. LoRaWAN Adaptive Data Rate With Flexible Link Margin. IEEE Internet Things J. 2020, 8, 6053–6061. [Google Scholar] [CrossRef]
- Kumari, P.; Gupta, H.P.; Dutta, T. An Incentive Mechanism-Based Stackelberg Game for Scheduling of LoRa Spreading Factors. IEEE Trans. Netw. Serv. Manag. 2020, 17, 2598–2609. [Google Scholar] [CrossRef]
- Kim, S.; Yoo, Y. Contention-Aware Adaptive Data Rate for Throughput Optimization in LoRaWAN. Sensors 2018, 18, 1716. [Google Scholar] [CrossRef]
- Kufakunesu, R.; Hancke, G.P.; Abu-Mahfouz, A. A Fuzzy-Logic Based Adaptive Data Rate Scheme for Energy-Efficient LoRaWAN Communication. J. Sens. Actuator Netw. 2022, 11, 65. [Google Scholar] [CrossRef]
- Garlisi, D.; Tinnirello, I.; Bianchi, G.; Cuomo, F. Capture Aware Sequential Waterfilling for LoRaWAN Adaptive Data Rate. IEEE Trans. Wirel. Commun. 2021, 20, 2019–2033. [Google Scholar] [CrossRef]
- Reynders, B.; Meert, W.; Pollin, S. Power and Spreading Factor Control in Low Power Wide Area Networks. In Proceedings of the 2017 IEEE International Conference on Communications (ICC), Paris, France, 21–25 May 2017; IEEE: Piscataway, NJ, USA, 2017; pp. 1–6. [Google Scholar]
- Zorbas, D.; Papadopoulos, G.Z.; Maille, P.; Montavont, N.; Douligeris, C. Improving LoRa Network Capacity Using Multiple Spreading Factor Configurations. In Proceedings of the 2018 25th International Conference on Telecommunications (ICT), Saint Malo, France, 26–28 June 2018; IEEE: Piscataway, NJ, USA, 2018; pp. 516–520. [Google Scholar]
- Slabicki, M.; Premsankar, G.; Di Francesco, M. Adaptive Configuration of LoRa Networks for Dense IoT Deployments. In Proceedings of the NOMS 2018–2018 IEEE/IFIP Network Operations and Management Symposium, Taipei, Taiwan, 23–27 April 2018; IEEE: Piscataway, NJ, USA, 2018; pp. 1–9. [Google Scholar]
- Hauser, V.; Hégr, T. Proposal of Adaptive Data Rate Algorithm for LoRaWAN-Based Infrastructure. In Proceedings of the 2017 IEEE 5th International Conference on Future Internet of Things and Cloud (FiCloud), Prague, Czech Republic, 21–23 August 2017; IEEE: Piscataway, NJ, USA, 2017; pp. 85–90. [Google Scholar]
- Gaussian Waves Log Distance Model. Available online: https://www.gaussianwaves.com/2013/09/log-distance-path-loss-or-log-normal-shadowing-model/ (accessed on 14 August 2021).
- A Discrete-Event Network Simulator for Internet Systems. Available online: https://www.nsnam.org/ (accessed on 29 January 2021).
- Magrin, D.; Capuzzo, M. LoRaWAN ns-3 Module. Available online: https://github.com/signetlabdei/lorawan (accessed on 17 April 2020).
- Semtech. SX1272 Data Sheet_v4. 2019. Available online: https://www.semtech.com/products/wireless-rf/lora-core/sx1272 (accessed on 6 February 2022).


Disclaimer/Publisher’s Note: The statements, opinions and data contained in all publications are solely those of the individual author(s) and contributor(s) and not of MDPI and/or the editor(s). MDPI and/or the editor(s) disclaim responsibility for any injury to people or property resulting from any ideas, methods, instructions or products referred to in the content. |
© 2024 by the authors. Licensee MDPI, Basel, Switzerland. This article is an open access article distributed under the terms and conditions of the Creative Commons Attribution (CC BY) license (https://creativecommons.org/licenses/by/4.0/).