Article

A Micro-Segmentation Method Based on VLAN-VxLAN Mapping Technology

1
College of Computer Science and Electronic Engineering, Hunan University, Changsha 410082, China
2
Information & Network Center, Hunan Agricultural University, Changsha 410128, China
3
Hunan Province Key Laboratory of Industrial Internet Technology and Security, Changsha University, Changsha 410022, China
4
College of Information Technology and Management, Hunan University of Finance and Economics, Changsha 410205, China
5
Shenzhen Institute, Hunan University, Shenzhen 518063, China
*
Author to whom correspondence should be addressed.
Future Internet 2024, 16(9), 320; https://doi.org/10.3390/fi16090320
Submission received: 31 July 2024 / Revised: 31 August 2024 / Accepted: 2 September 2024 / Published: 4 September 2024

Abstract

:
As information technology continues to evolve, cloud data centres have become increasingly prominent as the preferred infrastructure for data storage and processing. However, this shift has introduced a new array of security challenges, necessitating innovative approaches distinct from traditional network security architectures. In response, the Zero Trust Architecture (ZTA) has emerged as a promising solution, with micro-segmentation identified as a crucial component for enabling continuous auditing and stringent security controls. VxLAN technology is widely utilized in data centres for tenant isolation and virtual machine interconnection within tenant environments. Despite its prevalent use, limited research has focused on its application in micro-segmentation scenarios. To address this gap, we propose a method that leverages VLAN and VxLAN many-to-one mapping, requiring that all internal data centre traffic routes through the VxLAN gateway. This method can be implemented cost-effectively, without necessitating business modifications or causing service disruptions, thereby overcoming the challenges associated with micro-segmentation deployment. Importantly, this approach is based on standard public protocols, making it independent of specific product brands and enabling a network-centric framework that avoids software compatibility issues. To assess the effectiveness of our micro-segmentation approach, we provide a comprehensive evaluation that includes network aggregation and traffic visualization. Building on the implementation of micro-segmentation, we also introduce an enhanced asset behaviour algorithm. This algorithm constructs behavioural profiles based on the historical traffic of internal network assets, enabling the rapid identification of abnormal behaviours and facilitating timely defensive actions. Empirical results demonstrate that our algorithm is highly effective in detecting anomalous behaviour in intranet assets, making it a powerful tool for enhancing security in cloud data centres. In summary, the proposed approach offers a robust and efficient solution to the challenges of micro-segmentation in cloud data centres, contributing to the advancement of secure and reliable cloud infrastructure.

1. Introduction

Due to advancements in virtualization technology and the inherent benefits of energy efficiency [1] and operational flexibility [2], cloud computing has emerged as the primary preference for constructing data centres. Market analysis, forecast, and strategic consultation of the cloud computing industry in 2020–2026 by Zhiyan Consulting [3] indicates that the global cloud computing market size has surpassed USD 250 billion and is expected to continue growing. According to the China Academy of Information and Communications Technology’s Cloud Computing White Paper (2024) [4], the global cloud computing market has reached USD 586.4 billion and is expected to exceed USD 1 trillion by 2027 due to the advantages of flexibility, scalability, and high return on investment in cloud computing construction. However, the widespread use of cloud computing technology has resulted in new security challenges that need to be addressed, including:
  • The efficiency and convenience offered by cloud computing have blurred traditional security boundaries, thereby presenting a significant challenge.
  • The ability of cloud computing to seamlessly transition between various hosts to achieve high availability or dynamic resource balancing has rendered conventional security policies ineffective and obsolete.
  • While the scalability of cloud computing facilitates the creation of on-demand resources, the batch-wise construction of cloud infrastructure introduces a challenge pertaining to device brand compatibility. Consequently, this incompatibility impedes the enforcement of security policies across cloud hosts.
  • The inherent invisibility of in-cloud traffic represents a substantial obstacle for ensuring robust in-cloud security measures. Addressing this challenge requires innovative approaches and solutions that can effectively monitor and safeguard the flow of traffic within cloud environments.
Zero trust first appeared in 2004, when the Jericho Forum (https://www.opengroup.org/forum/security) began seeking security architecture and solutions to address the trend of blurred boundaries. They proposed that de-perimeterization has happened, is happening, and is inevitable [5]. In 2010, John Kindwig, an analyst at Forrester, formally proposed the concept of “zero trust”. In 2016, Kindervag proposed the Zero Trust Architecture (ZTA) as a means of addressing the overreliance on trust in traditional cybersecurity architectures [6]. However, one of the major challenges with the ZTA has been security within cloud data centres, particularly in relation to the east—west traffic, which refers to the communication between servers within the cloud. To overcome this challenge, our paper proposes a micro-segmentation approach based on VLAN and VxLAN mapping. By implementing our approach, boundaries can be established for each cloud host, effectively eliminating blind spots in the ZTA.
Our approach is hardware-brand agnostic, easy to implement, and has minimal service interruptions, making it suitable for scenarios with high real-time service demands. We demonstrate the effectiveness of our approach through a comprehensive evaluation of the degree of network aggregation and the share of visible traffic. Moreover, we propose an enhanced asset behavioural profiling algorithm that considers the stability and periodicity of intranet asset behaviour. The algorithm incorporates a time dimension into the traditional trust assessment model, and experimental results demonstrate its superior performance. In summary, the contributions of our paper are as follows:
  • We propose a hardware-brand agnostic micro-segmentation approach based on VLAN and VxLAN mapping that effectively removes blind spots in the “zero trust” architecture with minimal service interruptions and high suitability for real-time service demands.
  • We demonstrate the effectiveness of our approach through comprehensive evaluation of network aggregation and the share of visible traffic.
  • We design an enhanced asset behavioural profiling algorithm with a time dimension that significantly improves traditional trust assessment models.
This paper is structured as follows. In Section 2, we review the related literature. Section 3 outlines our proposed method, while Section 4 provides an analysis of the experimental results. We conclude with a summary of our findings and future research directions in Section 5.

2. Relation Work

In this section, we review related work on zero trust architecture, micro-segmentation, and VxLAN.

2.1. Zero Trust Architecture

With the advancement of information technology, cyber security presents increasingly complex challenges. Kindervag et al. proposed ZTA in 2016. They argued that conventional network security frameworks had various drawbacks, including the difficulty in defining a security device’s interface as “Trusted”, the challenge in effectively implementing “Trust but Verify”, the tendency to trust malicious attackers who were previously considered trusted users, and the lack of trusted packets in cyberspace. As a result, they proposed a novel security architecture—ZTA. In ZTA, the distinction between trusted and untrusted networks is eliminated, and all network traffic is treated as untrusted, necessitating thorough examination and recording.
In network security, several assumptions have been made, including the presence of external network attackers, the existence of attacked values on the internal network, the existence of insecure hosts on the internal network, and the presence of insiders or users with malicious intent. The article [7] proposed a comprehensive trust model based on the zero trust architecture. The article [8] proposed a ZTA protocol with a formal definition and security analysis that relies on authentication. It also evaluated the feasibility of this authentication method. However, achieving the desired outcomes in this experiment required clear instructions for the participants, which proves challenging in practice.
Another article [9] proposed a model for proactive defence against extranet attacks that could minimize defence costs and optimize the allocation of limited defence resources to other aspects of the defence system. Eidle, D. et al. [10] presented a zero trust solution that involves inserting a token into the first TCP connection for authentication and utilizing dynamic access control lists to link heterogeneous security devices for rapid blocking responses. The solution has been demonstrated to significantly surpass previous methods. But, these two articles mainly primarily addressed attacks originating from external networks, and they did not affect east–west traffic.
In [11], a method for realizing zero trust by incorporating a network authentication token in the TCP connection request is proposed, effectively blocking unauthorized traffic from completing the request. The method necessitated business redesign, entailing substantial implementation costs.
The article [12] proposed an end-to-end time-series anomaly detection, striking a balance between effective decomposition and precise anomaly detection. Authentication is a very important part of ZTA, but it also faces challenges in terms of identity forgery [13], theft of devices [14], etc.
The survey [15] introduced a definition of ZTA and the key components that make up ZTA. In another article [16], the essential technologies for zero trust, such as authentication, access control, and trust evaluation, were identified, and the existing challenges and future directions of these technologies were analysed. This article also highlighted the advantages of utilizing machine learning for trust evaluation due to its high evaluation accuracy and strong awareness. Furthermore, a machine learning-based trust assessment model was proposed in [17] for quickly classifying untrusted objects; however, this algorithm did not consider the time dimension. Our paper extends previous research by incorporating time dimension into the machine learning-based trust assessment model. Lim, W. et al. [18] introduced a novel approach to address the issue of low anomalous data in the training process.

2.2. Micro-Segmentation
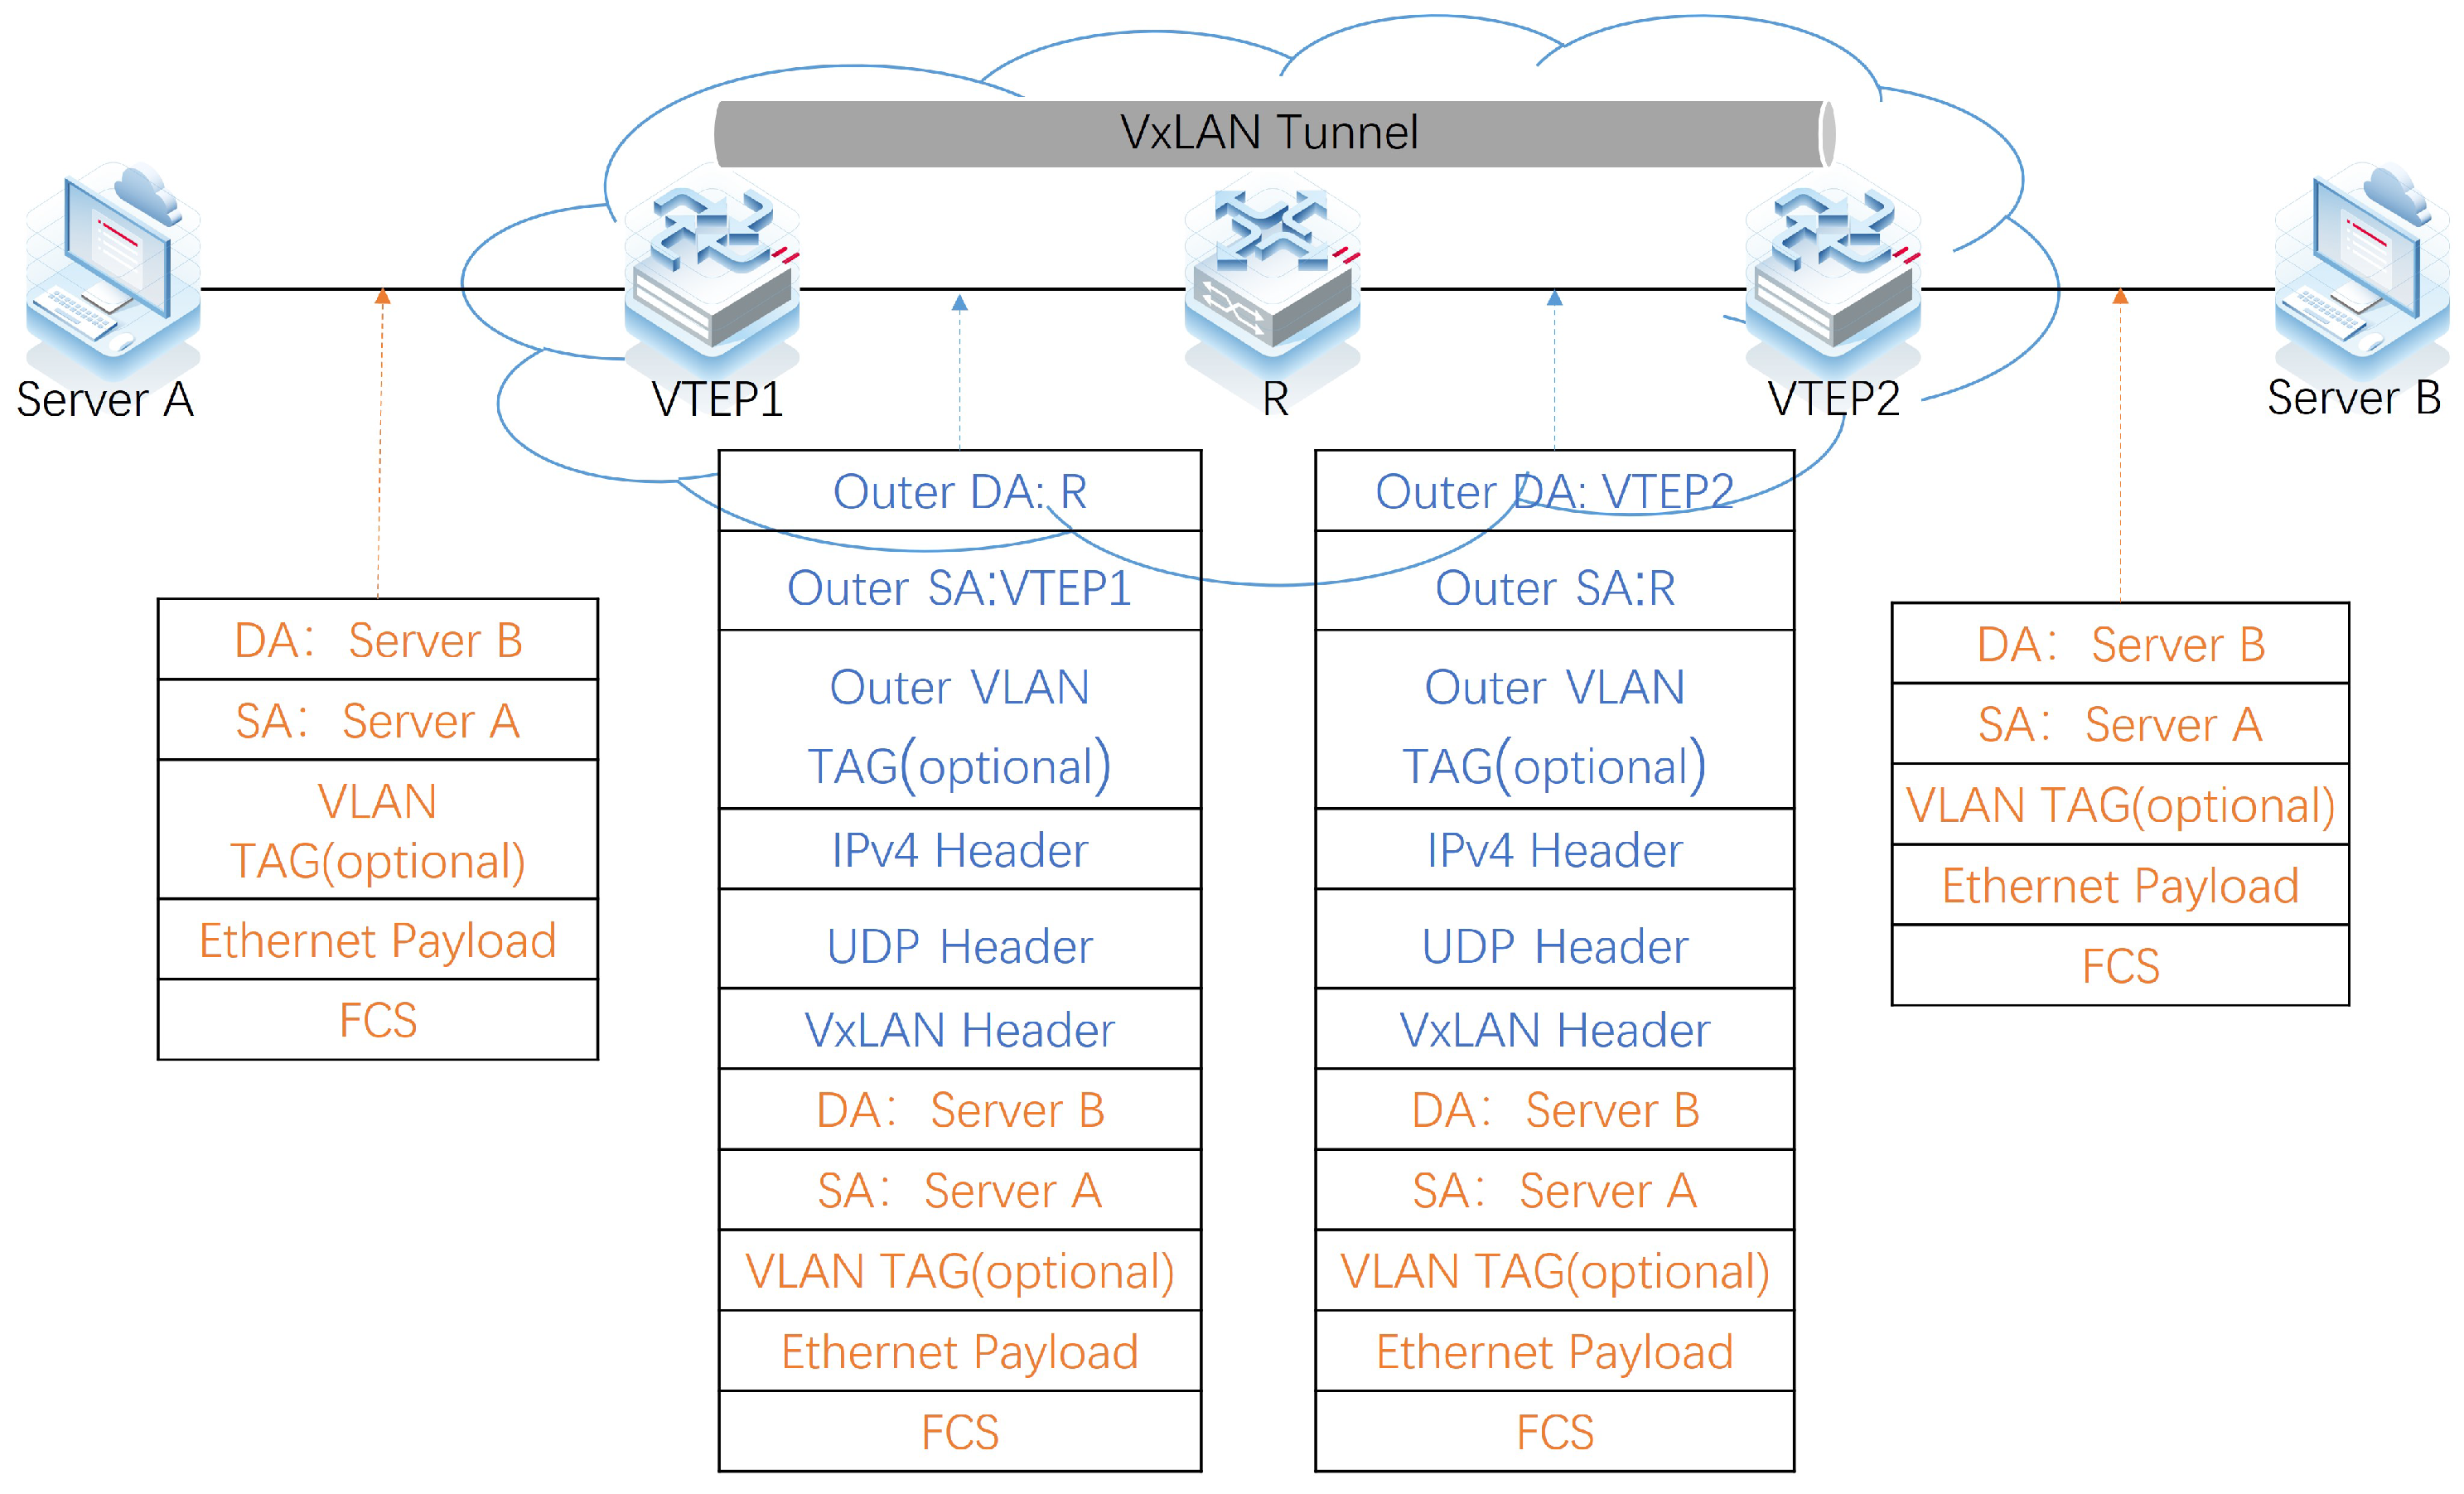
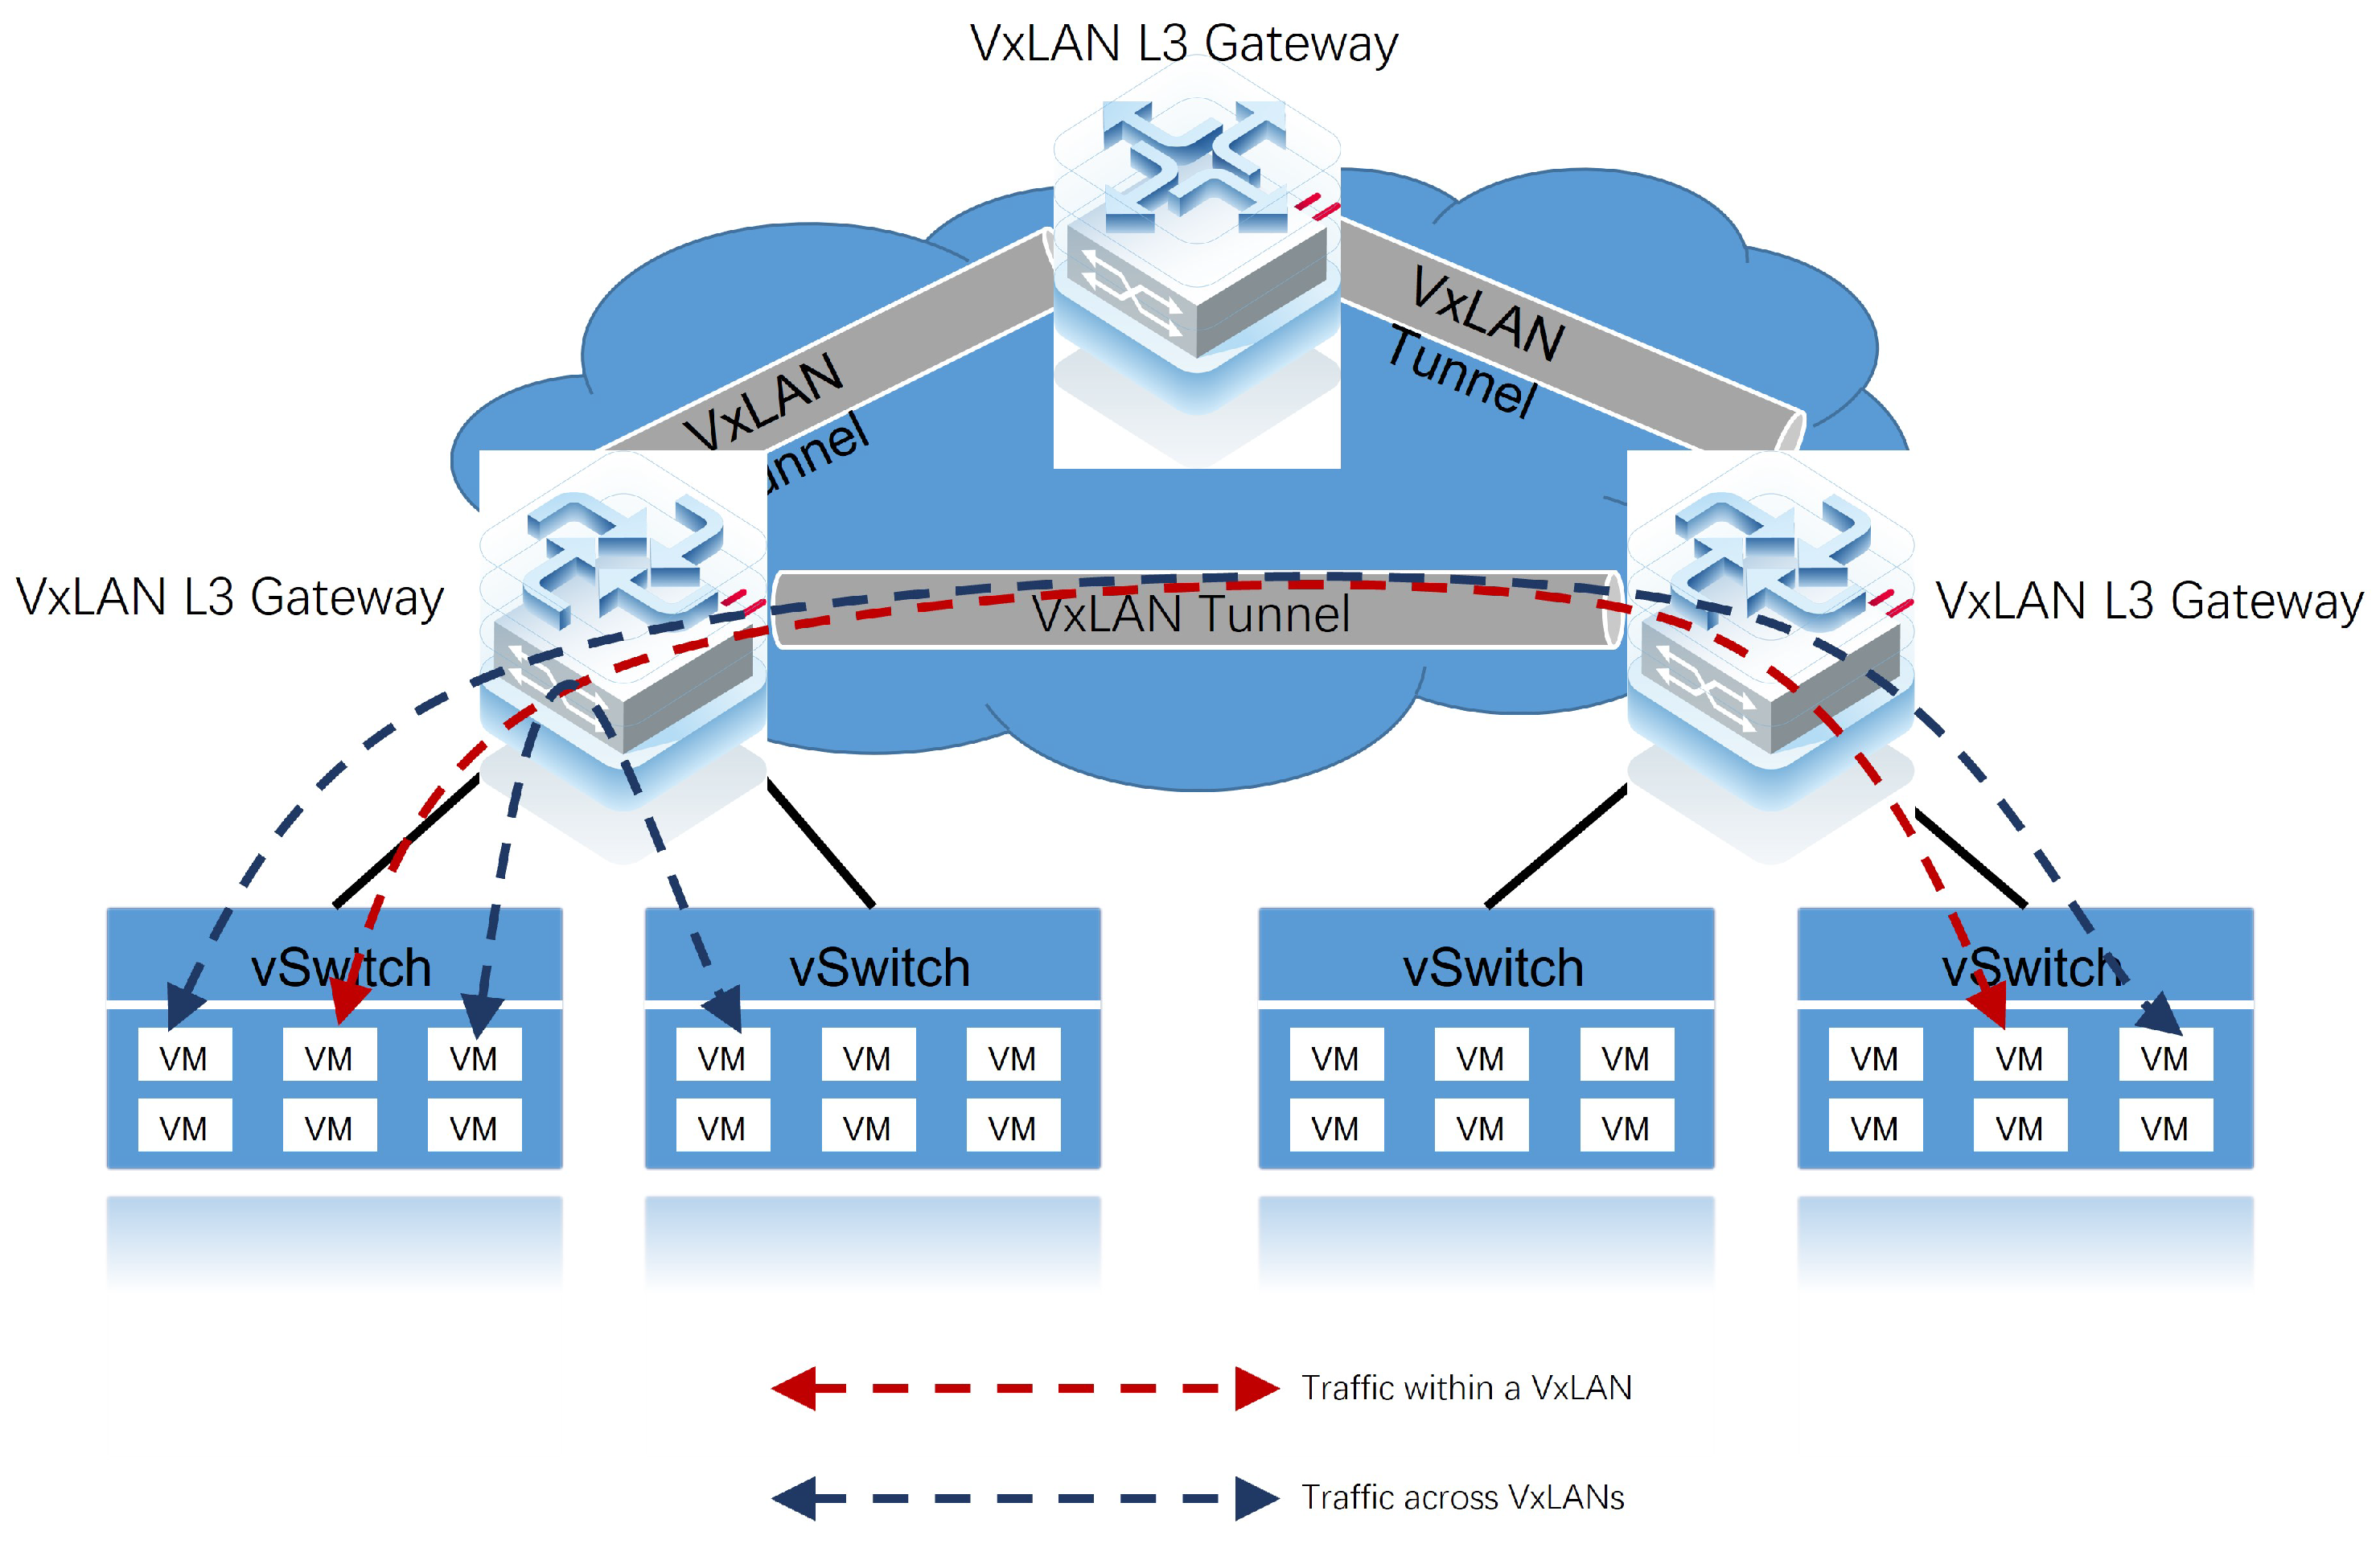
According to Klein, D. [19], micro-segmentation, a key component of zero trust architectures, was considered the optimal technology choice for achieving a zero trust model in cloud environments. Micro-segmentation focused on the inside of the cloud environment, monitored threats to east–west traffic, and provided true micro-level visibility as opposed to traditional network security solutions such as firewalls/intrusion detection systems. Many security organizations understood the benefits of micro-segmentation.
The article [20] argued that the adoption of SDN technology had enabled the widespread implementation of micro-segmentation. Micro-segmentation served two critical tasks: identifying network traffic above the transport layer and controlling network traffic based on policies. By identifying network traffic above the transport layer, micro-segmentation provided greater visibility into network activity, allowing for more precise and effective monitoring and control. This was particularly important for security, as it enabled administrators to detect and respond to threats more quickly. Policy-based network traffic control referred to the ability to segment network traffic based on specific policies. By doing so, micro-segmentation enabled administrators to apply specific rules and controls to different segments of the network, providing a more granular level of control and greater security.
Ni, L. et al. [21] classified micro-segmentation techniques into three categories: VM-based monitoring procedures, network isolation, and host–agent-based micro-segmentation. The article argued that host–agent-based micro-segmentation was the superior micro-segmentation approach and designed a zero trust security architecture using the host–agent approach. Kang, C. et al. [22] addressed the problem of host agent-based micro-segmentation taking up a lot of host resources. They designed a distributed intrusion detection-based host micro-segmentation automatic generation model, which improved the security of hosts within the data centre without taking up too many computing resources of servers. However, the host–agent-based approach brought with it compatibility risks and consumed host resources.
Sheikh, N. et al. [23] deployed three virtual servers in a Microsoft Azure environment and utilized micro-segmentation using the Illumio Adaptive Security Platform to whitelist some of the traffic between the servers, allowing for communication, while denying access to the rest by default. The authors also highlighted that network-based micro-segmentation is simpler to implement compared to business-based micro-segmentation.
Basta, N. et al. [24] proposed a method to evaluate micro-segmentation and compared it to traditional architectures in terms of exposure and robustness of the network. They designed a mathematical quantitative model for experimental comparison in terms of shortest path, maximum out-degree, average betweenness, etc. The experimental results showed that micro-segmentation was much more secure than traditional network architectures. We have examined the author’s approach and introduce our own method of evaluation.

2.3. VxLAN

The use of Virtual Local Area Networks (VLAN) for network isolation has been standard practice in traditional networks. However, the VLAN technology has its limitations and can no longer fulfill the requirements for tenant and service isolation in cloud computing environments, as the maximum number of subnets it supports is 4094.
An important advantage of cloud computing data centres is their high service availability. Achieving this level of availability requires virtual machines to be migrated without interruption across three layers of devices in the data centre, regardless of their physical location. Moreover, it is necessary that both IP and MAC addresses remain unchanged during the migration process. This is in contrast to traditional networks, which are unable to maintain the same IP address after traversing three layers of devices.
VxLAN technology presents itself as a better solution to the previously mentioned problems. Its 24-bit Virtual Network Identifiers (VNIs) allow for over 16 million segments, meeting the requirements of tenant and service isolation in cloud and other large datacentres or complex environments. Furthermore, VxLAN employs MAC-in-UDP tunneling technology to create layer 2 tunnels within the data centre, which enable virtual machines to roam the data centre without changes to their IP and MAC addresses. As a result, VxLAN technology was widely used in cloud data centre scenarios.
Zhang, Y. et al. [25] presented a VxLAN-based in-band network telemetry method that enables high-precision monitoring of data centre networks. The article [26] proposed a load-balancing approach based on VxLAN tunneling technology to improve performance, reduce latency, and avoid congestion. The work presented in [27] introduces an optimisation scheme for VxLAN based on the software-defined networking (SDN) paradigm. The proposed approach aims to improve network performance by reducing latency, increasing throughput, decreasing packet loss, and enhancing load balancing and network utilisation. These articles separately presented the application scenarios and benefits of VxLAN technology within cloud data centres, without its application in micro-segmentation scenarios.
The article [28] proposed a traffic control approach that improves high availability and traffic distribution performance using vxlan technology instead of stp technology. The article employed a direct one-to-one mapping approach between VLAN and VxLAN, primarily focusing on the implementation of data migration within the cloud. This approach served as a valuable inspiration for our subsequent research.

3. Proposed Method

This work comprises two primary components. The first component focuses on the implementation of micro-segmentation by employing VLAN and VxLAN mapping techniques. The objective is to assess the advantages obtained from this implementation. The second component introduces an enhanced asset behavioural profiling algorithm that leverages the micro-segmentation implementation. The algorithm evaluates the effectiveness of micro-segmentation by performing behavioural profiling of cyberspace assets through traffic analysis.

3.1. Micro-Segmentation

3.1.1. Micro-Segmentation

There are currently two popular approaches to micro-segmentation. The first approach involves implementing business-based security controls by installing endpoint security software or plug-ins inside each virtual machine. This approach has several advantages, such as being located close to the endpoint of the traffic and enabling different security control rules to be developed for different services, resulting in a fine-grained and highly flexible micro-segmentation approach. However, this approach also has several drawbacks, such as difficulties in installation and deployment, the fact that each endpoint security software or plug-in can only protect a single virtual machine, and increased deployment difficulties when the scale increases. Moreover, high flexibility brings increased management, operation, and maintenance costs and inconsistent security requirements of the business, which may result in the inability to complete the implementation of security policies in bulk. Since the security software is installed on top of the operating system, there are issues of compatibility with business software, and the consumption of virtual machine resources to consider. When the scale of deployment is larger, performing threat library and patch upgrades may have a greater impact on the performance of the cloud platform, and the cost of this model is higher.
The second approach is a network-based micro-segmentation approach, which configures virtual machines on the same subnet into segregated VLANs, making it impossible for virtual machines to interoperate at the virtual switch level through network isolation. Virtual machine traffic has to be forwarded to the VxLAN Tunnel Endpoint (VTEP) switch first, and then “secure service chaining” is implemented through the SDN controller. The advantages of this approach are that it is easier to implement, less costly, has no software compatibility issues, does not consume computing resources, and is more stable than the business-based micro-segmentation approach. However, this approach has some drawbacks. Firstly, the policy is not as fine-grained as the business-based micro-segmentation approach. Additionally, the SDN controller needs to manage virtual switches to implement network-based micro-segmentation. Otherwise, it cannot ensure that virtual machines will not interoperate at the virtual switch level, and it is easily hijacked by the network manufacturer. Moreover, during the process of changing the network configuration, information such as IP addresses needs to be changed, which can cause business interruptions, making it unacceptable for certain time-sensitive services.
Our research focuses on the improvement of network-based micro-segmentation methods.

3.1.2. VxLAN

VxLAN is a tunneling technology that facilitates Layer 2 interconnection across physical locations by establishing a Layer 2 network tunnel over a Layer 3 network. It achieves this by encapsulating original Ethernet packets within User Datagram Protocol (UDP) packets for transmission. The packet format of VxLAN is illustrated in Figure 1.
The key component in a VxLAN environment is the VTEP, which is responsible for encapsulating VxLAN packets and serves as both the starting and ending point of a VxLAN tunnel. The process of encapsulating VxLAN packets belonging to the same VxLAN Network Identifier (VNI) is illustrated in Figure 2. Let us consider an example where Server A and Server B, located in different physical locations, need to communicate. Server A sends a traditional Ethernet message (with VLAN TAG) to VTEP1. VTEP1, based on its table of mapping relationships between VLANs and VxLANs, adds the corresponding VxLAN header to the message, encapsulating it into a VxLAN packet. This encapsulated packet traverses the physical network and reaches VTEP2, which then sends it through the VxLAN tunnel to its destination. Upon receiving the packet, VTEP2 sequentially removes the outer Ethernet, outer IP header, and UDP header. It checks the VNI and inner Ethernet header information of the packet, verifies the receiver’s association with VTEP2, removes the VxLAN header, and forwards the data frame to Server B.
In a VxLAN environment, hosts need to communicate within the same VNI, between different VNI’s, and between VxLAN networks and non-VxLAN networks. To fulfill these requirements, VxLAN introduces the concept of Layer 2 and Layer 3 gateways. Layer 2 gateways enable client access to VxLAN networks and facilitate host communication within the same VNI. Layer 3 gateways, on the other hand, enable host communication between different VNI’s and provide access to external networks.
The deployment of Layer 3 gateways in a VxLAN environment can be done in two ways: centralized gateway and distributed gateway.
The centralized gateway is illustrated in Figure 3. The advantage of a centralized gateway is that it allows centralized management of network traffic across VxLANs and is relatively simple to configure. The disadvantages are that the network scale is limited by Address Resolution Protocol (ARP) table entries, and that some traffic forwarding may not be optimized. As Figure 3 shows, when traffic on different VxLAN networks needs to communicate, even if they are physically located under the same VxLAN L2 Gateway, the traffic needs to be uploaded to the VxLAN L3 Gateway before it can reach its destination. According to the encapsulation protocol of VxLAN, it is easy to observe that VxLAN loses some performance in the encapsulation process and increases the overhead of the network equipment. Therefore, centralized gateways are mostly used in scenarios where north–south traffic is high.
On the other hand, the distributed gateway deployment model, as depicted in Figure 4, provides a solution to the limitations of the centralized gateway. In this approach, each node only needs to learn a part of the ARP table entries, which solves the drawback of network scale scalability. Additionally, when traffic from different VxLAN networks needs to communicate, it can be forwarded directly. However, the disadvantage of this deployment model is that each node needs to be configured, which could make operation and maintenance relatively complex. To address this challenge, using SDN controllers to manage VxLAN network devices is recommended. The distributed gateway deployment model is suitable for scenarios with high east–west traffic and the need for network expansion. In data centre environments, a distributed gateway deployment model is commonly adopted.
Due to its inherent characteristics, VxLAN is extensively employed in cloud data centre environments, primarily for tenant isolation and virtual machine migration scenarios. The seamless migration capabilities of VxLAN make it particularly well-suited for micro-segmentation applications. In our proposed solution, we aim to ensure that only north–south traffic occurs within the vSwitch, eliminating any east–west traffic. By enforcing this design, all traffic must be routed through the L3 gateway, which facilitates subsequent traffic mirroring for enhanced monitoring and security. In typical vSwitch operations, horizontal traffic forwarding is contingent on the consistency of VLAN IDs. To address this, we implemented a VLAN-to-VxLAN many-to-one mapping strategy, wherein each virtual machine is assigned a unique VLAN. This approach effectively prevents direct horizontal traffic forwarding between virtual machines within the vSwitch, thereby meeting our requirement for controlled traffic flows and enabling more effective micro-segmentation.
Table 1 presents the relevant details of specific cyberspace assets that have undergone micro-segmentation using the VLAN-VxLAN mapping technique. This technique involves assigning a unique VLAN identification number to each existing IP address within the VLAN and mapping them to the same Virtual Network Identifier (VNI) as the original VLAN. The mapping relationships between the newly created VLAN and its corresponding VNI are provided in Table 2.
Upon implementing the micro-segmentation modification, the network topology of assets within the same subnet has been transformed from a bus-based topology to a star-based topology. This implies that all traffic between these assets must pass through the VxLAN L3 Gateway, and direct virtual machine access is no longer permitted, as depicted in Figure 5.
A distinct advantage of this method lies in its non-intrusive nature, as it requires no interruption to ongoing business operations and only necessitates configuration adjustments on the L3 gateway. This makes it particularly advantageous for applications with stringent continuity requirements. Our subsequent experiments confirmed the feasibility of this approach. It is important to note, however, that employing the L3 gateway for micro-segmentation does impose an additional load on the gateway. Our measurements indicate that this load increases by approximately 1.5 to 2 times. Despite this additional burden, we believe that the enhanced security benefits justify the modest increase in load.

3.1.3. Evaluation of the Effect of Differential Segmentation

The utilization of diagrams as a means to represent intricate data object relationships was explored by Zhang, X. et al. [29]. In a similar vein, Basta, N. et al. [24] proposed a graph theory-based approach to quantify the reduction in network exposure resulting from micro-segmentation. In this study, we adopt their methodology and employ the directed graph C(A,V) to represent the data centre network, where each node in the set V corresponds to a network asset, and the set of directed edges A contains all possible connections between nodes, with xV, yV and xy. An edge (x,y) exists if x can access y directly, and (x,y) ∈ A. Here, x serves as the incoming node of y, and y serves as the outgoing node of x.
To provide a visual representation, we present a network schematic diagram in Figure 6, where Figure 6a illustrates the network connectivity without micro-segmentation, and Figure 6b demonstrates the network connectivity with micro-segmentation. In the diagram, Vr represents a router, Vai i = 1, 2, 3 denotes a host in subnet a, and Vbj j = 1, 2, 3 denotes a host in subnet b. In the absence of micro-segmentation, hosts within a subnet are adjacent nodes to each other, and access across subnets must go through the router. For instance, to reach Vb2 from Va1, traffic must traverse the edges: Va1, Vr, and Vr, Vb2. When a source node requires passage through an intermediate node to reach a target node, traffic on this edge can be intercepted for traffic analysis. However, when a source node can reach the target node directly, traffic analysis cannot be performed on this edge, and the traffic between them cannot be visualized. This topology can be effectively represented using graph theory, providing a comprehensive view of the network’s connectivity and facilitating network analysis.
The inability of a third party to capture traffic increases the likelihood of a successful lateral attack, as there is a low probability that the attack will be exposed. Conversely, as the amount of uncaptured traffic in the network increases, the probability of success for such an attack also increases. In this context, we introduce the concept of Probability of Attack Exposure (PoAE), which is defined as follows:
P o A E = traffic that can be analysed T T ,
T T = x V F x .
In Equation (1), the term traffic that can be analysed represents the sum of the traffic obtained through network mirroring, while TT corresponds to the total traffic on the intranet. In Equation (2), Fx denotes the sum of the incoming and outgoing flows at node x. In the absence of micro-segmentation, traffic within the same subnet bypasses the router, rendering it unattainable for third-party capture. For example, if 80% of the traffic on a subnet was within the subnet and 20% was outside the subnet, the PoAE for that subnet would be 20%. With the implementation of micro-segmentation, the original subnet undergoes fragmentation into multiple new subnets. Each new subnet, except for the router, consists of a single node, necessitating that all traffic pass through the router. Consequently, the likelihood of attack exposure reaches 100% within this configuration.
The vulnerability to lateral attacks increases for nodes exhibiting a higher in-degree, while nodes with a greater out-degree experience more severe consequences following compromise. To quantify the concentration of connections within a node, two parameters are utilized: the in-degree aggregation coefficient (IdAC) and the out-degree aggregation coefficient (OdAC).
I d A C v = 2 × | { e j k } | N i × ( N i 1 ) ; v V , v j , v k N i , e j k A ,
O d A C v = 2 × | { e l m } | N o × ( N o 1 ) ; v V , v l , v m N o , e l m A .
The IdAC of a node is calculated using Equation (3), where Ni represents the set of predecessor nodes or in-degree nodes of the node. The term { e j k } denotes the number of directed edges connecting the in-degree nodes of a given node, thus indicating the degree of neighbourhood relationships between them.
Similarly, the OdAC of a node is calculated using Equation (4), where No represents the set of successor nodes or out-degree nodes of the node. The term { e l m } denotes the number of directed edges connecting the out-degree nodes of the node, reflecting the degree of neighbourhood relationship among them.
In this study, the IdAC and OdAC were utilized as metrics to quantify network aggregation. Both IdAC and OdAC range between 0 and 1, with larger values indicating greater network aggregation. By examining the combined IdAC and OdAC values for all nodes in a network, the difficulty of a lateral attack can be assessed. Notably, nodes with a clustering coefficient of 0 and a large degree value represent routers, whereas those with a clustering coefficient of 0 and a small degree value (less than or equal to 2) have only one neighboring node, typically another router. In a fully connected network, where all nodes have an aggregation coefficient of 1, the probability of a successful lateral attack is high. Table 3 presents the aggregation values for each node in Figure 6.
The impact of micro-segmentation on network connectivity was also assessed. Prior to micro-segmentation, a node directed edges to all hosts within the same subnet, while connections to hosts outside the subnet required gateway device traversal. Consequently, a subnet with n hosts had outbound and inbound degrees of n, resulting in n2 directed edges. With the implementation of micro-segmentation, direct host access was limited to the gateway device, resulting in each host asset having an outbound and inbound degree of 1. As a result, the number of directed edges reduced to 2n within the original subnet. This reduction in directed edges resulted in decreased network connectivity and increased difficulty for attackers to achieve their attack objectives on the intranet.

3.2. Enhanced Behavioural Profiling Algorithm

Following the deployment of micro-segmentation, comprehensive traffic flow analysis became possible. In relation to this, Kumar, A. et al. [30] analysed the advantages and disadvantages of the K-means algorithm. The article [31] discussed the potential of integrating spatio-temporal characteristics with external factors to enhance the efficacy of the experimental approach. Building upon this, we propose Algorithm 1, which utilizes historical traffic data to analyse asset access behaviour and detect abnormal traffic patterns. The algorithm incorporates a temporal dimension, which improves the detection of periodic bursts in normal traffic.
Algorithm 1 is utilized for the analysis of asset access behaviour and the identification of anomalous traffic patterns. The algorithm begins by dividing the asset’s traffic into inbound and outbound directions on a per-minute basis and extracting features to construct a feature vector. The dimensions of the features are determined by the number of intranet assets, where each dimension represents an intranet asset, and the vector captures the relationship between the asset’s traffic and other intranet assets at a given minute. The daily traffic is aggregated into a matrix, which represents the asset’s behaviour throughout the day. To process the data, continuous packet capture is employed to obtain a traffic characteristic vector for each minute of the asset over a month.
Given the relatively stable access relationships among intranet assets, the behaviour matrix often contains numerous zero entries. The presence of an excessively large volume of invalid messages within a system can significantly impact its efficiency and give rise to potential issues such as memory overflows [32]. Consequently, columns with all zeros are excluded to enhance efficiency and the non-zero columns are aggregated based on the counterpart’s IP address, resulting in the creation of multiple files named after the counterpart IP. Subsequently, a row-by-row cluster analysis is performed on these files using the DBSCAN algorithm to identify the cluster prime and calculate the noise points. Abnormal behaviour is considered only when there is abnormal traffic observed in both the incoming and outgoing directions, and a noise point is classified as an anomaly only when it occurs in an adjacent location.
By employing this algorithm, a more efficient and accurate method for detecting abnormal behaviour among intranet assets is provided.
Algorithm 1 Enhanced Behavioural Profiling Algorithm
Input: Intranet traffic captured separately by asset
Output: Anomalies in the behaviour of each intranet asset
 1:
while asseti in [“asset1”, “asset2”, “asset3”, …] do
 2:
   for  d a y in range(1, 30) do
 3:
     capture_traffic(asseti)
 4:
     separate_minute_traffic(asseti)
 5:
     separate_in_out_traffic(asseti)
 6:
     analyze_traffic(asseti)
 7:
     matrixi_ d a y = []
 8:
     for minute in range(1, 2880) do
 9:
        matrixi_ d a y _row = []
10:
        matrixi_ d a y _row +=
        asseti.get_traffic_vector(minute)
11:
        matrixi_ d a y .append(matrixi_ d a y _row)
12:
     end for
13:
   end for
14:
   matrixi_without_zeros = []
15:
   for column in range(len(matrixi[0])) do
16:
     for row in range(len(matrixi)) do
17:
        if sum{matrixi[row][column]} != 0 then
18:
          for row in range(len(matrixi)) do
19:
             matrixi_without_zeros.append
             ([matrixi[row][column]])
20:
          end for
21:
        end if
22:
     end for
23:
   end for
24:
   for columnk in range(len(matrixi_without_zeros[0])) do
25:
     for columnj in range(k,len(matrixi_without_zeros[0])) do
26:
        if columnk[0] == columenj[0] then
27:
          move columnj to the next columnk
28:
        end if
29:
     end for
30:
     generate a new file, named with PeerIP
31:
   end for
32:
   for filename in PeerIP do
33:
     dbscan = DBSCAN(min_samples=2)
34:
     for row in 2880 do
35:
        find noise point
36:
        if presence of other noise points in adjacent locations then
37:
          mark noise points as anomalies
38:
        end if
39:
     end for
40:
   end for
41:
end while

4. Comparison Algorithms

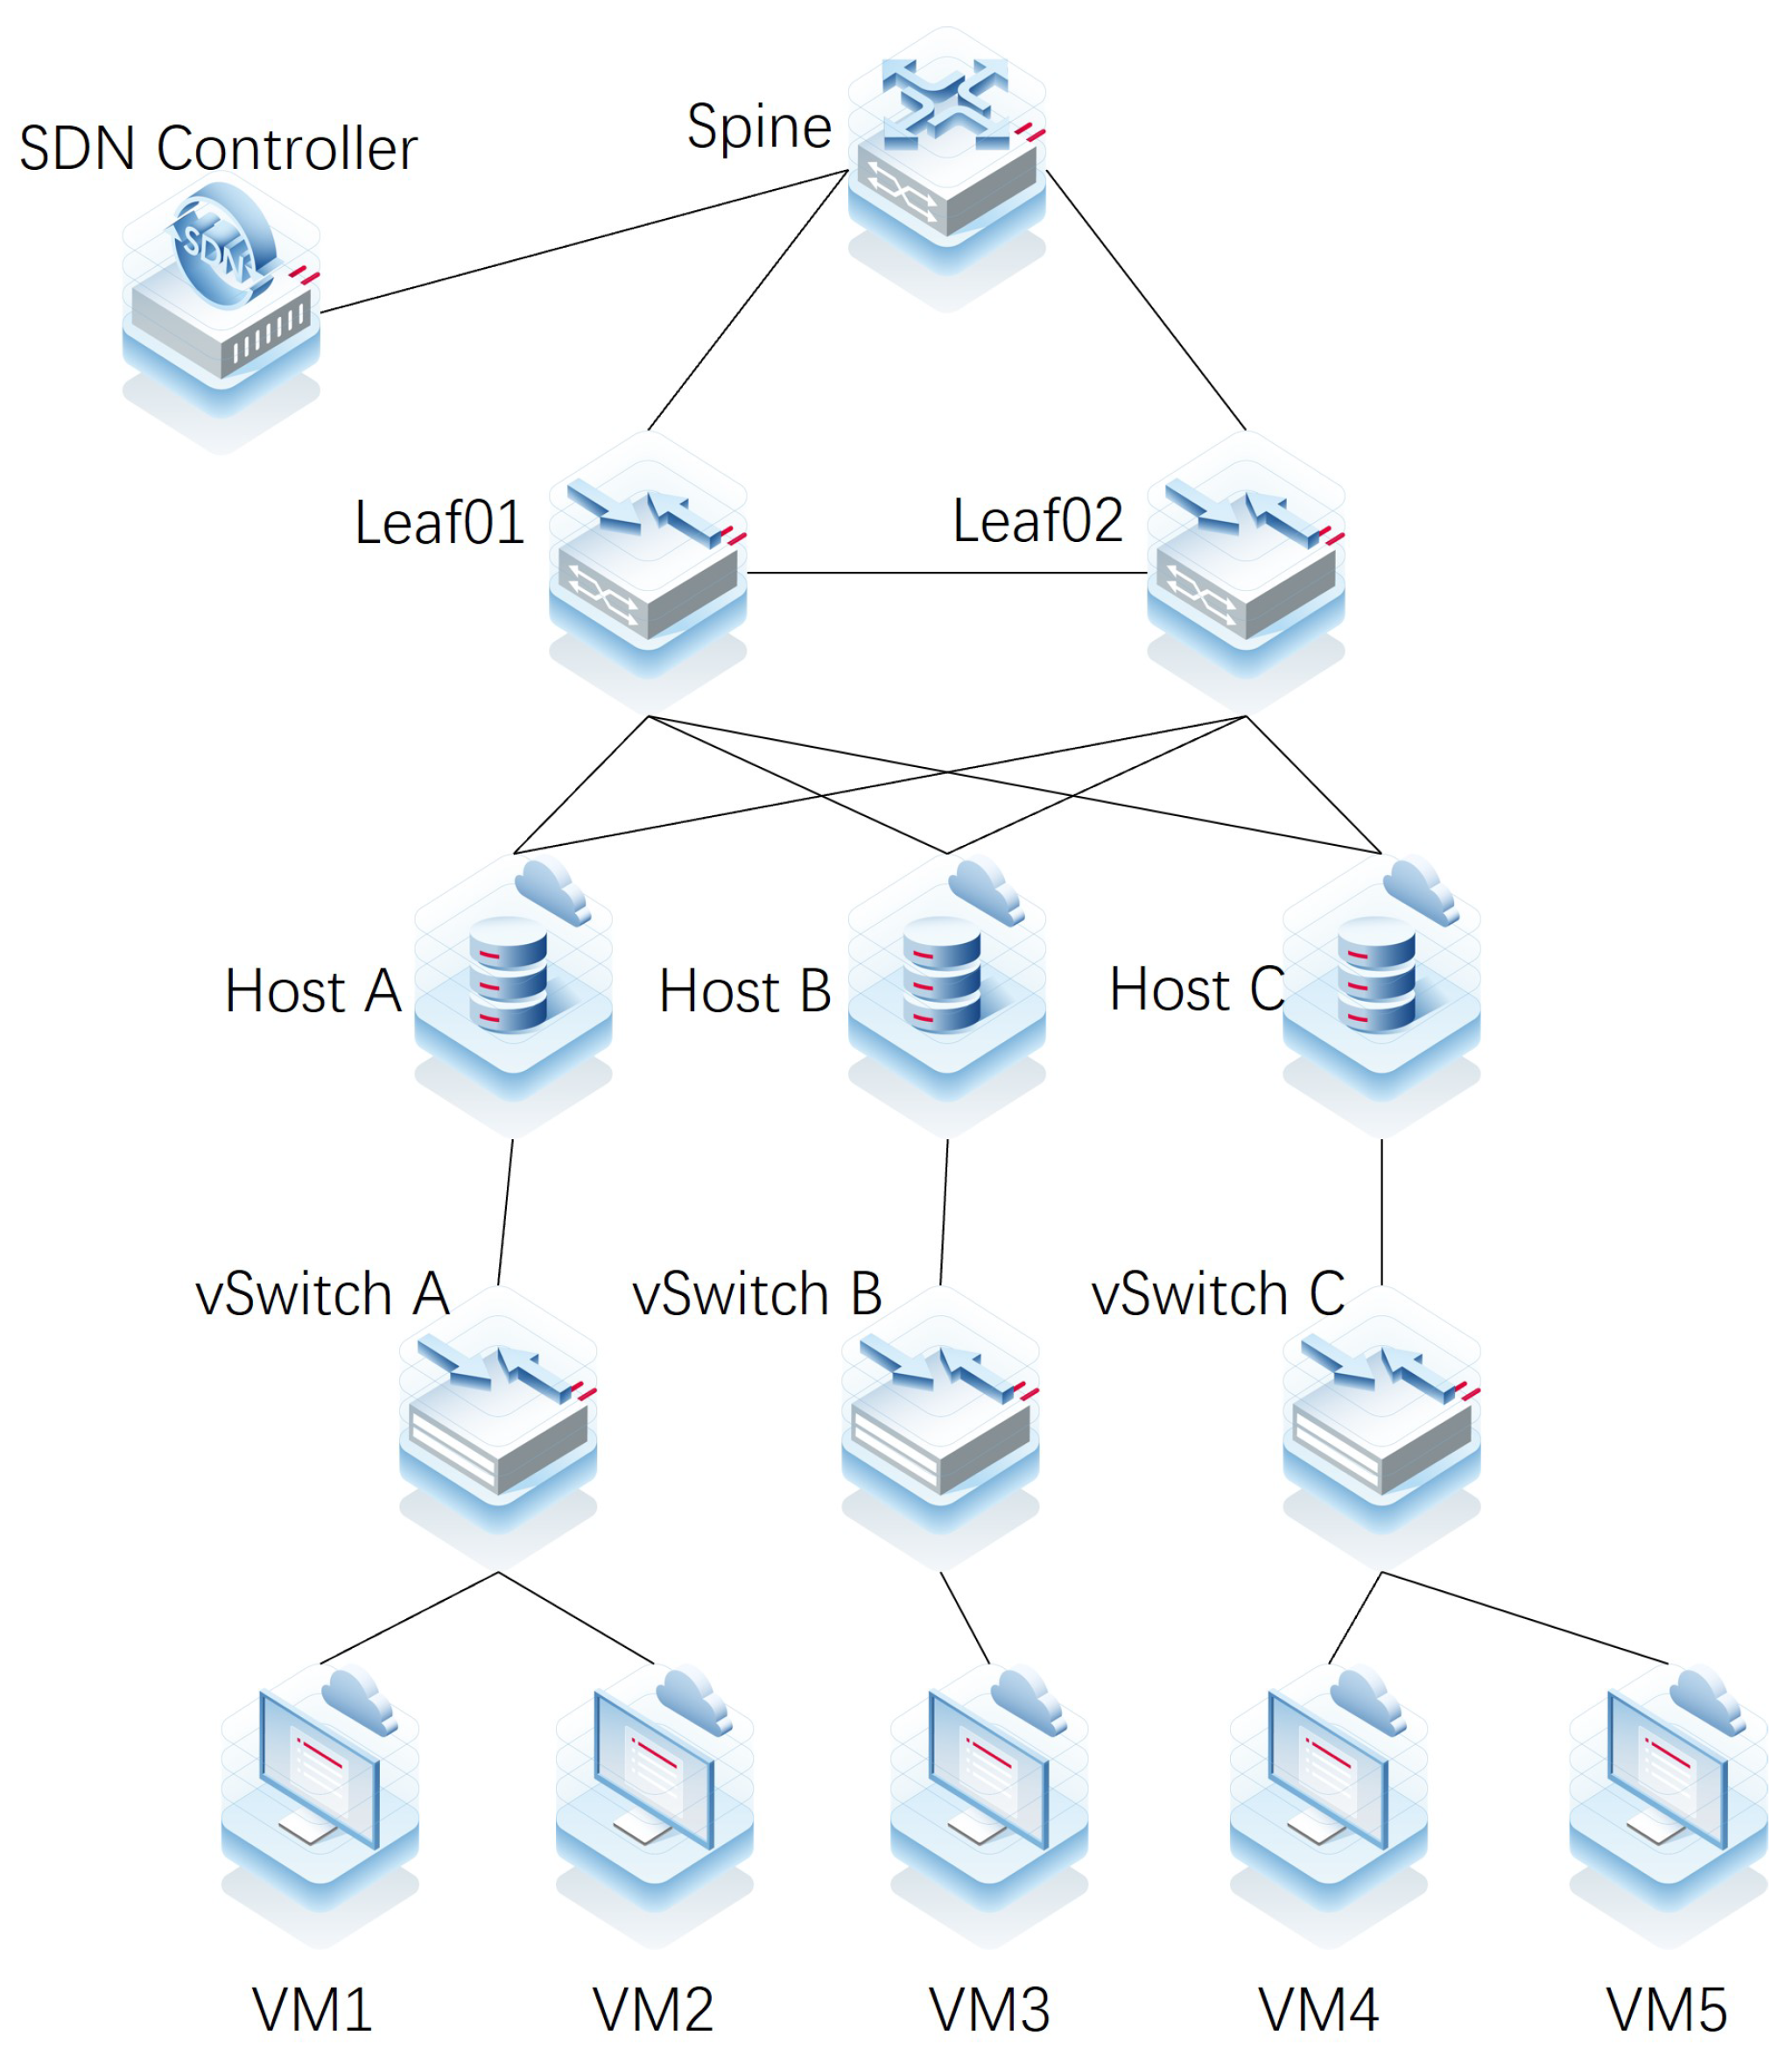
4.1. Experimental Topology

The model was validated in a private cloud data centre, which had a topology as depicted in Figure 7.
The data centre’s SDN network architecture comprised an SDN controller, a Spine node switch, and two-Leaf node switches. A distributed VxLAN deployment model was utilized for the SDN network, where the Leaf node switches performed the dual roles of encapsulating VxLAN messages and functioning as Layer 3 gateways to VxLAN. The private cloud data centre’s physical servers served as host nodes for the cloud platform, with each host accommodating multiple virtual machines. To enable virtualization, a virtual switch was created at each host node using virtualization software. However, due to the use of different vendors for the cloud platform and the SDN network, extending the SDN network to the virtual network of the cloud platform was not feasible. It is important to note that Figure 7 only shows a subset of the network assets present in the data centre.
In the context of ZTA, auditing traffic between virtual machines is of paramount importance. In pursuit of this objective, we implemented a traffic mirroring mechanism, whereby the network traffic of the intranet was duplicated and analysed by a situational awareness system, enabling prompt identification of anomalies in the intranet. However, the efficacy of situational awareness in detecting abnormal traffic is contingent on the integrity of the traffic mirror, which must be positioned as close as possible to the point of traffic origination, i.e., close to the virtual machine. In our environment, the vSwitch does not provide the necessary mirroring capabilities, and using Open vSwitch (http://www.openvswitch.org) to mirror traffic on each downlink port would compromise the host NIC’s performance and require configuration on each vSwitch.
Hence, we elected to perform traffic mirroring at the Leaf nodes, necessitating minimal configuration at the two Leaf nodes and ensuring that the traffic mirroring setup would not need modification as the private cloud platform scales up. However, this approach is less comprehensive than port mirroring directly on the vSwitch, as it does not capture all traffic, such as that between VM1 and VM2 belonging to the same VLAN and exchanging traffic via vSwitch A.

4.2. Business Interruption Time

Although the utilization of VxLAN technology and VNI isolation in the data centre provided some level of security, complete visibility of network traffic within the data centre was not achieved. Specifically, traffic within the same tenant remained invisible. To address this issue, modifying the VNI would have been necessary, which would have entailed changing the service addresses of the virtual machines, configuring new routing entries, and informing end users of the new service addresses. Such modifications could cause significant business disruptions lasting from minutes to hours.
In an enterprise setting, the implementation of micro-segmentation poses significant challenges, hindering its widespread adoption, as highlighted in previous research [19]. These challenges primarily pertain to the configuration, operations, and maintenance aspects of micro-segmentation, as well as the required outage windows. This study evaluates the implementation challenges of micro-segmentation within an existing business environment, where virtualized servers are deployed, offering flexibility in configuring CPU, memory, disk space, and network cards. Each virtualized server is equipped with at least one virtual network card connected to a vSwitch. A virtual NIC assigned to a virtual machine is associated with a port group that possesses a VLAN ID. Packets transmitted by the virtual machine carry the VLAN ID, and the vSwitch directly forwards packets if the destination address is within the same VLAN as the source address. Otherwise, the packet is forwarded to an upper-layer network device, namely a VTEP switch. The VTEP switch then forwards packets either directly to the corresponding interface within the same VNI based on the VLAN-VxLAN mapping relationship or to the L3 VxLAN Gateway if the source and target are not within the same VNI. In our experimental setup, the VTEP switch also serves as the L3 VxLAN Gateway.
The study presented herein details a three-stage process for the implementation of micro-segmentation. The initial stage consisted of planning the VLAN-VxLAN mapping relationship, which was subsequently disseminated to each VTEP switch via the SDN controller. The second stage involved modifying the global configuration of the vSwitch to incorporate the newly designed VLAN. Finally, in the third stage, the port group ID linked to the virtual NIC on the cloud platform management software was changed, while remaining transparent to the application’s network configuration. Nevertheless, this alteration requires careful consideration of operational implementation difficulties and service interruptions. The modification of the port group results in a brief service disruption, which was measured multiple times in our analysis. The disruption duration was recorded to be less than 1 s, with an average packet loss of 1. Figure 8 illustrates a real-time network reachability screenshot of the asset with IP 10.8.6.122 during the micro-segmentation transformation.

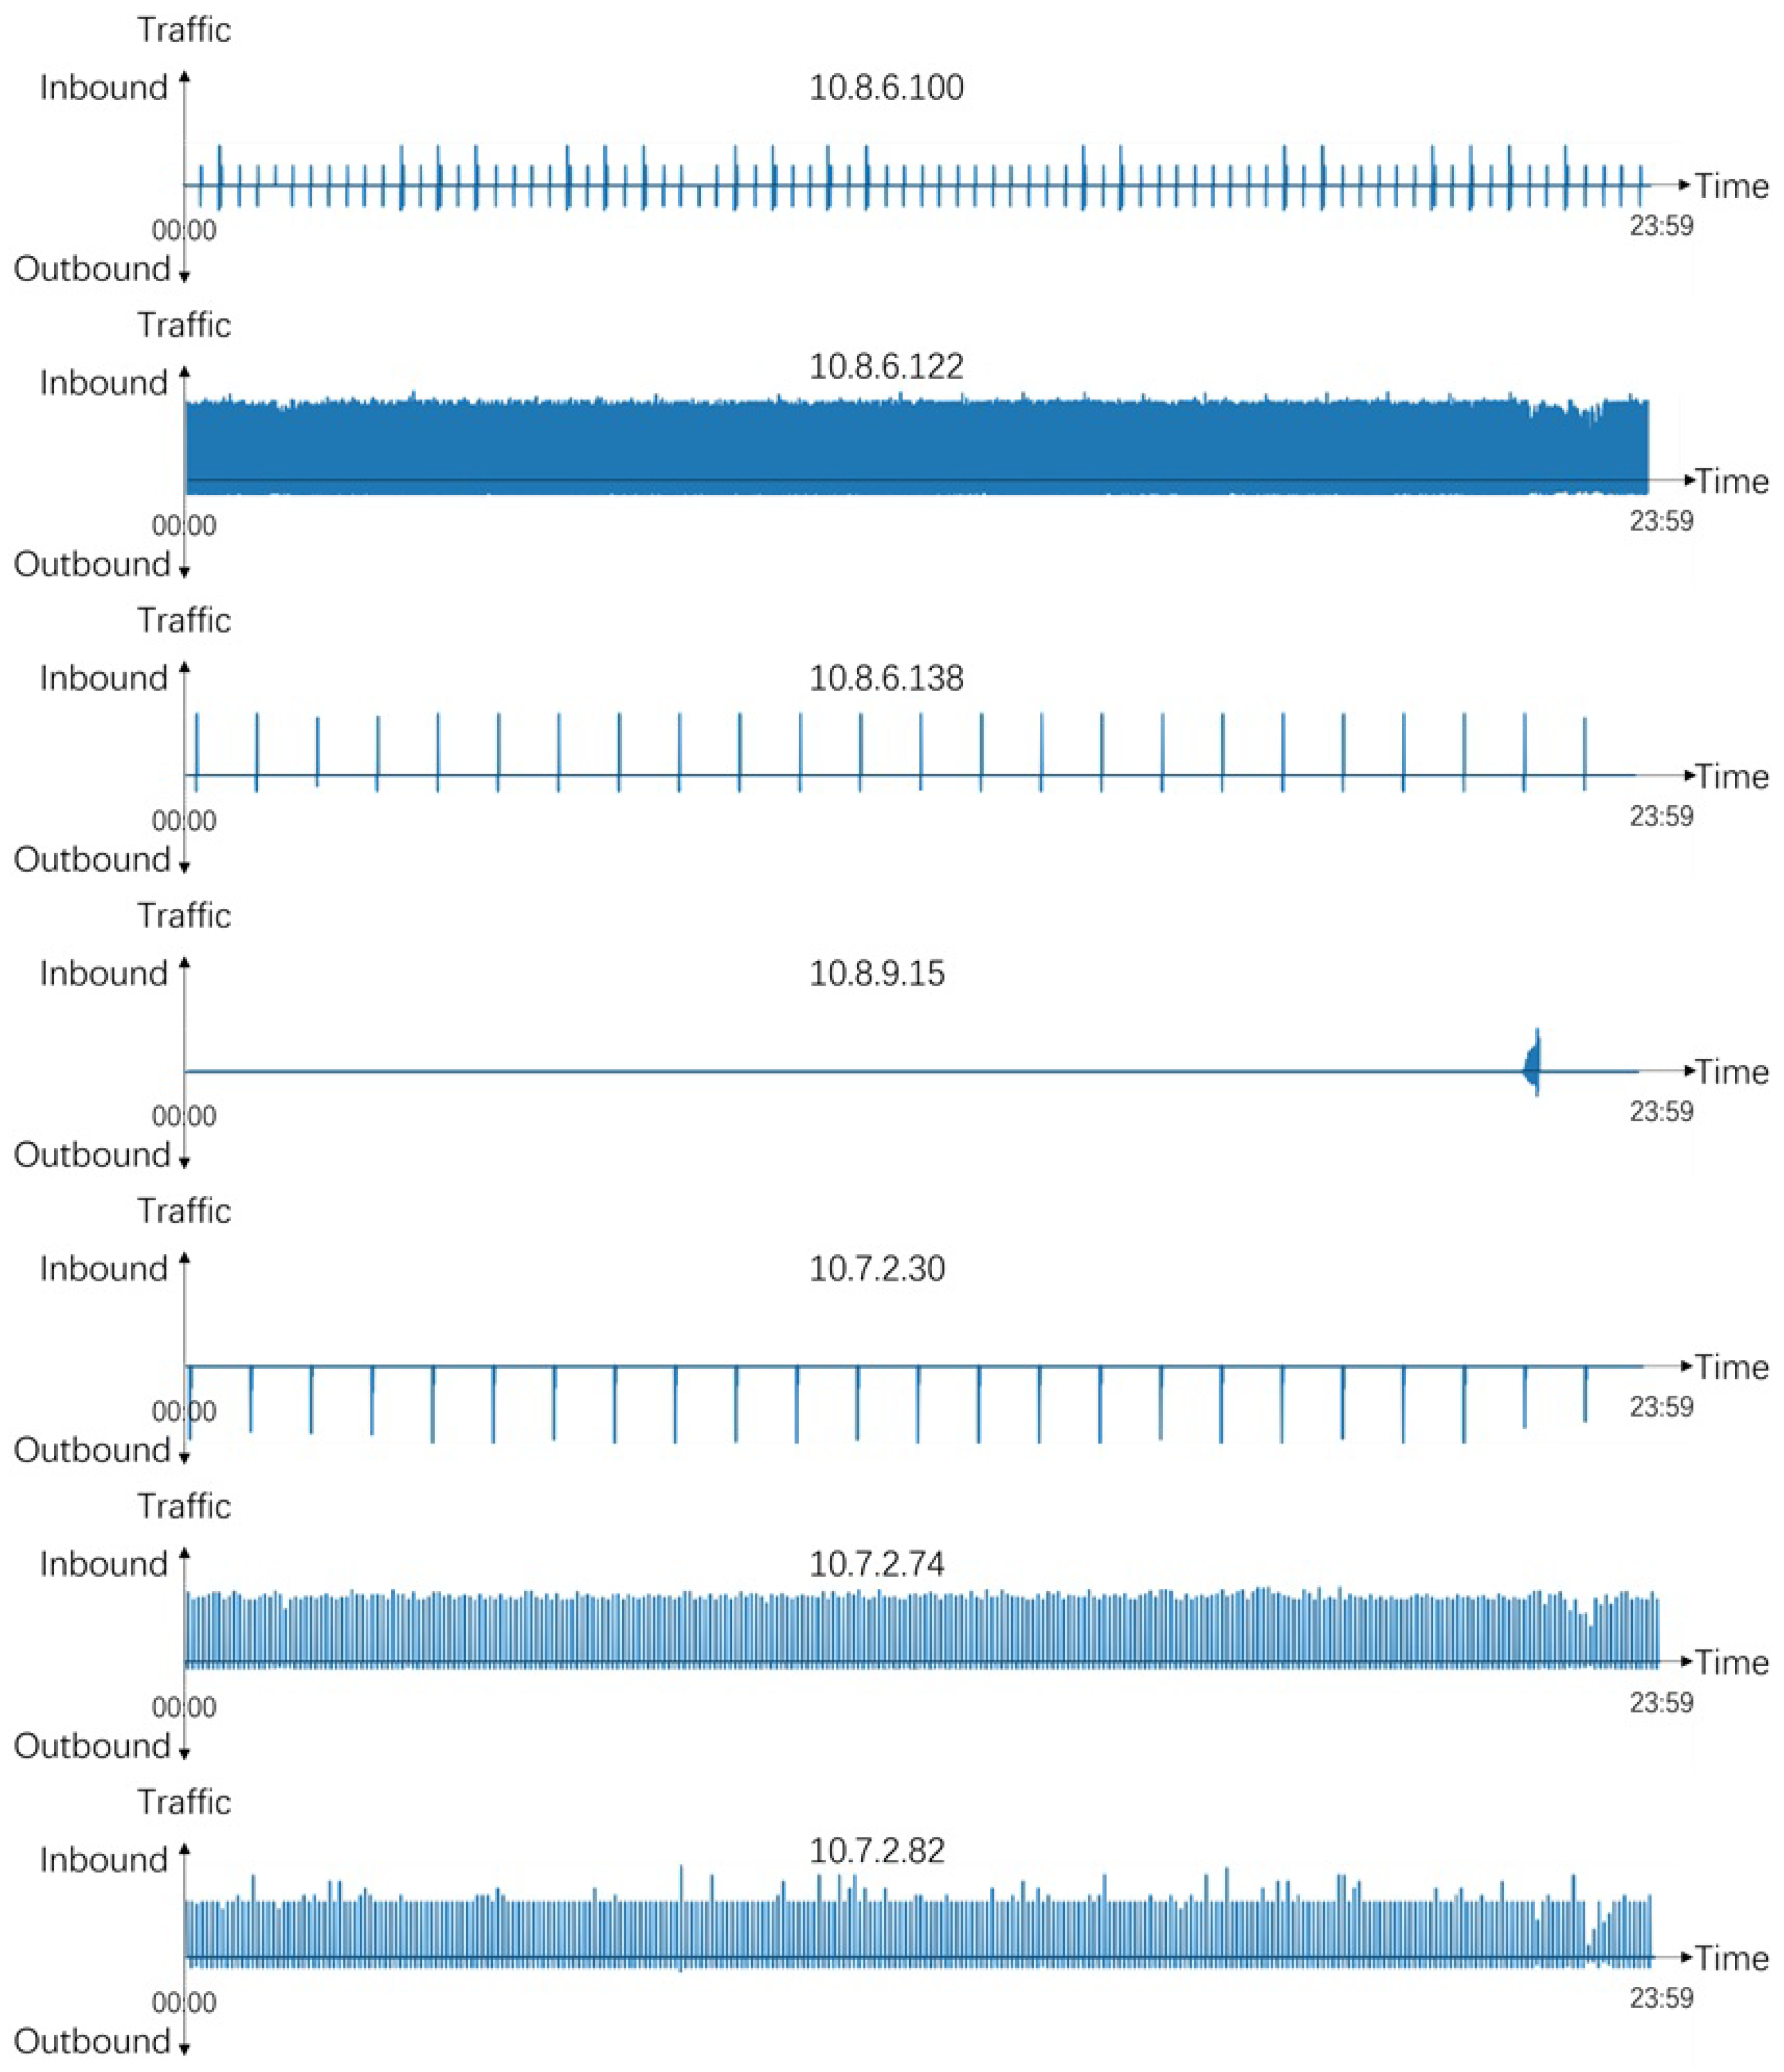
4.3. Asset Correlation Analysis

Our micro-segmentation model was used to analyse traffic within the data centre. We conducted a survivability scan of the data centre intranet assets, and after manual confirmation, there were a total of 938 assets, of which the more critical 9 assets were selected for packet capture analysis. The IPs of the 9 assets and the main access relationships are shown in Table 4.
Assets 10.8.6.122, 10.8.6.124, 10.8.6.126, 10.8.6.127, and 10.8.6.129 were all cluster hosts within a business, with the main data traffic coming from within the cluster. Assets 10.8.6.123 and 10.8.6.125 were hosts for the cluster’s external distribution service, with some internal traffic from the cluster. In addition to 10.8.6.130 was a shared database that needed to synchronize data with the database on the 10.7.2.0/24 network segment at the start of each hour. This asset experienced a significant burst of traffic during each full hour. Finally, asset 10.7.1.194 functioned as an IoT server, communicating not only with servers on the same network segment but also with the IoT endpoint network segment at 10.255.73.0/24.
This study is focused on intranet assets and assumes that a host failure on the intranet will generate anomalous traffic. To detect anomalous traffic, it is necessary to first learn about the behaviour of intranet assets and create a behavioural portrait of them. Intranet assets were sorted and 936 assets with different IPs were identified. Continuous packet capture analysis of the assets in Table 4 was carried out and the capture files were truncated at 1 min intervals, generating 1440 pcap files per day. The inbound and outbound traffic of each asset was separated, split into two segments, and then aggregated by peer IP to form two vectors of 936 eigenvalues. For example, if 10.8.6.130 was accessed only by 10.8.6.122 and 10.8.6.125 at 14:04 on 16 February 2023 with 24 KB and 198 KB of traffic in the inbound direction, respectively, then the traffic for 10.8.6.130 at that time point was converted into a vector (0, 0, …, 24, 0, 0, 198, 0, …, 0), with the locations of 24 and 198 corresponding to 10.8.6.122 and 10.8.6.125 in the asset table. The daily traffic for each asset was parsed to form a 2880 × 936 matrix, which represents the variation in intranet traffic for that asset over a day. By continuously training the model, a behavioural portrait of each intranet asset can be created.
Understanding the traffic relationships between intranet assets has been a crucial objective of our analysis. To optimize efficiency, we have limited our packet capture to the initial 84 bytes of message content, which includes important parameters such as source address, destination address, source port, destination port, protocol, and payload length. In order to avoid overfitting, we have simulated attacks to augment our capture data. For instance, we have simulated a periodic data leak in the traffic associated with 10.8.6.130 during instances of manual data synchronization. Additionally, we have subjected the target asset to sporadic large file uploads to simulate anomalous bursts of traffic, while also conducting simulated intranet scan attacks using nmap or fscan, as well as hourly timed scans using 10.8.6.138. To assess the susceptibility of assets to vulnerabilities, we have utilized 10.8.9.15, our vulnerability scanning appliance, to conduct regular periodic scans every Friday night. Our study has focused on the traffic relationships between intranet assets, and hence we have not examined the contents of message payloads.
The analysis of the traffic relationship between asset 10.8.6.130 and other assets is presented in Figure 9, which illustrates the flow over the course of a day. The horizontal axis denotes the time dimension of the day, while the vertical axis represents the flow, with inbound directional flow indicated by values greater than 0 and outbound directional flow indicated by values less than 0. Asset 10.8.6.130 is utilized as an example to demonstrate the traffic flow.
The graphical depiction in Figure 9 reveals a pattern of lower network traffic volatility between the intranet asset 10.8.6.130 and its counterparts. Notably, several of these counterparts exhibit a discernible cyclicality. This traffic characteristic is indicative of a shared attribute, with the majority of internal assets found within a typical data centre.
The primary objective of our experiments was to promptly identify intranet assets exhibiting anomalous behaviour, necessitating an initial comprehension of their typical behaviour. Accordingly, we established a rudimentary model delineating the traffic relationship between the asset of focus and other intranet assets. In particular, we observed apparent periodic traffic surges resulting from data synchronisation, data backup, and other analogous events. To scrutinize the traffic in minute detail, we generated two traffic records for each minute, recording the inbound and outbound traffic flows to and from the asset under consideration and other intranet assets, respectively. This traffic was mirrored to the nearest VTEP switch’s traffic analysis device, and after pre-processing, machine learning was performed on the data to obtain an asset traffic profile. Comparisons between networks with and without micro-segmentation were conducted.
Subsequently, we established differential segments for multiple assets and monitored them continuously for a certain duration. Table 5 enumerates the maximum and minimum flow values for each asset within a day, along with the number of assets they have flows with, while Table 6 displays the expected total flows in both inbound and outbound directions for each asset in a day, as well as the variance after normalisation. Table 7 and Table 8 represent the data before the implementation of micro-segmentation.
Table 5 provides evidence of the effects of micro-segmentation on the behaviour of intranet assets. Specifically, it shows that, with the exception of 10.7.1.194, the behaviour of assets becomes more predictable after the implementation of micro-segmentation, as evidenced by the relatively small range of fluctuations in the number of peer assets generating traffic. This result suggests that micro-segmentation has effectively stabilized the behaviour of these assets. In contrast, 10.7.1.194, a face recognition server with distributed terminals across the campus, exhibits a higher level of traffic variability during the winter break when the number of terminals is reduced to 1/4 of the peak and with less than 1/60th of the peak face recognition transmission data. The traffic data presented in Table 7 for asset 10.7.1.194 is devoid of the winter break data, and as such, it reflects a similar level of stability to other intranet assets.
Upon comparing the two datasets, it is evident that there was an increase in the total amount of traffic visible for all assets after the implementation of micro-segmentation. The increase in traffic visibility is dependent on the type of business traffic associated with the asset, where a greater amount of traffic within the same segment before micro-segregation leads to a higher increase in visibility traffic after micro-segregation. Specifically, the visibility traffic of asset 10.8.6.129 increased from approximately 210 KB to approximately 13,400 KB, a growth of approximately 63.5 times, while 10.7.1.194 only increased by 27% due to most of its traffic being cross-segment traffic. As micro-segmentation identified all traffic, the PoAE after micro-segmentation was 100%, and the PoAE before micro-segmentation can be calculated as the ratio of traffic before micro-segmentation to traffic after micro-segmentation. The increase in PoAE for each asset is shown in Figure 10.
The comparison of data before and after micro-segmentation revealed a significant increase in traffic from other assets to the target asset after the implementation of micro-segmentation. These assets were already communicating with the target asset prior to micro-segmentation, but their traffic was not captured. The set of peer assets analysed before micro-segmentation, denoted as Au, was found to be a subset of the set of peer assets analysed after micro-segmentation, denoted as Aw. For example, asset 10.8.6.130 had three communicating assets before micro-segmentation, and at most eleven assets, including the original three, after micro-segmentation. This indicates a decrease in the total degree of the asset. The effectiveness of this degree reduction is demonstrated in Figure 11, where the total maximum visible degree decreased.

4.4. Asset Abnormal Behaviour Detection

Using the KMEANS algorithm proposed by Jayasinghe, U. et al. [17], we conducted an analysis of the traffic per minute for nine assets over one month, resulting in 4772 outliers being detected out of a total of 777,600 data with 728 million data points. However, upon examining these anomalies, several issues were observed. Firstly, the algorithm’s automatic determination of the number of clusters through its boundary function is computationally slow. Secondly, the algorithm’s high recognition rate for bursty traffic changes may lead to the aggregation of these data points into a cluster, causing them to be missed during anomaly detection, which is a major factor contributing to the lower-than-expected detection rate. Thirdly, periodic bursts of traffic may lead to false positives. Fourthly, the algorithm’s identification of points with significantly lower traffic than the cluster’s prime as anomalies may result in the false detection of points that do not exceed the expected traffic level.
To alleviate the limitations of the KMEANS algorithm, an improved algorithm has been developed to profile asset behaviour in the context of network traffic analysis. The proposed approach utilizes DBSCAN for noise point calculation and anomaly detection, thereby reducing the computational complexity associated with the algorithm. Additionally, a time dimension has been incorporated into the analysis by aggregating data across different dates based on the opposite end’s address. This integration of a time dimension enables the detection of anomalies at specific times across different dates, mitigating the issue of missed anomalies resulting from prolonged traffic bursts. Notably, the inclusion of lateral clustering enhances the algorithm’s capability to accurately identify periodic traffic patterns. Leveraging this enhanced algorithm, a comprehensive analysis of historical traffic for the nine assets was conducted, leading to the identification of 33,916 anomalous data points that warranted further investigation.
The investigation of anomalous behaviour on the intranet asset 10.8.6.122 yielded 2551 anomalies, with 2386 of those being concentrated on a subset of intranet assets, namely 10.8.6.123, 10.8.6.124, 10.8.6.125, 10.8.6.126, 10.8.6.127, and 10.8.6.129. Further analysis of these peer assets showed that most of their anomalies were related to 10.8.6.122. Subsequent examination of the anomalous data identified 1905 instances that were present on both 10.8.6.122 and the peer assets. Since these anomalies occurred on at least two assets simultaneously, it indicated abnormal communication between the pair at the time of occurrence. Of the 1905 anomalies, 223 were observed at multiple assets and locations, and these were found to be concentrated in time periods. For example, anomalies were detected on 10.8.6.123 and 10.8.6.124 around 9:00 a.m. on a particular day, with both originating from 10.8.6.122. It is noteworthy that all of the anomalies were correctly identified.
To illustrate the impact of the time dimension on periodic traffic analysis, consider the example of asset 10.8.6.130, which exhibits sporadic traffic for only 2 min within an hour when communicating with 10.7.2.30. When utilizing the KMEANS algorithm, these two minutes of traffic might be classified as anomalous. However, with the incorporation of the time dimension in our algorithm, this behaviour can be accurately identified as normal. Additionally, our algorithm can effectively distinguish non-periodic burst traffic, which is predefined as anomalous, enhancing the accuracy of anomaly detection.
Upon conducting a thorough analysis of the anomalies individually, we achieved an accuracy rate exceeding 86%. The occurrence of false alarms was primarily concentrated among assets demonstrating irregular behaviours. For instance, asset 10.7.1.194 had an IP address of 10.255.73.146 on the opposite end, which exhibited minimal regular traffic at consistent time points each day and fluctuating data. Further investigation through log queries revealed that this asset was an IoT face recognition terminal, which did not exhibit any attack behaviour. The fluctuation in data was attributed to network instability. The terminal temporarily stored data locally and then uploaded them to the server at 10.7.1.194 when the network conditions were stable.
These findings highlight the effectiveness of our algorithm in accurately discerning anomalies, particularly when considering the time dimension and differentiating irregular behaviour from genuine threats. By leveraging this approach, we have achieved a high accuracy rate in anomaly detection, ensuring the reliability and robustness of our algorithm in practical scenarios.
We implemented our algorithm on 20 assets within a campus network to monitor their traffic behaviour throughout the duration of a network security attack and defense drill. The performance of our approach was compared with the existing security protection system deployed on the campus network. During the drill, an attacker successfully breached a monitored server in the internal network using a near-source attack. The attack method was highly covert, resulting in the generation of only a single log entry within the traditional security log. Due to the high volume of logs produced during the drill, the defense personnel did not detect this critical log entry in time, thereby failing to identify the attacker.
However, by applying our algorithmic model, we were able to detect abnormal behaviour in the compromised internal network asset. When the attacker attempted lateral movements within the internal network, our system promptly identified and blocked the malicious activity, effectively preventing further intrusion. Our timely response and appropriate countermeasures were recognized and commended by the referee team overseeing the drill. This incident demonstrates the efficacy of our micro-segmentation architecture and asset behaviour algorithm in countering internal threats and addressing complex cyber-attacks.

5. Conclusions

The “Zero Trust Architecture" represents a novel cybersecurity framework that emphasizes the continuous auditing of all assets within cyberspace. Achieving comprehensive visibility of network traffic, devoid of any blind spots, is a fundamental requirement for this approach, and it can be accomplished through the implementation of micro-segmentation. This research article investigates two models of micro-segmentation, namely network micro-segmentation and host micro-segmentation. While network micro-segmentation offers certain advantages in terms of resource consumption and program compatibility, it is susceptible to audit blind spots and does not facilitate real-time services. To mitigate these limitations, this paper introduces a micro-segmentation technique based on VLAN-VxLAN mapping, which is protocol-independent and ensures auditing of all network traffic. Moreover, this article quantifies the network micro-segmentation approach in terms of network aggregation and traffic visibility.
Furthermore, this paper presents an enhanced algorithm for profiling asset behaviour, which is specifically tailored to the implementation of micro-segmentation. This algorithm effectively identifies abnormal behaviour exhibited by intranet assets, offering valuable insights for prompt disposal of such assets once their abnormal behaviour is detected. By leveraging the principles of differential segmentation and the proposed asset behaviour profiling algorithm, organizations can efficiently manage and mitigate potential risks arising from intranet assets.
Through this research, we aim to contribute to the advancement of cybersecurity practices by addressing the challenges associated with network visibility, micro-segmentation, and asset behaviour analysis. The proposed solutions provide a foundation for the development of more robust and efficient cybersecurity systems in the context of the evolving threat landscape.

Author Contributions

Writing—original draft, D.L.; funding acquisition, Z.Y.; project administration, S.Y. (Siyang Yu); writing—review & editing, M.D.; methodology, S.Y. (Shenghong Yang). All authors have read and agreed to the published version of the manuscript.

Funding

This work was supported in part by the China University Industry-University-Research Innovation Fund-Cloud University Project (2022MU089), in part by the Shenzhen Science and Technology Program under Grant JCYJ20210324141208020, in part by the Project Supported by Scientific Research Fund of Hunan Provincial Education Department (22A0592), in part by the Project supported by Provincial Natural Science Foundation of Hunan (2023JJ30083), and in part by the Program of National Natural Science Foundation of China (General Program No. 62472151).

Data Availability Statement

The data presented in this study is available on request from the corresponding author.

Conflicts of Interest

The authors declare that they have no known competing financial interests or personal relationships that could have appeared to influence the work reported in this paper.

References

  1. Li, K.; Tang, X.; Li, K. Energy-Efficient Stochastic Task Scheduling on Heterogeneous Computing Systems. IEEE Trans. Parallel Distrib. Syst. 2014, 25, 2867–2876. [Google Scholar] [CrossRef]
  2. Liu, C.; Li, K.; Li, K.; Buyya, R. A New Service Mechanism for Profit Optimizations of a Cloud Provider and Its Users. IEEE Trans. Cloud Comput. 2021, 9, 14–26. [Google Scholar] [CrossRef]
  3. Liu, S.; Liu, J.; Wang, H.; Xian, M. Research on the Development of Cloud Computing. In Proceedings of the 2020 International Conference on Computer Information and Big Data Applications (CIBDA), Guiyang, China, 17–19 April 2020; pp. 212–215. [Google Scholar] [CrossRef]
  4. CAICT. Cloud Computing White Paper; Technical Report; China Academy of Information and Communications Technology: Beijing, China; Available online: http://www.caict.ac.cn/kxyj/qwfb/bps/202407/t20240723_488241.htm (accessed on 1 September 2024).
  5. Jericho Forum. Jericho Forum Commandments Version 1.2; Technical Report; Jericho Forum. 2007. Available online: https://collaboration.opengroup.org/jericho/commandments_v1.2.pdf (accessed on 1 September 2024).
  6. Kindervag, J.; Balaouras, S.; Mak, K.; Blackborow, J. No more chewy centers: The zero trust model of information security. Forrester 2016, 23, 18. [Google Scholar]
  7. Wylde, A. Zero trust: Never trust, always verify. In Proceedings of the 2021 International Conference on Cyber Situational Awareness, Data Analytics and Assessment (CyberSA), Dublin, Ireland, 14–18 June 2021; pp. 1–4. [Google Scholar] [CrossRef]
  8. Gutmann, A.; Renaud, K.; Maguire, J.; Mayer, P.; Volkamer, M.; Matsuura, K.; Mullerquade, J. ZETA—Zero-Trust Authentication: Relying on Innate Human Ability, not Technology. In Proceedings of the IEEE European Symposium on Security and Privacy (EuroS&P), Saarbruecken, Germany, 21–24 March 2016; pp. 357–371. [Google Scholar] [CrossRef]
  9. Li, D.; Hu, Y.; Xiao, G.; Duan, M.; Li, K. An active defense model based on situational awareness and firewalls. Concurr. Comput. Pract. Exp. 2023, 35, 1. [Google Scholar] [CrossRef]
  10. Eidle, D.; Ni, S.Y.; DeCusatis, C.; Sager, A. Autonomic security for zero trust networks. In Proceedings of the 2017 IEEE 8th Annual Ubiquitous Computing, Electronics and Mobile Communication Conference (UEMCON), New York, NY, USA, 19–21 October 2017; pp. 288–293. [Google Scholar] [CrossRef]
  11. DeCusatis, C.; Liengtiraphan, P.; Sager, A.; Pinelli, M. Implementing Zero Trust Cloud Networks with Transport Access Control and First Packet Authentication. In Proceedings of the 2016 IEEE International Conference on Smart Cloud (SmartCloud), New York, NY, USA, 18–20 November 2016; pp. 5–10. [Google Scholar] [CrossRef]
  12. Zhang, Z.; Wang, R.; Ding, R.; Gu, Y. Unravel Anomalies: An End-to-End Seasonal-Trend Decomposition Approach for Time Series Anomaly Detection. In Proceedings of the ICASSP 2024—IEEE International Conference on Acoustics, Speech and Signal Processing (ICASSP), Seoul, Republic of Korea, 14–19 April 2024; pp. 5415–5419. [Google Scholar] [CrossRef]
  13. Singh, O.P.; Anand, A.; Agrawal, A.K.; Singh, A.K. Electronic Health Data Security in the Internet of Things through Watermarking: An Introduction. IEEE Internet Things Mag. 2022, 5, 55–58. [Google Scholar] [CrossRef]
  14. Hussain, S.; Chaudhry, S.A. Comments on “Biometrics-Based Privacy-Preserving User Authentication Scheme for Cloud-Based Industrial Internet of Things Deployment”. IEEE Internet Things J. 2019, 6, 10936–10940. [Google Scholar] [CrossRef]
  15. Syed, N.F.; Shah, S.W.; Shaghaghi, A.; Anwar, A.; Baig, Z.; Doss, R. Zero Trust Architecture (ZTA): A Comprehensive Survey. IEEE Access 2022, 10, 57143–57179. [Google Scholar] [CrossRef]
  16. He, Y.; Huang, D.; Chen, L.; Ni, Y.; Ma, X. A survey on zero trust architecture: Challenges and future trends. Wirel. Commun. Mob. Comput. 2022, 2022, 6476274. [Google Scholar] [CrossRef]
  17. Jayasinghe, U.; Lee, G.M.; Um, T.W.; Shi, Q. Machine Learning Based Trust Computational Model for IoT Services. IEEE Trans. Sustain. Comput. 2019, 4, 39–52. [Google Scholar] [CrossRef]
  18. Lim, W.; Yong, K.S.C.; Lau, B.T.; Tan, C.C.L. Future of generative adversarial networks (GAN) for anomaly detection in network security: A review. Comput. Secur. 2024, 139, 103733. [Google Scholar] [CrossRef]
  19. Klein, D. Micro-segmentation: Securing complex cloud environments. Netw. Secur. 2019, 2019, 6–10. [Google Scholar] [CrossRef]
  20. A Al-Ofeishat, H.; Alshorman, R. Build a Secure Network using Segmentation and Micro-segmentation Techniques. Int. J. Comput. Digit. Syst. 2023, 16, 1499–1508. [Google Scholar] [CrossRef]
  21. Ni, L.; Cui, H.; Wang, M.; Zhi, D.; Han, K.; Kou, W. Construction of Data Center Security System Based on Micro Isolation under Zero Trust Architecture. In Proceedings of the 2022 2nd Asia-Pacific Conference on Communications Technology and Computer Science (ACCTCS), Shenyang, China, 25–27 February 2022; pp. 113–116. [Google Scholar] [CrossRef]
  22. Kang, C.; Li, Y.; Gao, L.; Li, X.; Wang, L.; Gao, Y. Automatic Generation Model of Host Micro-Segmentation in Distribution Master Station Based on Distributed Intrusion Detection. In Proceedings of the 2022 2nd International Conference on Computer Science, Electronic Information Engineering and Intelligent Control Technology (CEI), Nanjing, China, 23–25 September 2022; pp. 54–59. [Google Scholar] [CrossRef]
  23. Sheikh, N.; Pawar, M.; Lawrence, V. Zero trust using Network Micro Segmentation. In Proceedings of the IEEE INFOCOM 2021—IEEE Conference on Computer Communications Workshops (INFOCOM WKSHPS), Vancouver, BC, Canada, 10–13 May 2021; pp. 1–6. [Google Scholar] [CrossRef]
  24. Basta, N.; Ikram, M.; Kaafar, M.A.; Walker, A. Towards a Zero-Trust Micro-segmentation Network Security Strategy: An Evaluation Framework. In Proceedings of the NOMS 2022-2022 IEEE/IFIP Network Operations and Management Symposium, Budapest, Hungary, 25–29 April 2022; pp. 1–7. [Google Scholar] [CrossRef]
  25. Zhang, Y.; Pan, T.; Zheng, Y.; Song, E.; Huang, T.; Liu, Y. VXLAN-based INT: In-band Network Telemetry for Overlay Network Monitoring. In Proceedings of the IEEE INFOCOM 2021—IEEE Conference on Computer Communications Workshops (INFOCOM WKSHPS), Vancouver, BC, Canada, 10–13 May 2021; pp. 1–2. [Google Scholar] [CrossRef]
  26. Alvarado-Unamuno, E.A.; Arizaga-Gamboa, J.E. Design and Implementation of Traffic Balancer over Overlay Networks with Vxlan Tunneling. In Proceedings of the International Conference on Technologies and Innovation; Springer: Cham, Switzerland, 2021; pp. 125–139. [Google Scholar] [CrossRef]
  27. Zhao, Z.; Hong, F.; Li, R. SDN Based VxLAN Optimization in Cloud Computing Networks. IEEE Access 2017, 5, 23312–23319. [Google Scholar] [CrossRef]
  28. Rădoi, A.E.; Rincu, C.I. Integration of Data Center Network Technologies VxLAN, BGP, EVPN. In Proceedings of the 2022 14th International Conference on Communications (COMM), Bucharest, Romania, 16–18 June 2022; pp. 1–5. [Google Scholar] [CrossRef]
  29. Zhang, X.; Xiao, G.; Duan, M.; Chen, Y.; Li, K. PH-CF: A Phased Hybrid Algorithm for Accelerating Subgraph Matching based on CPU-FPGA Heterogeneous Platform. IEEE Trans. Ind. Inform. 2022, 19, 8362–8373. [Google Scholar] [CrossRef]
  30. Kumar, A.; Kumar, A.; Mallipeddi, R.; Lee, D.G. High-density cluster core-based k-means clustering with an unknown number of clusters. Appl. Soft Comput. 2024, 155, 111419. [Google Scholar] [CrossRef]
  31. Chen, C.; Li, K.; Teo, S.G.; Zou, X.; Li, K.; Zeng, Z. Citywide Traffic Flow Prediction Based on Multiple Gated Spatio-Temporal Convolutional Neural Networks. ACM Trans. Knowl. Discov. Data 2020, 14, 1–23. [Google Scholar] [CrossRef]
  32. Weng, T.; Zhou, X.; Li, K.; Tan, K.L.; Li, K. Distributed Approaches to Butterfly Analysis on Large Dynamic Bipartite Graphs. IEEE Trans. Parallel Distrib. Syst. 2023, 34, 431–445. [Google Scholar] [CrossRef]
Figure 1. VxLAN packet format.
Futureinternet 16 00320 g001
Figure 2. Packet encapsulation and decapsulation from ServerA to ServerB via VxLAN network.
Futureinternet 16 00320 g002
Figure 3. Traffic flow on same-VxLAN and cross-VxLANs networks in VxLAN centralised gateway deployment mode.
Futureinternet 16 00320 g003
Figure 4. Traffic flow on same-VxLAN and cross-VxLANs networks in VxLAN distributed gateway deployment mode.
Futureinternet 16 00320 g004
Figure 5. Illustration of the logical topology of the network with and without the micro-segmentation.
Futureinternet 16 00320 g005
Figure 6. Illustration of nodes access relationships.
Futureinternet 16 00320 g006
Figure 7. An example of network topology.
Futureinternet 16 00320 g007
Figure 8. Network packet loss during the implementation of micro-segmentation.
Futureinternet 16 00320 g008
Figure 9. The extent of PoAE’s improvements.
Futureinternet 16 00320 g009
Figure 10. The extent of PoAE’s improvements.
Futureinternet 16 00320 g010
Figure 11. The extent of decline in asset degrees.
Futureinternet 16 00320 g011
Table 1. Network information for cyberspace assets.
IP AddressVLAN IDVxLAN IDGateway
10.0.0.1101010.0.0.254
10.0.0.2101010.0.0.254
10.1.0.1202010.1.0.254
10.2.0.1303010.2.0.254
10.0.0.3101010.0.0.254
Table 2. Network information for newly planned cyberspace assets.
IP AddressOriginal VLAN IDNew VLAN IDVxLAN IDGateway
10.0.0.1101011010.0.0.254
10.0.0.2101021010.0.0.254
10.1.0.1201112010.1.0.254
10.2.0.1301213010.2.0.254
10.0.0.3101031010.0.0.254
Table 3. Aggregation values for each node in Figure 6.
AssetNumber of Adjacent NodesOut Degrees & In DegreesIdACOdAC
Without Micro-Segmentation With Micro-Segmentation Without Micro-Segmentation With Micro-Segmentation Without Micro-Segmentation With Micro-Segmentation Without Micro-Segmentation With Micro-Segmentation
Va131621010
Va231621010
Va331621010
Vr6612120.400.40
Vb131621010
Vb231621010
Vb331621010
Table 4. Network information about the asset and key access behaviours.
IP AddressCommunication ObjectsCommunication Time
10.8.6.12210.8.6.0/24All day
10.8.6.12310.8.6.0/24
10.8.9.0/24
All day
All day
10.8.6.12410.8.6.0/24All day
10.8.6.12510.8.6.0/24All day
10.8.6.12610.8.6.0/24All day
10.8.6.12710.8.6.0/24All day
10.8.6.12910.8.6.0/24All day
10.8.6.13010.8.6.0/24
10.7.2.0/24
All day
1st minute of each hour
10.7.1.19410.7.1.0/24
10.255.73.0/24
All day
All day
Table 5. With micro-segmentation, the flow data for the asset and the number of assets with which it generates flow.
AssetFlows in the Inbound DirectionFlows in the Outbound DirectionNumber of Assets Generating Flow
Minimum (KB) Maximum (KB) Minimum (KB) Maximum (KB) Minimum Maximum
10.8.6.12210,05912,14019,63221,8651417
10.8.6.12334,99952,488189026641011
10.8.6.1244005525011363050910
10.8.6.125379816,60653614671012
10.8.6.1268.3223805691310810
10.8.6.127103531924501965913
10.8.6.12910,18211,741210735501011
10.8.6.13011,74813,15224778748
10.7.1.19473341,545164781,84658212
Table 6. With micro-segmentation, the numerical characteristics of the flow.
AssetMathematical Expectations of FlowNormalised Variance
Inbound (KB) Outbound (KB) Inbound Outbound
10.8.6.12210,902.8520,732.190.003110.00081
10.8.6.12344,667.232247.580.007010.00989
10.8.6.1244410.261925.290.003320.11181
10.8.6.1257931.14925.280.164350.12141
10.8.6.1261601.29906.160.098430.05740
10.8.6.1271675.31835.640.110090.15907
10.8.6.12910,973.022641.840.001840.02124
10.8.6.13012,453.85388.220.000830.10644
10.7.1.1946193.9333,048.711.711900.41452
Table 7. Without micro-segmentation, the flow data for the asset and the number of assets with which it generates flow.
AssetFlows in the Inbound DirectionFlows in the Outbound DirectionNumber of Assets Generating Flow
Minimum (KB)Maximum (KB)Minimum (KB)Maximum (KB)MinimumMaximum
10.8.6.122257635272935303733
10.8.6.12324,73936,081429323
10.8.6.12416920712520312
10.8.6.12520994742616834
10.8.6.12617822714820112
10.8.6.127101163675B912
10.8.6.129124404604B1712
10.8.6.1304074565222423934
10.7.1.1942750374423,91739,256182209
Table 8. Without micro-segmentation, the numerical characteristics of the flow.
AssetMathematical Expectations of FlowNormalised Variance
Inbound (KB)Outbound (KB)InboundOutbound
10.8.6.1222927.142986.190.011570.00016
10.8.6.12326,869.2166.250.025260.09519
10.8.6.124188.44177.660.005340.02532
10.8.6.1253,305.0165.370.081980.00150
10.8.6.126196.48176.200.009630.01061
10.8.6.127145.542.140.019572.264039
10.8.6.129206.444.470.198491.89553
10.8.6.1304686.33228.940.012740.00050
10.7.1.1942938.8827,981.310.016370.03405
Disclaimer/Publisher’s Note: The statements, opinions and data contained in all publications are solely those of the individual author(s) and contributor(s) and not of MDPI and/or the editor(s). MDPI and/or the editor(s) disclaim responsibility for any injury to people or property resulting from any ideas, methods, instructions or products referred to in the content.

