Article

Towards Safer Cities: AI-Powered Infrastructure Fault Detection Based on YOLOv11

1
Department of Computer Science, American International University—Bangladesh, Dhaka 1229, Bangladesh
2
Centre for Image and Vision Computing (CIVC), COE for Artificial Intelligence, Faculty of Artificial Intelligence and Engineering (FAIE), Multimedia University, Cyberjaya 63100, Malaysia
3
AI and Big Data Department, Woosong University, Daejeon 34606, Republic of Korea
*
Authors to whom correspondence should be addressed.
Future Internet 2025, 17(5), 187; https://doi.org/10.3390/fi17050187
Submission received: 7 March 2025 / Revised: 16 April 2025 / Accepted: 18 April 2025 / Published: 22 April 2025
(This article belongs to the Special Issue IoT, Edge, and Cloud Computing in Smart Cities)

Abstract

:
The current infrastructure is crucial to metropolitan improvement. Natural factors, aging, and overuse cause these structures to deteriorate, introducing dangers to public well-being. Timely detection of infrastructure failures requires an effective solution. A YOLOv11-based deep learning model has been proposed which analyzes infrastructure and detects faults in civil architecture. The focus of this study is on an image-based approach to infrastructure assessment, which is an alternative to manual visual inspections. Despite not explicitly modeling infrastructure deterioration, the proposed method is designed to automate defect identification based on visual cues. A customized dataset was created with 9116 images collected from various platforms. The dataset was pre-processed, i.e., annotated, and after pre-processing, the proposed model was trained. After training, our proposed model finds defects with greater precision and speed than conventional defect detection techniques. It achieves high performance with precision, recall, F1 score, and mAP in 100 epochs, and is therefore reliable for applications in civil engineering and urban infrastructure monitoring. Finally, the detection results show that the proposed YOLOv11 model works better than other baseline algorithms (YOLOv8, YOLOv9, and YOLOv10) and is more accurate at finding infrastructure problems in real-world scenarios.

1. Introduction

Infrastructure has incessantly suffered decay from increasing industrialization and urbanization, a changing climate, globalization, natural calamities, environmental pollution, and transportation overload. Faults in infrastructure—from minor fissures to major structural collapses—endanger public safety, disrupt daily operations, increase repair costs, and have significant economic consequences. Infrastructure faults are defects or breaks in physical structures such as bridges, building walls or surfaces, power grids, potholes, roads, historic buildings, manholes, pipelines, railways, and shipping containers, which disrupt the normal functioning of society by preventing the provision of essential services. Some of the reasons for these flaws include aging equipment, natural disasters, excessive use, shoddy construction, faulty designs, or malfunctioning systems. Defects include things like pits, cracks, corrosion, and structural deformation. Identifying framework faults is noteworthy for public security, preventing accidents, and sparing lives. It helps in economic stability by not disrupting the usual activities and reduces asset costs by finding solutions early. Generally, this action has until now relied upon sensor-based observing and manual verifications. However, human error, excessive cost, and inefficiency often limit these methods when dealing with large infrastructures. As innovation has progressed, automatic defect detection systems that use machine learning and image processing have become game-changing tools that provide accurate, scalable, precise, versatile, and real-time findings. Detecting infrastructure faults has several advantages. Increased Safety: Timely identification prevents catastrophic failures and ensures the safety of users and the environment. Cost Savings: Early fault identification lowers repair costs by addressing issues before they become more serious. Observing Effectiveness: Automated systems detect defects on a larger scale in less time with less human effort. Long Life: Consistent observation and maintenance develop the strength of infrastructure. Environmental Protection: The early detection of faults helps reduce pipeline leaks and collapses that could have serious environmental repercussions [1,2,3].
The accuracy and efficiency of manual inspection techniques for infrastructure flaws is limited. Advanced deep learning models, YOLOv2 and YOLOv3, effectively detect surface defects on bridges, such as corrosion, rebar exposure, and cracks, with faster detection rates than Faster RCNN. The improved YOLOv3 model using both high- and low-resolution feature images outperforms YOLOv2 in detection performance, achieving an AP of 0.91 which refers to a metric used to evaluate object detection models by measuring precision–recall tradeoff compared to YOLOv2’s 0.83–0.86. This makes the improved YOLOv3 103 times faster than Faster RCNN (0.23 FPS), with similar precision (0.91 for YOLOv3 versus 0.9 for Faster RCNN). It emphasizes the prospect of deep learning models for real-time and efficient infrastructure monitoring and defect detection [4]. Detecting cracks in railways is important for preventing train derailments and accidents. Detecting railway-track cracks using a deep learning-based method, YOLOv5, for real-time identification and EfficientNet for classification, improves maintenance accuracy and railway safety. The model reaches an accuracy of 91% with a diversified dataset of 1074 images and geospatial localization for precise defect mapping. This integration enhances railway safety through real-time crack detection and focused maintenance, with the potential for further scalability and increased geospatial applications [5]. Through old buildings, we can know the history and culture of a country, which connects people with the past. Old buildings need to be preserved to prevent decay. A deep learning-based method, the YOLO model, versions YOLOv5 to YOLOv10, has been used to detect surface cracks in historic buildings. This model detects cracks in real time with greater accuracy and speed. YOLOv9 accomplished the most elevated exactness, with a precision pace of 92.1% and a handling rate of 1.051 h per model preparation [6]. BFD-YOLO is a superior recognition strategy based on YOLOv7 that is proposed for detecting defects in building façades. YOLOv7 was particularly suitable for this task because of its increased accuracy in detecting minute defects on complex surfaces. This model integrates MobileOne, a lightweight network module, to reduce parameter count and inference time. Over-parameterization and re-parameterization methods will enable the model to grasp more features efficiently, while adding the MobileOne module will reduce the number and complexity of network parameters, hence effectively reducing the estimation time [7]. The environment, human prosperity, and planetary natural frameworks all depend upon water, which is basic until the end of time. The YOLOv8 model has been used in water pipelines to identify problems such as water spills, breaks, and corrosion. The YOLOv8 model has been applied to water pipelines to detect problems like water spills, breaks, and corrosion. It is a technology that enhances the efficiency of detecting faults in the pipeline, thereby reducing actual site investigations and facilitating the maintenance process of the water distribution system. This method ensures early identification of the problems, advances efficacy, and improves the overall management of water systems by automating fault finding [8]. The LCA-YOLOv8n-seg approach is presented for crack identification, which frames cracks and identifies crack regions at the pixel level using an enhanced one-stage instance segmentation model. The ProtoC1 module and a new backbone network, LCANet, enable the model to achieve high accuracy, real-time performance, and decreased size, which makes it appropriate for low-performance devices [9]. ML-YOLO has been upgraded in the algorithm to classify and detect road defects that affect the safety of the road, such as splits, potholes, and bulges. The refined YOLOv8-based approach addresses the limitations of manual inspection, includes a distraction attention module for enhanced feature extraction, and optimizes localization algorithms for precise defect detection and spatial location [10]. Fire and smoke are significant threats that destroy property and the environment. The traditional methods have problems with accuracy and speed, which makes real-time detection difficult. A better approach is developed using the YOLOv8-based deep learning model, which outperforms baseline models (YOLOv7, YOLOv5, ResNet-32, and MobileNet-v2) in precision, recall, and mean average precision metrics [11].
Detecting infrastructure problems has received a significant amount of interest because of YOLO models’ ability to detect objects in real time. At the same time, some researchers still face too many obstacles and constraints to overcome the challenge of improving their efficiency. Limited Fault Types Coverage: Most current work is focused on specific problems, like damage to walls or cracks on roads, without considering many other important faults like skyscrapers, pipelines, or structural damage in historical buildings. The limited scope of these models reduces their practical applicability. Underutilization of YOLO Advances: Despite improvements in speed and accuracy of recent YOLO versions such as YOLOv8, YOLOv9, YOLOv10, and YOLOv11, the potential for detection of infrastructure issues remains largely unexplored. Therefore, this area has fallen behind regarding correct defect detection. Inadequate Datasets: Most research projects use datasets that are either too limited, focusing on specific types of infrastructure, not diverse enough, or lacking the right annotations. It is hard to train models that can generalize different kinds of failures. Small or Hidden Faults are Hard to Identify: The present models are not capable of finding minute cracks, hidden damage, and other such problems. There is a need for techniques that will enhance the identification of less evident problems. Limited to Real-World Implementation: Despite the potential, actual applications of YOLO-based models have not been widely used in infrastructure monitoring systems. We should concentrate our research on integrating these models into practical applications for continuous fault detection and safety monitoring.
This research is motivated by the increasing need to overcome the difficulties presented by infrastructure monitoring. As infrastructure in urban areas becomes increasingly complex, traditional inspection methods face challenges in meeting the ever-growing demand for efficiency and accuracy. The main objective of this study is to address these challenges by integrating deep learning technology into infrastructure monitoring, especially object detection based on the YOLO model. The research provides innovative approaches towards addressing grave problems in infrastructure management by focusing on safety, cost-effectiveness, and preservation. The inability to locate defects in infrastructure such as roads, bridges, and pipelines may lead to severe problems. This study saves people from accidents and protects them through the early identification of problems, which is important for both urban and rural areas. Most structural problems are expensive maintenance and repair costs. This model can help reduce such costs by detecting defects in their early stages, which saves money and time for business enterprises and governments by increasing the life span of such infrastructures. Most of the methods for defect detection today are tedious and time-consuming. The following research provides a better approach for infrastructure monitoring using the YOLO model to build an automated, faster, more accurate, and scalable system. This research can detect different types of faults in infrastructure, such as potholes, cracks, and structural damage in old structures, whereas conventional techniques can only detect one type of fault. Because of this, it can be applied to many real-life applications. Identifying cracks and other issues is essential for the preservation of ancient buildings. This research helps uncover issues that may remain invisible in the conservation of cultural artifacts, helping to protect these cultural treasures for future generations. The creation of a specialized dataset that includes both historical and modern infrastructure is a significant benefit to the research community. It can be utilized in future studies on machine learning applications and infrastructure problem detection. By identifying flaws early, this research supports more sustainable infrastructure practices by reducing maintenance waste and optimizing resource use. The main contributions of this paper are as follows:
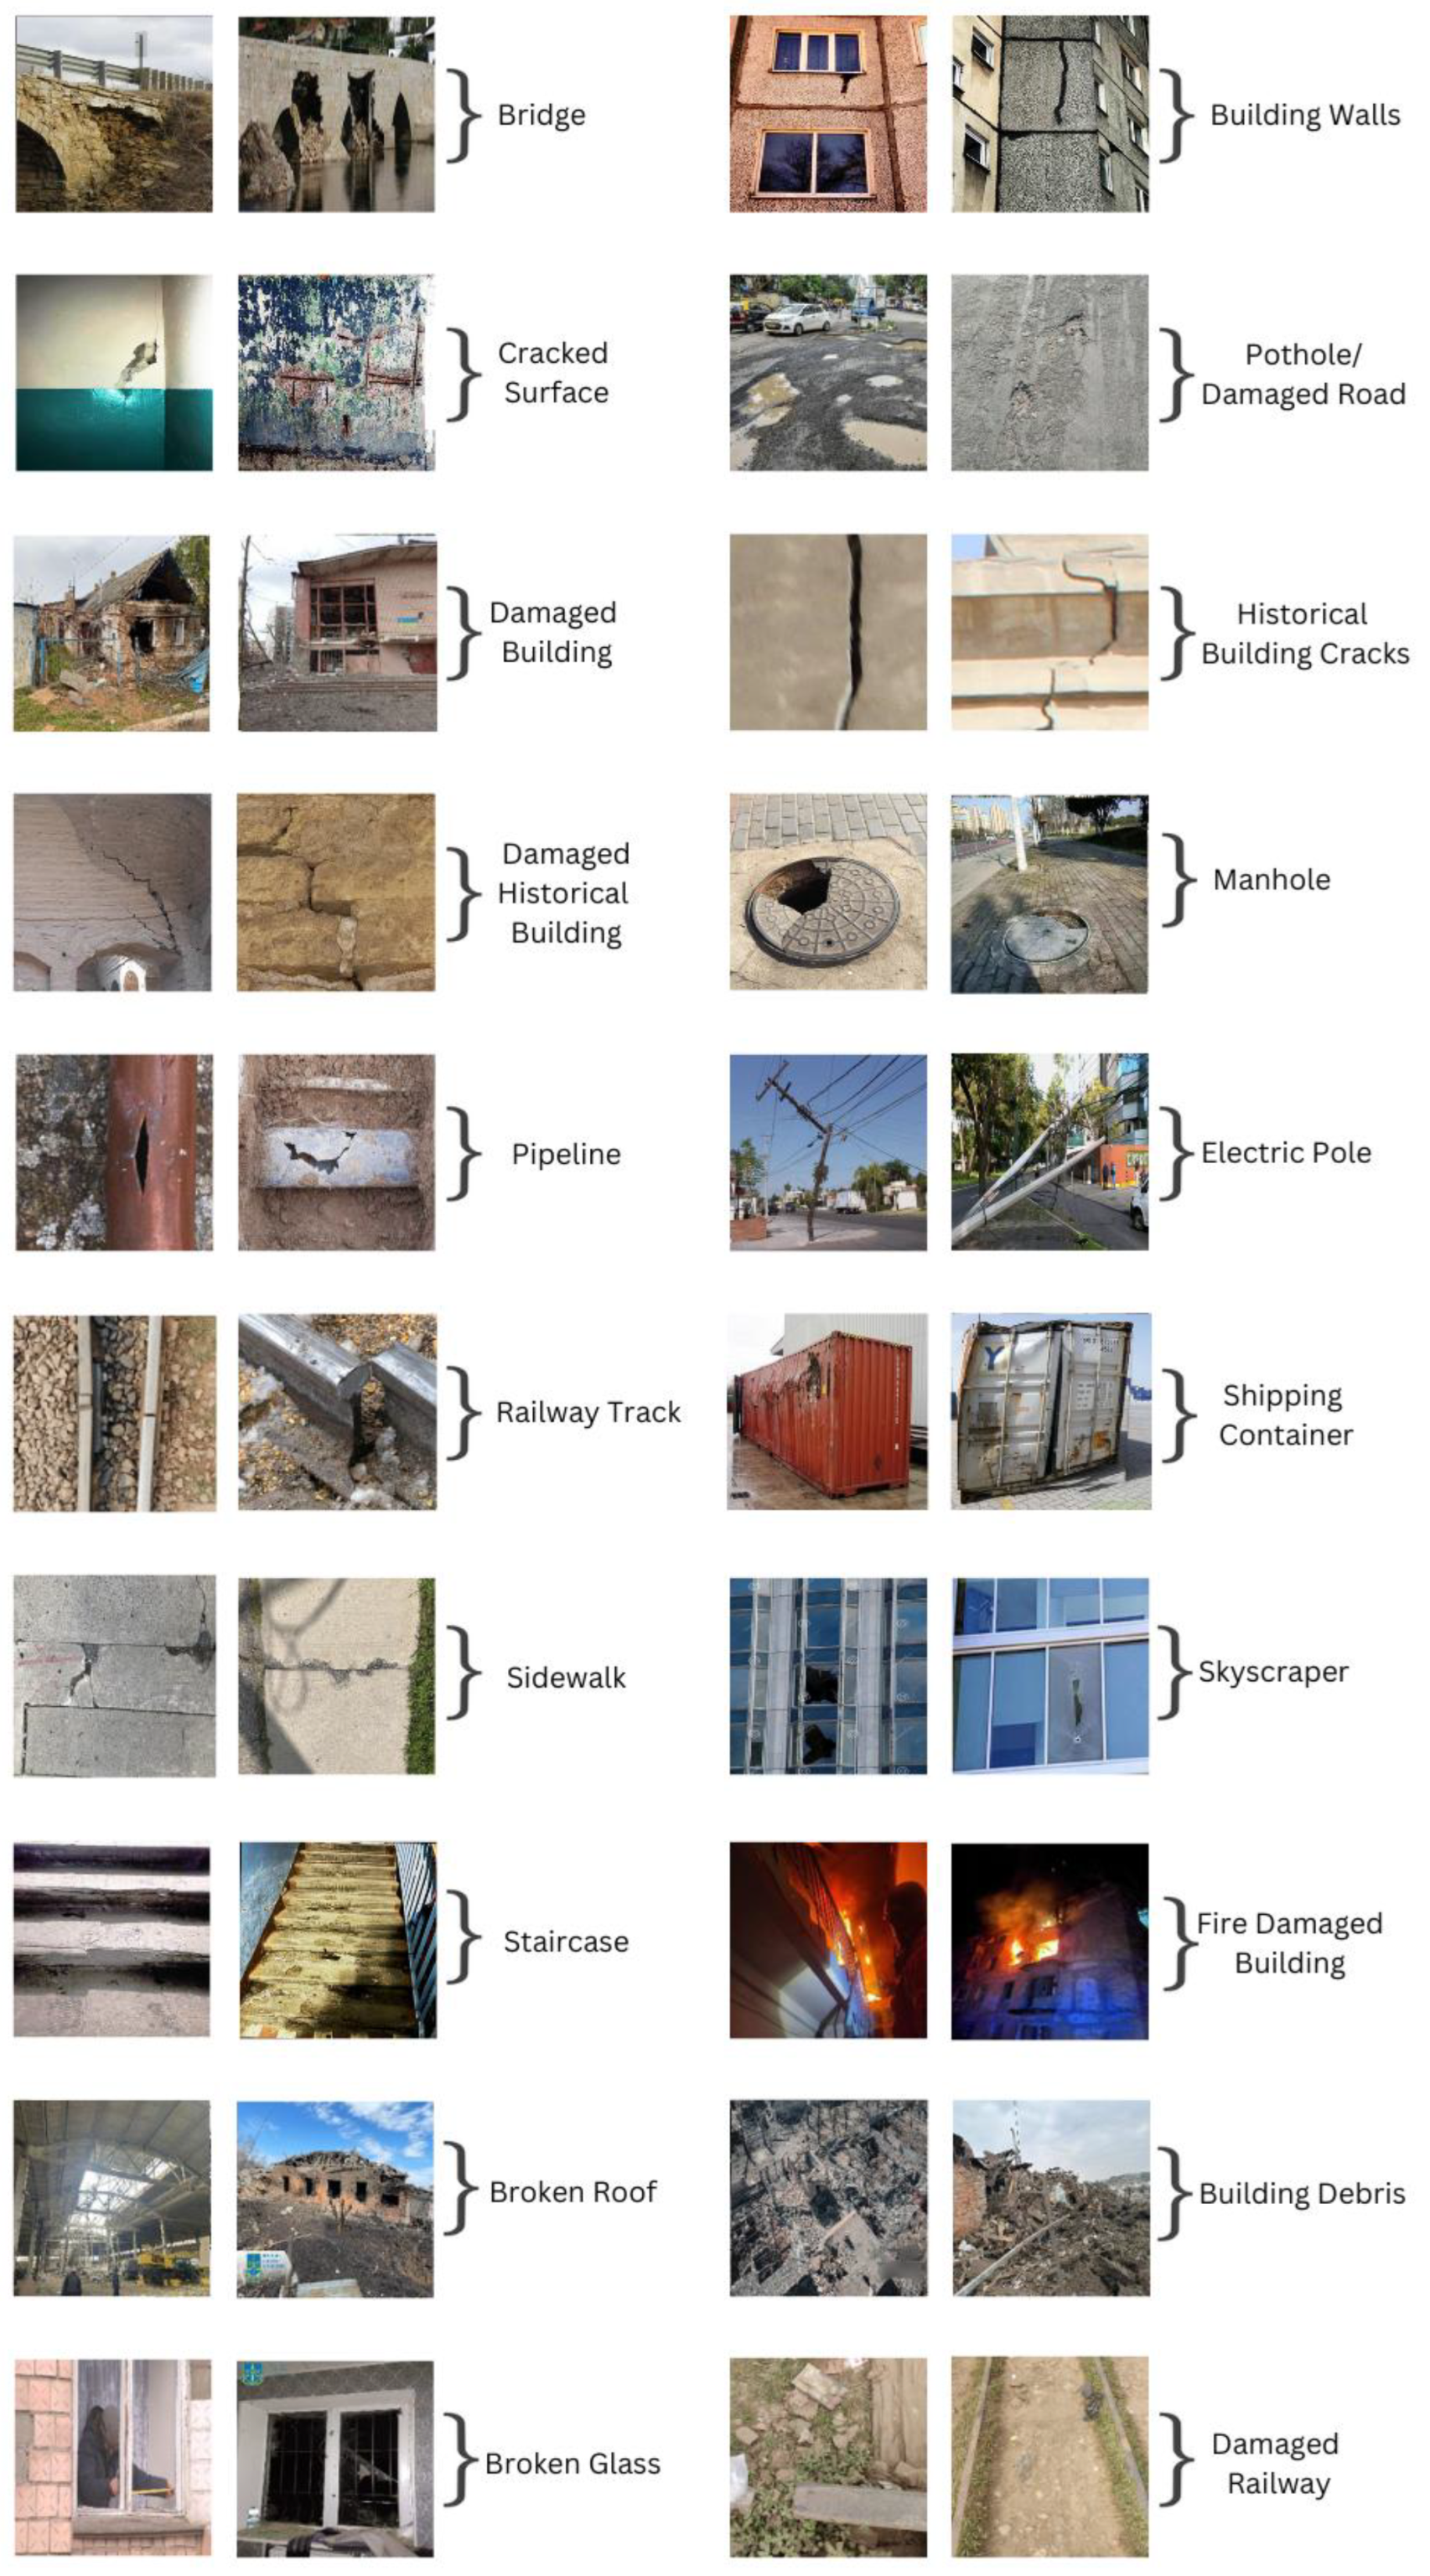
  • This study focuses on detecting faults in infrastructure to improve safety and maintenance by accurately identifying defects. First, we created a custom dataset containing 9116 images covering various fault types and environmental conditions. This extends the generalization capability of the proposed model compared with other works.
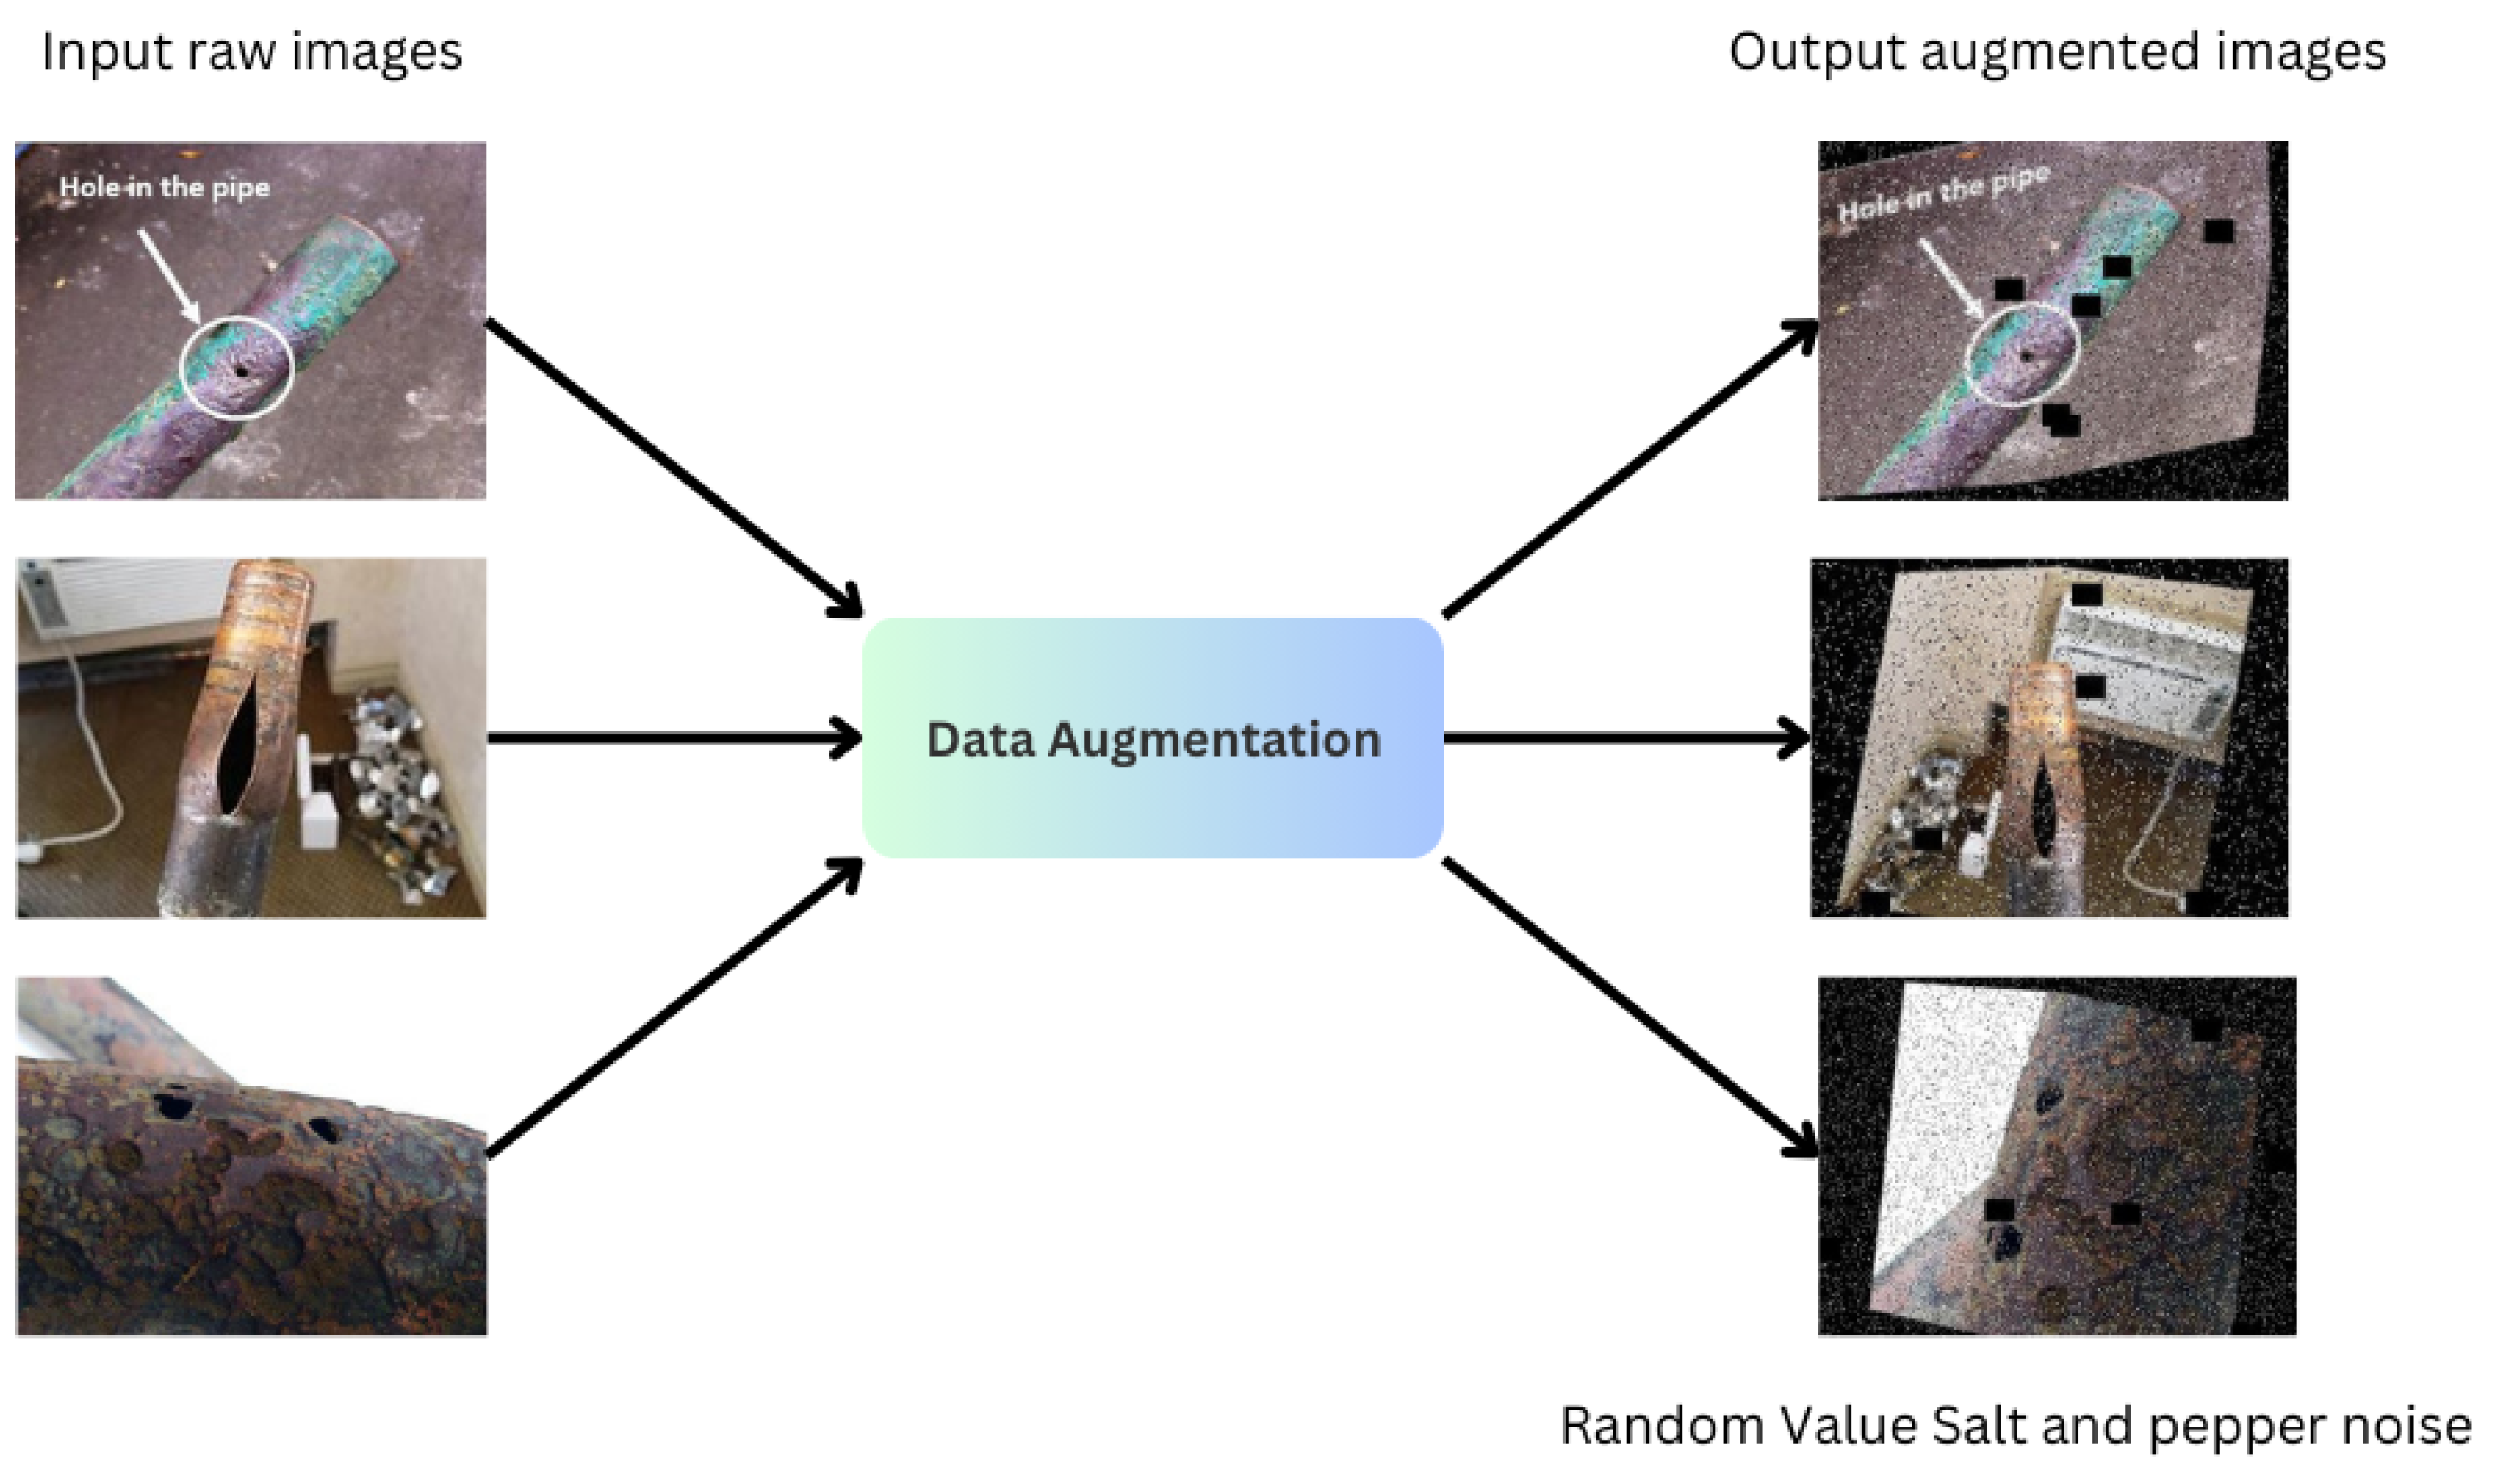
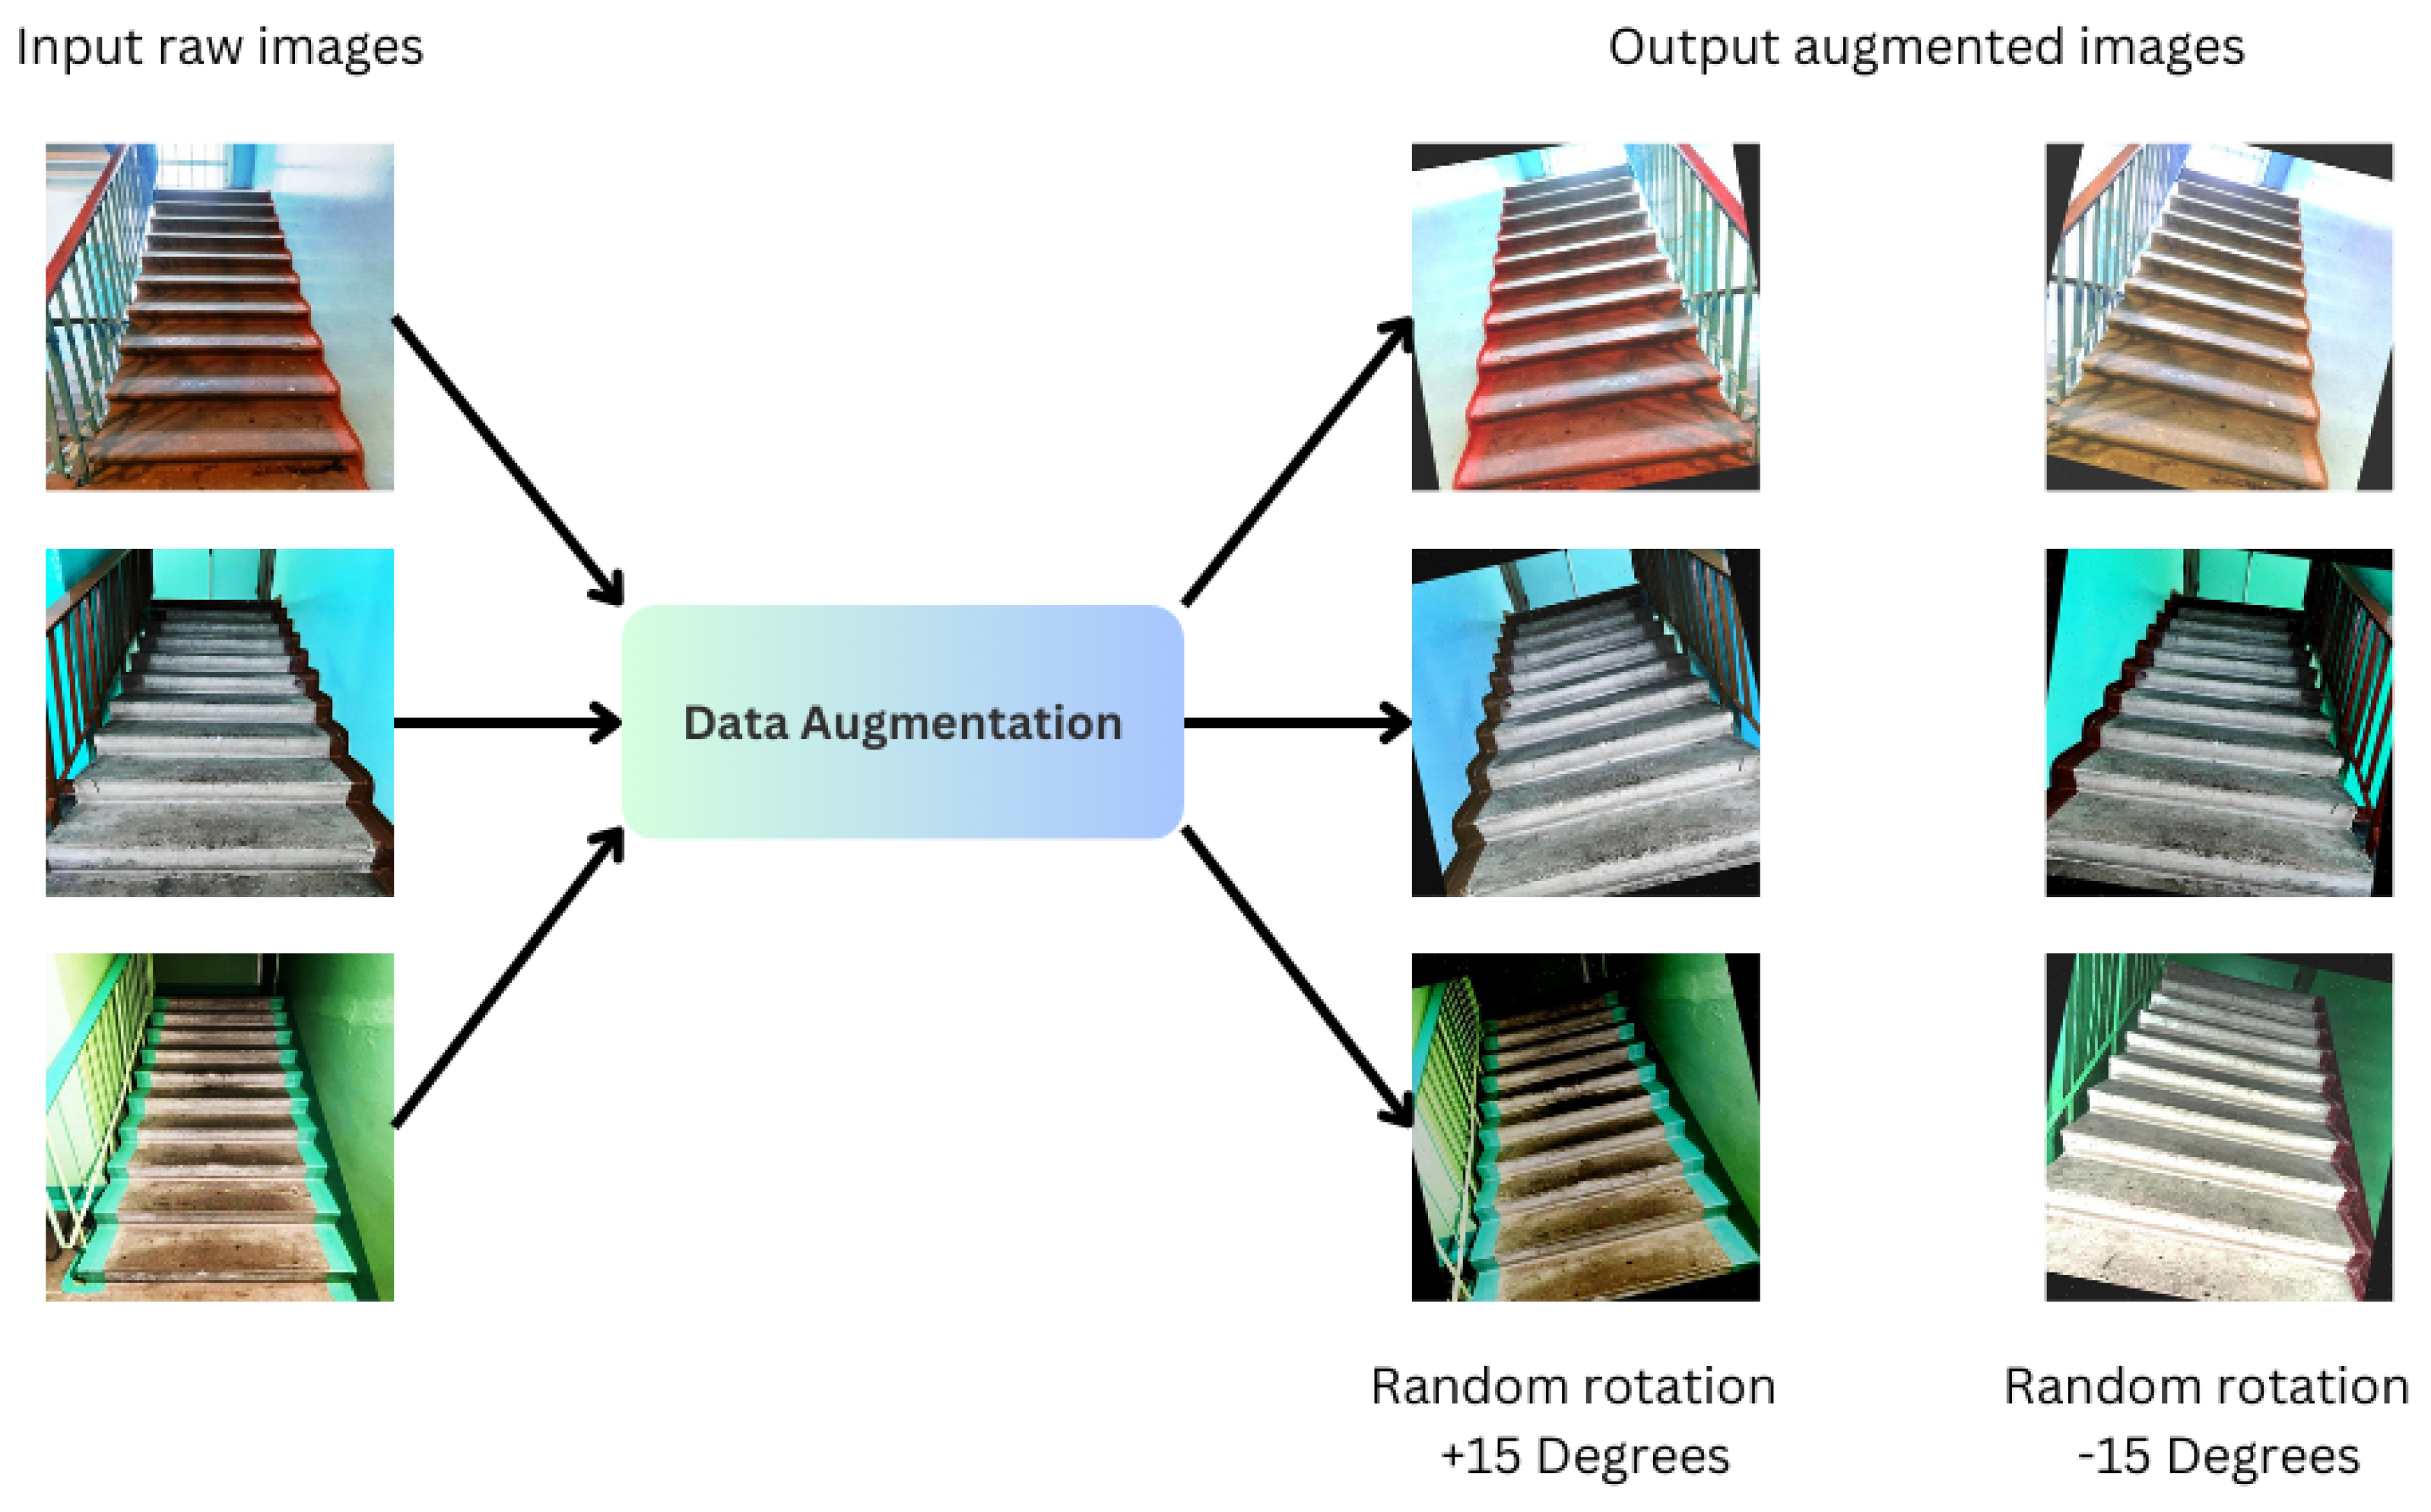
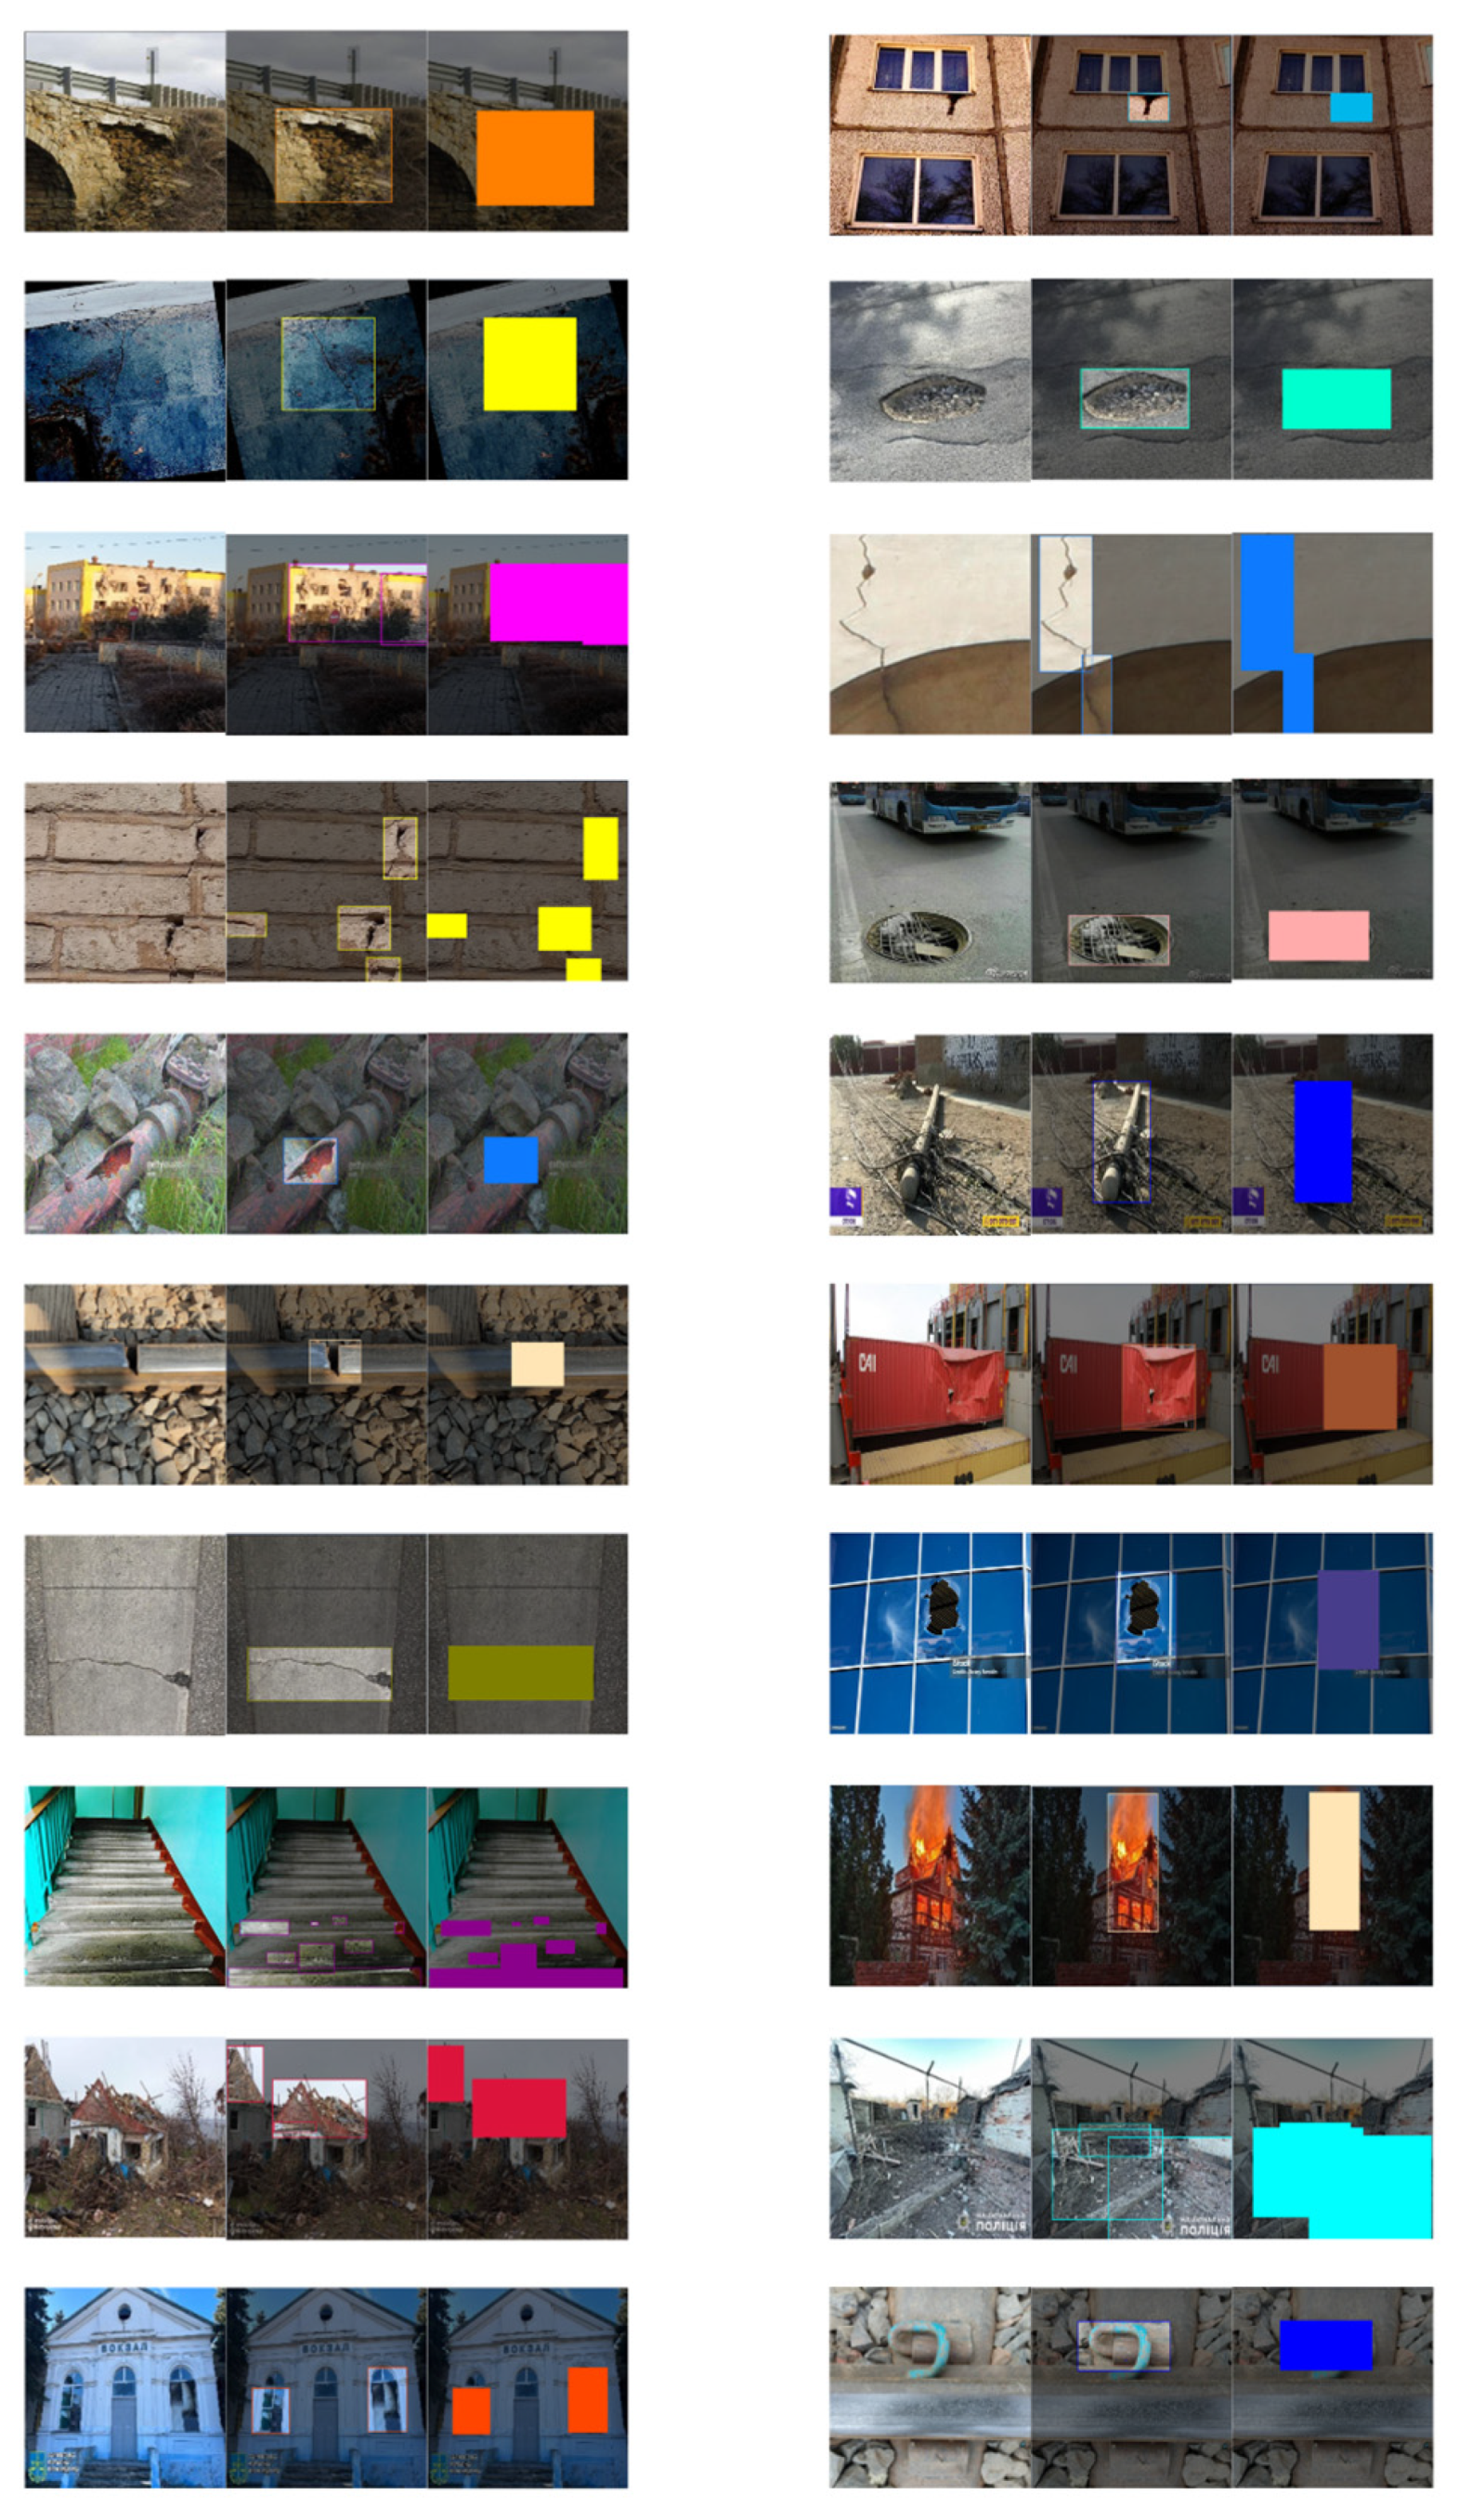
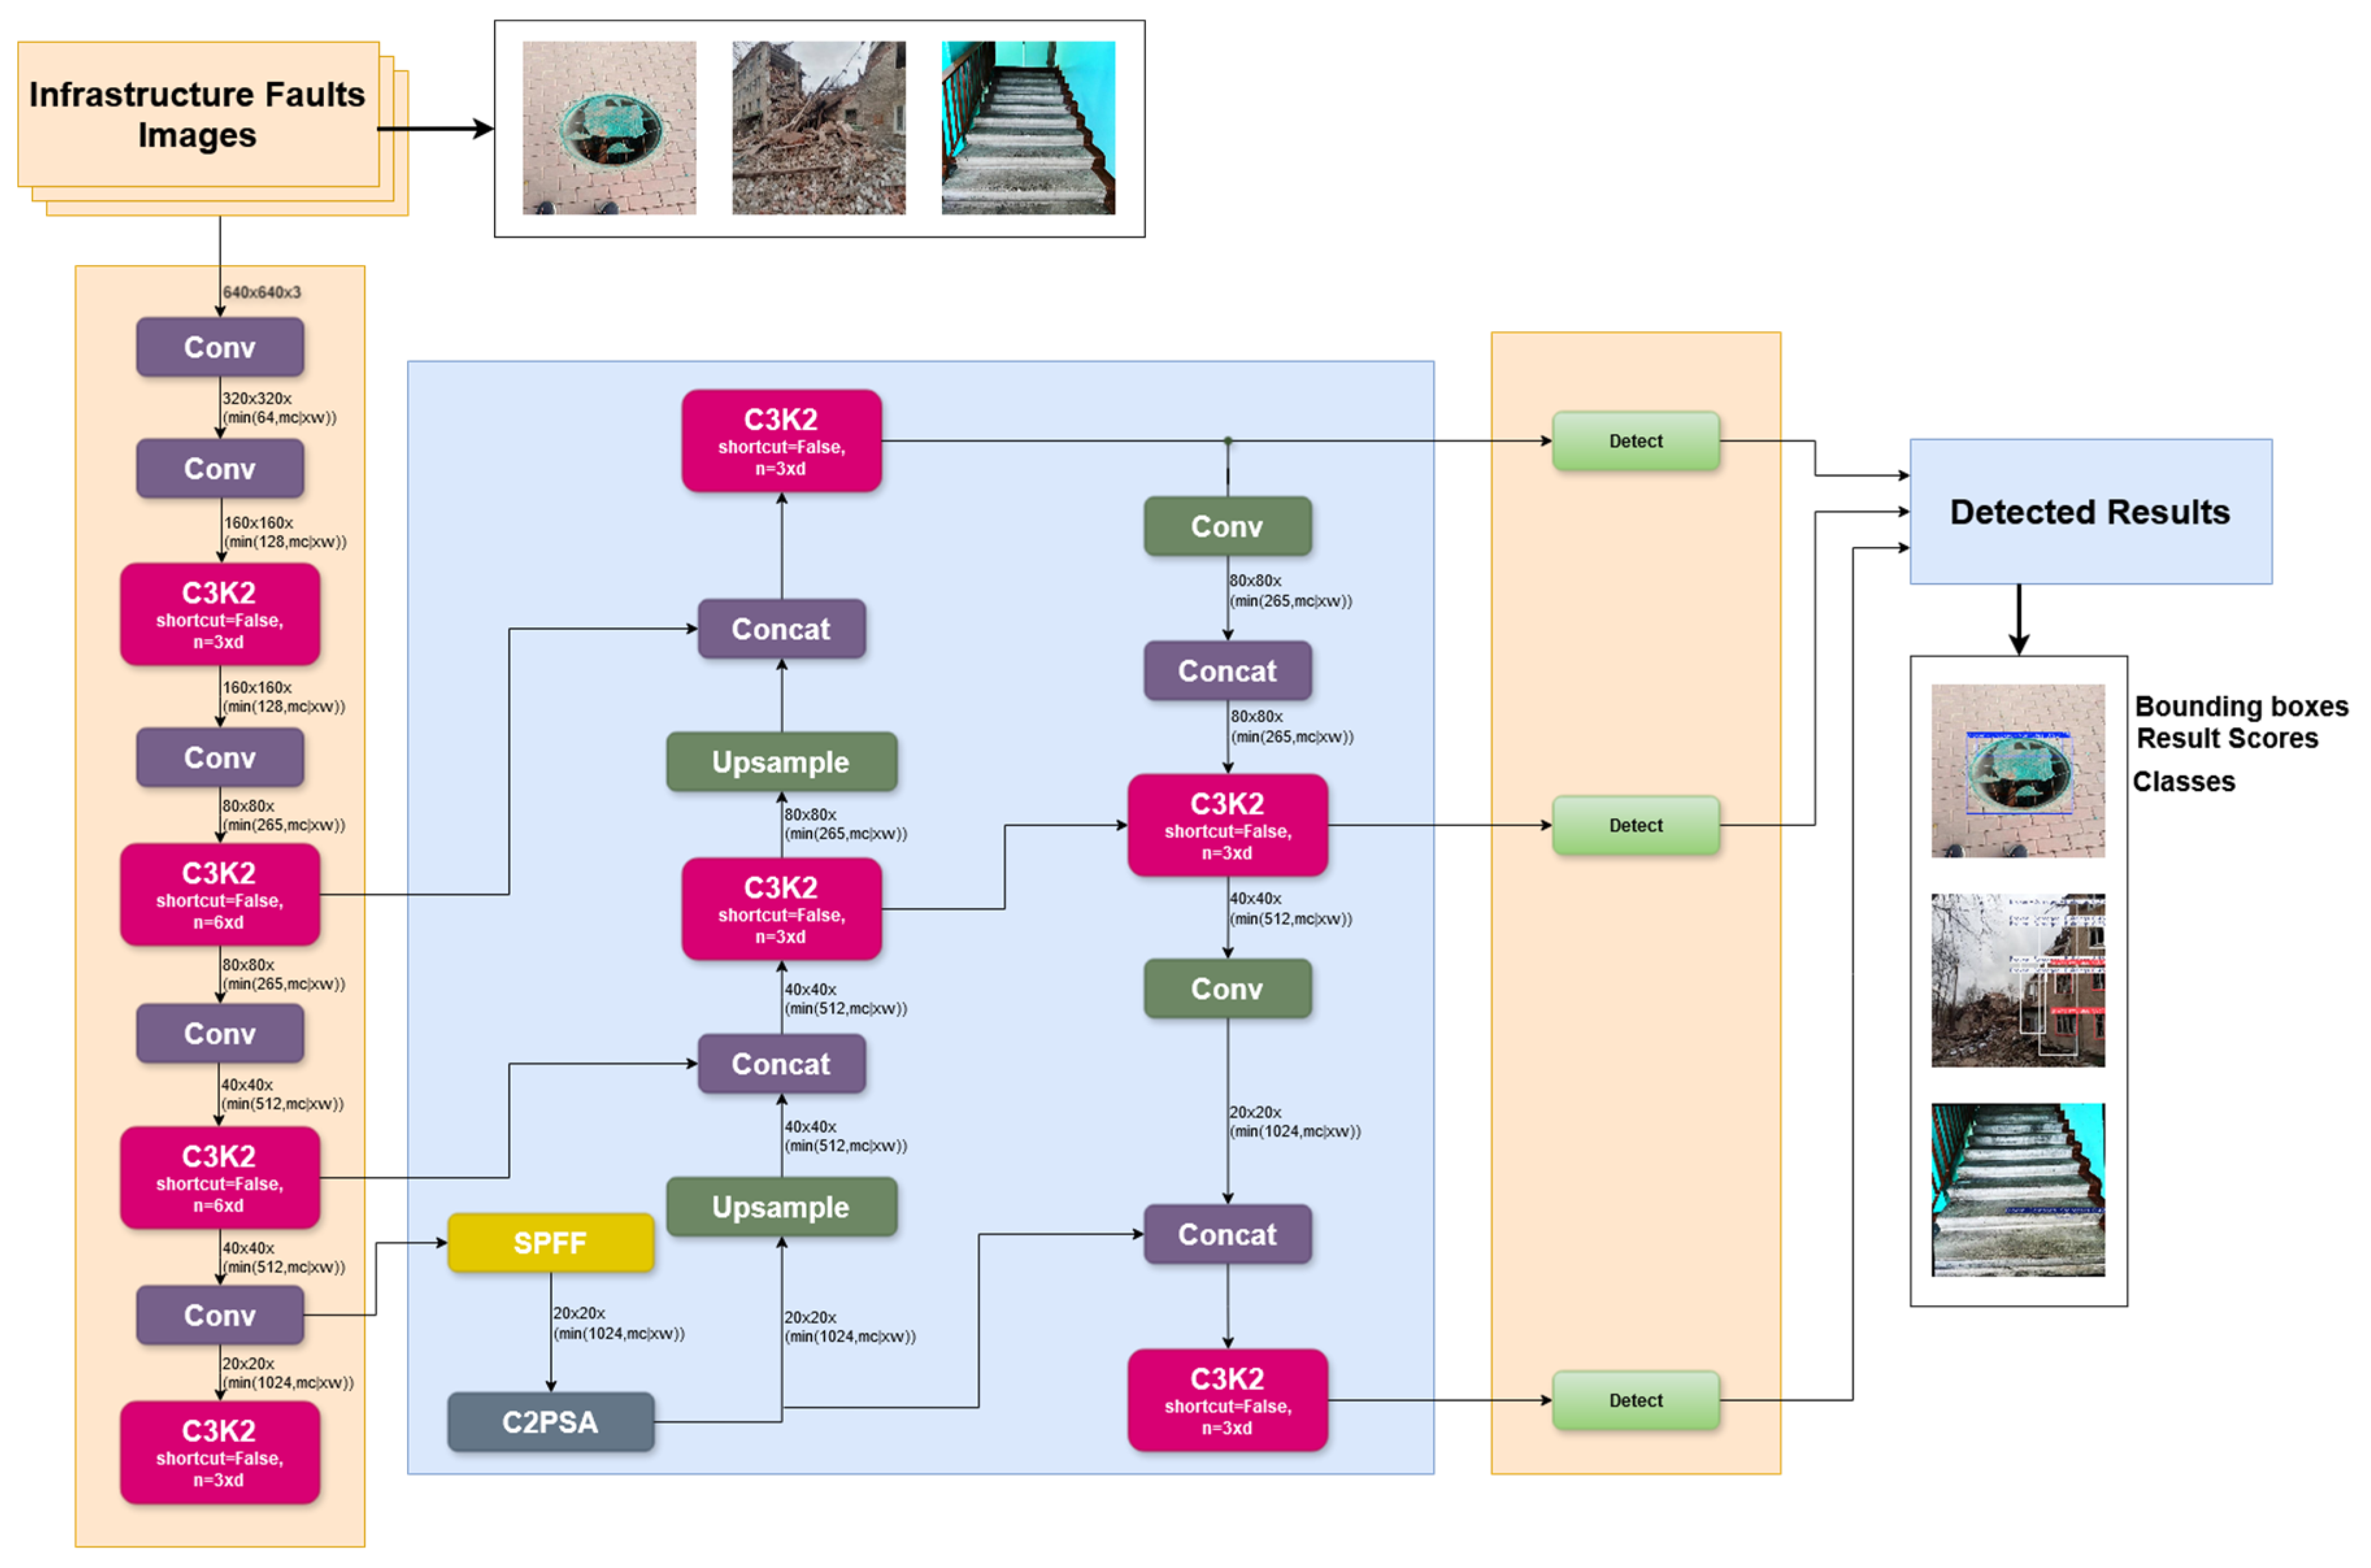
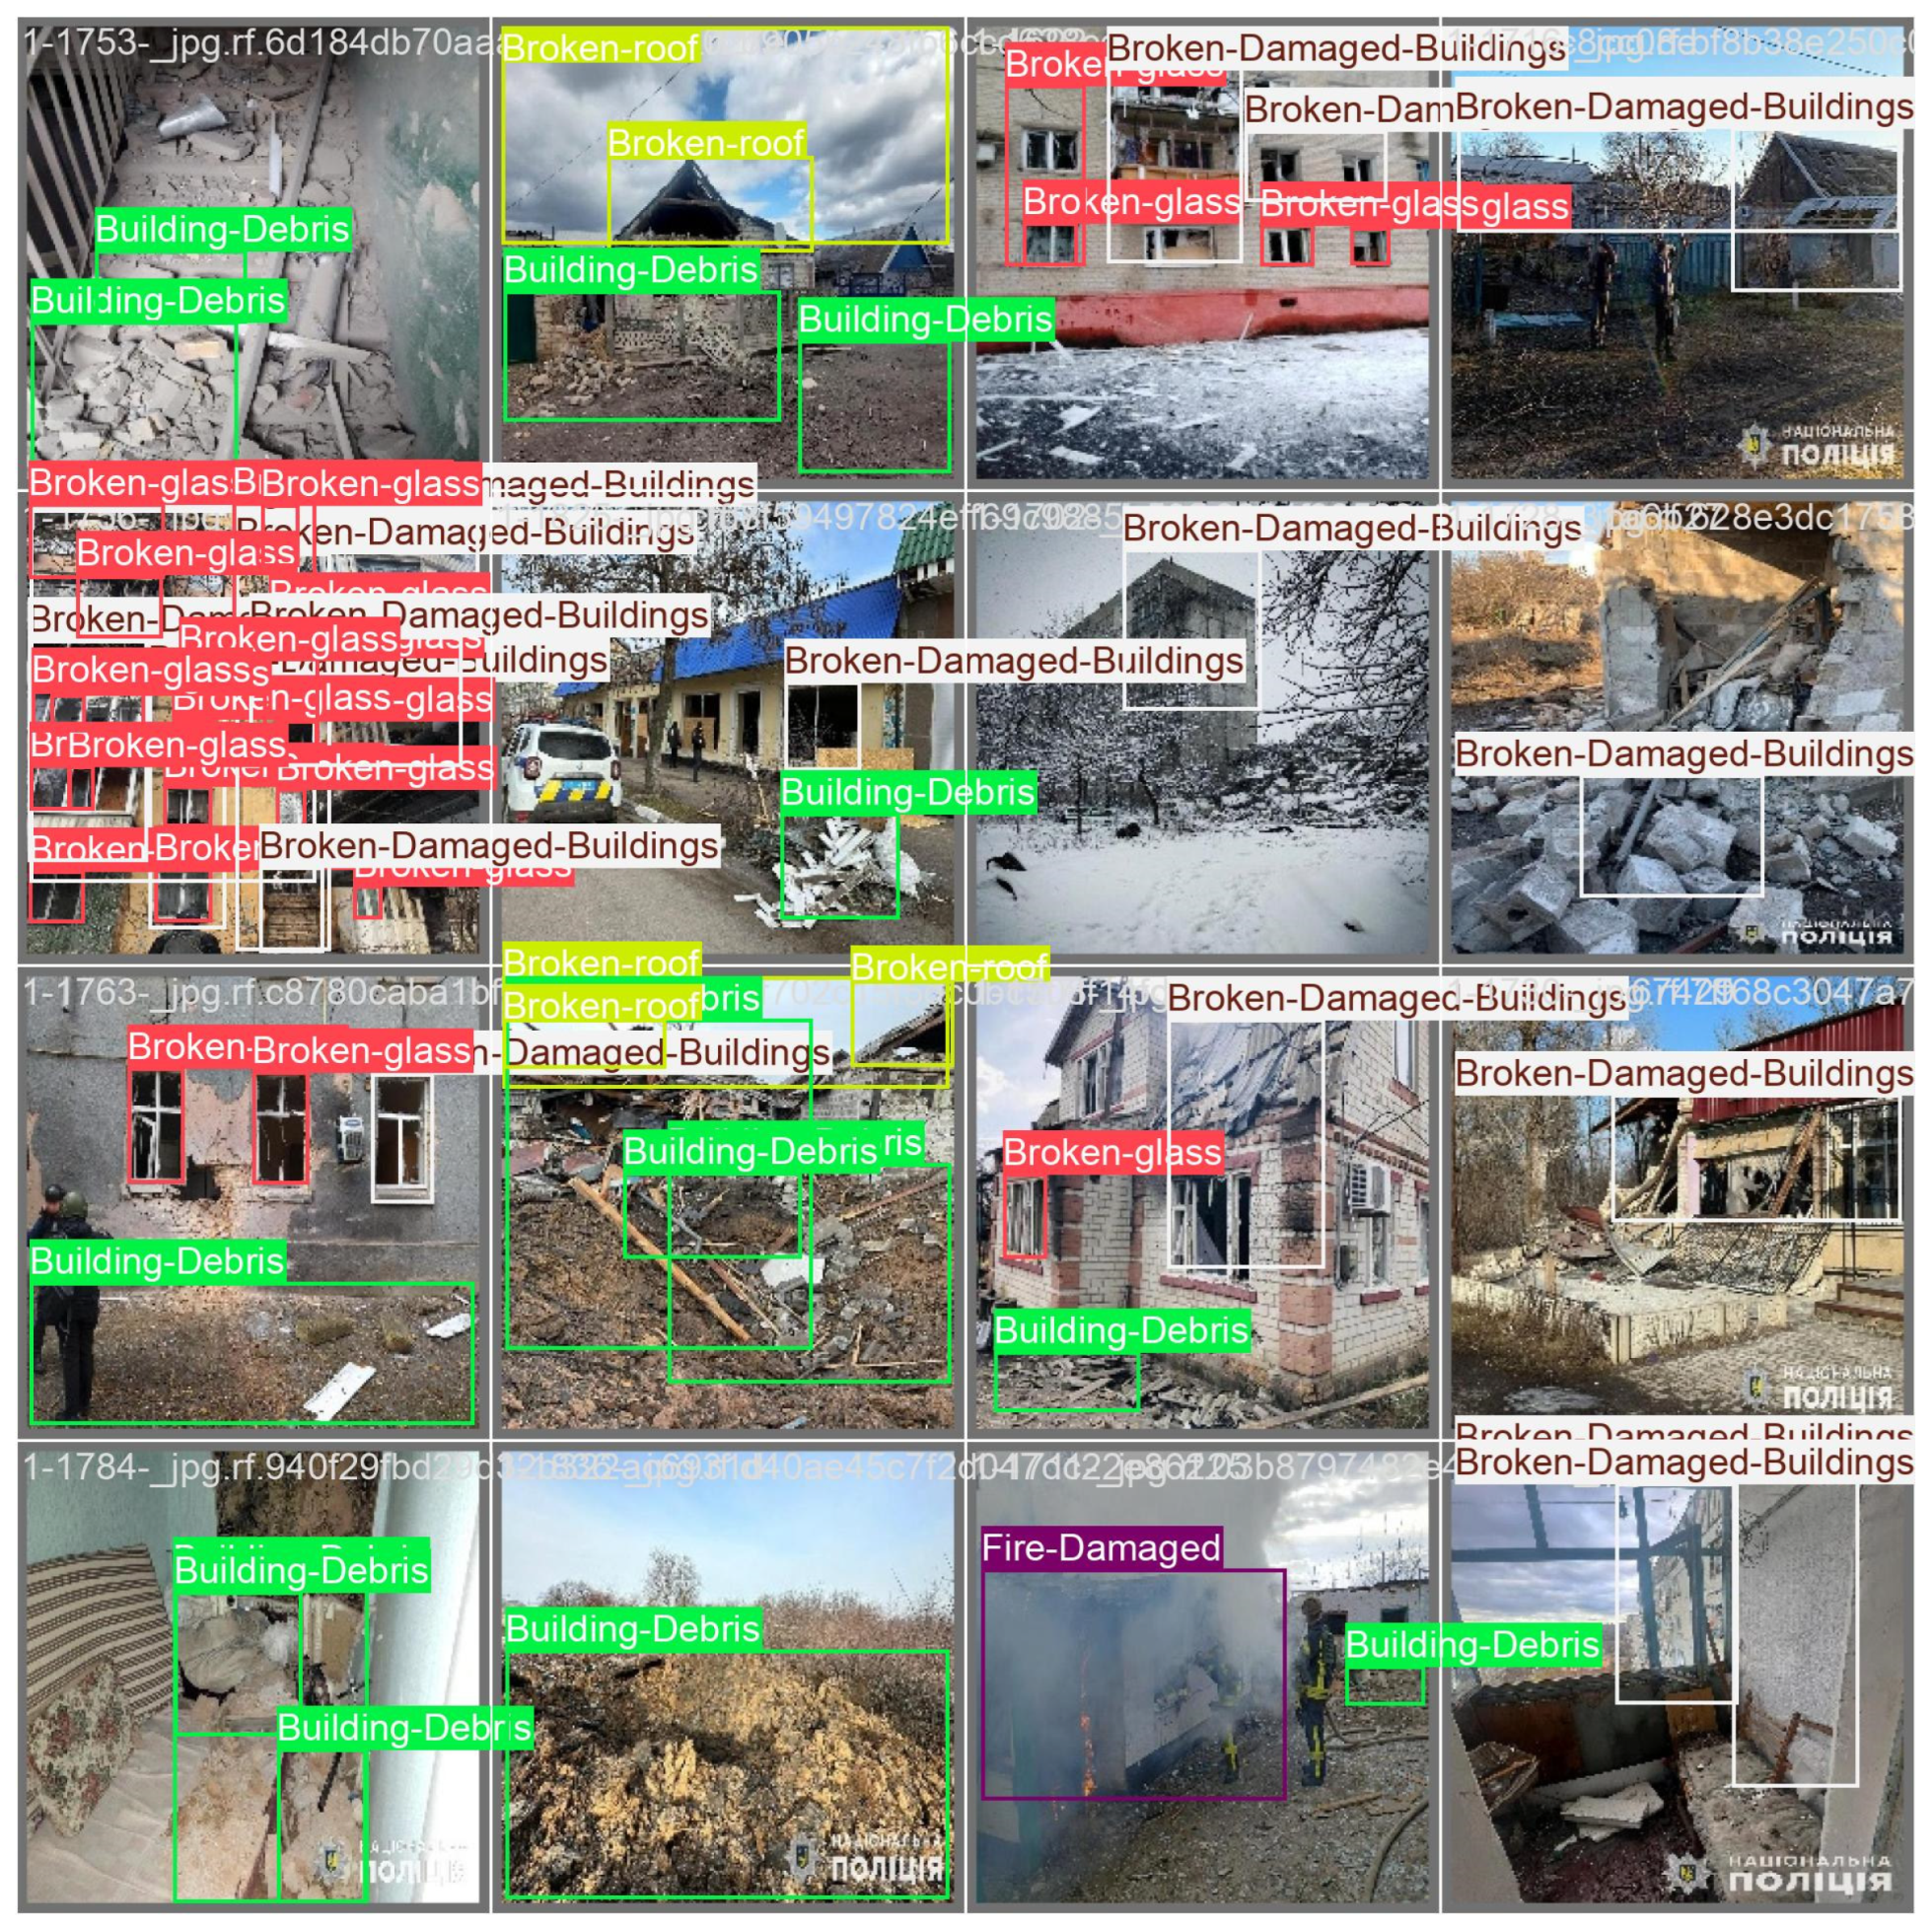
  • Second, we pre-processed the custom dataset using annotation techniques to enhance the model’s performance and resilience in a variety of settings. We resized and labeled each image to ensure high-quality input for the training process. With pre-processed images, the proposed deep learning-based object detection YOLOv11 [12] model is trained to precisely detect and categorize different types of faults in real time, significantly improving the detection speed.
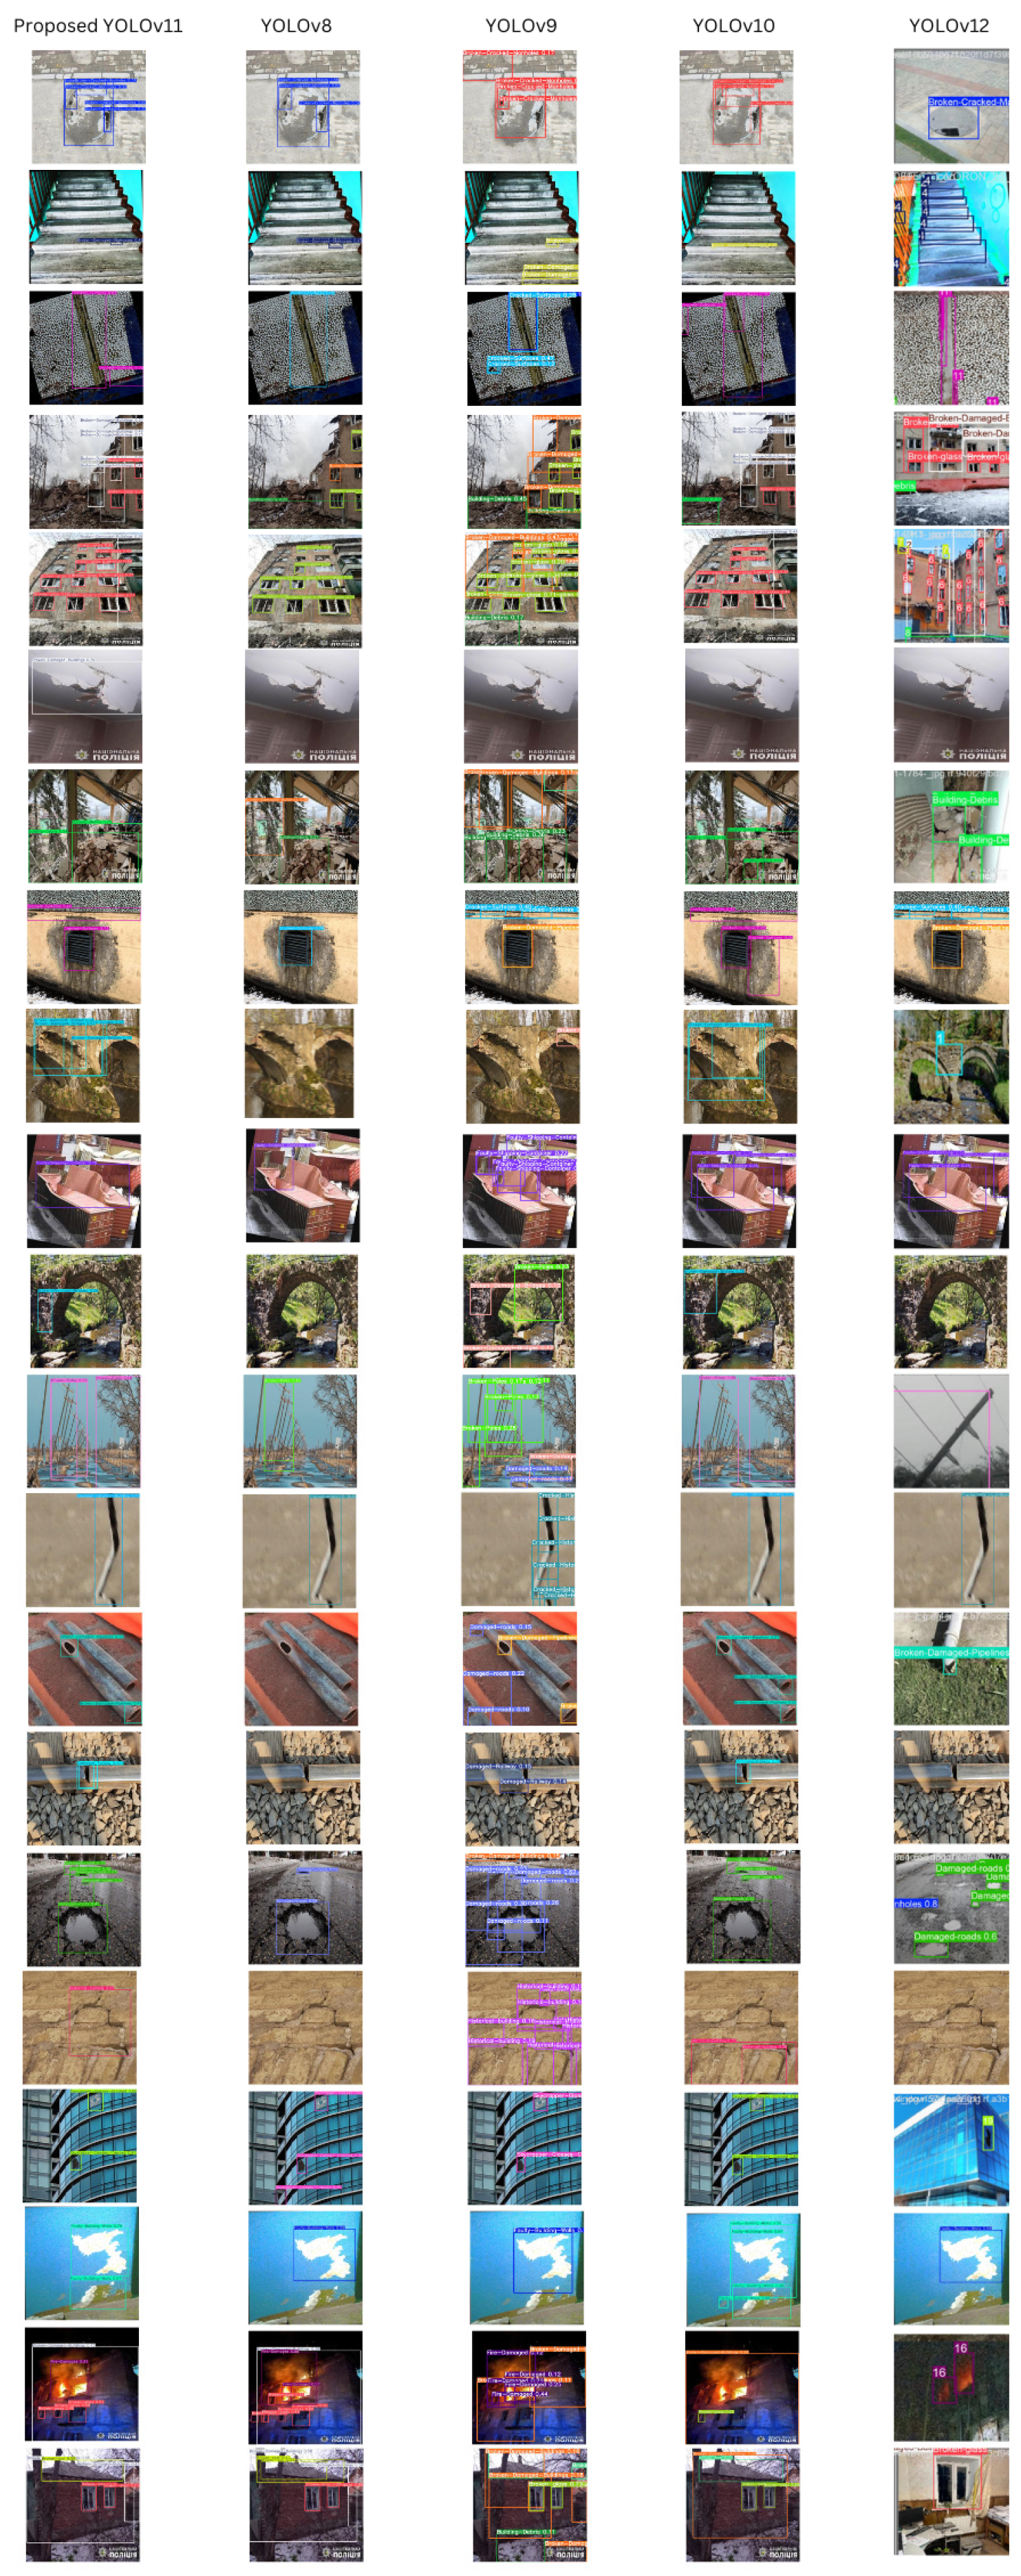
  • Finally, a detailed analysis of the effectiveness of YOLOv11 was conducted, and indeed it is superior to other baseline models, including YOLOv8, YOLOv9, and YOLOv10. Evaluation results prove that, in all instances, the proposed YOLOv11 outperforms others.
  • This research gives a significant lead in infrastructure fault detection by using a proposed YOLOv11 model and a diverse, high-quality dataset. The results have shown potential for real-world applications, especially in maintaining the safety and longevity of critical infrastructure.
The rest of this paper is structured as follows: Section 2 presents a literature review and related work on infrastructure fault detection. The proposed methodology is described in Section 3, including the dataset preparation, model training, and the improvements to the YOLO model. Section 4 provides a thorough examination of the experimental results and compares the performance of YOLOv11 with other models. Lastly, Section 5 concludes the paper and summarizes the key findings, impacts, and future directions.

2. Literature Review

Detection of faults in infrastructure has become very crucial for ensuring the safety and durability of civil structures. While traditional methods have made important contributions, they often struggle to deliver real-time, accurate, and efficient solutions. Non-destructive defect detection techniques in bridges mainly include electromagnetic and thermal imaging methods. These approaches offer valuable insights into structural integrity without causing damage. However, they cannot be used for dynamic scenarios because they lack real-time capability and rely highly on manual intervention [13]. Most vision-based sewer fault detection methods rely on fast R-CNN, which is a deep learning model used for object detection that generates regional proposals before classification, and SSD, which is also a deep learning-based object detection framework known for its speed and efficiency. While these models show potential, they have some limitations regarding detection speed and scalability for analyzing defects. Moreover, handling small-scale defects was a big challenge that reduced their overall efficiency [14]. AI and image processing in SHM have explored various techniques, such as texture analysis and drone-based imaging. These have improved the accuracy of detecting damage; however, they are not as adaptive and capable of real-time processing as the YOLO models; hence, their application to large-scale monitoring is very restricted [15]. Traditional deep learning-based concrete crack detection methods showed advancements in the detection of structural anomalies. However, due to the absence of real-time processing and lower precision in the case of small objects, those techniques were not effective in dynamic environments [16]. AI integrated with sensors for road monitoring methods demonstrated the potential of detecting anomalies like cracks and potholes. However, the lack of usage of YOLO models resulted in slower detection speed and higher computational demands, which have limited their large-scale deployment [17]. Anchor-free CNN models for tunnel crack detection had effectively handled small, thin cracks. However, the limited capability of handling complex defect scenarios and the absence of real-time features have reduced their practicality in high-demand applications [18]. Pavement crack detection techniques using machine learning depend on hybrid models such as SSA-SVM. SSA-SVM is a variation of support vector machines designed for structured prediction tasks. While the accuracy is good enough, the computational inefficiency and non-adaptability compared to YOLO-based methods limit wider applications [19]. The LightGBM models were proposed for detecting cracks in concrete with high accuracy by geometric analysis. However, the processing delay and difficulty in managing real-time data made them less suitable for fast-paced monitoring tasks [20]. A deep hierarchical CNN comprising 16 convolutional layers was used for corrosion detection on the aerial images from the Bolte Bridge (a major freeway bridge in Melbourne, Australia, known for its cable-stayed design and role in urban transportation networks) and sky rail areas. The model produced an impressive result in terms of 98.9% global accuracy but needed manual supervision owing to the shortcomings of SegNet. Furthermore, stability issues with CycleGAN and generalization challenges were also noticed [21]. PADENet approached the panoramic images to detect corrosion types with the high mAP of 87.34%, outperforming well-established approaches, such as Fast R-CNN, YOLO, and SSD, detecting a wide variety of surface damage types with robust precision. It outperformed YOLO and SSD while facing difficulties with small defects and complex backgrounds. High computational requirements also remain a limitation [22]. The reviewed methods have several significant limitations. The reviewed methods cannot be applied in real time and therefore cannot be used for real-time tasks such as fault detection.
Improved YOLOv4, integrated with MobileNetV3 for the detection of railway surface defects, can effectively overcome such difficulties as the small size and complex features of the track. Using a rail image dataset, it achieves significant improvements in accuracy, speed, and parameter efficiency compared to YOLOv3 and Faster R-CNN. This method shows the potential of lightweight and high-performance models in real-time defect detection and points out some directions for further work in dataset expansion and model refinement. However, the small dataset of 1000 images restrict generalization and scalability [23]. YOLOv5 is employed to detect road structure defects, focusing on crack and gap defects in cement and asphalt pavements. The accuracy was as high as 85%, sensitivity reached up to 91.5%, and the F1 Score was 81.5% during its validation, which shows its potential for deep learning regarding efficient pavement fault detection and maintenance. This research was conducted with only 420 images, and therefore a small dataset could limit the model’s robustness or scaling in a variable environment [24]. The authors used YOLOv5s to be integrated with IoT data in infrastructures that have been subjected to mining operations for real-time crack detection and machine learning-based concrete strength prediction. It achieved a mAP of 88.41%, and a precision of 87.9%, proving the suitability of the model in real-time structural monitoring. The low recall rate may reduce the detectability of small or low-contrast cracks [25]. Mosaic data augmentation, pruning, and knowledge distillation are incorporated into the improved model of YOLOv5 for detecting structural defects in concrete dams. It realizes a 35% model size reduction with the capability of dealing with complex inspection scenarios effectively. This real-time system is optimized for UAV-captured images, offering high accuracy and efficiency for practical dam inspections [26]. ACD-YOLO is a YOLOv5 model for steel surface defect detection, enhanced by anchor optimization, context augmentation, and efficient convolution modules. The method is industrially applicable for quality assurance because of the balance between speed and accuracy [27]. The research introduces TLMDDNet and its lightweight version, DC-TLMDDNet, to railway track defect detection. It realizes a high mAP of 99.20% with improved features by the enhanced YOLOv3 model and attains an improved detection speed of 34.25 FPS to make defect defection effective and efficient. The research is limited by the dataset to a few defect types and thus may not be generalizable to all railway track conditions [28]. The authors propose an enhanced version of YOLOv5, called MN-YOLOv5, by introducing MobileNetV3 and a lightweight Coordinate Attention module for enhancing road damage detection. The major contributions of this work are a reduction in model size, number of parameters, and GFLOPs, while the mAP increased by 2.5% and F1 score by 2.6%. The lightweight model efficiently detects pavement cracks and helps in timely repairs with less effort during manual inspection [29]. The paper proposes BD-YOLOv8s, an improved YOLOv8s framework that is specially designed for the detection of concrete bridge defects in complicated backgrounds. Key novelties include ODConv for adaptability, CBAM for focusing on critical features, and CARAFE for refined upsampling [30]. It is an improved version of the YOLOv5s model for detecting sewer pipeline defects under the conditions of weak lighting and complicated backgrounds. It aims to improve test accuracy with computational efficiency by incorporating involution modules, GSConv, and CBAM attention mechanisms. It reached a mAP as high as 80.5%, reduced the parameters by 30.1%, and supported real-time detection at 75 FPS, outperforming other models in performance [31].
In contrast, non-YOLO models, like Faster R-CNN or SSD, have high accuracy but sometimes are unfortunately much slower with more computational demands. These generally need to have multiple stages of detection, and hence, in real-time applications, these could be lagging. On the other hand, YOLO models are effective in real-time applications since their single-stage detection mechanism can enable faster image processing. As YOLO is designed to achieve both high detection accuracy and computational efficiency, this architecture often outperforms such alternative models in tasks like defect detection in infrastructure, where timely response is crucial. The YOLO model can handle complex backgrounds and small object detection efficiently. In general, YOLO’s balance in speed, accuracy, and efficiency allows it to be preferred in real-time defect detection systems compared to other non-YOLO methods.

3. Materials and Methods

The following sub-sections showcase the details of the implementation of the proposed method.

3.1. Image Acquisition

Data collection is an important and very first step in research that includes gathering information and data from various sources. In this case, the collected data can be raw or modified images that are collected from websites, social media platforms, online dataset libraries, or any other reliable online sources. Other photographs from the internet are included in this dataset to complement the dataset. A custom dataset is formed after the necessary data are collected from online sources. Table 1 shows the statistics of the image dataset, where we considered twenty different types of infrastructures (i.e., bridge, building walls, cracked surfaces, pothole and damaged road, damaged building, historical building cracks, historical building, manhole, pipeline, pole, railway track, shipping container, sidewalks, skyscraper, and staircase) for the proposed system. A dataset is one of the most valuable resources for training machine learning models, conducting research, or performing analysis. A diverse range of relevant data is included in the custom dataset to support the intended goals, according to the research requirements and objectives. Figure 1 shows sample image datasets.

3.2. Image Pre-Processing

Data augmentation is a method that is widely utilized to enhance the diversity and variability of datasets to improve performance robustness of ML/AI models. During the process of collecting our real data, some of the images were enhanced by augmentation techniques to enhance the dataset. We have applied different data augmentation methods for selected groups of the images, as follows.
In case 1, to make a particular class have more images to train such as pipelines, salt and pepper noise was added. It is a special kind of data augmentation where the raw image will have white and black pixels at random locations across the image, giving us a variant to train. If there are black dots in the image, we call it pepper noise and if there are white dots in the image, we call it salt noise. By randomly producing noise values, pixels can transform into white, black, or gray values, creating salt and pepper colors. The noise is dispersed throughout the image by randomizing which pixels are changed. The salt and pepper effect is generated by these randomizations when combined. Using this technique, we were able to increase the number of images for a particular class and make them more suitable for analysis and model training.
In case 2, we used the image rotation method on a selected group of images. This method evolves around images being rotated in different angles to portray the real-world situation where things can be in different orientations. We rotated some images from −15 to +15 degrees based on the image details. By implementing this method, the model can more effectively understand the image’s different orientations and generalize more efficiently. This way, even if a rotated image occurs during validation or testing, it can be detected and analyzed.
At the end of the augmentation process, the raw data and processed augmented data are merged to create a custom dataset. The newly created dataset results in becoming more representative of real-world scenarios because it has both raw data and augmented data. Thus, the dataset’s quality was improved, and a wider range of variations was included. This also improves the model’s ability to generalize well. The augmented data added additional images with altered attributes, such as salt and paper noise and image rotation to expand training images of some classes as well as having different variants of an image to generalize more effectively. Additionally, this enhances the reliability of the trained model. The custom dataset is a valuable resource for different applications and has allowed us to achieve a more centered and diverse collection of data for specific tasks. Better model training, validation, and evaluation result in more accurate and reliable results in the targeted domain because of this. The sample image augmentation in both cases 1 and 2 are shown in Figure 2 and Figure 3.

3.3. Image Resizing and Labeling

The purpose of resizing an image is to ensure that all the images have the same shape. Thus, the custom dataset with all images was resized to 640 × 640 pixels. The twenty classes displayed in Table 1 were used to label the resized images. The Roboflow annotation tool was used to label data into multiple classes. In Figure 3, the first column showcases the raw input image, the second column shows one or multiple classes identified with a square bounded box, and the third column shows the result when the bounded box layer is on differentiating classes with different colors. The infrastructure fault’s name is represented by the class ID in a bounding box. For example, in this work, the twenty class IDs are “Broken-Cracked-Manholes”, “Broken-Damaged-Bridges”, “Broken-Damaged-Buildings”, “Broken-Damaged-Pipelines”, “Broken-Damaged-Staircases”, “Broken-Poles”, “Broken-glass”, “Broken-roof”, “Building-Debris”, “Cracked-Damaged-Sidewalks”, “Cracked-Historical-Building”, “Cracked-Surfaces”, “Damaged-Railway”, “Damaged-roads”, “Faulty-Building-Walls”, “Faulty-Shipping-Container”, “Fire-Damaged”, “Historical-building”, “Railway-tracks”, and “Skyscraper-Glasses-Cracked”, as displayed in Figure 4. In this case, each bounding box indicates a fault in the infrastructure, and each class ID represents the type of infrastructure fault.
In Figure 5, all the data pre-processing steps are displayed in a flowchart. After completing all the data pre-processing steps, the processed data were split into 70% train data, 15% test data, and 15% validation data for training the model.

3.4. Model Architecture

YOLOv11, the latest version of the YOLO series, is a state-of-the-art real-time object detection model which is designed to surpass its predecessors in both accuracy and speed. An upgraded backbone network for better feature extraction is one of the innovations new innovations in YOLOv11. Along with that, to improve precision, optimized anchor boxes and refined loss functions are used. It concentrates on the important areas in an image and uses a new path aggregation network by using a transformer-based attention mechanism which enhances multi-scale feature fusion. Architecture of YOLOv11 (You Only Look Once) in Figure 6 is a modern deep learning model for real-time object detection. This model is used to increase accuracy and efficiency based on the context of infrastructure fault detection.
In this study, we utilize YOLOv11 [12], an object detection model developed by Ultralytics, as the core of our fault detection pipeline. We clarify that YOLOv11 is not proposed or developed by the authors; rather, it is an existing deep learning framework that has demonstrated strong performance in real-time object detection tasks. We contribute by implementing and evaluating this model, specifically when it comes to detecting infrastructure defects. Our goal is to evaluate the model’s effectiveness and pinpoint its flaws in real-life infrastructure defect inspection scenarios by modifying it to our personalized dataset. The model starts with input images of infrastructure faults as broken manholes, damaged structures, faulty staircases, etc. Then, the feature extraction process initializes where these standard convolutional layers are that extract features from the input images. To process the input image as well as decrease the spatial dimensions and increase the depth of the feature map with each layer, multiple convolutional layers are used. Additionally, complex convolutional layers are used to achieve deep feature extraction. Shortcut = False and n = 3x or n = 6x parameters are used as the configuration of the layers. The concatenation feature maps are there to combine information from different levels of the network at different stages. The C2PSA module uses spatial information in feature maps that combines multi-scale features. It is utilized before passing the data to the detection layers. The detection layers create bounding boxes and class probabilities for object detection by using final convolutions and post-processing. The model produces the detected results with bounding boxes and labels overlaid on the images, indicating the identified infrastructure faults.

4. Results

This section presents an experimental evaluation of the proposed YOLOv11 model, along with a comparison of other YOLO variants with different parameters as well as some state-of-the-art models.

4.1. Hyperparameters

The YOLOv11-based model training revolves around various training settings and hyperparameters for real-time infrastructure fault detection. This section shows the hyperparameters that are being used in the training process. Table 2 displays the names of the parameters utilized and their respective values. In the training step, the epoch count is 100 and the optimizer and pre-trained model use SGD optimizer and COCO pre-trained model, respectively. To prevent overfitting and optimizing the training process in the model, an early stopping step is put in place. The training is halted early if no progress has been made in the previous 50 epochs. If improvement is not observed for 50 consecutive epochs, the training will stop automatically using the early stopping technique with a patient value of 50.
Furthermore, other parameters, such as batch size, learning rate, and weight decay values of 16, 0.01, and 0.001, respectively, are considered for better model optimization.

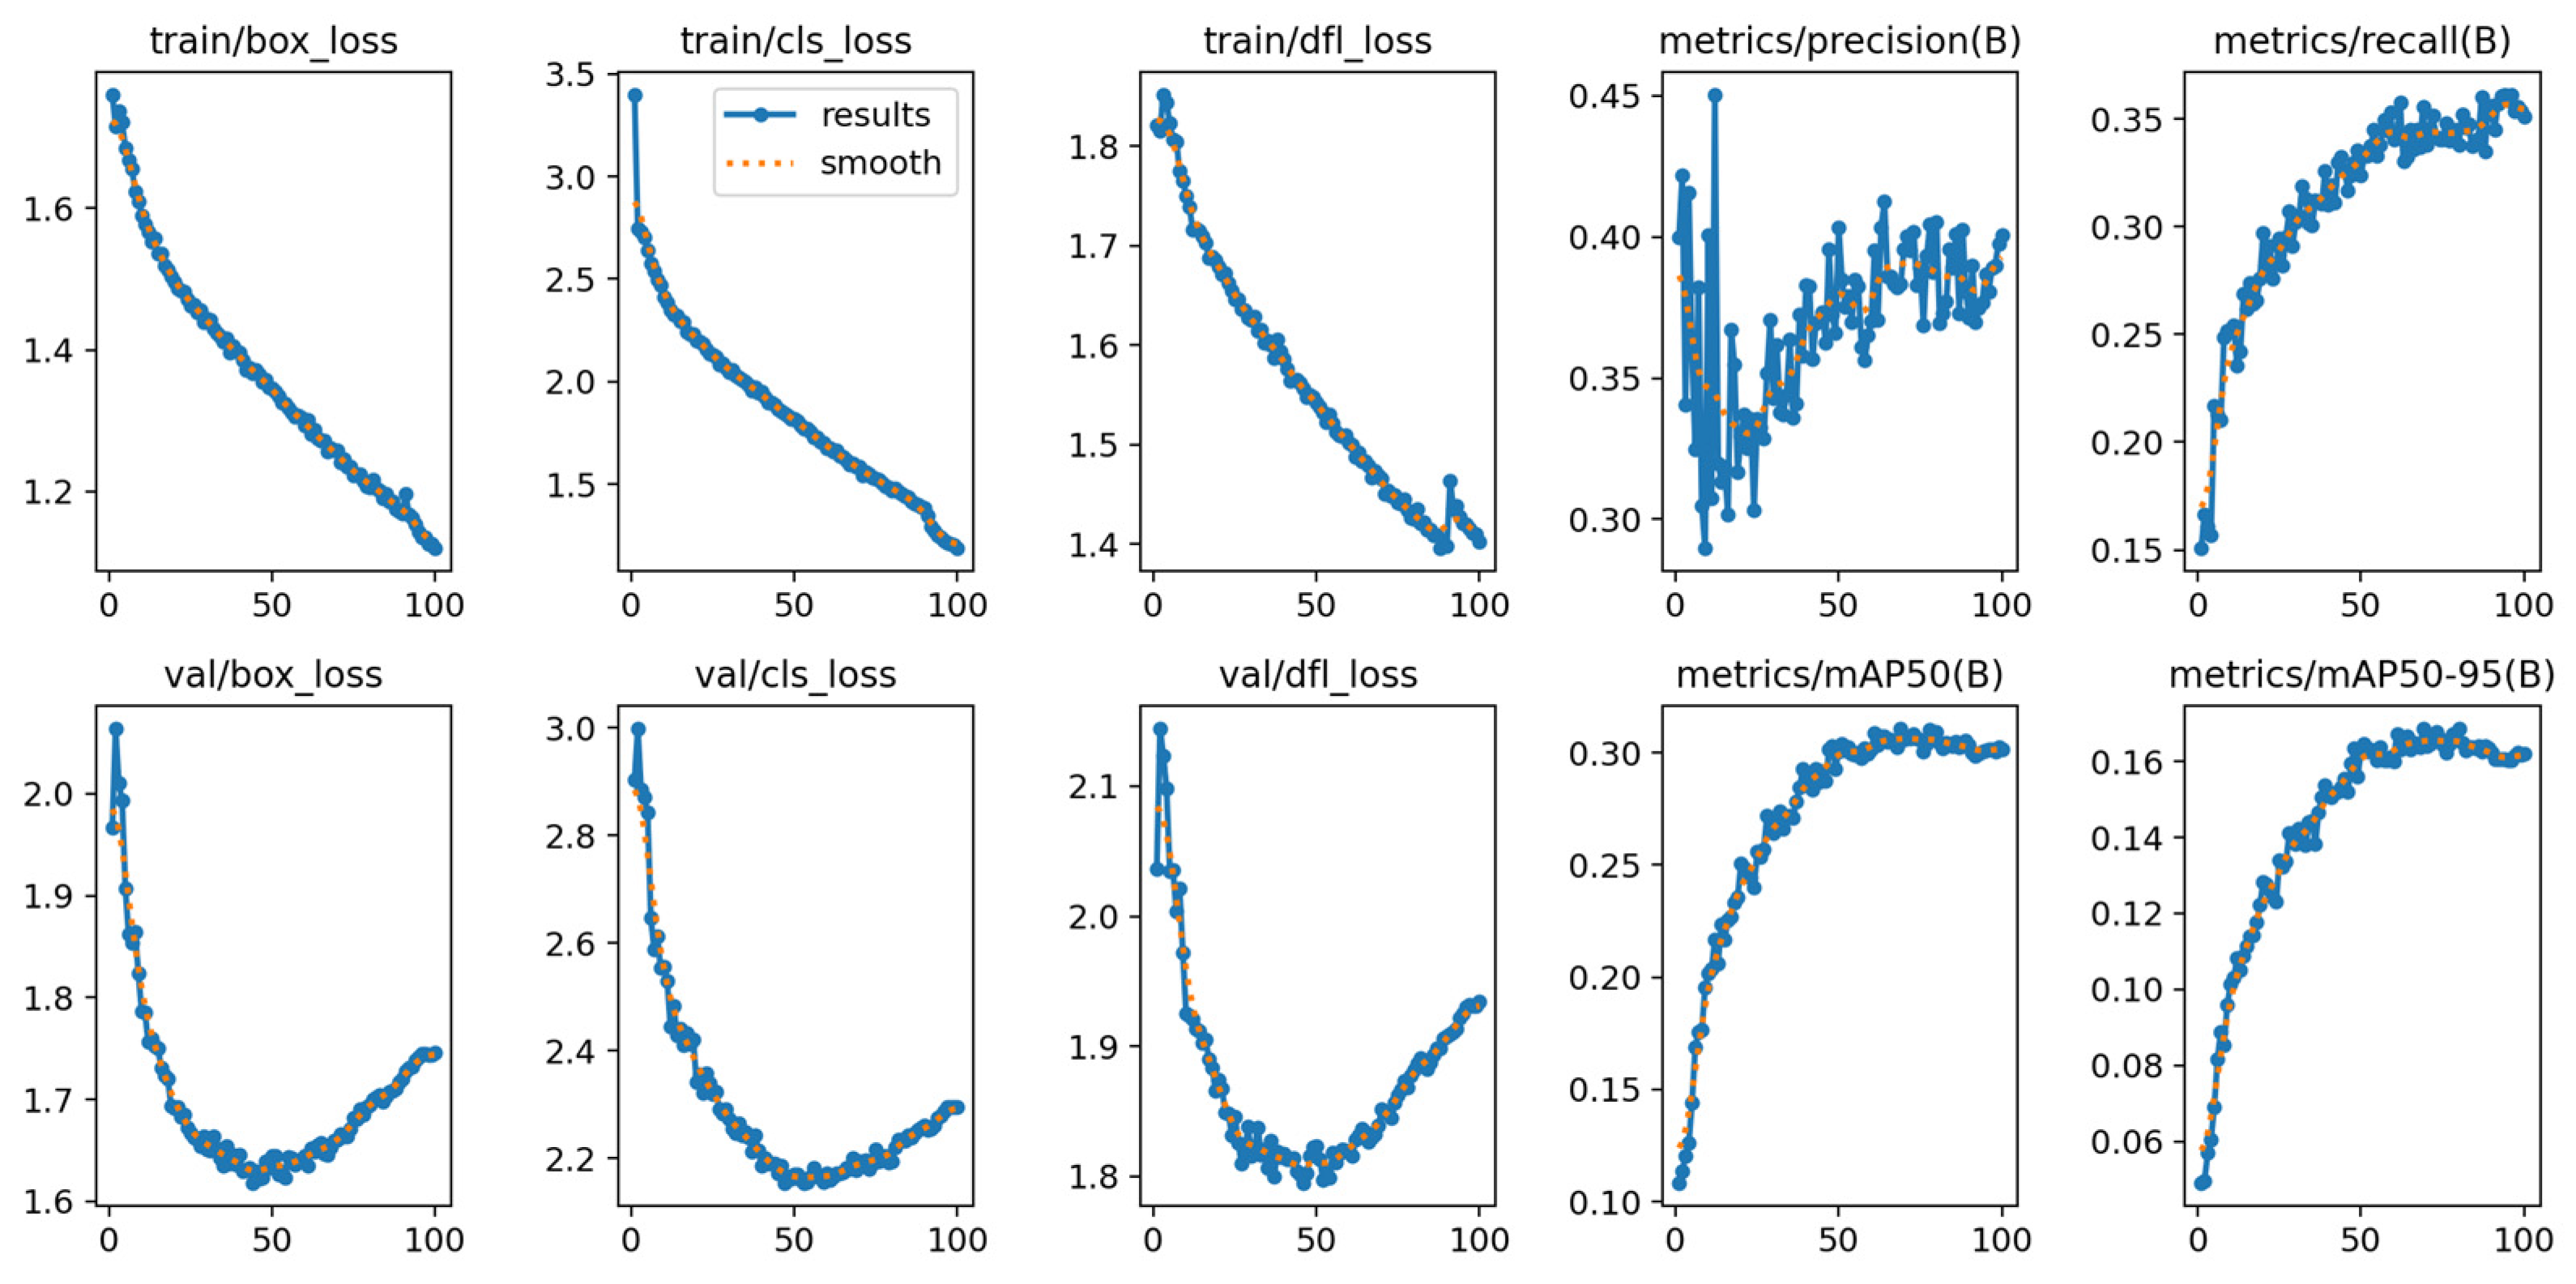
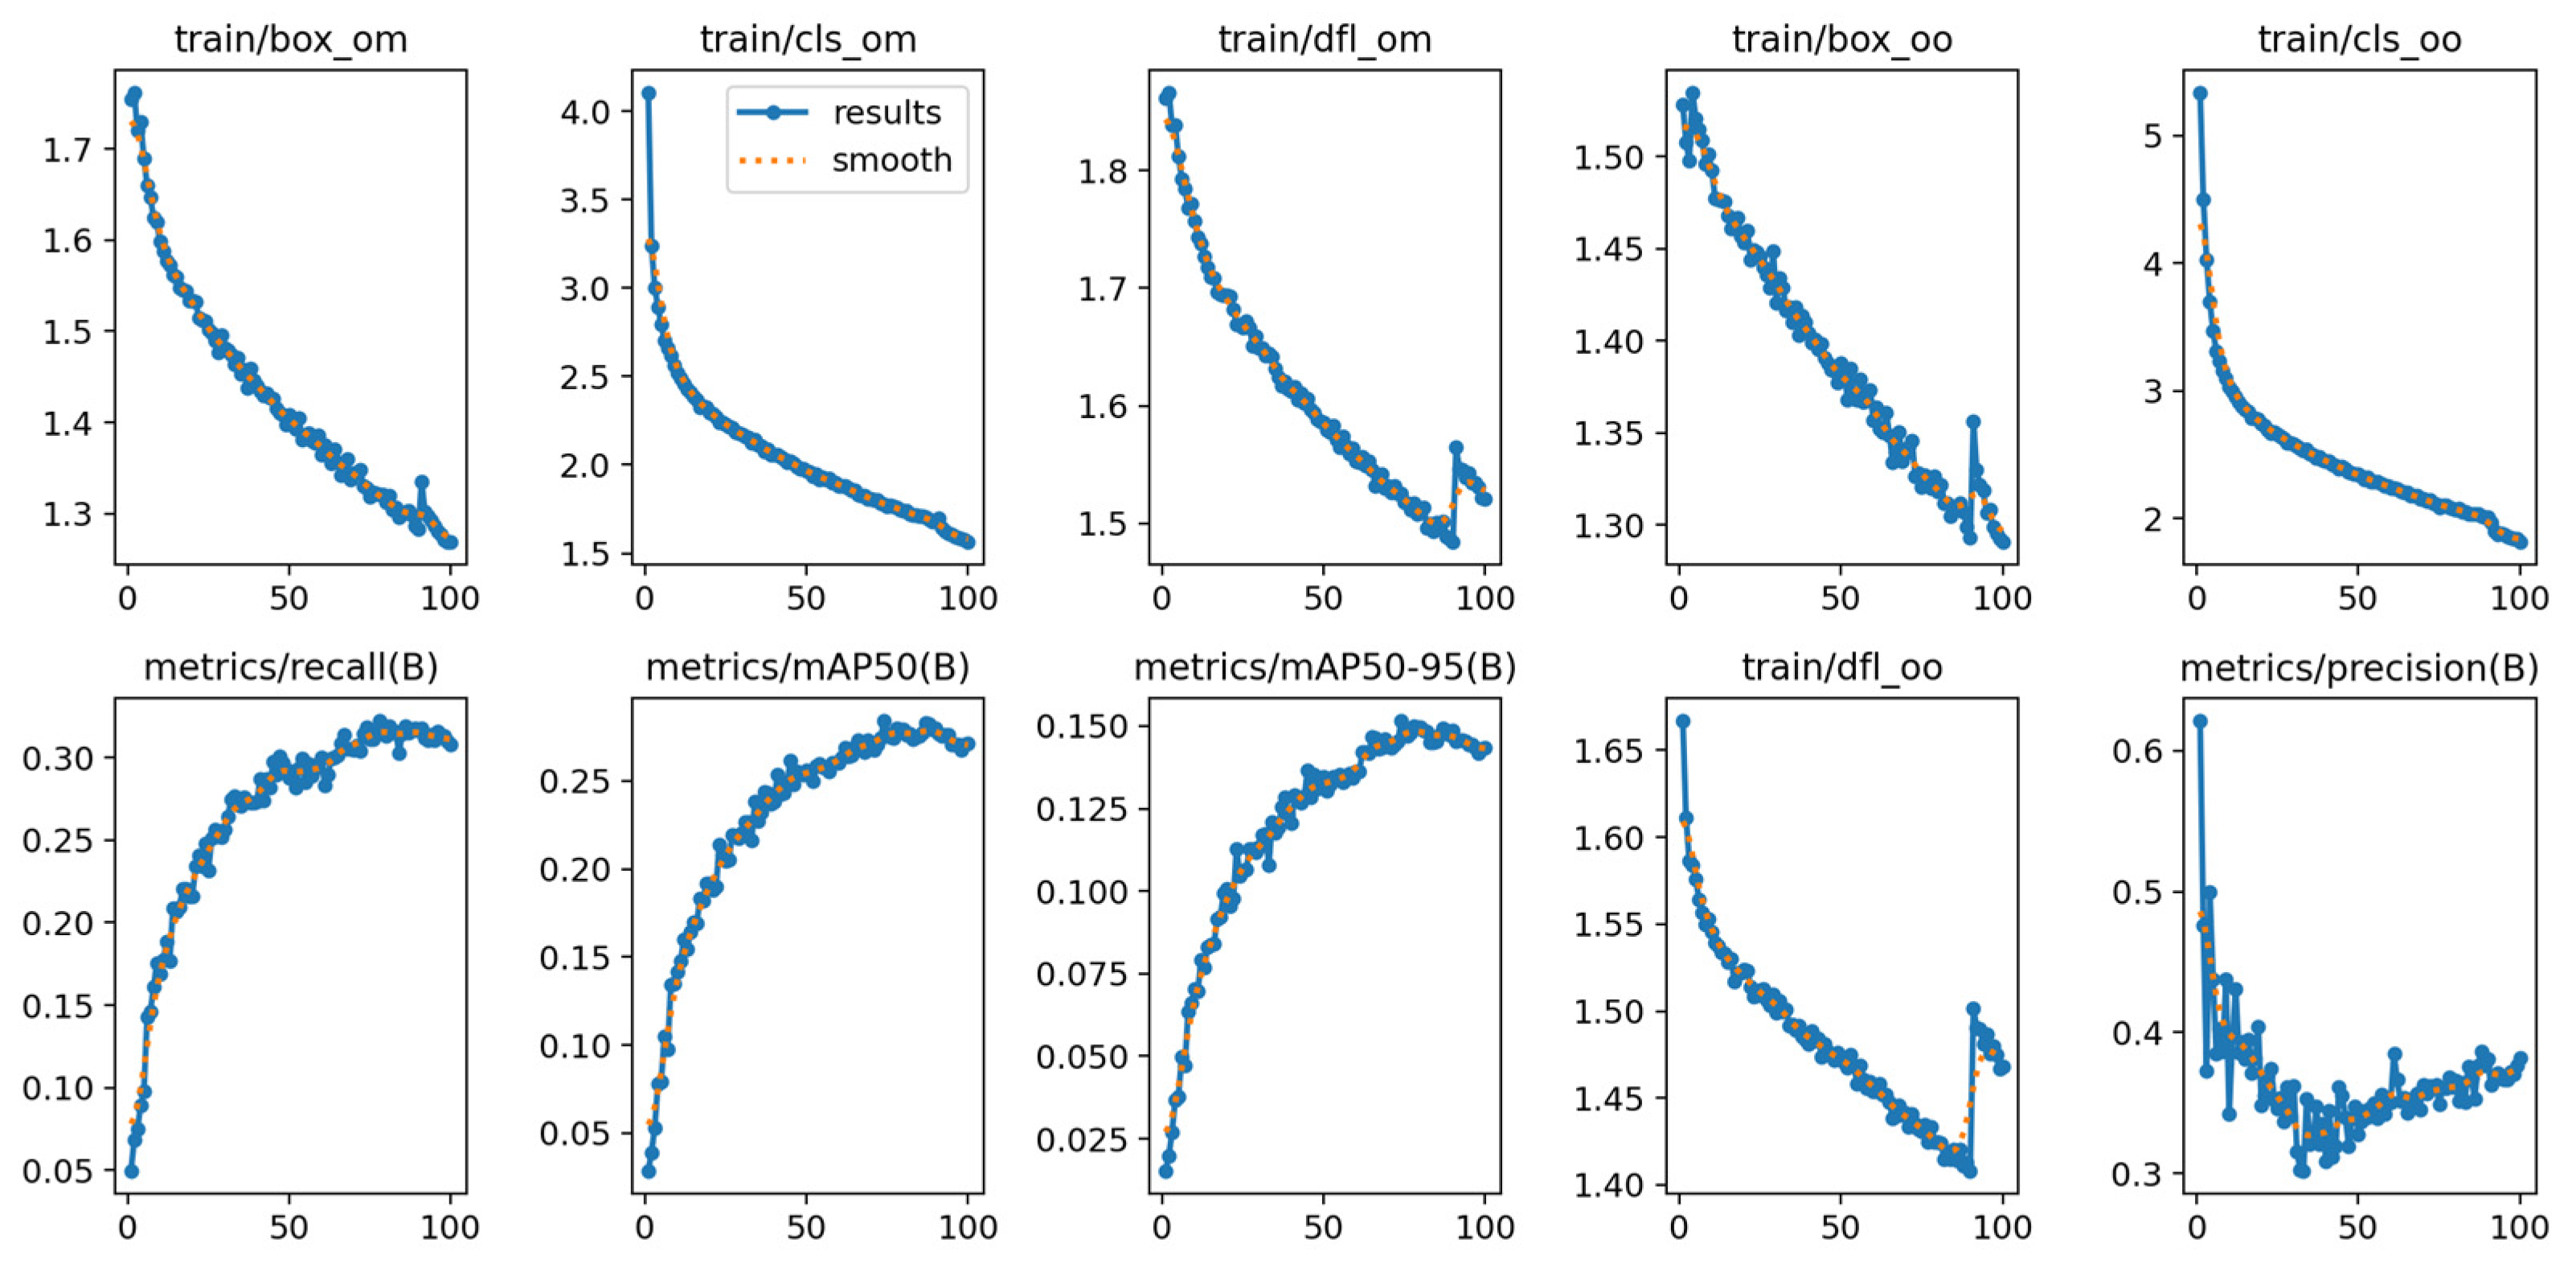
4.2. Model Evaluation

The model evaluation exhibited promising performance in the trained YOLOv11 model for the proposed infrastructure fault detection. Table 3 represents the model parameters. The model evaluation was implemented on a Python 3.8 platform with CUDA 12.0 and NVIDIA-SMI 525.85.12, utilizing a Google collab T4 plan with system ram 12.7 GB, GPU Ram 15.0 GB and Disk 112.6 GB. The model, consisting of 319 layers and 9,435,532 parameters, demonstrated efficient computation, achieving a GFLOPs value of 10.79. The model’s effectiveness in detecting faults in infrastructure is enhanced by the evaluation process encompassed with various metrics.

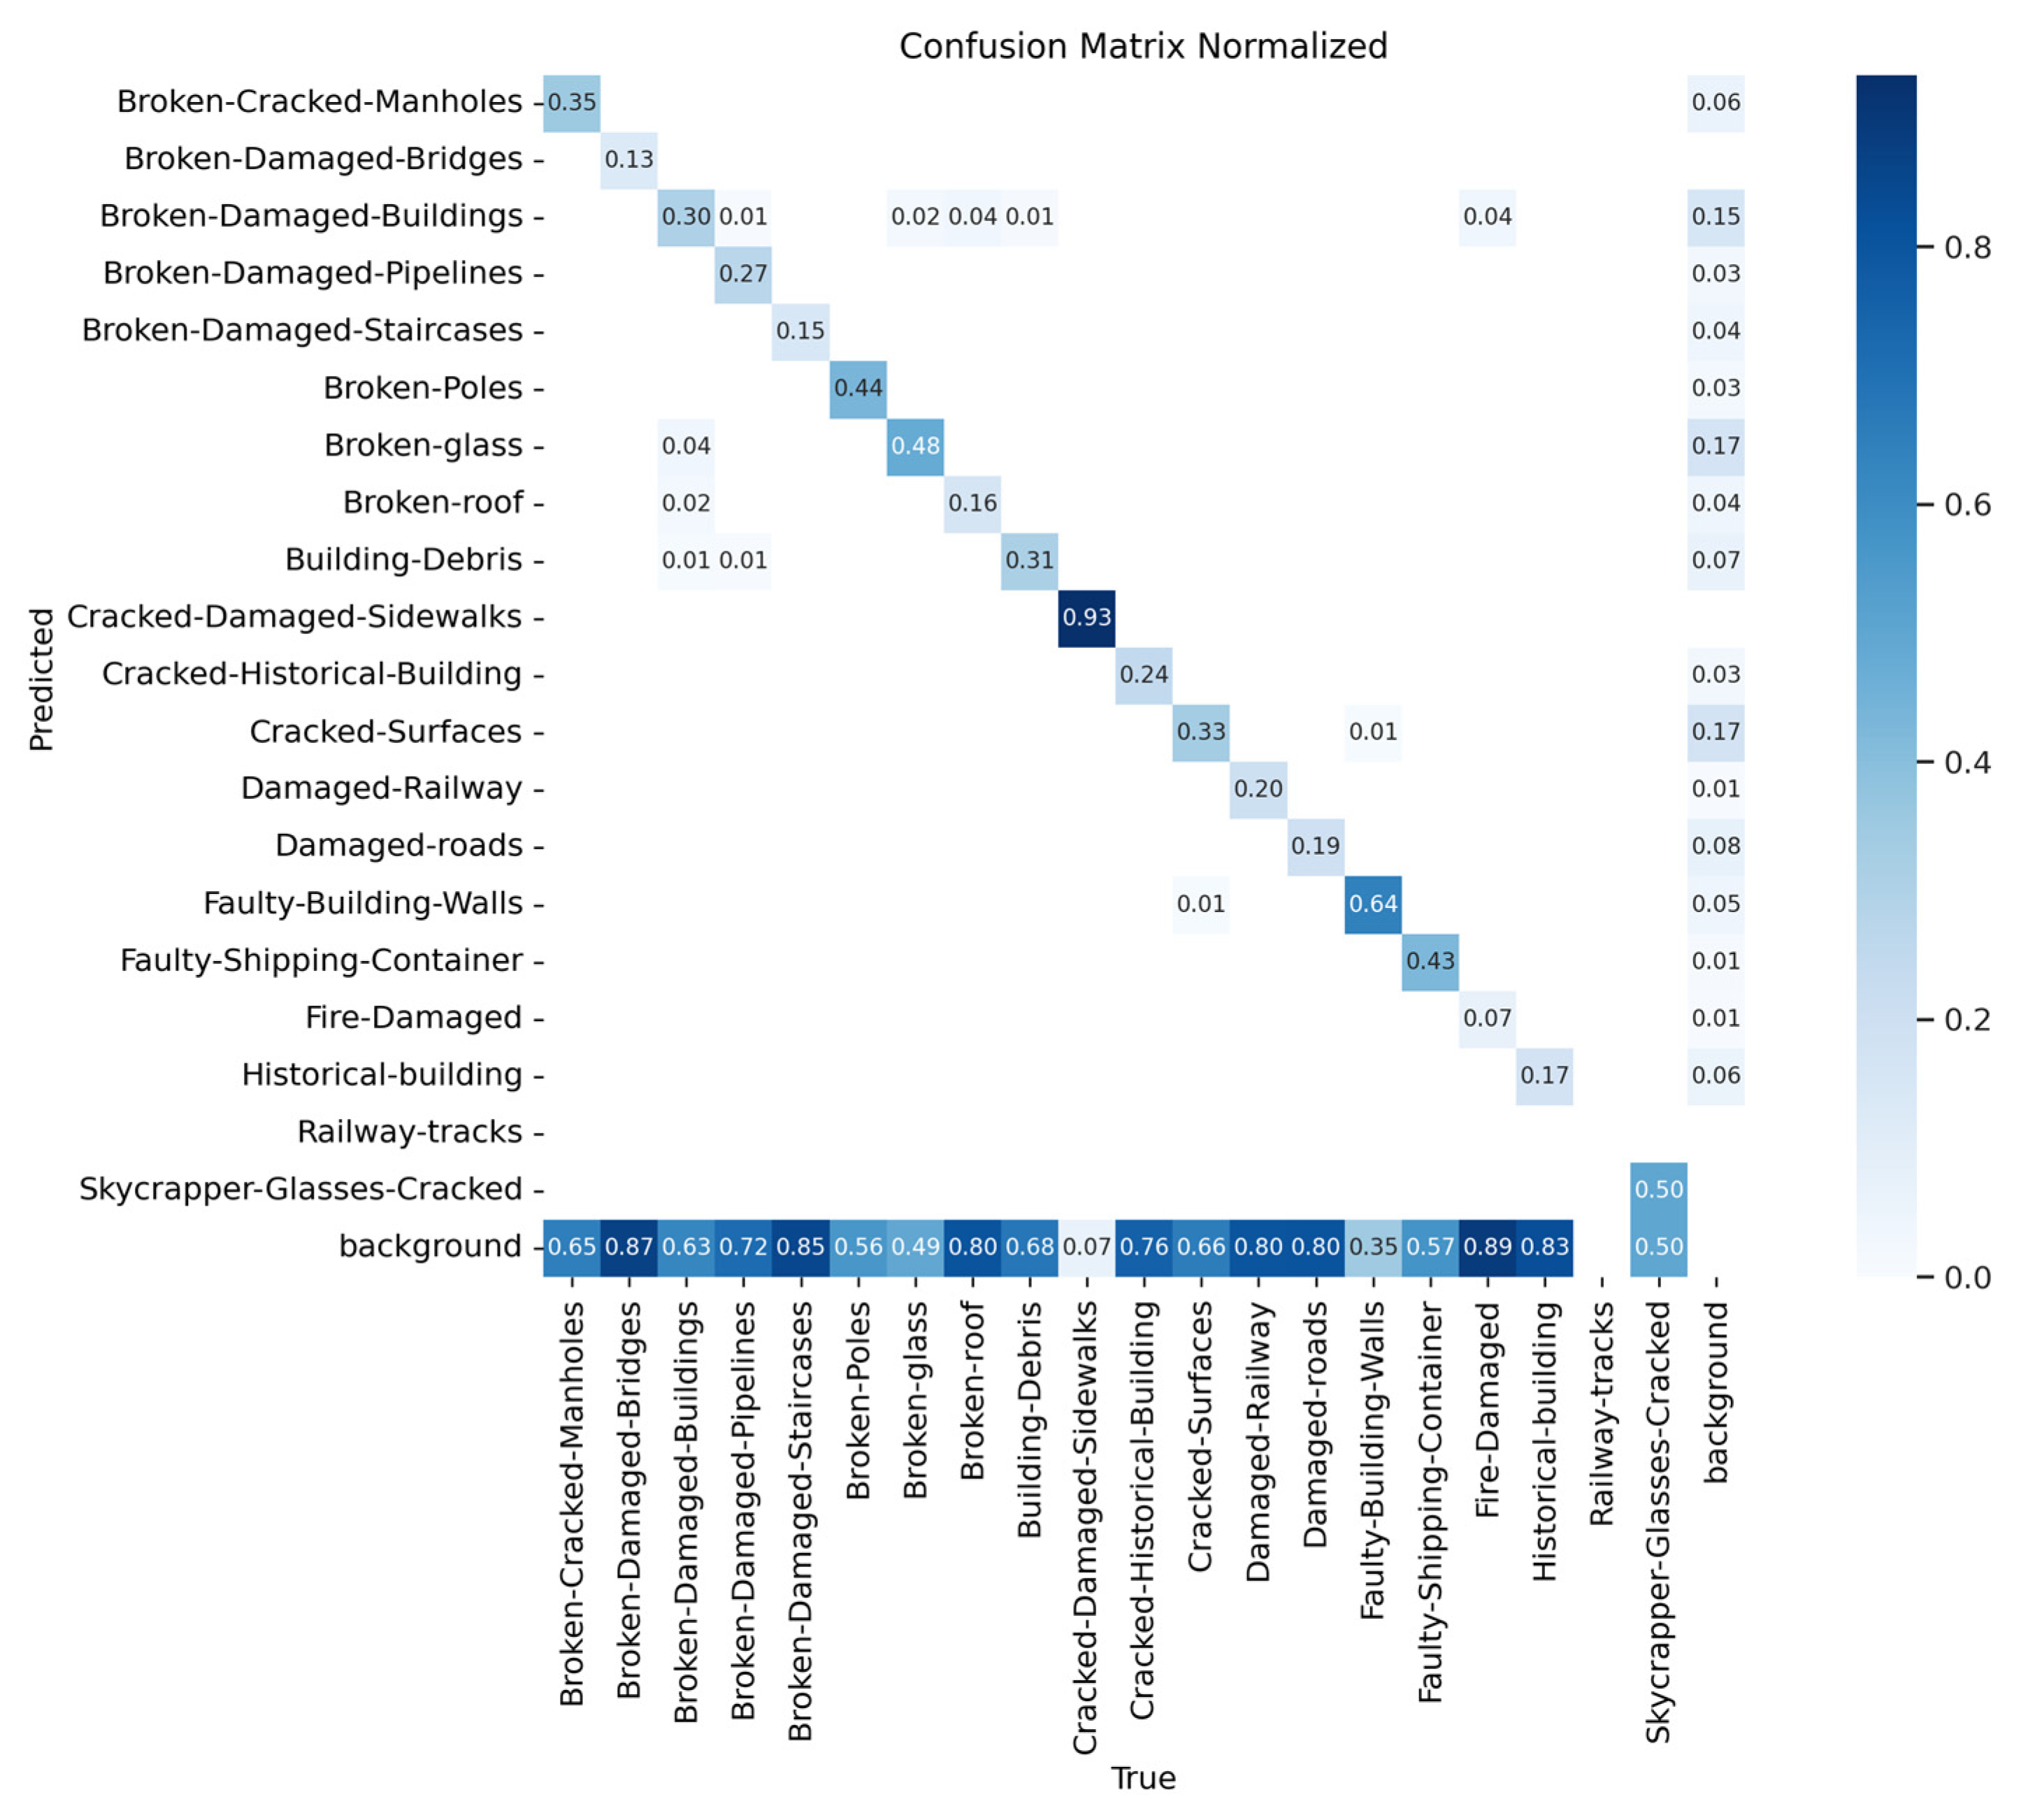
4.3. Analysis of Results

We use image analysis to detect visible structural problems without explicitly modeling the deterioration process. The method is intended to complement current inspection techniques instead of replacing predictive maintenance models. We recognize the value of incorporating deterioration insights to enhance accuracy and intend to explore this in future research.
The YOLOv11-based training graphs are displayed alongside YOLOv10 and YOLOv12 graphs in Figure 7, Figure 8 and Figure 9, showing that the best results are obtained at training step 99 for the proposed scheme. Thus, the decision to train for 100 epochs is based on the observed performance, the early stopping mechanism, and the best results found in 99 iterations. Furthermore, the proposed YOLOv11 exhibits a recall of 35%, a precision value of 39%, and a mAP of 30% when trained with 100 epochs.
With our own dataset, the proposed YOLOv11-based model object detection is tested and compared with other models such as YOLOv8, YOLOv9, YOLOv10, and YOLOv12. The YOLOv11 model is proposed because of its better parameter results, which are relatively good compared to the rest. Table 4 provides the details of different models’ performances for all classes with different iteration steps. The detector evaluates performance by tracking the mAP@0.5 (mean average precision) during the training phase when it learns on the validation set. Here, a greater value indicates better learning. Then, the F1 score is calculated from the equation
F 1 score = ( 2 × P r e c i s i o n × R e c a l l ) ( P r e c i s i o n + R e c a l l )
The YOLOv11-based model shows superior accuracy in both the F1score and mAP@0.5, with 37% and 30%, respectively. Table 4 displays the model complexities for all models. The precision, recall, mAP@0.5, and F1score is quite lower than standard benchmarks due to the complexities inherent in disaster-related imagery. In such scenarios, various types of infrastructure defects can appear within a single image, requiring multiple class annotations. Our dataset includes numerous examples where multiple defects are present in a single image or where the image is heavily zoomed in or blurred out, necessitating annotation of the entire image as damaged/defective. Thus, this results in significantly lower metrics values. On the contrary, the results of the proposed YOLOv11 are relatively higher than those of other models, which are displayed in Table 4. The YOLOv11 model is the most generalization-capable among all models due to its high number of trainable parameters.
Additionally, the accuracy of prediction is quite high in the confusion matrix diagram that is presented in Figure 10 for 100 epochs. The confusion matrix has rows and columns where a row represents an actual class, and columns represent a predicted class. The Cracked-Damaged-Sidewalks class holds the highest prediction accuracy, which is 93%. On the other hand, the Fire-Damaged class has a 7% prediction accuracy, which is the lowest of the bunch. Thus, the YOLOv11-based model shows greater results with 100 epochs, showcasing its ability to detect real-time faults in infrastructure and other civil structures. On the other hand, the normalized version of the confusion matrix has been shown in Figure 11.

4.4. Visualization

The model training is performed for a total of 100 epochs. An epoch denotes a complete iteration through the entire training dataset. During the training process, the model’s parameters are simultaneously updated based on the calculated loss and gradients. The model training process is concluded in just about 4.925 h. These parameters may differ depending on the computational resources and hardware that are used for training. Figure 12 shows a single class detected for some random data. Additionally, Figure 13 shows sample images detected based on the proposed YOLOv11 model for multiple classes in one frame.
The individual detection accuracies for YOLOv11, YOLOv8, YOLOv9, YOLOv10, and YOLOv12 in 100 training steps are shown, respectively, in Figure 14, considering all the classes. In the case of the Broken-Cracked-Manholes class, the detection accuracies are 35%, 32%, 28%, 28%, 28%, and 18% for the YOLOv11, YOLOv8, YOLOv9, YOLOv10, and YOLOv12 models, respectively. Similarly, for the Broken-Damaged-Bridges class, the detection accuracies are 13%, 11%, 7%,4%, 4%, and 0%. For the Broken-Damaged-Buildings class, they are 30%, 27%, 22%, 23%, 23%, and 20%. For the Broken Damaged Pipelines class, they are 27%, 24%, 19%, 19%, 9%, and 8%. For Broken-Damaged-Staircases, they are 15%,15%, 9%, 5%, 5%, and 3%. For Broken-Poles, they are 44%, 41%, 40%, 40%, 40%, and 26%. For Broken glass, they are 48%, 49%, 49%, 42%, 42%, and 50%. For Broken roof, they are 16%, 15%, 13%, 7%, 7%, and 6%. For Building-Debris, they are 31%, 31%, 25%, 26%, 26%, 26%, and 27%. For the Cracked-Damaged-Sidewalks, they are 93%, 97%, 93%, 88%, 88%, and 75%. For the Cracked-Historical-Building, they are 24%, 19%, 23%, 19%, 19%, 19%, and 18%. For the Cracked-Surfaces, they are 33%, 36%, 21%, 22%, 22%, and 13%. For the Damaged-Railway, they are 20%, 22%, 15%, 15%, 15%, 15%, and 6%. For the Damaged roads, they are 19%, 19%, 14%, 15%, 15%, and 10%. For the Faulty Building-Walls, they are 64%, 62%, 54%, 52%, 52%, and 40%. For the Faulty-Shipping-Container, they are 43%, 45%, 29%, 26%, 26%, 26%, and 13%. For the Fire-Damaged, they are 7%, 5%, 4%, 4%, 4%, and 1%. For the Historical building, they are 17%, 29%, 11%, 9%, 9%, and 4%. Finally, for the Skyscraper-Glasses-Cracked, they are 50%, 61%, 61%, 58%, 58%, and 34%. Thus, for all classes, in most cases, the detection accuracy is higher in the proposed YOLOv11-based infrastructure fault detection model compared to the other YOLOv8, YOLOv9, YOLOv10, and YOLOv12 models.

5. Conclusions

In this study, the YOLOv11 model is proposed for detecting infrastructure faults in diverse environments. The absence of an explicit deterioration model is one of the limitations of our approach. Our method can identify visual defects successfully, but incorporating engineering knowledge on infrastructure aging could lead to better long-term predictive performance. Future research may use historical degradation data or physics-based models to enhance robustness. GANs and diffusion models, among other generative AI techniques, can be used to synthesize high-quality training data, which could enhance fault detection models, especially in scenarios wherein real-world labeled data are scarce. Furthermore, Causal AI can help analyze not just correlations but also the underlying causes of structural faults, enabling more interpretable and reliable predictions
This work focuses on improving the efficiency and reliability of automated fault detection systems by accurately identifying and classifying various types of infrastructure defects across diverse environments. A custom dataset with 9116 images was created, covering a diverse range of fault types and environmental conditions. This dataset strengthens the model’s generalizability compared to previous studies. The custom dataset was pre-processed using annotation techniques and data augmentation methods to improve the model’s performance and robustness across varying environments. Each image was resized and annotated meticulously to ensure high-quality input for the model. The YOLOv11 model was trained for 100 epochs, achieving impressive results with a recall of 35%, precision of 39%, an F1score of 37%, and mean average precision (mAP) of 30%. The detection results show that the YOLOv11 model works better than other baseline algorithms (YOLOv8, YOLOv9, and YOLOv10). The findings highlight the model’s robustness and efficiency in detecting various fault types in infrastructure, providing a reliable tool for real-time infrastructure fault detection across various applications. The research contributes to the advancement of automated detection techniques, offering the potential for practical deployment in infrastructure maintenance and safety monitoring.
This study is limited by the dataset, which includes only 21 structural faults, and may not cover all possible real-world fault scenarios. Variations in image quality, multiple classes in a single image, lighting, and complex backgrounds could also impact model performance. Future work will focus on expanding the dataset to include more diverse fault types and improving the model’s adaptability to various real-world conditions. We acknowledge that, despite the exploration of a 2D image-based approach as a tool for infrastructure assessment, it cannot completely replace manual visual inspections at this time. The effectiveness of manual inspections lies in their ability to provide spatial context, depth perception, and evaluate subtle or hidden defects that 2D images may not be able to capture. To obtain high-quality photographs for analysis, it often requires the same level of access and effort as manual inspection. The limitation indicates that our current method is intended to be a complementary tool rather than a complete replacement for manual inspection. More advanced imaging technologies—such as photogrammetry, LiDAR, or other adaptive 3D imaging methods—can provide advanced spatial information and potentially improve the accuracy and reliability of automated defect detection systems in the future. Additionally, integrating multi-modal data could enhance detection accuracy and reliability in challenging environments.

Author Contributions

Conceptualization, R.Z.R., K.F.B., and S.R.; methodology, R.Z.R. and S.R.; software, R.Z.R. and M.R.; validation, R.Z.R., M.R., and S.R.; formal analysis, S.R., J.U., and F.A.F.; investigation, S.R. and J.U.; resources, S.R.; data curation, R.Z.R. and M.R.; writing—original draft preparation, R.Z.R., M.R., and K.F.B.; writing—review and editing, S.R., J.U., F.A.F., and H.A.K.; visualization, R.Z.R., M.R., K.F.B., S.R., J.U., and F.A.F.; supervision, S.R.; project administration, S.R. and H.A.K.; funding acquisition, H.A.K. All authors have read and agreed to the published version of the manuscript.

Funding

This research was funded by Multimedia University, Cyberjaya, Selangor, Malaysia (Grant Number: PostDoc (MMUI/240029)).

Data Availability Statement

The data presented in this study are available upon request from the corresponding author due to future publication purposes.

Conflicts of Interest

The authors declare no conflicts of interest.

References

  1. Wolniak, R.; Stecuła, K. Artificial Intelligence in Smart Cities—Applications, Barriers, and Future Directions: A Review. Smart Cities 2024, 7, 1346–1389. [Google Scholar] [CrossRef]
  2. Vogiatzaki, M.; Zerefos, S.; Hoque Tania, M. Enhancing city sustainability through smart technologies: A framework for automatic pre-emptive action to promote safety and security using lighting and ICT-based surveillance. Sustainability 2020, 12, 6142. [Google Scholar] [CrossRef]
  3. Alahi, M.E.E.; Sukkuea, A.; Tina, F.W.; Nag, A.; Kurdthongmee, W.; Suwannarat, K.; Mukhopadhyay, S.C. Integration of IoT-enabled technologies and artificial intelligence (AI) for smart city scenario: Recent advancements and future trends. Sensors 2023, 23, 5206. [Google Scholar] [CrossRef]
  4. Teng, S.; Liu, Z.; Li, X. Improved YOLOV3-Based Bridge Surface Defect Detection by Combining High- and Low-Resolution Feature Images. Buildings 2022, 12, 1225. [Google Scholar] [CrossRef]
  5. Guruvu, A.; Sree, K.B.; Sai, V.O.; Sri, T.K.; Sri, M.B. Railway Track Crack Detection with YOLOv5 and Geospatial Localization. Int. J. Creat. Res. Thoughts 2024, 12, 1928–1933. [Google Scholar]
  6. Akyürek, H.A.; Kozan, H.İ.; Taşdemir, Ş. Surface Crack Detection in Historical Buildings with Deep Learning-Based YOLO Algorithms: A Comparative Study. Comput. Res. Prog. Appl. Sci. Eng. 2024, 10, 1–14. [Google Scholar] [CrossRef]
  7. Wei, G.; Wan, F.; Zhou, W.; Xu, C.; Ye, Z.; Liu, W.; Lei, G.; Xu, L. BFD-YOLO: A YOLOv7-Based Detection Method for Building Façade Defects. Electronics 2023, 12, 3612. [Google Scholar] [CrossRef]
  8. Michael, G.; Shahra, E.Q.; Basurra, S.; Wu, W.; Jabbar, W.A. Real-Time Pipeline Fault Detection in Water Distribution Networks Using You Only Look Once v8. Sensors 2024, 24, 6982. [Google Scholar] [CrossRef]
  9. Wu, Y.; Han, Q.; Jin, Q.; Li, J.; Zhang, Y. LCA-YOLOv8-Seg: An Improved Lightweight YOLOv8-Seg for Real-Time Pixel-Level Crack Detection of Dams and Bridges. Appl. Sci. 2023, 13, 10583. [Google Scholar] [CrossRef]
  10. Li, T.; Li, G. Road Defect Identification and Location Method Based on an Improved ML-YOLO Algorithm. Sensors 2024, 24, 6783. [Google Scholar] [CrossRef]
  11. Rahman, S.; Jamee, S.M.H.; Rafi, J.K.; Juthi, J.S.; Sajib, A.A.; Uddin, J. Real-Time Smoke and Fire Detection Using You Only Look Once v8-Based Advanced Computer Vision and Deep Learning. Int. J. Adv. Appl. Sci. 2024, 13, 987–999. [Google Scholar] [CrossRef]
  12. Ultralytics. YOLOv11: You Only Look Once. Available online: https://github.com/ultralytics/ultralytics (accessed on 10 December 2024).
  13. Abdelkader, E.M.; Zayed, T.; Faris, N. Synthesized Evaluation of Reinforced Concrete Bridge Defects, Their Non-Destructive Inspection, and Analysis Methods: A Systematic Review and Bibliometric Analysis of the Past Three Decades. Buildings 2023, 13, 800. [Google Scholar] [CrossRef]
  14. Li, Y.; Wang, H.; Dang, L.M.; Song, H.-K.; Moon, H. Vision-Based Defect Inspection and Condition Assessment for Sewer Pipes: A Comprehensive Survey. Sensors 2022, 22, 2722. [Google Scholar] [CrossRef]
  15. Kim, J.W.; Choi, H.W.; Kim, S.K.; Na, W.S. Review of Image-Processing-Based Technology for Structural Health Monitoring of Civil Infrastructures. J. Imaging 2024, 10, 93. [Google Scholar] [CrossRef]
  16. Khan, M.A.M.; Kee, S.H.; Pathan, A.S.K.; Nahid, A.A. Image Processing Techniques for Concrete Crack Detection: A Scientometrics Literature Review. Remote Sens. 2023, 15, 2400. [Google Scholar] [CrossRef]
  17. Ranyal, E.; Sadhu, A.; Jain, K. Road Condition Monitoring Using Smart Sensing and Artificial Intelligence: A Review. Sensors 2022, 22, 3044. [Google Scholar] [CrossRef] [PubMed]
  18. Wang, L.; Tang, C. Effective Small Crack Detection Based on Tunnel Crack Characteristics and an Anchor-Free Convolutional Neural Network. Sci. Rep. 2024, 14, 8361. [Google Scholar] [CrossRef]
  19. Hoang, N.D.; Huynh, T.C.; Tran, X.L.; Tran, V.D. A Novel Approach for Detection of Pavement Crack and Sealed Crack Using Image Processing and Salp Swarm Algorithm Optimized Machine Learning. Adv. Civ. Eng. 2022, 2022, 9193511. [Google Scholar] [CrossRef]
  20. Chun, P.; Izumi, S.; Yamane, T. Automatic Detection Method of Cracks from Concrete Surface Imagery Using Two-Step Light Gradient Boosting Machine. Comput. Aided Civ. Infrastruct. Eng. 2020, 36, 61–72. [Google Scholar] [CrossRef]
  21. Munawar, H.; Ullah, F.; Shahzad, D.; Heravi, A.; Qayyum, S.; Akram, J. Civil Infrastructure Damage and Corrosion Detection: An Application of Machine Learning. Buildings 2022, 12, 156. [Google Scholar] [CrossRef]
  22. Luo, C.; Yu, L.; Yan, J.; Li, Z.; Ren, P.; Bai, X.; Yang, E.; Liu, Y. Autonomous Detection of Damage to Multiple Steel Surfaces from 360° Panoramas Using Deep Neural Networks. Comput. Aided Civ. Infrastruct. Eng. 2021, 36, 1585–1599. [Google Scholar] [CrossRef]
  23. Bai, T.; Gao, J.; Yang, J.; Yao, D. A Study on Railway Surface Defects Detection Based on Machine Vision. Entropy 2021, 23, 1437. [Google Scholar] [CrossRef]
  24. Roy, Y.; Cajas, A.; Yenmy, Z.; Afredo, D. Identify Faults in Road Structure Zones with Deep Learning. J. Syst. Manag. Sci. 2022, 12, 163–191. [Google Scholar] [CrossRef]
  25. Mohanty, N.S. Empowering Structural Integrity: YOLO-Based Crack Detection and ML-Driven Concrete Strength Prediction of Critical Infrastructure Caused Due to Mining Operation. J. Electr. Syst. 2024, 20, 2705–2721. [Google Scholar] [CrossRef]
  26. Li, Y.; Bao, T. A Real-Time Multi-Defect Automatic Identification Framework for Concrete Dams via Improved YOLOv5 and Knowledge Distillation. J. Civ. Struct. Health Monit. 2023, 13, 1333–1349. [Google Scholar] [CrossRef]
  27. Fan, J.; Wang, M.; Li, B.; Liu, M.; Shen, D. ACD-YOLO: Improved YOLOv5-Based Method for Steel Surface Defects Detection. IET Image Process 2023, 18, 761–771. [Google Scholar] [CrossRef]
  28. Wei, X.; Wei, D.; Suo, D.; Jia, L.; Li, Y. Multi-Target Defect Identification for Railway Track Line Based on Image Processing and Improved YOLOV3 Model. IEEE Access 2020, 8, 61973–61988. [Google Scholar] [CrossRef]
  29. Guo, G.; Zhang, Z. Road Damage Detection Algorithm for Improved YOLOv5. Sci. Rep. 2022, 12, 15523. [Google Scholar] [CrossRef]
  30. Xu, W.; Li, X.; Ji, Y.; Li, S.; Cui, C. BD-YOLOv8s: Enhancing Bridge Defect Detection with Multidimensional Attention and Precision Reconstruction. Sci. Rep. 2024, 14, 69722. [Google Scholar] [CrossRef]
  31. Wang, T.; Li, Y.; Zhai, Y.; Wang, W.; Huang, R. A Sewer Pipeline Defect Detection Method Based on Improved YOLOv5. Processes 2023, 11, 2508. [Google Scholar] [CrossRef]
  32. Rahman, S.; Rony, J.H.; Uddin, J.; Samad, M.A. Real-Time Obstacle Detection with YOLOv8 in a WSN Using UAV Aerial Photography. J. Imaging 2023, 9, 216. [Google Scholar] [CrossRef]
  33. Salehin, S.; Rahman, S.; Nur, M.; Asif, A.; Harun, M.B.; Uddin, J. A Deep Learning Model for YOLOv9-Based Human Abnormal Activity Detection: Violence and Non-Violence Classification. Iran. J. Electr. Electron. Eng. 2024, 20, 3433–3438. [Google Scholar] [CrossRef]
Figure 1. Sample dataset.
Futureinternet 17 00187 g001
Figure 2. Sample data augmentation case 1.
Futureinternet 17 00187 g002
Figure 3. Sample data augmentation case 2.
Futureinternet 17 00187 g003
Figure 4. Sample labeled data.
Futureinternet 17 00187 g004
Figure 5. Data pre-processing.
Futureinternet 17 00187 g005
Figure 6. Proposed YOLOv11-based architecture.
Futureinternet 17 00187 g006
Figure 7. YOLOv11-based training results graph with 100 epochs.
Futureinternet 17 00187 g007
Figure 8. YOLOv12-based training results graph with 100 epochs.
Futureinternet 17 00187 g008
Figure 9. YOLOv10-based training results graph with 100 epochs.
Futureinternet 17 00187 g009
Figure 10. YOLOv11 confusion matrix for 100 epochs.
Futureinternet 17 00187 g010
Figure 11. YOLOv11 confusion matrix normalized for 100 epochs.
Futureinternet 17 00187 g011
Figure 12. Testing performance of random data for the proposed YOLOv11 model.
Futureinternet 17 00187 g012
Figure 13. Examples of detection of multiple classes in one frame using the YOLOv11 model.
Futureinternet 17 00187 g013
Figure 14. Sample predicted images.
Futureinternet 17 00187 g014
Table 1. Dataset statistics.
Types of InfrastructureQuantity Total Data
Bridge949116
Building Walls900
Cracked Surface900
Pothole/Damaged Road400
Damaged Building (Broken Glass, Broken Roof, Building Debris, Fire Damaged)3935
Historical Building Crack350
Historical Building300
Manhole300
Pipeline197
Pole690
Railway Track150
Shipping Container200
Sidewalk300
Skyscraper100
Staircase300
Table 2. Parameter used for the YOLOv11-based object detection model.
ParametersValue
Batch size16
Number of epochs100
Optimizerauto
Pre-trainedCOCO Model
Pre-trained0.01
Weight decay0.0005
Patience100
Table 3. Model parameters.
ParametersValue
Batch size319
Model parameters9,435,532
Gradients9,435,532
GFLOPs10.79
Table 4. Testing performance of YOLOv11, YOLOv8, YOLOv9, YOLOv10, and YOLOv12.
ModelEpochClassTrainable
Parameters
F1scoremAP@0.5
Proposed
YOLOv11
100All9.46 M0.370.30
Proposed
YOLOv11
50All9.46 M0.350.29
YOLOv8 [32]100All11.17 M0.350.28
YOLOv8 [32]50All11.17 M0.350.28
YOLOv9 [33]100All1.98 M0.320.27
YOLOv9 [33]50All1.98 M0.330.29
YOLOv10 [33]100All2.73 M0.310.26
YOLOv10 [33]50All2.73 M0.340.27
YOLOv12100All2.58 M0.300.21
YOLOv1250All2.58 M0.250.16
Disclaimer/Publisher’s Note: The statements, opinions and data contained in all publications are solely those of the individual author(s) and contributor(s) and not of MDPI and/or the editor(s). MDPI and/or the editor(s) disclaim responsibility for any injury to people or property resulting from any ideas, methods, instructions or products referred to in the content.

